Embed Size (px)
Citation preview

Nutrients 2014, 6, 1886-1898; doi:10.3390/nu6051886
nutrients ISSN 2072-6643
www.mdpi.com/journal/nutrients
Article
Influence of Posture and Frequency Modes in Total Body Water Estimation Using Bioelectrical Impedance Spectroscopy in Boys and Adult Males
Masaharu Kagawa 1,2,3,4,*, Connie Wishart 4 and Andrew P. Hills 5
1 Institute of Nutrition Sciences, Kagawa Nutrition University, Saitama 350-0288, Japan 2 National Institute of Public Health, Saitama 351-0197, Japan 3 School of Public Health, Curtin University, Western Australia 6102, Australia 4 Institute of Health and Biomedical Innovation, Queensland University of Technology,
Queensland 4059, Australia; E-Mail: [email protected] 5 Mater Research Institute, the University of Queensland and Griffith Health Institute,
Griffith University, Queensland 4101, Australia; E-Mail: [email protected]
* Author to whom correspondence should be addressed; E-Mail: [email protected];
Tel.: +81-49-281-7743; Fax: +81-49-284-3679.
Received: 21 February 2014; in revised form: 16 April 2014 / Accepted: 26 April 2014 /
Published: 5 May 2014
Abstract: The aim of the study was to examine differences in total body water (TBW)
measured using single-frequency (SF) and multi-frequency (MF) modes of bioelectrical
impedance spectroscopy (BIS) in children and adults measured in different postures using
the deuterium (2H) dilution technique as the reference. Twenty-three boys and 26 adult
males underwent assessment of TBW using the dilution technique and BIS measured in
supine and standing positions using two frequencies of the SF mode (50 kHz and 100 kHz)
and the MF mode. While TBW estimated from the MF mode was comparable,
extra-cellular fluid (ECF) and intra-cellular fluid (ICF) values differed significantly
(p < 0.01) between the different postures in both groups. In addition, while estimated TBW
in adult males using the MF mode was significantly (p < 0.01) greater than the result from
the dilution technique, TBW estimated using the SF mode and prediction equation was
significantly (p < 0.01) lower in boys. Measurement posture may not affect estimation of
TBW in boys and adult males, however, body fluid shifts may still occur. In addition,
technical factors, including selection of prediction equation, may be important when TBW
is estimated from measured impedance.
OPEN ACCESS
Nutrients 2014, 6 1887
Keywords: body fluid; deuterium; dilution technique; impedance technique; prediction
equation; accuracy; technical error
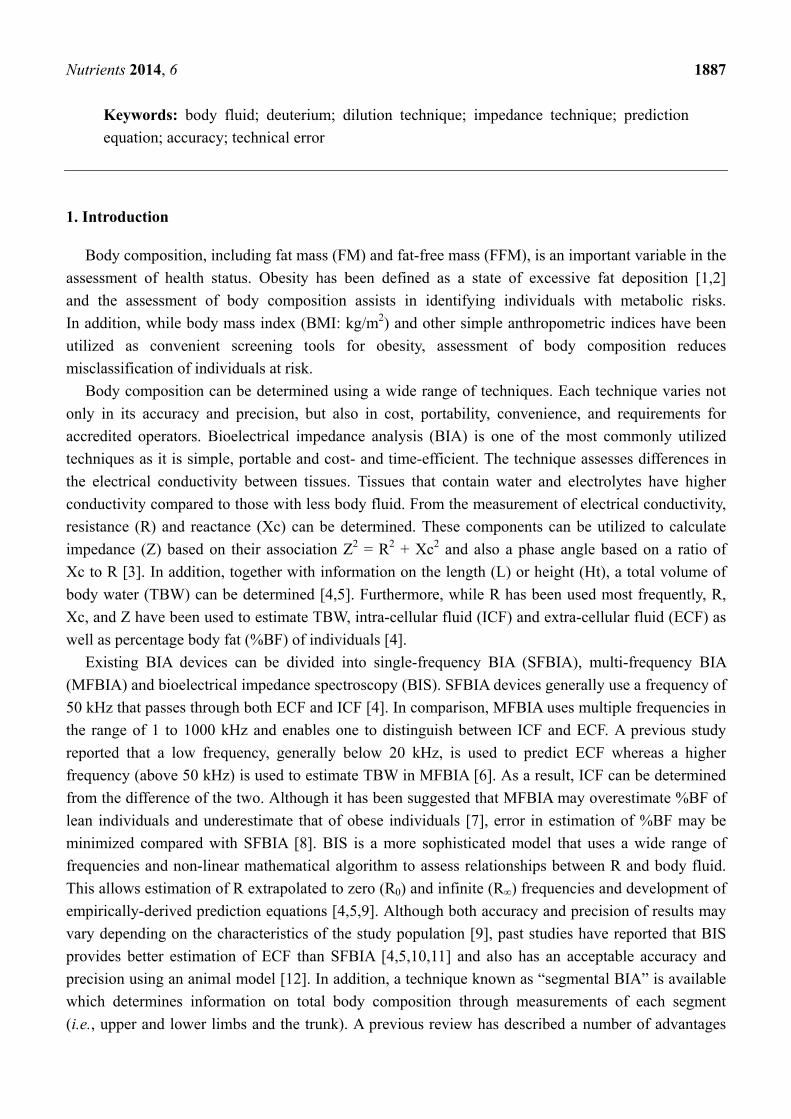
1. Introduction
Body composition, including fat mass (FM) and fat-free mass (FFM), is an important variable in the
assessment of health status. Obesity has been defined as a state of excessive fat deposition [1,2]
and the assessment of body composition assists in identifying individuals with metabolic risks.
In addition, while body mass index (BMI: kg/m2) and other simple anthropometric indices have been
utilized as convenient screening tools for obesity, assessment of body composition reduces
misclassification of individuals at risk.
Body composition can be determined using a wide range of techniques. Each technique varies not
only in its accuracy and precision, but also in cost, portability, convenience, and requirements for
accredited operators. Bioelectrical impedance analysis (BIA) is one of the most commonly utilized
techniques as it is simple, portable and cost- and time-efficient. The technique assesses differences in
the electrical conductivity between tissues. Tissues that contain water and electrolytes have higher
conductivity compared to those with less body fluid. From the measurement of electrical conductivity,
resistance (R) and reactance (Xc) can be determined. These components can be utilized to calculate
impedance (Z) based on their association Z2 = R2 + Xc2 and also a phase angle based on a ratio of
Xc to R [3]. In addition, together with information on the length (L) or height (Ht), a total volume of
body water (TBW) can be determined [4,5]. Furthermore, while R has been used most frequently, R,
Xc, and Z have been used to estimate TBW, intra-cellular fluid (ICF) and extra-cellular fluid (ECF) as
well as percentage body fat (%BF) of individuals [4].
Existing BIA devices can be divided into single-frequency BIA (SFBIA), multi-frequency BIA
(MFBIA) and bioelectrical impedance spectroscopy (BIS). SFBIA devices generally use a frequency of
50 kHz that passes through both ECF and ICF [4]. In comparison, MFBIA uses multiple frequencies in
the range of 1 to 1000 kHz and enables one to distinguish between ICF and ECF. A previous study
reported that a low frequency, generally below 20 kHz, is used to predict ECF whereas a higher
frequency (above 50 kHz) is used to estimate TBW in MFBIA [6]. As a result, ICF can be determined
from the difference of the two. Although it has been suggested that MFBIA may overestimate %BF of
lean individuals and underestimate that of obese individuals [7], error in estimation of %BF may be
minimized compared with SFBIA [8]. BIS is a more sophisticated model that uses a wide range of
frequencies and non-linear mathematical algorithm to assess relationships between R and body fluid.
This allows estimation of R extrapolated to zero (R0) and infinite (R∞) frequencies and development of
empirically-derived prediction equations [4,5,9]. Although both accuracy and precision of results may
vary depending on the characteristics of the study population [9], past studies have reported that BIS
provides better estimation of ECF than SFBIA [4,5,10,11] and also has an acceptable accuracy and
precision using an animal model [12]. In addition, a technique known as “segmental BIA” is available
which determines information on total body composition through measurements of each segment
(i.e., upper and lower limbs and the trunk). A previous review has described a number of advantages

Nutrients 2014, 6 1888
and considerations [13], and another study reported that segmental BIA can provide valid information
on body composition compared with the four-compartment model [14]. However, most studies have
been undertaken on adults and studies of children are relatively scarce. Consequently, little knowledge
is available on any differences in TBW estimation between adults and children and the effects of using
different frequencies.
In addition, wide variations in measurement posture are commonplace using the impedance
technique depending on the device used. Many hand-to-foot models measure in a supine position, the
posture recommended in the European Society for Parenteral and Enteral Nutrition (ESPEN)
guidelines [10]. However, modern segmental BIAs that are in a scale type are designed to measure in a
standing position [13]. A previous study on the influence of posture during measurements reported
2%–5% changes in ECF and 1.8%–8.0% changes in ICF depending on body position [15].
Another study reported no significant differences in %BF using a hand-to-foot device but a significant
increase in %BF using a hand-to-hand device [8]. These results suggest that body posture may
influence estimation of body fluid status and therefore estimation of %BF using the impedance
technique. However, these studies were conducted on adults and no previous research has reported
differences between adults and children.
Therefore, the present study aimed to examine influences of frequency modes and measurement
posture in estimation of TBW in adult males and boys. The estimated TBW was compared with the
result obtained from the reference deuterium (2H) dilution technique.
2. Experimental Section
The study was approved by the Human Research Ethics Committee of Queensland University
of Technology and adhered to the principles of medical research established by the National Health and
Medical Research Council [16]. Boys aged below 15 years or adult males aged above 20 years with no
medical conditions or under medication were included in the study. Participants were recruited through
flyers. All participants were given an information package and all signed a consent form prior to their
participation. For participants below 18 years of age, parents or legal guardians also signed the consent
form. All participants were provided with a $20 gift voucher after their full participation in the study. In
total, 49 participants including 23 boys aged between 6 and 14 years and 26 adult males aged between 23
and 82 years, completed all assessments and were included in the study. All participants were instructed
to fast overnight and void their bladders in the morning, prior to measurements being conducted. All
assessments on children were conducted by the primary investigator.
2.1. Anthropometry
All participants underwent measurements of stature using a stadiometer to the nearest 0.1 cm and
body weight using a digital weighing scale to the nearest 0.1 kg. Waist circumference was measured at
the narrowest point between the 10th rib and the iliac crest using a steel anthropometric tape.
All measurements were conducted according to the protocol of the International Society for the
Advancement of Kinanthropometry (ISAK) [17]. All measurements were taken by a level three
anthropometrist accredited by ISAK with an intra-tester technical error of measurements (TEM) of less
Nutrients 2014, 6 1889
than 1.0%, below recommended levels [18,19]. From these measurements, BMI and waist-to-height
ratio (WHtR) were calculated.
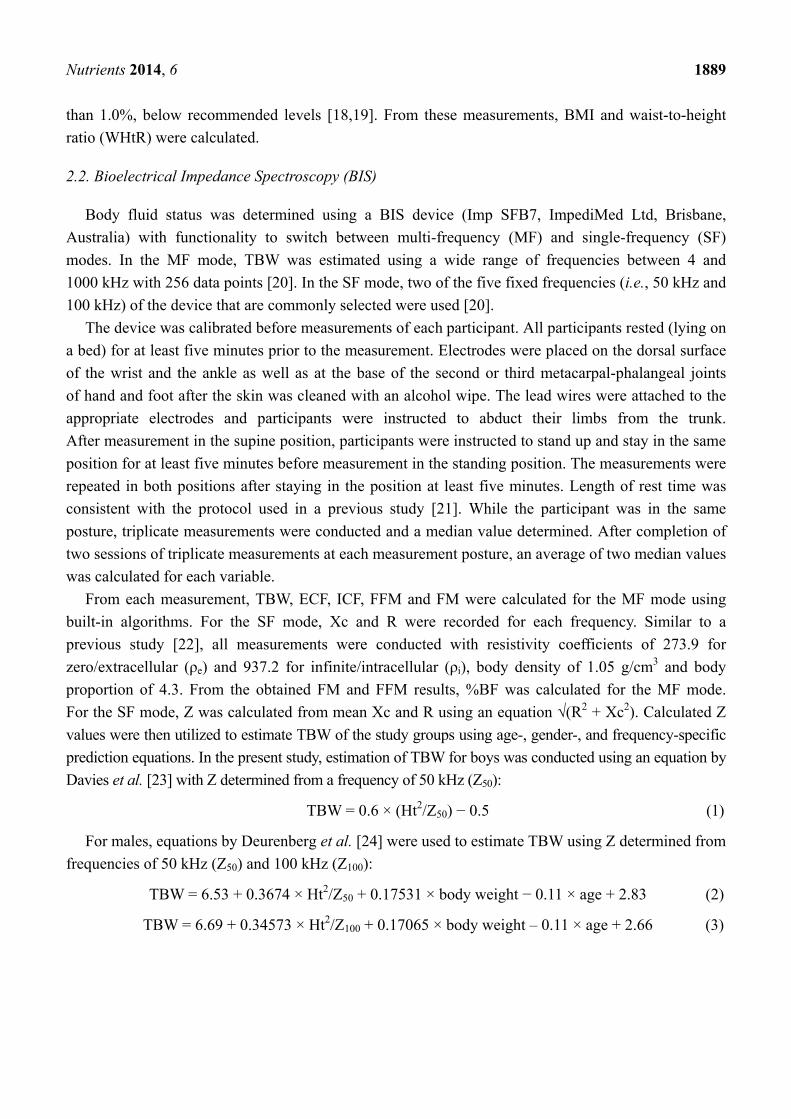
2.2. Bioelectrical Impedance Spectroscopy (BIS)
Body fluid status was determined using a BIS device (Imp SFB7, ImpediMed Ltd, Brisbane,
Australia) with functionality to switch between multi-frequency (MF) and single-frequency (SF)
modes. In the MF mode, TBW was estimated using a wide range of frequencies between 4 and
1000 kHz with 256 data points [20]. In the SF mode, two of the five fixed frequencies (i.e., 50 kHz and
100 kHz) of the device that are commonly selected were used [20].
The device was calibrated before measurements of each participant. All participants rested (lying on
a bed) for at least five minutes prior to the measurement. Electrodes were placed on the dorsal surface
of the wrist and the ankle as well as at the base of the second or third metacarpal-phalangeal joints
of hand and foot after the skin was cleaned with an alcohol wipe. The lead wires were attached to the
appropriate electrodes and participants were instructed to abduct their limbs from the trunk.
After measurement in the supine position, participants were instructed to stand up and stay in the same
position for at least five minutes before measurement in the standing position. The measurements were
repeated in both positions after staying in the position at least five minutes. Length of rest time was
consistent with the protocol used in a previous study [21]. While the participant was in the same
posture, triplicate measurements were conducted and a median value determined. After completion of
two sessions of triplicate measurements at each measurement posture, an average of two median values
was calculated for each variable.
From each measurement, TBW, ECF, ICF, FFM and FM were calculated for the MF mode using
built-in algorithms. For the SF mode, Xc and R were recorded for each frequency. Similar to a
previous study [22], all measurements were conducted with resistivity coefficients of 273.9 for
zero/extracellular (ρe) and 937.2 for infinite/intracellular (ρi), body density of 1.05 g/cm3 and body
proportion of 4.3. From the obtained FM and FFM results, %BF was calculated for the MF mode.
For the SF mode, Z was calculated from mean Xc and R using an equation √(R2 + Xc2). Calculated Z
values were then utilized to estimate TBW of the study groups using age-, gender-, and frequency-specific
prediction equations. In the present study, estimation of TBW for boys was conducted using an equation by
Davies et al. [23] with Z determined from a frequency of 50 kHz (Z50):
TBW = 0.6 × (Ht2/Z50) − 0.5 (1)
For males, equations by Deurenberg et al. [24] were used to estimate TBW using Z determined from
frequencies of 50 kHz (Z50) and 100 kHz (Z100):
TBW = 6.53 + 0.3674 × Ht2/Z50 + 0.17531 × body weight − 0.11 × age + 2.83 (2)
TBW = 6.69 + 0.34573 × Ht2/Z100 + 0.17065 × body weight – 0.11 × age + 2.66 (3)

Nutrients 2014, 6 1890
2.3. Deuterium Dilution Technique
Deuterium (2H) dilution technique was the reference method used for TBW. Prior to the assessment,
a 10% deuterium oxide (D2O) solution was prepared by mixing 100 mL of 99.9% D2O solution
(Aldrich Chemistry, Sigma-Aldrich Pty Ltd, Sydney, Australia) and 900 mL of tap water. The solution
was sterilized at 120 °C for 10 min using an autoclave. After collecting a pre-dose urine sample, the
body weight of participants was measured using a weighing scale. The dose amount of 10% D2O
solution was calculated as 0.5 × body weight (kg) and weighed using a scale. All participants
consumed the weighed 10% D2O solution and re-weighed the drinking cup to record the precise
amount consumed. After consumption of the 10% D2O solution, participants were instructed to collect
a post-dose urine sample after five hours, to ensure that equilibration of 2H within the body fluid pool
was reached.
Both pre- and post-dose samples were analyzed using an isotope ratio mass spectrometry
(IRMS: Hydra 20-20, SerCon Mass Spectrometry, SerCon Limited, Cheshire, CW1 6YY UK). All
analyses were conducted at the laboratory at the Institute of Health and Biomedical Innovation (IHBI)
of Queensland University of Technology (QUT) in Brisbane, Australia. TBW was calculated using the
following equation:
TBW (kg) = ((W × A/a) × (ΔDD/ΔBW))/(1000 × 1.041) (4)
where W = total weight of water added when making the dose dilution (g), A = weight of dose taken by
the participant (g), a = weight of dose in diluted dose (g), ΔDD = enrichment of 2H in the diluted dose
(ppm excess 2H), and ΔBW = enrichment of 2H in body water (ppm excess 2H). The value of 1.041
was based on an assumption that the dilution space or the volume of the distribution of 2H is 1.041
times greater than TBW [25].
All statistical analyses were conducted using the PASW® Statistics package (version 18.0.0, IBM,
Chicago, IL, USA). Paired t-tests were conducted to compare results obtained from different postures
(i.e., supine and standing positions). In addition, TBW estimated from different frequency modes were
compared with the results from the dilution technique using repeated measures of analysis of variance
(ANOVA) and a Bonferroni post hoc test. Results were expressed as mean ± standard error (SE).
In addition, variability of estimated TBW for the study population from different frequency modes were
determined using correlation coefficients, limits of agreement (i.e., difference ± 1.96 × standard deviation),
and the Bland and Altman plots [26] using the dilution technique as the reference. All statistical tests
used significant level of 0.05 unless otherwise stated.
3. Results
Physical characteristics of the participants were 9.8 ± 0.5 years, 144.1 ± 3.2 cm and 36.6 ± 2.4 kg
for boys and 36.9 ± 2.7 years, 174.3 ± 1.4 cm, and 76.5 ± 3.2 kg for adult males, respectively (Table 1).
WHtR, an index of abdominal fat accumulation with the cut-off point of 0.5, were 0.44 ± 0.01 in boys
and 0.49 ± 0.01 in adult males, respectively.
Nutrients 2014, 6 1891
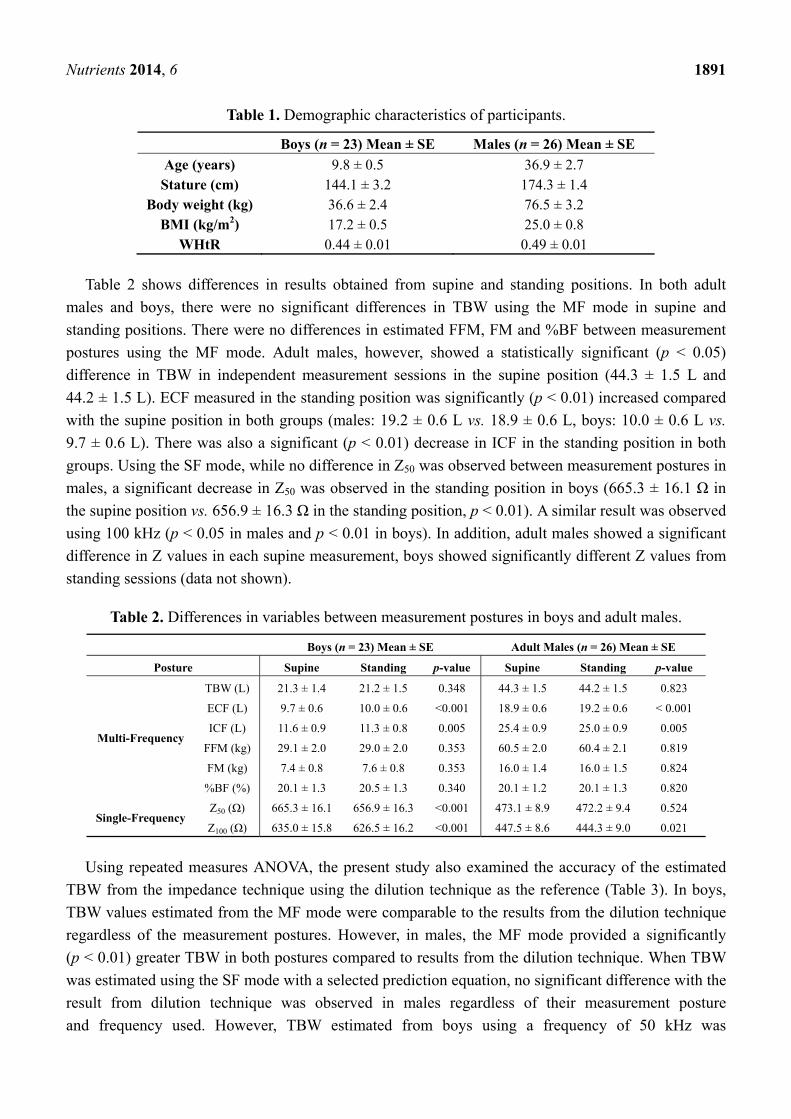
Table 1. Demographic characteristics of participants.
Boys (n = 23) Mean ± SE Males (n = 26) Mean ± SE
Age (years) 9.8 ± 0.5 36.9 ± 2.7 Stature (cm) 144.1 ± 3.2 174.3 ± 1.4
Body weight (kg) 36.6 ± 2.4 76.5 ± 3.2 BMI (kg/m2) 17.2 ± 0.5 25.0 ± 0.8
WHtR 0.44 ± 0.01 0.49 ± 0.01
Table 2 shows differences in results obtained from supine and standing positions. In both adult
males and boys, there were no significant differences in TBW using the MF mode in supine and
standing positions. There were no differences in estimated FFM, FM and %BF between measurement
postures using the MF mode. Adult males, however, showed a statistically significant (p < 0.05)
difference in TBW in independent measurement sessions in the supine position (44.3 ± 1.5 L and
44.2 ± 1.5 L). ECF measured in the standing position was significantly (p < 0.01) increased compared
with the supine position in both groups (males: 19.2 ± 0.6 L vs. 18.9 ± 0.6 L, boys: 10.0 ± 0.6 L vs.
9.7 ± 0.6 L). There was also a significant (p < 0.01) decrease in ICF in the standing position in both
groups. Using the SF mode, while no difference in Z50 was observed between measurement postures in
males, a significant decrease in Z50 was observed in the standing position in boys (665.3 ± 16.1 Ω in
the supine position vs. 656.9 ± 16.3 Ω in the standing position, p < 0.01). A similar result was observed
using 100 kHz (p < 0.05 in males and p < 0.01 in boys). In addition, adult males showed a significant
difference in Z values in each supine measurement, boys showed significantly different Z values from
standing sessions (data not shown).
Table 2. Differences in variables between measurement postures in boys and adult males.
Boys (n = 23) Mean ± SE Adult Males (n = 26) Mean ± SE
Posture Supine Standing p-value Supine Standing p-value
Multi-Frequency
TBW (L) 21.3 ± 1.4 21.2 ± 1.5 0.348 44.3 ± 1.5 44.2 ± 1.5 0.823
ECF (L) 9.7 ± 0.6 10.0 ± 0.6 <0.001 18.9 ± 0.6 19.2 ± 0.6 < 0.001
ICF (L) 11.6 ± 0.9 11.3 ± 0.8 0.005 25.4 ± 0.9 25.0 ± 0.9 0.005
FFM (kg) 29.1 ± 2.0 29.0 ± 2.0 0.353 60.5 ± 2.0 60.4 ± 2.1 0.819
FM (kg) 7.4 ± 0.8 7.6 ± 0.8 0.353 16.0 ± 1.4 16.0 ± 1.5 0.824
%BF (%) 20.1 ± 1.3 20.5 ± 1.3 0.340 20.1 ± 1.2 20.1 ± 1.3 0.820
Single-Frequency Z50 (Ω) 665.3 ± 16.1 656.9 ± 16.3 <0.001 473.1 ± 8.9 472.2 ± 9.4 0.524
Z100 (Ω) 635.0 ± 15.8 626.5 ± 16.2 <0.001 447.5 ± 8.6 444.3 ± 9.0 0.021
Using repeated measures ANOVA, the present study also examined the accuracy of the estimated
TBW from the impedance technique using the dilution technique as the reference (Table 3). In boys,
TBW values estimated from the MF mode were comparable to the results from the dilution technique
regardless of the measurement postures. However, in males, the MF mode provided a significantly
(p < 0.01) greater TBW in both postures compared to results from the dilution technique. When TBW
was estimated using the SF mode with a selected prediction equation, no significant difference with the
result from dilution technique was observed in males regardless of their measurement posture
and frequency used. However, TBW estimated from boys using a frequency of 50 kHz was

Nutrients 2014, 6 1892
significantly (p < 0.01) smaller compared to the result from the dilution technique, regardless of their
measurement posture.
The variability of TBW estimation using different frequency modes are shown in Table 4.
Compared with the dilution technique, results from both MF and SF modes showed high correlation
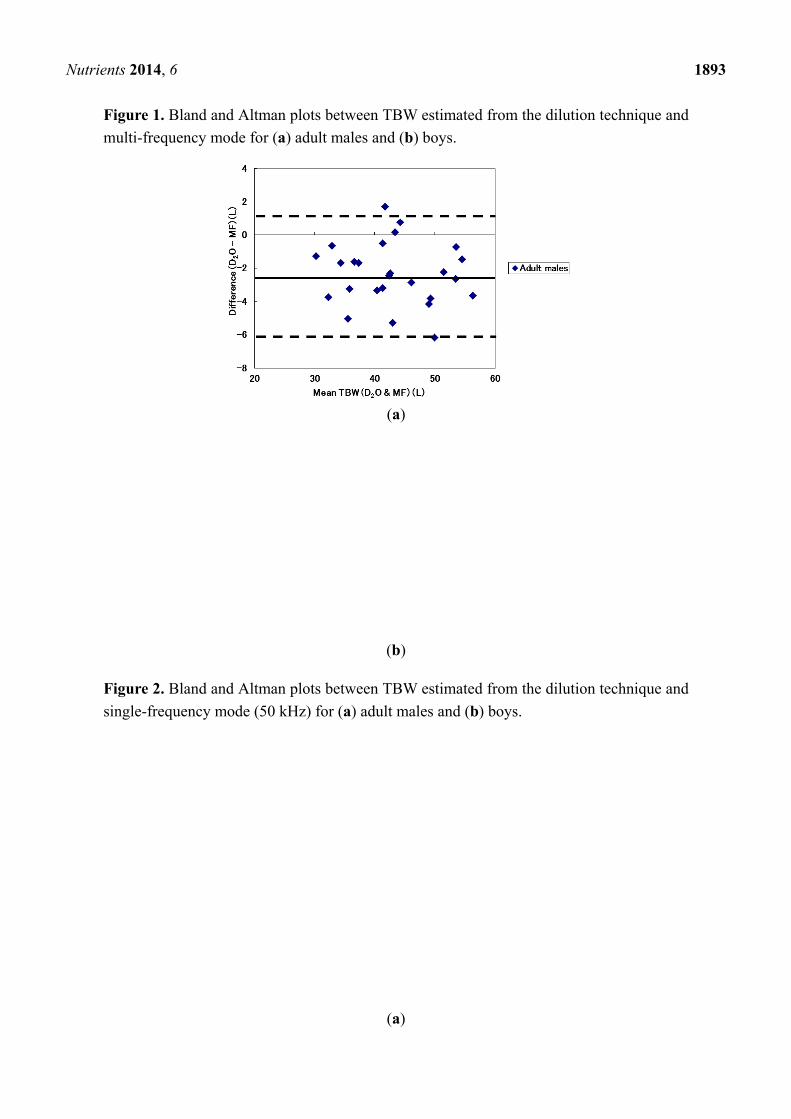
coefficients of 0.956 to 0.988. However, Bland and Altman plots for the supine position showed that
TBW of almost all adult males was overestimated when the MF mode was used (Figure 1a) and
calculated limits of agreement indicated an average of 2.4 L overestimation with a wide variability of
about 3.7 L (Table 4). In comparison, boys showed relatively accurate estimation of TBW but some
boys with a larger TBW were overestimated (Figure 1b). Calculated limits of agreement indicated that
TBW estimation using the MF mode for boys had an underestimation of 0.38 L with variability of
about 2 L. Similarly, TBW from the dilution technique and the SF mode using 50 kHz was compared.
In males, the Bland and Altman plot indicated that individuals with relatively low TBW values
(less than 40 L) were overestimated by the SF mode whereas the opposite was true for those with
relatively high TBW (greater than 40 L). Limits of agreement indicated, on average, overestimated
about 0.7 L with a variability of approximately 4 L. In boys, TBW was underestimated in all
participants with potentially greater underestimation in individuals with a higher TBW (Figure 2).
Limits of agreement showed about 2.7 L of underestimation with a variability of 2.4 L.
Table 3. Differences in TBW estimated from different techniques.
Boys (n = 23) Mean ± SE Males (n = 26) Mean ± SE
TBW(2H dilution) (L) 21.7 ± 1.4 41.9 ± 1.5
Supine
Device Mean ± SE p-value Mean ± SE p-value
Multi-Frequency (L) 21.3 ± 1.4 0.333 44.3 ± 1.5 <0.001
Single-Frequency Z50 (L) † 19.0 ± 1.3 <0.001 42.6 ± 1.4 0.566
Single-Frequency Z 100 (L) ‡ - NA 42.2 ± 1.3 1.000
Standing
Device Mean ± SE p-value Mean ± SE p-value
Multi-Frequency (L) 21.2 ± 1.5 0.250 44.2 ± 1.5 <0.001
Single-Frequency Z50 (L) † 19.3 ± 1.3 <0.001 42.7 ± 1.4 0.461
Single-Frequency Z 100 (L) ‡ - NA 42.4 ± 1.4 1.000 † TBW was estimated using the estimation equation Deurenberg et al. [24] for males and Davies et al. [23] for boys; ‡ TBW was estimated using the estimation equation by Deurenberg et al. [24].
Table 4. Variability of TBW estimation using different frequencies compared with the
dilution technique.
Boys (n = 23) Males (n = 26)
Multi-Frequency Correlation coefficient 0.988 0.970
Limits of Agreement 0.378 ± 2.14 (2.518, −1.762) −2.361 ± 3.655 (1.29, −6.015)
Single-Frequency Z50 †
Correlation coefficient 0.985 0.956
Limits of Agreement 2.6524 ± 2.357 (5.009, 0.295) −0.7465 ± 4.289 (3.543, −5.036) † TBW was estimated using the estimation equation Deurenberg et al. [24] for males and Davies et al. [23] for boys.
Nutrients 2014, 6 1893
Figure 1. Bland and Altman plots between TBW estimated from the dilution technique and
multi-frequency mode for (a) adult males and (b) boys.
(a)
(b)
Figure 2. Bland and Altman plots between TBW estimated from the dilution technique and
single-frequency mode (50 kHz) for (a) adult males and (b) boys.
(a)

Nutrients 2014, 6 1894
Figure 2. Cont.
(b)
4. Discussion
The present study investigated the influence of posture and frequency modes of impedance
technique in the estimation of TBW in adult males and boys. Results confirmed that measurement
posture had no significant influence on TBW estimation and therefore no influence on estimation of
body composition in this convenience sample. The results were consistent with earlier reports using SF
devices [21]. This suggests that influence of body posture during measurements using impedance
technique has a minimal impact on overall estimation of body composition. However, the present study
showed significant changes in ICF and ECF volumes depending on posture during measurements in
both adult males and boys. It has been suggested that a change in posture will cause redistribution of
ECF. The observed results, although smaller in magnitude, were consistent with a previous study that
reported change of ECF and ICF volumes by posture [15]. The result was inconsistent with another
study that reported a redistribution of ECF only occurred between body segments (i.e., the limbs and
the trunk) with total ECF volume not altering as a function of change in measurement posture [27].
The present findings of change in ECF and ICF with no overall change in TBW may be due to a larger
sample size compared to the previous study that examined only 11 males.
In addition to a possible fluid shift as a result of change in measurement posture, the presence of
stray capacitance may also have influenced the observed outcomes. Weyer and colleagues [28]
suggested that of the two fundamental stray capacitances in the impedance technique, the one formed
between the human body and the ground may have considerable impact on the reading. Technical
factors such as stray capacitances as well as variables such as body proportions, body density, and
resistivity coefficients may be important in interpreting accuracy and quality of results. Boys showed a
significant decrease in Z50 measured in the standing position. Since the frequency of 50 kHz can go
through both ECF and ICF, a reduction in Z may indicate a reduction in TBW. However, results from
the MF mode did not show a change in TBW between postures. As no differences in Z50 were observed
from males, this may suggest that, together with body fluid shift some technical factors influenced
measurements in boys.
Nutrients 2014, 6 1895
While no specific pattern was observed from the MF mode, estimation of TBW in adult males using
the SF mode showed a different pattern depending on whether the participant had TBW greater or
lesser than 40 L. Compared to adult males, boys showed a better correlation and agreement between
the dilution technique and the impedance technique (both SF and MF modes). A smaller difference in
results from the dilution technique and both MF and SF modes and narrower limits of agreement
indicates the accuracy of the impedance technique. Observed differences in TBW estimation may be
associated with a number of technical factors, such as resistivity coefficients, a body density, a body
proportion factor and also prediction equations to estimate TBW using measured Z for the SF mode.
The current study used default values for resistivity coefficients, a body density and a body proportion
that were derived from healthy Caucasian adults. Although other studies have adopted the same default
settings in unhealthy populations (e.g., obese) [22] or children [29,30], the estimation of TBW or Z
values in the current study, particularly in boys, may be the result of technical error. In addition, the
estimated TBW from a frequency of 50 kHz showed greater underestimation or noticeable pattern in
both males and boys. This may be explained by application of prediction equations to estimate TBW.
In this study, TBW for males was estimated by using the equation by Deurenberg et al. [24] and TBW
of boys were calculated using the equation by Davies et al. [23] that was derived from a small group of
children (n = 26). While the equation by Deurenberg et al. [24] was derived from 139 healthy
volunteers, the equation by Davies et al. [23] was derived from a group of children with particular
health conditions, including growth hormone deficiency, inflammatory bowel disease and diabetes. In
addition, while the equation was derived from both boys and girls, the equation does not include
gender as a variable. Although the age range was matched with the sample of the present study, it may
be possible that application of these equations may also affect accuracy and variability of the results.
These possibilities suggest the importance of considering the abovementioned technical issues in
differentiating biological influence such as fluid shift caused by a change in a measurement posture
and also to improve the accuracy of the results, particularly using the SF mode.
5. Conclusions
In summary, the present study clarified that estimation of TBW using the MF mode of BIS device is
not affected by measurement posture regardless of participants’ maturational status or body size.
Accordingly, estimation of body composition, including %BF is not affected by change in
measurement posture. However, it should be noted that change in posture may be associated with fluid
shift within the body that may alter values for ECF, ICF and Z. In addition, it is important to consider
technical factors associated with measurements, including stray capacitances, resistivity coefficients,
body proportion factor and also selection of appropriate prediction equations in order to differentiate
the effect of measurement posture and technical error. As information on appropriate resistivity
coefficients and body proportion factors for children is very scarce future research should consider
explore appropriate values for this population. Similarly, as the current study was based on a relatively
small sample size, future research should replicate the study using a larger group in different age
categories as well as including females to examine gender differences.
Nutrients 2014, 6 1896
Acknowledgments
The present study was funded by the Early Career Researchers Grant scheme of the Institute
of Health and Biomedical Innovation, Queensland University of Technology.
Author Contributions
M.K. contributed in study design, recruitment and data collection, sample analysis, data analysis
and preparation of the manuscript. C.W. contributed in sample analysis and preparation of the
manuscript. A.H. contributed in overall supervision and preparation of manuscript.
Conflicts of Interest
The authors declare no conflict of interest.
References
1. WHO. Obesity: Preventing and Managing the Global Epidemic; WHO Technical Report Series
894; WHO: Geneva, Switzerland, 2000.
2. WHO/IASO/IOTF. Asia-Pacific Perspective: Redefining Obesity and Its Treatment; Health
Communications Australia Pty Ltd.: Melbourne, Australia, 2000.
3. Baumgartner, R.N.; Chumlea, W.C.; Roche, A.F. Bioelectric impedance phase angle and body
composition. Am. J. Clin. Nutr. 1988, 48, 16–23.
4. Kyle, U.G.; Bosaeus, I.; de Lorenzo, A.D.; Deurenberg, P.; Elia, M.; Gomez, J.M.; Heitmann, B.L.;
Kent-Smith, L.; Melchior, J.C.; Pirlich, M.; et al. ESPEN Guidelines, Bioelectrical impedance
analysis-part I: Review of principles and methods. Clin. Nutr. 2004, 23, 1226–1243.
5. Jaffrin, M.Y.; Morel, H. Body fluid volumes measurements by impedance: A review of bioimpedance
spectroscopy (BIS) and bioimpedance analysis (BIA) methods. Med. Eng. Phys. 2008, 30,
1257–1269.
6. Ward, L.C.; Dyer, J.M.; Byrne, N.M.; Sharpe, K.K.; Hills, A.P. Validation of a three-frequency
bioimpedance spectroscopic method for body composition analysis. Nutrition 2007, 23, 657–664.
7. Sun, G.; French, C.R.; Martin, G.R.; Younghusband, B.; Green, R.C.; Xie, Y.-G.; Mathews, M.;
Barron, J.R.; Fitzpatrick, D.G.; Gulliver, W.; et al. Comparison of multifrequency bioelectrical
impedance analysis with dual-energy X-ray absorptiometry for assessment of percentage body fat in a
large, healthy population. Am. J. Clin. Nutr. 2005, 81, 74–78.
8. Demura, S.; Sato, S.; Kitabayashi, T. Percentage of total body fat as estimated by three automatic
bioelectrical impedance analyzers. J. Physiol. Anthropol. Appl. Hum. Sci. 2004, 23, 93–99.
9. Lukaski, H.C. Evolution of bioimpedance: A circuitous journey from estimation of physiological
function to assessment of body composition and a return to clinical research. Eur. J. Clin. Nutr.
2013, 67, S2–S9.
10. Kyle, U.G.; Bosaeus, I.; de Lorenzo, A.D.; Deurenberg, P.; Elia, M.; Manuel Gómez, J.;
Lilienthal Heitmann, B.; Kent-Smith, L.; Melchior, J.C.; Pirlich, M.; et al. ESPEN Guidelines,
Bioelectrical impedance analysis-part II: Utilization in clinical practice. Clin. Nutr. 2004, 23,
1430–1453.
Nutrients 2014, 6 1897
11. Buchholz, A.C.; Bartok, C.; Schoeller, D.A. The validity of bioelectrical impedance models in
clinical populations. Nutr. Clin. Prac. 2004, 19, 433–446.
12. Smith, D.J.; Johnson, M.; Nagy, T. Precision and accuracy of bioimpedance spectroscopy for
determination of in vivo body composition in rats. Int. J. Body Compos. Res. 2009, 7, 21–26.
13. Ward, L.C. Segmental bioelectrical impedance analysis: An update. Curr. Opin. Clin. Nutr.
Metab. Care 2012, 15, 424–429.
14. Bosy-Westphal, A.; Schautz, B.; Later, W.; Kehayias, J.J.; Gallagher, D.; Muller, M.J.
What makes a BIA equation unique? Validity of eight-electrode multifrequency BIA to estimate
body composition in a healthy adult population. Eur. J. Clin. Nutr. 2013, 67, S14–S21.
15. Scharfetter, H.; Monif, M.; László, Z.; Lambauer, T.; Hutten, H.; Hinghofer-Szalkay, H. Effect of
postural changes on the reliability of volume estimations from bioimpedance spectroscopy data.
Kidney Int. 1997, 51, 1078–1087.
16. National Health and Medical Research Council. National Statement on Ethical Conduct in
Research Involving Humans, 1st ed.; AusInfo.: Canberra, Australia, 1999.
17. Marfell-Jones, M.; Olds, T.; Stewart, A.; Carter, J.E.L. International Standards for Anthropometric
Assessment (Revised 2006), 2nd ed.; The International Society for the Advancement of
Kinanthropometry: Potchefstroom, South Africa, 2006.
18. Gore, C.; Norton, K.; Olds, T.; Whittingham, N.; Birchall, K.; Clough, M.; Dickerson, B.;
Downie, L. Accreditation in anthropometry: An Australian model. In Anthropometrica; Norton, K.,
Olds, T., Eds.; University of New South Wales Press: Sydney, Australia, 1996; pp. 395–411.
19. Wang, J.; Thornton, J.C.; Kolesnik, S.; Pierson, R.N., Jr.; Anthropometry in body composition: An
overview. Ann. N. Y. Acad. Sci. 2000, 904, 317–326.
20. ImpediMed. Imp SFB7 Instructions for Use; ImpediMed: Eight Mile Plains, Australia, 2007.
21. Demura, S.; Yamaji, S.; Goshi, F.; Nagasawa, Y. The influence of posture change on measurements of
relative body fat in the bioimpedance analysis method. J. Physiol. Anthropol. Appl. Hum. Sci.
2001, 20, 29–35.
22. Moon, J.R.; Smith, A.E.; Tobkin, S.E.; Lockwood, C.M.; Kendall, K.L.; Graef, J.L.;
Roberts, M.D.; Dalbo, V.J.; Kerksick, C.M.; Cramer, J.T.; et al. Total body water changes after an
exercise intervention tracked using bioimpedance spectroscopy: A deuterium oxide comparison.
Clin. Nutr. 2009, 28, 516–525.
23. Davies, P.S.W.; Preece, M.A.; Hicks, C.J.; Halliday, D. The prediction of total body water using
bioelectrical impedance in children and adolescents. Ann. Hum. Biol. 1988, 15, 237–240.
24. Deurenberg, P.; Tagliabue, A.; Schouten, F.J.M. Multi-frequency impedance for the prediction of
extracellular water and total body water. Br. J. Nutr. 1995, 73, 349–358.
25. International Atomic Energy Agency. Introduction to Body Composition Assessment Using the
Deuterium Dilution Technique with Analysis of Urine Samples by Isotope Ratio Mass
Spectrometry; IAEA: Vienna, Austria, 2010.
26. Bland, J.M.; Altman, D.G. Statistical methods for assessing agreement between two methods of
clinical measurement. Lancet 1986, 1, 307–310.
27. Zhu, F.; Schneditz, D.; Wang, E.; Levin, N.W. Dynamics of segmental extracellular volumes
during changes in body position by bioimpedance analysis. J. Appl. Physiol. 1998, 85, 497–504.
Nutrients 2014, 6 1898
28. Weyer, S.; Ulbrich, M.; Leonhardt, S. A model-based approach for analysis of intracellular
resistance variations due to body posture on bioimpedance measurements. J. Phys. 2013, 434,
1–4.
29. Lubans, D.R.; Morgan, P.J.; Okely, A.D.; Dewar, D.; Collins, C.E.; Batterham, M.; Callister, R.;
Plotnikoff, R.C. Preventing Obesity Among Adolescent Girls: One-Year Outcomes of the
Nutrition and Enjoyable Activity for Teen Girls (NEAT Girls) Cluster Randomized Controlled
Trial. Arch. Pediatr. Adolesc. Med. 2012, 166, 821–827.
30. Rutkove, S.B.; Gregas, M.C.; Darras, B.T. Electrical impedance myography in spinal muscular
atrophy: A longitudinal study. Muscle Nerve 2012, 45, 642–647.
© 2014 by the authors; licensee MDPI, Basel, Switzerland. This article is an open access article
distributed under the terms and conditions of the Creative Commons Attribution license
(http://creativecommons.org/licenses/by/3.0/).