Embed Size (px)
Citation preview
Bio-based Industries Joint Undertaking
(BBI JU)
ANNUAL ACTIVITY REPORT 2016
Copyright ©2017 Bio-based Industries Joint Undertaking
In accordance with Article 16 of the Statutes of the BBI JU annexed to Council Regulation (EU) No 560/2014 and with Article 20 of the Financial Rules of the BBI JU.
The annual activity report will be made publicly available after its approval by the Governing Board.
2
CONTENTS
FACTSHEET ........................................................................................................................ 4
FOREWORD ........................................................................................................................ 7
EXECUTIVE SUMMARY .................................................................................................... 10
1. Implementation of the Annual Work Plan 2016 ............................................................ 18
1.1. Key objectives 2016 and associated risks ......................................................... 18
1.1.1. Overall operational objectives from AWP 2016 .............................................. 18
1.1.2. Management objectives 2016 and achievements ........................................... 18
1.1.3. Associated risks ............................................................................................. 21
1.2. Research & Innovation activities ........................................................................ 21
1.2.1. Strategic Innovation and Research Agenda (SIRA) ....................................... 21
1.2.2. Overview of BBI JU Calls and Project Portfolio .............................................. 25
1.2.3. Project Monitoring Activities ........................................................................... 29
1.2.4. Bridging from discovery to market .................................................................. 29
1.2.5. Synergies with other initiatives ....................................................................... 30
1.3. Calls for proposals and grant information .......................................................... 31
1.3.1. Progress against KPIs / Statistics .................................................................. 31
1.3.2. Evaluation: procedures and global evaluation outcome, redress, statistics .... 59
1.4. Call for tenders .................................................................................................. 73
1.5. Dissemination and information on projects results ............................................. 73
1.6. Operational budget execution ............................................................................ 76
1.7. In-kind contributions .......................................................................................... 77
2. SUPPORT TO OPERATIONS ..................................................................................... 79
2.1. Communication activities ................................................................................... 79
2.1.1. Priorities ......................................................................................................... 79
2.1.2. Outreach activities ......................................................................................... 80
2.1.3. Promoting BBI JU Calls ................................................................................. 80
2.1.4. Promoting BBI JU projects and success stories ............................................. 82
2.1.5. Website and social media .............................................................................. 86
2.1.6. Publications and media relations.................................................................... 86
2.2. Legal and financial framework ........................................................................... 88
2.3. Budgetary and financial management ............................................................... 89
2.4. Procurement and contracts................................................................................ 97
2.5. IT and logistics .................................................................................................. 98
3
2.6. Human Resources ............................................................................................. 99
3. GOVERNANCE ......................................................................................................... 104
3.1. Governing Board ............................................................................................. 104
3.2. Executive Director ........................................................................................... 105
3.3. States Representatives Group ......................................................................... 106
3.4. Scientific Committee ........................................................................................ 109
4. INTERNAL CONTROL FRAMEWORK ...................................................................... 112
4.1. Financial Procedures ....................................................................................... 112
4.2. Ex-ante controls on operational expenditure .................................................... 113
4.3. Ex-post control of operational expenditure and error rates identified ............... 114
4.4. Audit of the European Court of Auditors .......................................................... 114
4.5. Internal Audit ................................................................................................... 114
4.6. Risk management and Conflict of Interest ....................................................... 115
4.7. Compliance and effectiveness of Internal Control ............................................ 119
5. MANAGEMENT assurance ........................................................................................ 121
5.1. Assessment of the Annual Activity Report by the Governing Board ................. 121
5.2. Elements supporting assurance ...................................................................... 125
5.3. Reservations ................................................................................................... 125
5.4. Overall conclusion ........................................................................................... 125
6. DECLARATION OF ASSURANCE............................................................................. 126
7. ANNEXES .................................................................................................................. 127
7.1. Organisational chart ........................................................................................ 128
7.2. Staff Establishment plan .................................................................................. 129
7.3. Publications from projects ............................................................................... 130
7.4. Patent from projects ........................................................................................ 131
7.5. Scoreboard of Horizon 2020 common Key Performance Indicators ................. 132
7.6. Indicators for monitoring cross-cutting Issues .................................................. 136
7.7. Scoreboard of Key Performance Indicators specific to BBI JU ......................... 142
7.8. Final annual accounts...................................................................................... 143
7.9. Materiality criteria ............................................................................................ 183
7.10. Results of technical review ........................................................................... 184
7.11. List of acronyms ........................................................................................... 185
4
FACTSHEET
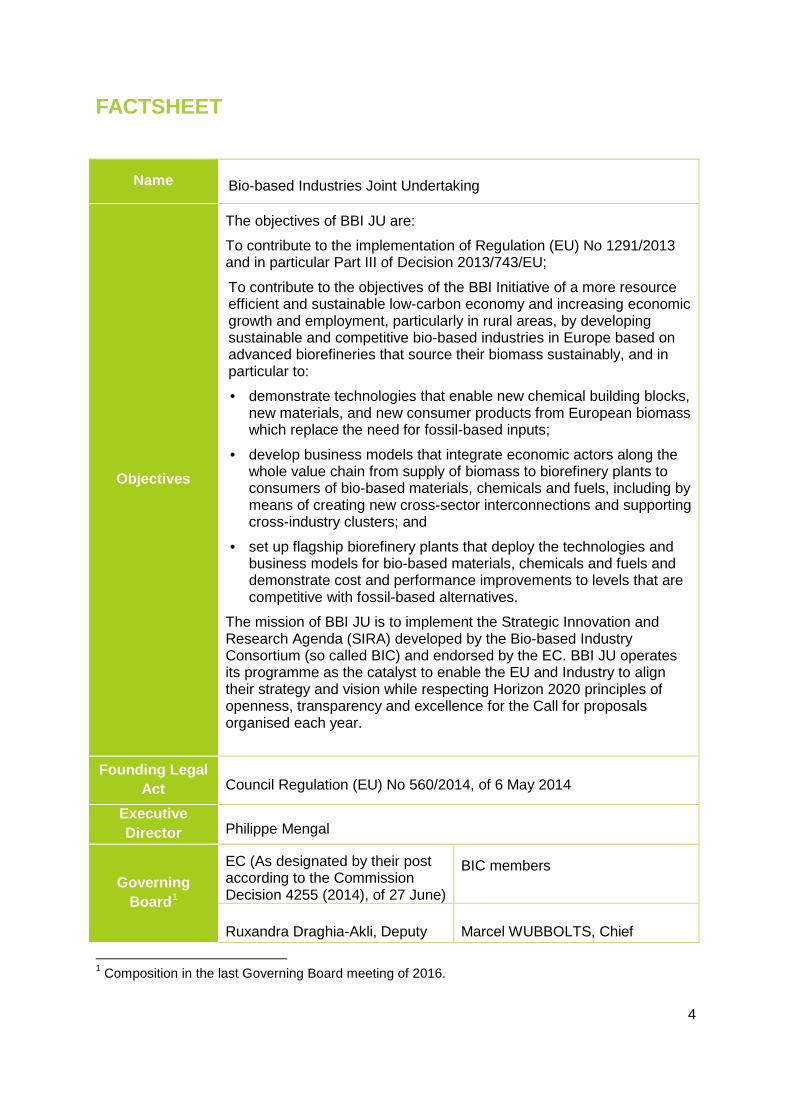
Name Bio-based Industries Joint Undertaking
Objectives
The objectives of BBI JU are:
To contribute to the implementation of Regulation (EU) No 1291/2013 and in particular Part III of Decision 2013/743/EU;
To contribute to the objectives of the BBI Initiative of a more resource efficient and sustainable low-carbon economy and increasing economic growth and employment, particularly in rural areas, by developing sustainable and competitive bio-based industries in Europe based on advanced biorefineries that source their biomass sustainably, and in particular to:
• demonstrate technologies that enable new chemical building blocks, new materials, and new consumer products from European biomass which replace the need for fossil-based inputs;
• develop business models that integrate economic actors along the whole value chain from supply of biomass to biorefinery plants to consumers of bio-based materials, chemicals and fuels, including by means of creating new cross-sector interconnections and supporting cross-industry clusters; and
• set up flagship biorefinery plants that deploy the technologies and business models for bio-based materials, chemicals and fuels and demonstrate cost and performance improvements to levels that are competitive with fossil-based alternatives.
The mission of BBI JU is to implement the Strategic Innovation and Research Agenda (SIRA) developed by the Bio-based Industry Consortium (so called BIC) and endorsed by the EC. BBI JU operates its programme as the catalyst to enable the EU and Industry to align their strategy and vision while respecting Horizon 2020 principles of openness, transparency and excellence for the Call for proposals organised each year.
Founding Legal
Act Council Regulation (EU) No 560/2014, of 6 May 2014
Executive Director Philippe Mengal
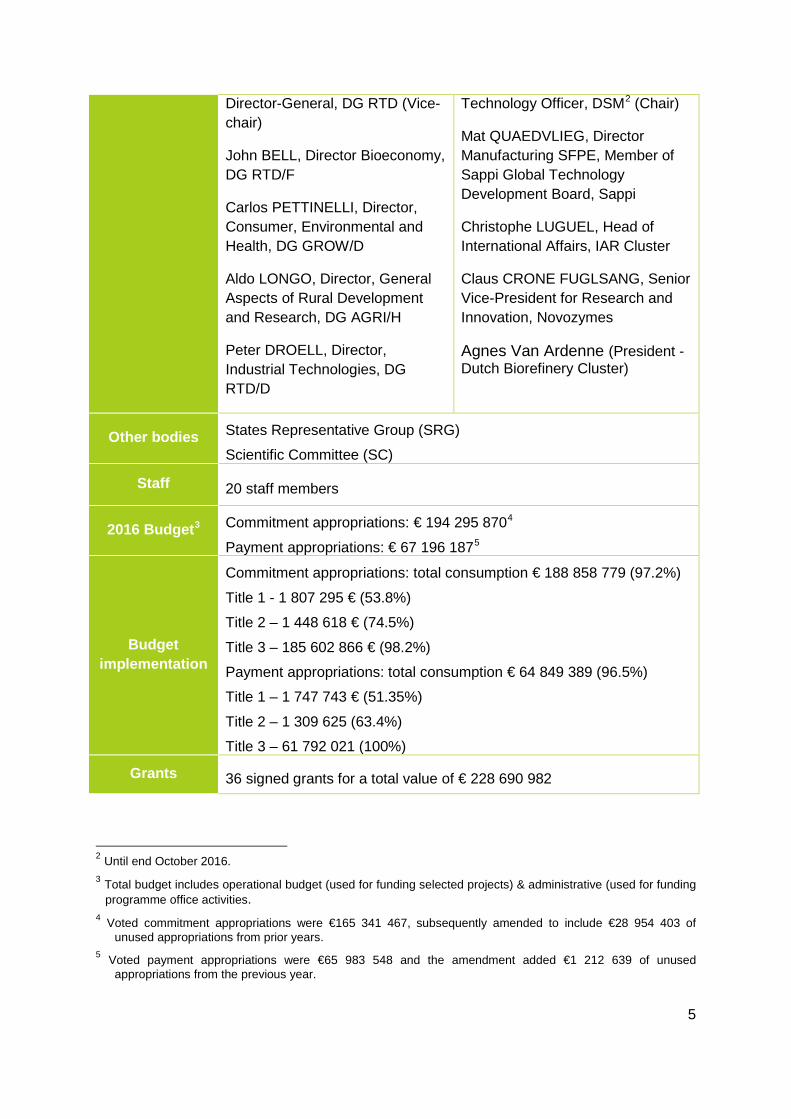
Governing Board1
EC (As designated by their post according to the Commission Decision 4255 (2014), of 27 June)
BIC members
Ruxandra Draghia-Akli, Deputy
Marcel WUBBOLTS, Chief
1 Composition in the last Governing Board meeting of 2016.
5
Director-General, DG RTD (Vice-chair)
John BELL, Director Bioeconomy, DG RTD/F
Carlos PETTINELLI, Director, Consumer, Environmental and Health, DG GROW/D
Aldo LONGO, Director, General Aspects of Rural Development and Research, DG AGRI/H
Peter DROELL, Director, Industrial Technologies, DG RTD/D
Technology Officer, DSM2 (Chair)
Mat QUAEDVLIEG, Director Manufacturing SFPE, Member of Sappi Global Technology Development Board, Sappi
Christophe LUGUEL, Head of International Affairs, IAR Cluster
Claus CRONE FUGLSANG, Senior Vice-President for Research and Innovation, Novozymes
Agnes Van Ardenne (President - Dutch Biorefinery Cluster)
Other bodies States Representative Group (SRG)
Scientific Committee (SC)
Staff 20 staff members
2016 Budget3 Commitment appropriations: € 194 295 8704
Payment appropriations: € 67 196 1875
Budget implementation
Commitment appropriations: total consumption € 188 858 779 (97.2%)
Title 1 - 1 807 295 € (53.8%)
Title 2 – 1 448 618 € (74.5%)
Title 3 – 185 602 866 € (98.2%)
Payment appropriations: total consumption € 64 849 389 (96.5%)
Title 1 – 1 747 743 € (51.35%)
Title 2 – 1 309 625 (63.4%)
Title 3 – 61 792 021 (100%)
Grants 36 signed grants for a total value of € 228 690 982
2 Until end October 2016. 3 Total budget includes operational budget (used for funding selected projects) & administrative (used for funding
programme office activities. 4 Voted commitment appropriations were €165 341 467, subsequently amended to include €28 954 403 of
unused appropriations from prior years. 5 Voted payment appropriations were €65 983 548 and the amendment added €1 212 639 of unused
appropriations from the previous year.
6
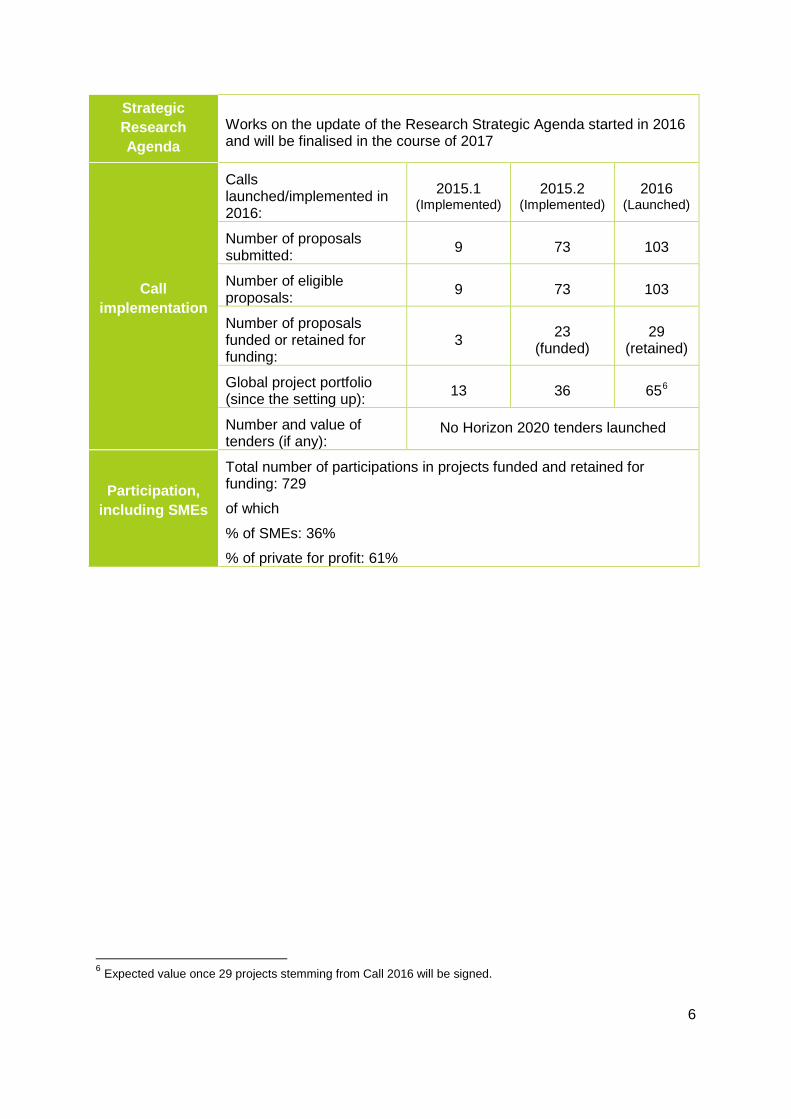
Strategic Research Agenda
Works on the update of the Research Strategic Agenda started in 2016 and will be finalised in the course of 2017
Call implementation
Calls launched/implemented in 2016:
2015.1 (Implemented)
2015.2 (Implemented)
2016 (Launched)
Number of proposals submitted: 9 73 103
Number of eligible proposals: 9 73 103
Number of proposals funded or retained for funding:
3 23 (funded)
29 (retained)
Global project portfolio (since the setting up): 13 36 656
Number and value of tenders (if any):
No Horizon 2020 tenders launched
Participation, including SMEs
Total number of participations in projects funded and retained for funding: 729
of which
% of SMEs: 36%
% of private for profit: 61%
6 Expected value once 29 projects stemming from Call 2016 will be signed.
7
FOREWORD When in October 2015, I was appointed Executive Director of the Bio-based Industries Joint Undertaking (BBI JU), I felt truly honoured to be joining the most ambitious initiative ever launched in the EU to develop a competitive and sustainable bio-based industry.
The BBI JU was created with the ambition to increasing investments in the development of build a bio-based industry in the EU, and thus keeping the investments in Europe in order to create new jobs – most of them in the rural areas – and value to our citizens. Its vision for a Europe leading the transition towards a post-petroleum society is expected to replace by 2030, 30% of fossil-based chemicals and materials by bio-based ones and consequently reduce by 50% GHG emissions.
The BBI JU has been granted the responsibility of funding Research and Innovation (R&I) actions with a budget of € 3.7 billion leveraging private investment through public funding. But while de-risking investment and reaching critical mass is crucial, at the same time it has a key role in connecting the actors of this fragmented sector by aligning public and private strategies towards the development of a European bio-based economy.
2016 was a significantly important year for the BBI JU as it was its first one as an independent EU body. Five main priorities were set and achieved during its course. Firstly, a number of recruitments took place in order to staff BBI JU as well as trainings while targeting operational excellence by implementing all key processes, procedures and management tools. Secondly, as new organisation becoming an autonomous body we face issues that need to be solved up-front. The third priority was about all the actions to be implemented to build trust between and commitment from the public and the private partners, with common goals and well aligned strategies but with very different constraints. What gets measured gets done was the fourth priority. We fine-tuned and established strong, clear, reliable and agreed monitoring systems based on KPIs, surveys and reporting. We monitor four levels: BBI JU efficiency, the leverage effect of the financial contribution, the outcome of the programme and the socio-economic and environmental impact. Lastly, communicating about BBI JU: the 2016 Call for proposals had to be efficiently promoted while kick-starting the visibility building of the initiative through the development of a communication and stakeholder management strategy.
The 2016 Annual Activity Report (AAR) explains to the reader the mission and vision of BBI JU, describes the challenges and actions taken by BBI JU in the context of its objectives as well as the steps taken for monitoring their implementation. 2016 has been a busy and challenging year and BBI JU delivered impressive results.
Finally, I would personally like to thank the BBI JU team for their work and dedication, our colleagues from European Commission (EC) and Bio-based Industries Consortium (BIC) as well as our two advisory bodies the States Representatives Group (SRG) and Scientific Committee (SC) for their productive collaboration and forward thinking.
Philippe Mengal
Executive Director BBI JU
8
About Bio-based Industries Joint Undertaking (BBI JU)
The Bio-based Industries Joint Undertaking (BBI JU) was established on 6 May 2014 by Council Regulation No 560/2014, which was published in the Official Journal (OJ) on 7 June 2014, and which entered into force on 27 June 2014. The BBI JU is the body entrusted with the implementation of the public-private partnership established between the European Union, represented by the European Commission (EC), and the Bio-based Industries Consortium (BIC). The joint undertaking combines a total contribution from both partners of at least € 3.705 billion (of which the EU contribution amounts to maximum € 0.975 billion), with almost 75% coming from industry. BBI JU aims to bring together all relevant stakeholders to establish innovative bio-based industries as a competitive sector in Europe, ranging from primary production, large industry, small and medium-sized enterprises (SMEs), clusters, trade associations, academia, research and technology organisations (RTOs) to end-users.
BBI JU’s mission is to implement the Strategic Innovation and Research Agenda (SIRA) developed by the Bio-based Industry Consortium (BIC) and endorsed by the European Commission on behalf of the European Union (EU). BBI JU operates its programme as the catalyst to enable the EU and industry to align their strategy and vision while respecting the principles of openness, transparency and excellence required for funding under the Horizon 2020 framework programme, through the annual Calls for proposals organised by BBI JU.
BBI JU’s objectives, and that of its founding members, are:
To contribute to the implementation of Regulation (EU) No 1291/2013 and in particular Part III of Decision 2013/743/EU;
To contribute to the development of a sustainable and competitive bio-based industry in Europe based on advanced biorefineries that source their biomass sustainably; and in particular to:
• demonstrate technologies that enable new chemical building blocks, new materials, and new consumer products from European biomass and which replace the need for fossil-based inputs;
• develop business models that integrate economic actors along the whole value chain from supply of biomass to biorefinery plants to consumers of bio-based materials, chemicals and fuels, including by means of creating new cross-sector interconnections and supporting cross-industry clusters; and
• set up flagship biorefinery plants that deploy the technologies and business models for bio-based materials, chemicals and fuels and demonstrate cost and performance improvements to levels that are competitive with fossil based alternatives.
9
About the bio-based industry sector in the EU
The emerging bio-based industrial sector is organised around interconnected value chains. It aims to transform renewable biological feedstocks like agricultural and forest residues, bio-waste, aquatic biomass into bio-based products, materials and fuels, so replacing their fossil-based versions. According to BIC, in 2013 the bio-based industry sector accounted for 3.2 million jobs in the EU Member States and for a total turnover of € 600 billion, making it a cornerstone of the bioeconomy.
Bio-based industry is considered as an emerging sector which is extremely fragmented across geographical areas and organisations, therefore making it risky to invest in. It also faces specific challenges related to feedstock supply, and inadequate logistical infrastructure for moving feedstock from its original location to the biorefinery. The biorefineries require large, risky investment and the sector is faced with hurdles around regulation on several levels of the value chains.
In 2012, the EC conducted a public consultation as part of the impact assessment of the initiative. From the 638 answers received, 94.3 % recommended setting up a pan-EU initiative and the large majority requested that this should be set up as an institutional public-private partnership (PPP) between the EU and bio-based industry. The impact assessment concluded that a joint undertaking (JU) sharing the risks between public and private sectors was the way forward to:
• de-risk investment at all levels from research to full-scale deployment; • organise the sectors by building bridges and collaborations between actors that
were not collaborating in the past; • reach a critical mass at European level where a single country or a small group of
organisations are not big enough to address those strategic challenges.
10
EXECUTIVE SUMMARY The priorities for the BBI JU in 2016 focused on building the organisation in terms of team, tools and processes, together with the promotion and the management of ongoing Calls. Grant agreements for projects from Calls 2015.1 and 2015.2 were concluded in time over the course of 2016, enabling the BBI JU portfolio to reach 36 projects. The 29 retained proposals from Call 2016 were at the grant agreement preparation stage by the end of 2016. By early 2017, the BBI JU programme will have a portfolio of 65 ongoing projects with a total of 729 Participants from 30 countries for a total grant value so far of € 414 million, from the total Call amount of € 417 million for the three Calls published up to and including 2016.
The objectives for 2016 presented to the BBI JU Governing Board were organised around five priorities:
• building the organisation and target operational excellence; • Addressing main key outstanding regulatory and procedural issues from the start-up
phase; • Implementing well aligned strategies set by the founding members; • establishing strong, clear and reliable KPIs and reporting; • building visibility and recognition for the initiative.
Building the organisation and target operational excellence
During 2016, the BBI JU Programme Office continued to build the organisation initiated in 2015 towards operational excellence. By the end of 2016, the Programme Office team was almost complete, with 20 staff members out of a possible 22 employed in posts allocated to the joint undertaking in the Staff Establishment Plan. In particular, the Head of Finance and Administration joined the organisation in June and the Head of Programme joined in September 2016. Human Resources (HR) management continuously strengthened the legal framework for the programme team, with particular emphasis on how the implementing rules of the European Commission are implemented and respected by the joint undertaking including the management of risk of conflict of interest. BBI JU values the continuous development of its staff in order to ensure that staff members are competent in their roles and can respond to changing requirements. A learning and development framework was devised in 2016 with an emphasis on improving competencies and the career development of individuals. By the end of 2016, the majority of the Programme Office staff was in place, and sharing common corporate values, clearly understanding their mission, and with their tasks, objectives and training plans formalised.
BBI JU shares an ICT infrastructure with other joint undertakings located in the same building. In 2016 BBI JU adopted the Common IT Strategy and participated in the implementation of the Common IT Work Program. BBI JU also started the process to adopt
11
two EC corporate IT tools: ARES for document and records management and Sysper for HR management.
The Programme Office has been responsible for managing the administrative budget since BBI’s autonomy was granted at end October 2015. Its implementation still reflects some aspects inherited from the start-up phase of the organisation. In particular the surplus deriving from an over-budgeting of staff costs for 2015 and 2016 has distorted the percentage execution of the 2016 administrative budget, as the surplus was much too large to be absorbed in one year. This situation is currently under discussion with the founding members and will be addressed through budget adjustments in the coming years.
Execution of the operational budget made satisfactory progress in 2016. Three grants for the 2015.1 Call resulted in a consumption of 73.7% of commitment appropriations, while the unused operational commitment appropriations from 2015 (€ 26 million) were reactivated in 2016 to top up the 2016 Call. From the 2015.2 Call, 23 grants resulted in a 99.0% execution of commitment appropriations. The 2016 Call was committed for € 188.9 million and was evaluated successfully by the end of 2016, resulting in a potential consumption of 98% of commitment appropriation if all grants are signed in 2017. Unused appropriations totalling € 4.5 million (€ 1.4 million from 2015 and € 3.1 million from 2016) will be reactivated in 2017 via a budgetary amendment. In respect of payment appropriations, the Programme Office achieved 97% execution overall. For administrative expenditure execution was 57% because of the impact of the large surplus brought forward from 2015 (see comments above).For operational expenditure execution was 100% represented by pre-financing payments for the grants of Calls 2015.1 and 2015.2. These payments were executed within an average time to pay (TTP) of eight days and 25 out of 26 payments were on time, with one payment delayed by one day.
The key business processes were analysed, aligned and described through Standard Operating Procedures (SOPs) to complete tasks and achieve objectives while respecting rules and policies. Each business process implemented by the Programme Office (under Horizon 2020 activity) is led by a business process owner (BPO) and its deputy. The BPO, serving the whole R&I family (including the BBI), assumes overall responsibility for that specific business process. The BBI JU has also delegated its staff members to the Key User Groups of the relevant services to be able to closely follow and provide feedback on the new features implemented in the Horizon 2020 Grant and Expert IT management systems. At the end of 2016, the wider organisational infrastructure is in place, following best practices and using project management and activity planning tools.
Addressing main key outstanding regulatory and procedural issues
Starting at the beginning of 2016, three key issues were identified which needed to be addressed in 2016:
12
• process, the legal framework and the efficiency of the financial (in-cash) contribution to operational costs in the form of financial transfers between partners in projects;
• lack of in-kind operational (IKOP) documented reporting procedure; • lack of methodology for in-kind additional activities (IKAA) planning and reporting.
Since the current BBI JU Council Regulation only allows financial (in-cash) contributions to operational costs at programme level to be taken into account towards the target provided for in Article 12(4) of the BBI JU Statutes, the legal framework that would take into account in-cash (financial contributions) between beneficiaries still has to be established. A task force composed by BBI JU, BIC and the EC was set up in 2016 to propose a solution to the BBI JU Governing Board. In parallel, a procedure to amend the Council Regulation was launched in 2016 and is ongoing.
The amendment7, if swiftly approved by the Council in 2017, would allow financial contributions at project level and contribute to reaching the investment targets set for the BBI JU. The task force will continue working on how to organise future Calls for proposals with specific topics aimed at delivering financial contributions at project level.
The in-kind contribution to operational costs (IKOP) represents the costs incurred by members other than the Union or their constituent entities in the implementation of indirect actions, less the contribution of the BBI JU and any other Union contribution to those costs. The IKOP reporting procedure, aligned with those ones adopted by the other joint undertakings, will be finalised and is planned to be adopted by the BBI JU Governing Board in early 2017. The 2016 IKOP report, presented to the GB on 31 January 2017 in line with article 4.3 of the BBI JU Council Regulation, was based on the estimation of in-kind contributions to operational costs made by BIC members participating in BBI JU’s projects for costs incurred during the implementation of the projects during the year 2016.
BBI JU founding members were finalising the methodology at the end of 2016 for the planning and reporting of the in-kind contribution to additional activities costs (IKAA). This methodology will clarify the working methods of the members to approve the content of the IKAA plan. The Governing Board endorsed the first IKAA report in December 2016. This report presents the amounts of IKAA that were delivered during the period 2014 to 2015 and the total amount of private investment corresponding to this is € 291 million (certified by an independent auditor). Furthermore, BIC presented a draft IKAA plan for 2016 to the BBI JU GB in July 2016.
Implementing well aligned strategies set by the founding members
The implementation of well-aligned strategies and action plans agreed by building of trust and commitment between the BBI JU’s founding members – the EU (represented by the EC) and BIC – is critical for a public private partnership (PPP) to reach its objectives. This was reached through three main achievements:
7 COM (2017) 68 final
13
The outcome of Calls 2015.2 and 2016, in combination with the outcome of previous Calls, demonstrated that the programme is delivering in line with its objectives and with the Strategic Innovation and Research Agenda (SIRA). With the inclusion of the proposals under grant agreement preparation from Call 2016, the BBI JU portfolio will reach 65 ongoing projects in Q2/2017 with a total of 729 participants from 30 countries for a total grant amount of € 414 million. This portfolio of projects shows a good coverage of the value chains, whereas the distribution per type of action deviates slightly from the one announced in the SIRA. In particular the mobilisation of bio-wastes from municipal waste and by-products from the agri-food chain is better covered by Call 2016 than before. There is still room for improvement regarding the geographic distribution of beneficiaries, but the statistics of Call 2016 show the positive impact of the widening participation strategy adopted by BBI JU. SME participation is also already at a good level, with 36% of BBI JU beneficiaries falling under the category of SME. Finally the first reporting of ongoing projects on the expected outcomes delivered at the end of 2016 showed that all key performance indicators are already being met at a higher than expected level after the first three years’ Calls.
During 2016 BBI JU’s objectives were aligned with its founding members towards a common goal and agendas were synchronised, while taking into account the specific legal and strategic constraints of each other. The commitment of industry towards the initiative was confirmed in 2016 through an increased BIC membership, particularly of brand owners, companies that are critical for the initiative as they can promote bio-based products towards end consumers. The Call 2016 also showed an increased participation with 103 proposals, which is 25% more than for the two Calls of 2015. Taking into account that more topics were published for the 2016 Call, this represents a stabilisation of the number of proposals to around 3.8 proposals per topic compared to 2015 Calls. By 2017, BBI JU will have six ongoing flagship projects, compared to the SIRA objective of five flagship projects by 2020.
Considering the quality of the proposals received, with 53% of proposals above threshold, and the growing interest of industry to invest in Europe, we can state that the EU is becoming an attractive area encouraging investment in bio-based industries. The crucial indicator of the industry commitment in the initiative is the leverage effect of private sector financial contribution vs. EU funding. The programme expects industry contributions of € 2.8 for every € 1 of public contribution.
The projections based on the only investments announced by the private partners in BBI JU projects show a significantly higher ratio of more than € 4 private investment for each € 1 of public money, taking into account the outcome of the Calls by the end of 2016. There is already € 291 million of certified additional activities for the period 2014-2015 and an estimated8 € 533 million more of IKAA reported to have been incurred in the provisional 2016 report. The total contribution from the industry seems on the right track because IKAA results seem by far better than expected.
8 Estimation done by BIC and communicated to the GB in accordance with article 4.3 of the BBI JU
Council Regulation
14
Establishing strong, clear and reliable KPIs and reporting
The Key performance Indicators (KPIs) dashboard and reporting procedure were finalised in 2016 by the two founding members, the EU (represented by the EC) and BIC, and its two advisory bodies, the Scientific Committee (SC) and the State Representatives Group (SRG). The progress of the programme is monitored at four levels:
• Programme Office efficiency monitored against Horizon 2020 KPIs common to JUs and cross-cutting KPIs;
• project portfolio outputs, through KPIs described in the SIRA, reported annually by project coordinators;
• yearly monitoring of the leverage effect of private investment through public funding;
• monitoring of expected socio-economic and environmental impacts through surveys to be performed as from 2017 and a process to be adjusted with founding members according with the reliability of available data.
The efficiency monitoring is based on Horizon 2020 KPIs common to all joint undertakings and on additional indicators linked to programme monitoring and cross-cutting issues, like gender dimension, widening participation, SME participation and private sector participation. They are fully developed in the AAR, showing a very high level of efficiency of the Programme Office with all indicators at the expected levels. In particular, Time to Inform (TTI), Time to Grant (TTG) and Time to Pay (TTP) all showed a significant improvement.
Project outcomes monitored through seven KPIs described in the SIRA are measured against yearly project reporting in terms of new cooperation, new cross-sector collaborations, new bio-based building blocks, new consumer products and new large-scale biorefineries. They were reported for the first time in 2016, and without any exception all KPIs already showed better results compared to agreed objectives.
BBI JU’s ongoing projects from Calls 2014 and 2015 reported the following expected outputs:
• 146 cross-sector interconnections by 2020 which is already higher than the target of 36 interconnections announced in the SIRA for the seven Calls between 2014 and 2020, showing the impact of BBI JU in accelerating the cross-sectorial integration along and across value chain faster than expected.
• 82 new or optimised bio-based value chains by 2020, which is already greater than the target of ten announced in the SIRA for the seven Calls between 2014 and 2020. It confirms the significant structuring effect of the BBI JU programme and the fact that the future of the sector is also about the creation of a network of more new interconnected value chains than initially estimated.
15
• 46 new bio-based building blocks based on biomass from European origin by
2020, which is already much higher now than the target of five new building blocks announced in the SIRA for the seven Calls between 2014 and 2020.
• 106 new bio-based materials by 2020, which is greater than the target of 50 announced in the SIRA for the seven Calls between 2014 and 2020.
• 47 new demonstrated consumer products based on bio-based chemicals by 2020, which is already better than the target of 30 announced in the SIRA for the seven Calls between 2014 and 2020.
This first reporting also confirms the expected impact of the initiative in bridging the gap between the research and the market.
• As stated in the SIRA, by 2030 it is expected that the bio-based industrial sector will generate 700 000 skilled and non-skilled jobs (base figures taken from 2012), 80% of them being in rural areas. This will regenerate underdeveloped and/or abandoned regions and will grow and diversify farmers’ income. It will enable the EU to reduce its dependency upon the import of raw materials like fossil-based raw materials and protein for animal feed. It is expected that 30% of fossil-based products will be replaced by bio-based ones with the consequence of reducing greenhouse gas emissions (GHG) by 50%. These expected socio-economic impacts will be assessed through socio-economic and environmental impacts surveys to be launched in 2017.
Building visibility and recognition for the initiative
The year 2016 was a critical year for structuring BBI JU’s communication strategy. The communication objectives set at the beginning of 2016 were to increase the visibility and reputation of the organisation, by specifically focusing on the promotion of the 2016 Call for proposals, and explaining potential synergies with the wider EU funding environment to all potential participant groups. The communication policy, strategy and stakeholder mapping were all developed during 2016, in collaboration with the founding members (BIC and EU through DG RTD), and assisted by external communication experts. They provided the roadmap for setting out BBI JU’s long-term communication goals.
BBI JU held its third Info Day on 21 April 2016 in Brussels. More than 530 participants registered for the event and 305 participants attended in person. More than 80 participants joined via the live web-streaming. This total attendance represented an increase of 25% compared with the 2015 BBI Info day. Participants came from more than 40 different member states and associated countries. In addition, more than 600 face-to-face meetings were scheduled through the BBI JU Partnering Platform. Some 270 users of BBI JU’s partnering platform actively updated their profiles for the event and 50 participants used the partnering platform on site for the first

16
time. Media Consultant handled media coverage of the event, which resulted in 11 articles or citations in the media/press.
The Programme Office staff also participated in 15 national Info Days across Member States and associated countries in 2016, compared with participation in four similar events in 2015. The BBI Initiative and programme were presented at 34 further events as guest speaker, session organiser, or as event co- or sole organiser.
Specific communication actions were organised in 2016 to support the widening participation strategy and the management of synergies with other programmes, for example the initiative taken by BBI JU to establish a joint working group between BBI JU and SPIRE. BBI JU also widened stakeholder engagement in the programme by targeting priority stakeholders like SMEs, regions and underrepresented areas and sectors using outreach activities with these groups. In order to improve the visibility and recognition of the value of the bio-based industries, BBI JU also informed key influencers about the programme to widen support amongst policy makers using specific tailored and targeted actions.
The website continued to provide access and an entry point to BBI activities for around 68 497 unique visitors during the year. This is similar to website traffic for 2015. There were peaks of activity around the Open Info Day and the key BBI JU events in September and October. The home page, the Call 2016 page and project pages saw the highest number of visits. The Programme Office made some significant developments on the website, including re-launching the SRG and SC ‘Members’ areas, new design and content for BBI project pages, and the addition of a project coordinators dedicated page.
The Programme Office embraced social media during 2016 to reach a wider audience. Activity on Twitter via the @BBI2020 account was followed by more than 1 280 users by December 2016, increasing from 198 followers recorded by February 2016. @BBI2020 tweeted 175 messages and retweets which resulted in reaching 185 436 accounts, and saw active engagement by followers more than 2 500 times. A Linked In group and corporate page were launched in May. The Linked In group/page was one of the channels used to promote the 2016 Call and vacancies at the Programme Office in addition to the exposure given on the public website.
At the end of 2016, BBI JU is significantly more visible than ever before and receiving recognition from key stakeholders, as an efficient and successful example of a joint undertaking.
As a conclusion, BBI JU achieved the majority of its objectives in 2016, and in some cases surpassed them. For 2017, the Programme Office will be faced with different and new challenges linked mainly with the fact that the organisation will be running its operations at full speed. This is largely due to a project portfolio multiplied by four in one year and many activities to be performed for the first time in 2017.
Consequently the five priorities in 2017 will be to:
• Operate the Programme Office successfully at maximum operational capacity; • Continue to build an effective and well-balanced project portfolio; • Confirm the industry commitment to the overall initiative;

17
• Reinforce operational excellence thanks to successful reporting and audits; • Move the BBI JU’s corporate image from awareness to reputation and recognition.
18
1. IMPLEMENTATION OF THE ANNUAL WORK PLAN 2016
1.1. Key objectives 2016 and associated risks
1.1.1. Overall operational objectives from AWP 2016 The Call 2016 focused on the need to better integrate biomass feedstock suppliers on the front end of the chain to create a demand for biomass feedstock from biorefining processes. Similarly, the Call 2016 aimed to stimulate the formation of partnerships with end market actors to create a ‘market pull’ for bio-based products for identified applications.
Thus, the Call 2016 started to move away from a strict biomass feedstock ‘push’ based on the traditional value chains, towards a demand for biomass to enable processing to respond adequately to a ‘pull’ from the end markets.
The Call 2016 retained the four strategic orientations from 2015, but linked them in a matrix with three ‘vertical’ orientations and a ‘horizontal’ one, cutting across the three vertical ones. The strategic orientation ‘Cross-sectorial integration along and across value chains’ is the base mode of operation for the bio-based industry in Europe, cross-cutting the following ‘vertical’ orientations’:
1. ‘Sufficient and sustainable biomass feedstock supply’ at affordable prices, incorporating the feedstock suppliers as partners in the value chains;
2. ‘Development of biorefinery technologies’ and processes to increase the competitive position of the bio-based industries in Europe;
3. ‘Higher market demand and customer awareness’ through the development of innovative products and applications in partnership with actors in the end consumer markets and setting the framework for successful market uptake.
To promote the strategic orientation ‘Cross-sectorial integration along and across value chains’ as the base mode of operation in the bio-based industry in Europe, the AWP 2016 numbered its topics without a direct link to a specific (existing) value chain mentioned in the Strategic Innovation and Research Agenda (SIRA). It was expected that this would entice actors in different sectors into seeking partnership for preparing project proposals.
The implementation and achievement of the strategic orientations developed in the AWP 2016 are developed in the sections 1.2 and 1.3 of the current report.
1.1.2. Management objectives 2016 and achievements Each year the Executive Director presents his proposals of priorities for the coming year to the Governing Board. The priorities are translated into yearly objectives for the Programme Office, which are then cascaded into individual objectives for all staff members according to SMART principles (specific, measurable, accepted, realistic and time-related).
The priorities and objectives for 2016 were presented to the Governing Board on 11 April 2016. The priorities were mainly aimed at building the organisation: the team, its tools, processes and procedures while managing the two Calls for 2015. An important priority for

19
2016 was establishing the communication and stakeholder management strategy as well as performing communication activities to promote the BBI JU programme Call.
The objectives for 2016 were organised around five priorities summarised as follows:
• build the organisation and target operational excellence;
• solve main key issues from the start-up phase;
• build trust and commitment between founding members;
• establish strong, clear and reliable KPIs and reporting;
• build visibility and recognition for the initiative.
Achievements for 2016
Operational excellence is built into the day-to-day practices of the Programme Office team:
• The majority of the Programme Office staff is in place, with common values, clear
missions, tasks, objectives and training plans all formalised.
• Key business processes are well aligned and described through Standard Operating Procedures (SOPs) to complete tasks and achieve objectives while respecting rules and policies.
• The wider organisational infrastructure is now in place, following best practices and
using project management and activity planning tools.
Main key issues from the ‘start-up’ phase are now solved or on the way to be solved: • Ensuring the legal framework for financial contributions at project level from industry
partners needed addressing from the beginning of the programme BBI JU. A task force composed by BBI JU, BIC and the EC was set up in 2016 to find and propose a solution to the Governing Board. In parallel, a procedure to amend the Council Regulation was launched in 2016 and is ongoing. The amendment, expected to be approved in 2017, will allow ‘in-cash’ financial contributions to operational costs at project level to count towards the objective stated in the Council Regulation. The task force will continue exploring potential measures that would help and facilitate the delivery of financial contributions to operational costs, at project level.
• The in-kind contribution to operational costs (IKOP) reporting procedure, aligned with other joint undertakings will be finalised shortly and the Governing Board will endorse the procedure in early 2017.
• The BBI JU founding members have reached an agreement at working level on the methodology for in-kind contribution to additional activities costs (IKAA) planning and reporting. The methodology includes the procedure to assess the fulfilment of legal
20
criteria established in the Council Regulation. The Governing Board endorsed the first IKAA report in December 2016. This report presents the amounts of IKAA that were delivered during the period 2014 to 2015 and the total private investment amounts to € 291 million. The Bio-based Industries Consortium presented a draft IKAA plan for 2016 to the BBI JU GB in July 2016. End 2016 the final IKAA plan was not yet approved but it anticipates a good confirmation of the mobilisation of private investments.
Alignment on priority setting between BBI JU founding members was smooth during 2016, enabling well-aligned strategies and action plans through:
• Delivering the expected portfolio of project from Calls 2015.2 and 2016
demonstrating the programme is delivering in line with the Strategic Innovation and Research Agenda (SIRA).
• Aligning objectives and synchronising agendas towards a common goal, while taking into account each other’s specific legal and strategic constraints.
• Confirming the commitment of industry towards the initiative through an increased BIC membership, the increased participation in the Call, together with the high quality of proposals received and the attendance of C-level executives at key bio-economy events.
The key performance Indicators (KPIs) dashboard and reporting procedure is in place at four levels:
• Measurement of project portfolio outputs, through the review of KPIs at level 2 (as
described in the SIRA), is reported annually by project coordinators. The Programme Office has completed the KPI report for 2016, as shown in section 1.3.1.
• The Programme Office established its efficiency monitoring against Horizon 2020 KPIs through quarterly reporting, as shown in section 1.3.1.
• The Programme Office is reporting in-kind contributions made to its projects (IKOP) and in-kind contributions made to additional activities (IKAA) by BIC members on an annual basis to monitor the leverage effect of private investment through public funding. The details of the reported IKOP and IKAA and the calculation of the leverage effect are described in section 1.7.
• The monitoring of expected socio-economic and environmental impacts will be performed through surveys to be performed as from 2017 and a process to be adjusted with founding members according with the reliability of available data.
The BBI JU programme is significantly more visible and is receiving recognition from key stakeholders, as an efficient and successful example of a joint undertaking through:
21
• a review of BBI JU’s corporate identity, development of key messages and the development and implementation of a first set of high impact communication tools;
• the high priority given in 2016 to the participation of the Programme Office to a wide range and large number of relevant events to diffuse key messages about the programme’s mission and objectives, and to promote participation in BBI JU’s 2016 Call;
• the development of the communication and stakeholder management strategy, including priority stakeholder mapping, development of key communication tools and an ambitious communication action plan, included in the Annual Work Plan 2017;
• communication actions to support the widening participation strategy, the management of synergies with other programmes, for example the initiative taken by BBI JU to establish a joint working group between BBI JU & SPIRE.
1.1.3. Associated risks The Programme Office conducted a risk assessment, including preventive and mitigating actions, to identify the main operational risks associated with its activities in 2016. None of the risks materialised and the experience gained during the assessment process proved valuable for developing the identification and management of risks in the risk management process, as detailed in section 4.6 below, and for further improving the effectiveness of the relevant internal control systems, as detailed in section 4.7 below.
1.2. Research & Innovation activities The mission of BBI JU is to implement, under Horizon 2020 rules, the Strategic Innovation and Research Agenda (SIRA) developed by the industry, by organizing Calls for proposals to support research, demonstration and deployment activities enabling the collaboration between stakeholders along the entire value chains covering primary production of biomass, processing industry and final use.
The section below provides an overview of the status of BBI JU’s achievements so far, with respect to the implementation of its Annual Work Plan and the management of its project portfolio, in addition to its contributions to the further development of the SIRA.
1.2.1. Strategic Innovation and Research Agenda (SIRA)
The BBI JU aims at realising the bio-based industry vision by focusing on the development of EU-based value chains while accelerating the transition to advanced biorefineries.
The overall strategic orientation of BBI JU is outlined in the Strategic Research and Innovation Agenda (SIRA), which has been developed by industry based on extensive consultation with public and private stakeholders. The current SIRA was finalised in March 2013 and endorsed by the European Commission. It sets out BBI JU’s priority areas for
22
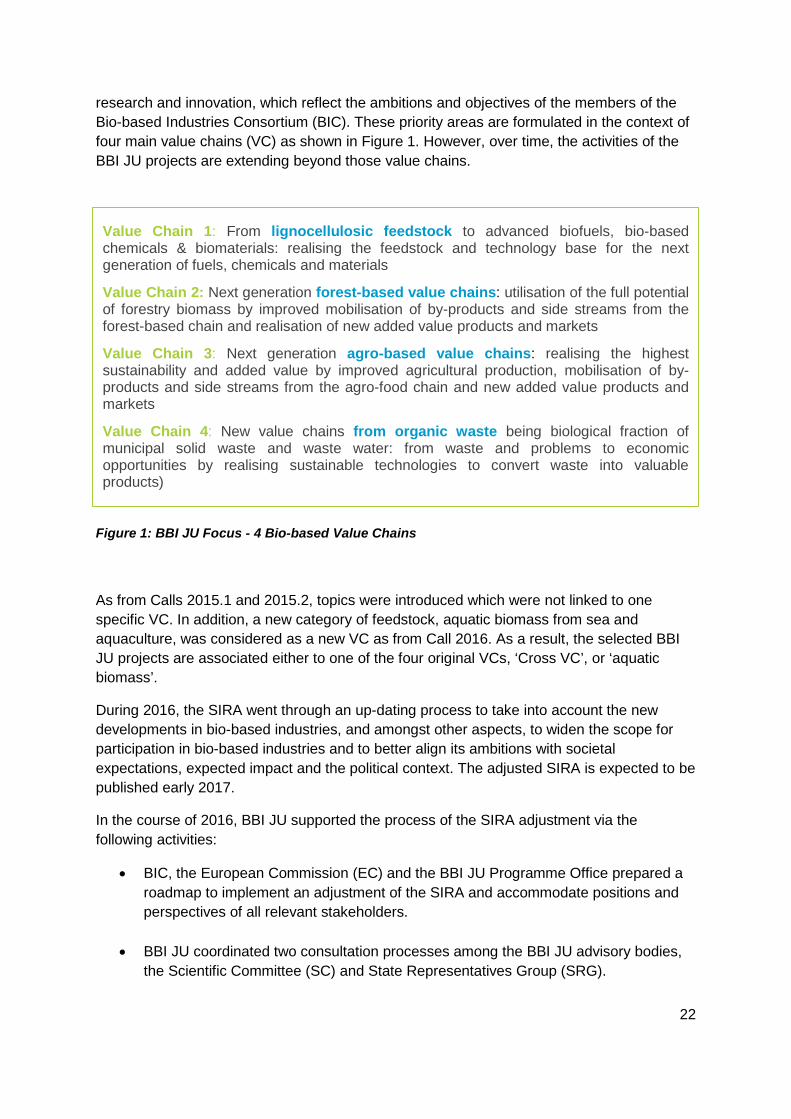
Value Chain 1: From lignocellulosic feedstock to advanced biofuels, bio-based chemicals & biomaterials: realising the feedstock and technology base for the next generation of fuels, chemicals and materials
Value Chain 2: Next generation forest-based value chains: utilisation of the full potential of forestry biomass by improved mobilisation of by-products and side streams from the forest-based chain and realisation of new added value products and markets
Value Chain 3: Next generation agro-based value chains: realising the highest sustainability and added value by improved agricultural production, mobilisation of by-products and side streams from the agro-food chain and new added value products and markets
Value Chain 4: New value chains from organic waste being biological fraction of municipal solid waste and waste water: from waste and problems to economic opportunities by realising sustainable technologies to convert waste into valuable products)
research and innovation, which reflect the ambitions and objectives of the members of the Bio-based Industries Consortium (BIC). These priority areas are formulated in the context of four main value chains (VC) as shown in Figure 1. However, over time, the activities of the BBI JU projects are extending beyond those value chains.
Figure 1: BBI JU Focus - 4 Bio-based Value Chains
As from Calls 2015.1 and 2015.2, topics were introduced which were not linked to one specific VC. In addition, a new category of feedstock, aquatic biomass from sea and aquaculture, was considered as a new VC as from Call 2016. As a result, the selected BBI JU projects are associated either to one of the four original VCs, ‘Cross VC’, or ‘aquatic biomass’.
During 2016, the SIRA went through an up-dating process to take into account the new developments in bio-based industries, and amongst other aspects, to widen the scope for participation in bio-based industries and to better align its ambitions with societal expectations, expected impact and the political context. The adjusted SIRA is expected to be published early 2017.
In the course of 2016, BBI JU supported the process of the SIRA adjustment via the following activities:
• BIC, the European Commission (EC) and the BBI JU Programme Office prepared a roadmap to implement an adjustment of the SIRA and accommodate positions and perspectives of all relevant stakeholders.
• BBI JU coordinated two consultation processes among the BBI JU advisory bodies, the Scientific Committee (SC) and State Representatives Group (SRG).
23
Recommendations received from SC and SRG have been implemented in the revised SIRA.
• In February 2016, the Programme Office held a key performance indicators (KPIs) session during a project coordinators’ meeting with the first ten ongoing projects (Call 2014). During the workshop, the coordinators provided feedback on possible improvements regarding the definition of KPIs in the SIRA. BBI JU forwarded the coordinators’ recommendations to BIC and the input has been included in the revised SIRA and KPIs. The latter will form part of BBI’s ongoing reporting and monitoring activities.
• In March 2016, BIC, together with the BBI JU Programme Office, held a SIRA workshop with external experts to collect recommendations for adjusting the SIRA (content and structure). Eight experts from industry, academia and governments reviewed the collected input from BIC’s members, the SC, the SRG and other stakeholders. On this basis, and combined with their expert opinion, the participants formulated recommendations regarding the SIRA and its use. The recommendations influenced the final design of the revised SIRA.
• BBI JU supported BIC by drafting the section dealing with the KPIs in the revised SIRA.
BBI JU types of actions and scale of impact of projects (Technology Readiness Level)
The BBI JU programme is implemented via four types of actions as defined in the Annual Work Programmes:
• Research and Innovation Actions (RIAs); • Innovation Actions, namely Demonstration Actions (DEMOs) and Flagship Actions
(Flagships); • Coordination and Support Actions (CSAs).
Each of these actions (except CSAs) corresponds to a different Technology Readiness Level (TRL) (Figure 2). The TRL scale is used as a tool for decision making on research, development and innovation investments at EU level. It was developed to enable the assessment of the maturity of a particular technology and the consistent comparison of maturity between different types of technologies.
RIAs cover various activities to develop (TRL 3) or validate (TRL 4-5) technologies to fill gaps in value chains and enable new bio-based chemical building blocks, new bio-based materials, and new bio-based ‘consumer products’ or applications.
24
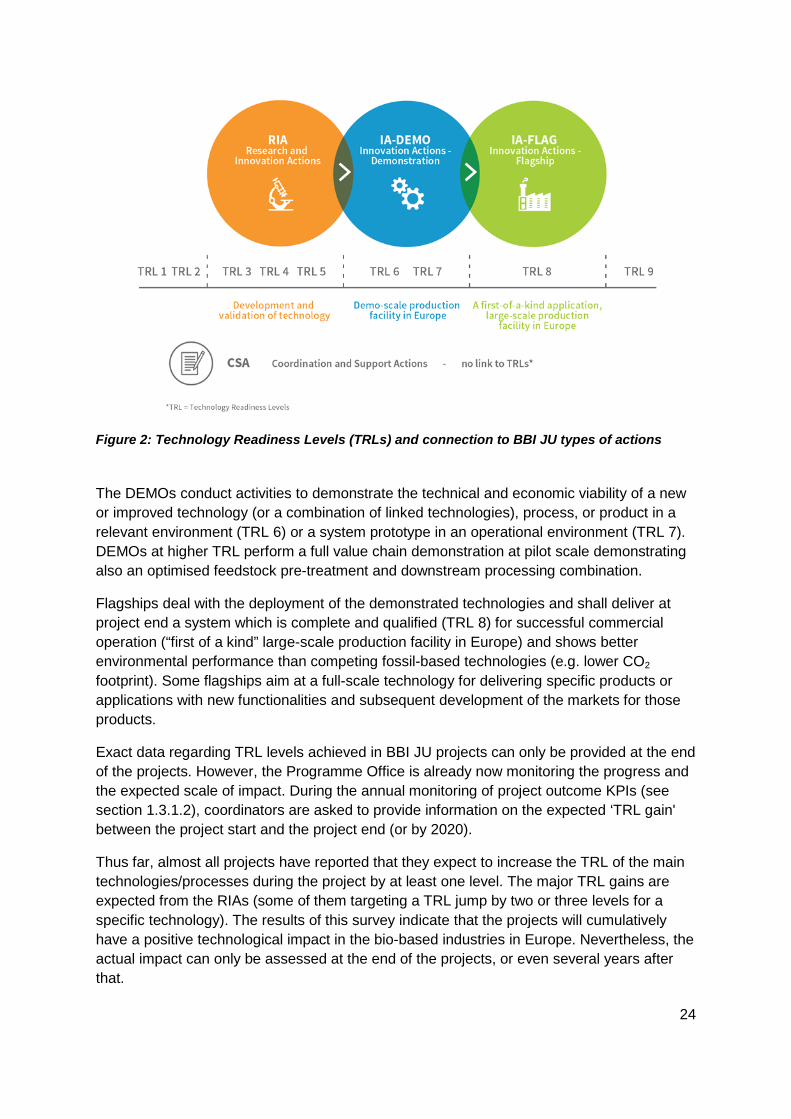
Figure 2: Technology Readiness Levels (TRLs) and connection to BBI JU types of actions
The DEMOs conduct activities to demonstrate the technical and economic viability of a new or improved technology (or a combination of linked technologies), process, or product in a relevant environment (TRL 6) or a system prototype in an operational environment (TRL 7). DEMOs at higher TRL perform a full value chain demonstration at pilot scale demonstrating also an optimised feedstock pre-treatment and downstream processing combination.
Flagships deal with the deployment of the demonstrated technologies and shall deliver at project end a system which is complete and qualified (TRL 8) for successful commercial operation (“first of a kind” large-scale production facility in Europe) and shows better environmental performance than competing fossil-based technologies (e.g. lower CO2 footprint). Some flagships aim at a full-scale technology for delivering specific products or applications with new functionalities and subsequent development of the markets for those products.
Exact data regarding TRL levels achieved in BBI JU projects can only be provided at the end of the projects. However, the Programme Office is already now monitoring the progress and the expected scale of impact. During the annual monitoring of project outcome KPIs (see section 1.3.1.2), coordinators are asked to provide information on the expected ‘TRL gain' between the project start and the project end (or by 2020).
Thus far, almost all projects have reported that they expect to increase the TRL of the main technologies/processes during the project by at least one level. The major TRL gains are expected from the RIAs (some of them targeting a TRL jump by two or three levels for a specific technology). The results of this survey indicate that the projects will cumulatively have a positive technological impact in the bio-based industries in Europe. Nevertheless, the actual impact can only be assessed at the end of the projects, or even several years after that.
25
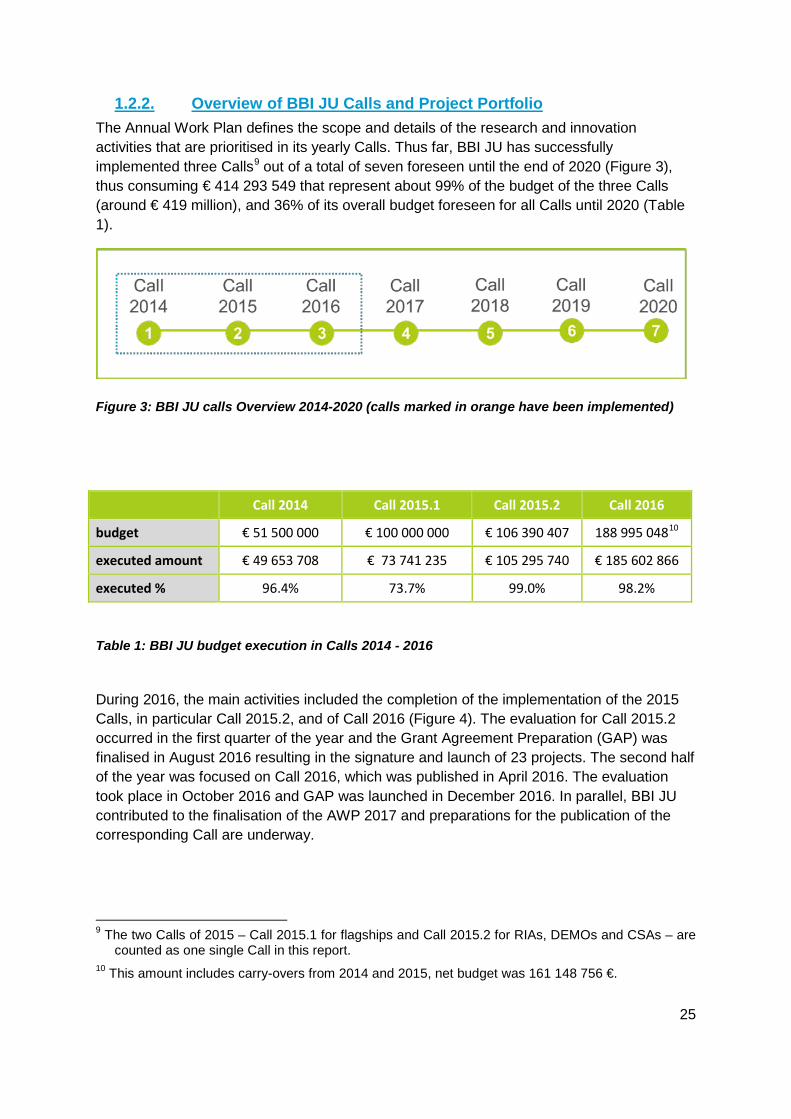
1.2.2. Overview of BBI JU Calls and Project Portfolio The Annual Work Plan defines the scope and details of the research and innovation activities that are prioritised in its yearly Calls. Thus far, BBI JU has successfully implemented three Calls9 out of a total of seven foreseen until the end of 2020 (Figure 3), thus consuming € 414 293 549 that represent about 99% of the budget of the three Calls (around € 419 million), and 36% of its overall budget foreseen for all Calls until 2020 (Table 1).
Figure 3: BBI JU calls Overview 2014-2020 (calls marked in orange have been implemented)
Call 2014 Call 2015.1 Call 2015.2 Call 2016
budget € 51 500 000 € 100 000 000 € 106 390 407 188 995 04810
executed amount € 49 653 708 € 73 741 235 € 105 295 740 € 185 602 866
executed % 96.4% 73.7% 99.0% 98.2%
Table 1: BBI JU budget execution in Calls 2014 - 2016
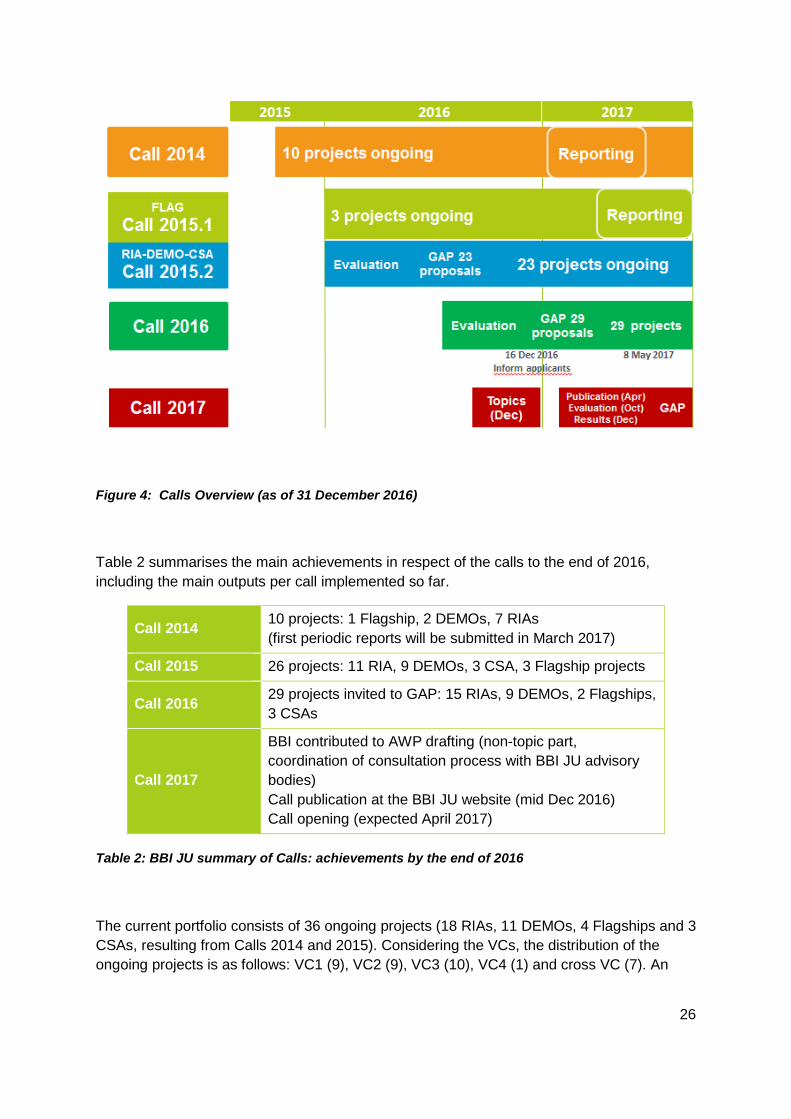
During 2016, the main activities included the completion of the implementation of the 2015 Calls, in particular Call 2015.2, and of Call 2016 (Figure 4). The evaluation for Call 2015.2 occurred in the first quarter of the year and the Grant Agreement Preparation (GAP) was finalised in August 2016 resulting in the signature and launch of 23 projects. The second half of the year was focused on Call 2016, which was published in April 2016. The evaluation took place in October 2016 and GAP was launched in December 2016. In parallel, BBI JU contributed to the finalisation of the AWP 2017 and preparations for the publication of the corresponding Call are underway.
9 The two Calls of 2015 – Call 2015.1 for flagships and Call 2015.2 for RIAs, DEMOs and CSAs – are
counted as one single Call in this report. 10 This amount includes carry-overs from 2014 and 2015, net budget was 161 148 756 €.
26
Figure 4: Calls Overview (as of 31 December 2016)
Table 2 summarises the main achievements in respect of the calls to the end of 2016, including the main outputs per call implemented so far.
Call 2014 10 projects: 1 Flagship, 2 DEMOs, 7 RIAs (first periodic reports will be submitted in March 2017)
Call 2015 26 projects: 11 RIA, 9 DEMOs, 3 CSA, 3 Flagship projects
Call 2016 29 projects invited to GAP: 15 RIAs, 9 DEMOs, 2 Flagships, 3 CSAs
Call 2017
BBI contributed to AWP drafting (non-topic part, coordination of consultation process with BBI JU advisory bodies) Call publication at the BBI JU website (mid Dec 2016) Call opening (expected April 2017)
Table 2: BBI JU summary of Calls: achievements by the end of 2016
The current portfolio consists of 36 ongoing projects (18 RIAs, 11 DEMOs, 4 Flagships and 3 CSAs, resulting from Calls 2014 and 2015). Considering the VCs, the distribution of the ongoing projects is as follows: VC1 (9), VC2 (9), VC3 (10), VC4 (1) and cross VC (7). An
27
additional 29 projects are currently in grant agreement preparation (GAP) as a result of Call 2016 (see table 2).
The 2016 AWP topics refocused on the need to integrate biomass feedstock suppliers on the front end of the chain better to create a demand for biomass feedstock from biorefining processes. Similarly, the AWP aimed at stimulating further the creation of partnerships with end market actors to create a ‘market pull’ for bio-based products for identified applications. The ‘cross value chain’ approach in the recent Calls increases the opportunities to convert and valorise new, suitable feedstock into value-added chemicals and materials and leads to a diversification of the research and innovation (and product) portfolio of the involved project beneficiaries. The new orientation is very well reflected in the resulting project portfolio, which has become more diversified and almost doubled following the finalisation of Call 2016.
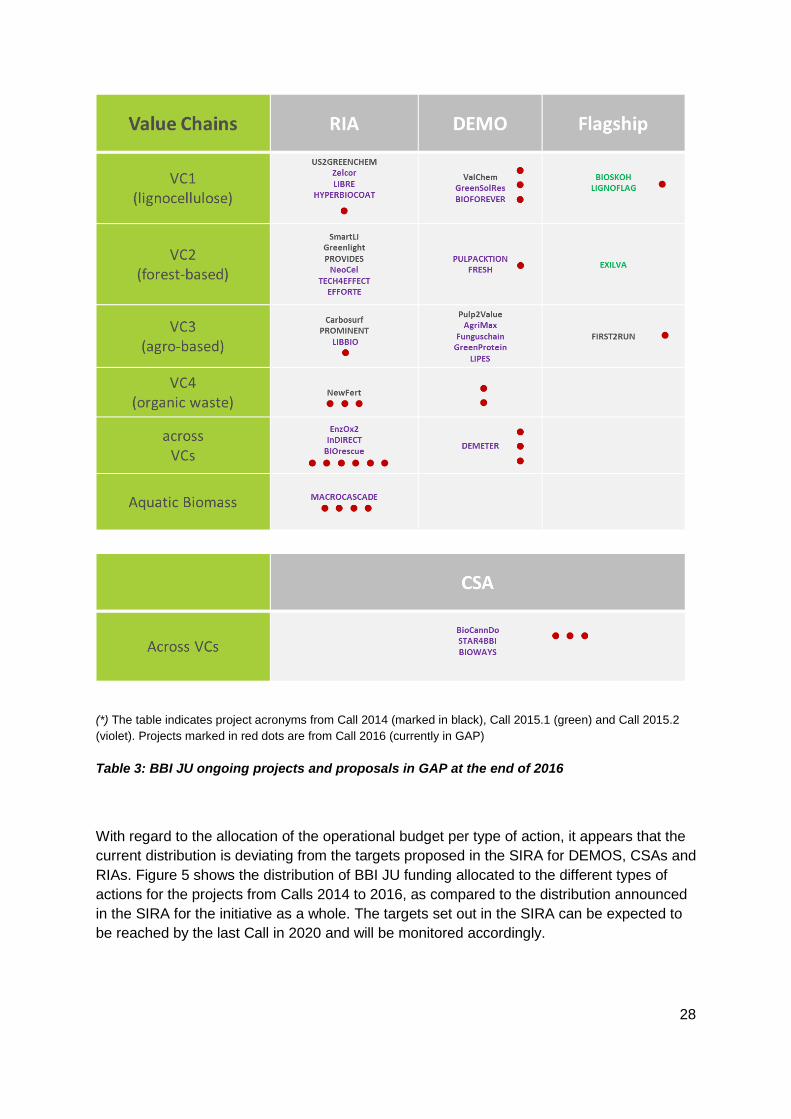
As shown in Table 3, BBI JU projects continue to fill the gaps in the various bio-based value chains as set out in the SIRA and at different levels of TRL. A clear re-enforcement of the aquatic biomass sector is also observed and the enhancement of inter-sectorial connections is more visible as indicated by projects, which have a scope of operations across several value chains.
Notably, with the successful finalisation of Call 2016, the BBI JU portfolio has gained two new DEMOs in VC4 as well as two more Flagships, one of which in VC3. The total number of Flagships is now six, while the SIRA estimated target was for five by the end of 2020. Moreover, the number of CSAs has increased with three additional ones as a result of Call 2016. Finally, it is important to note that early indications of the outcome of the projects are already available through annual monitoring of specific KPIs, at project level, developed by BBI JU (further details are provided in section 1.3.1.2).
28
(*) The table indicates project acronyms from Call 2014 (marked in black), Call 2015.1 (green) and Call 2015.2 (violet). Projects marked in red dots are from Call 2016 (currently in GAP)
Table 3: BBI JU ongoing projects and proposals in GAP at the end of 2016
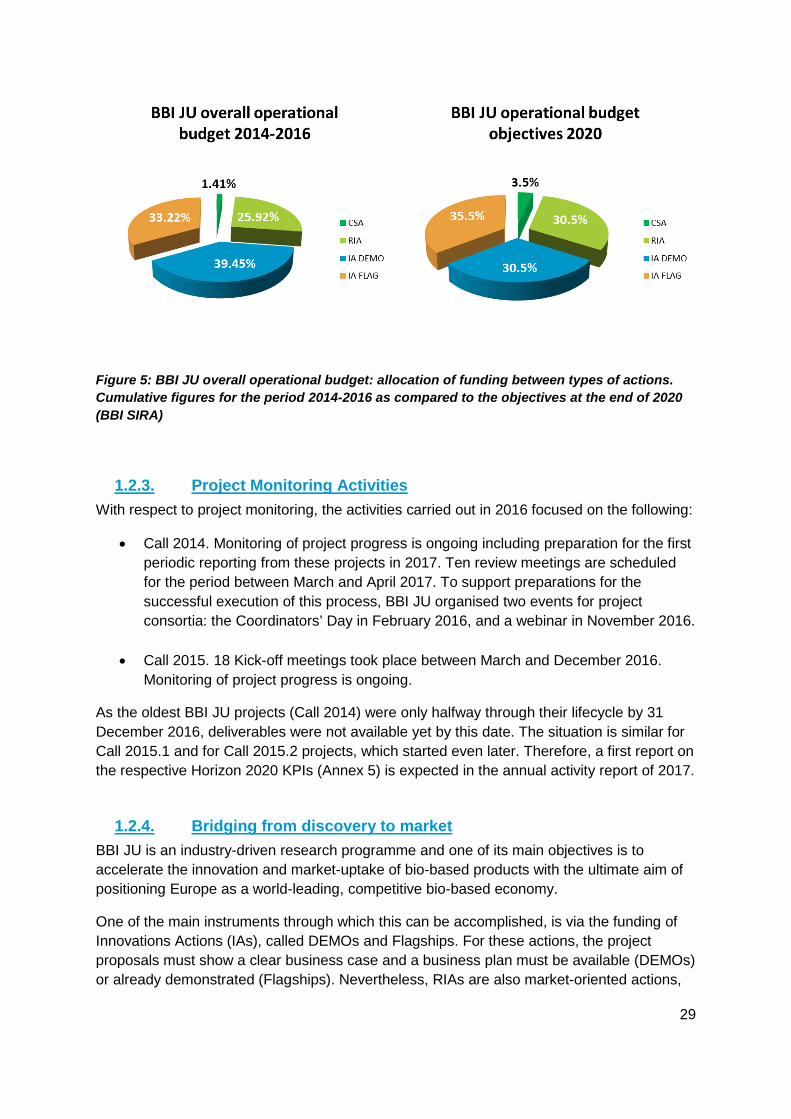
With regard to the allocation of the operational budget per type of action, it appears that the current distribution is deviating from the targets proposed in the SIRA for DEMOS, CSAs and RIAs. Figure 5 shows the distribution of BBI JU funding allocated to the different types of actions for the projects from Calls 2014 to 2016, as compared to the distribution announced in the SIRA for the initiative as a whole. The targets set out in the SIRA can be expected to be reached by the last Call in 2020 and will be monitored accordingly.
29
Figure 5: BBI JU overall operational budget: allocation of funding between types of actions. Cumulative figures for the period 2014-2016 as compared to the objectives at the end of 2020 (BBI SIRA)
1.2.3. Project Monitoring Activities With respect to project monitoring, the activities carried out in 2016 focused on the following:
• Call 2014. Monitoring of project progress is ongoing including preparation for the first periodic reporting from these projects in 2017. Ten review meetings are scheduled for the period between March and April 2017. To support preparations for the successful execution of this process, BBI JU organised two events for project consortia: the Coordinators’ Day in February 2016, and a webinar in November 2016.
• Call 2015. 18 Kick-off meetings took place between March and December 2016. Monitoring of project progress is ongoing.
As the oldest BBI JU projects (Call 2014) were only halfway through their lifecycle by 31 December 2016, deliverables were not available yet by this date. The situation is similar for Call 2015.1 and for Call 2015.2 projects, which started even later. Therefore, a first report on the respective Horizon 2020 KPIs (Annex 5) is expected in the annual activity report of 2017.
1.2.4. Bridging from discovery to market BBI JU is an industry-driven research programme and one of its main objectives is to accelerate the innovation and market-uptake of bio-based products with the ultimate aim of positioning Europe as a world-leading, competitive bio-based economy.
One of the main instruments through which this can be accomplished, is via the funding of Innovations Actions (IAs), called DEMOs and Flagships. For these actions, the project proposals must show a clear business case and a business plan must be available (DEMOs) or already demonstrated (Flagships). Nevertheless, RIAs are also market-oriented actions,
30
as they aim at filling specific gaps in the value chains and a relevant market potential must be described.
The two 2015 Calls for proposals (2015.1 and 2015.2) delivered twelve Grant Agreements for IAs, which represents half of the BBI JU projects signed in 2016. Those IAs receive 76% (€ 136 408 239) of the total BBI JU financial contribution allocated to projects in the reporting year.
Within the IAs, BBI JU Calls 2015 delivered nine Demos and three Flagships. The share of the DEMOs in the total BBI JU financial contribution 2016 was 35% (€ 62 667 239), whereas the share of flagships in the total BBI JU financial contribution was 41% (€ 73 741 235).
In 2016, three flagship projects were approved and signed covering two different value chains (VC1 lignocellulosic and VC2 forest based) as defined in the current SIRA. They are complementary to the first flagship project from Call 2014, signed in 2015, covering VC3 (agro-based).
1.2.5. Synergies with other initiatives The BBI JU has taken action to promote synergies with stakeholders regarding national and regional bioeconomy strategies, and other related EU programmes in areas such as education, environment, competitiveness and SMEs, and including the European Structural and Investment Fund (ESIF). The aim is to maximise the impact of the use of public funds, which can be used to help strengthen national and regional research and innovation capabilities in the context of smart specialisation strategies (S3). In 2016, BBI JU and BIC co-signed a letter of intent with eight Polish regions interested in developing their local bioeconomy capabilities, including Łódzkie Region, Małopolska Region, Mazowieckie Voivodeship, Pomeranian Voivodeship, Wielkopolska Region11. Complementarities between the BBI JU funding programme and ESIF represent an important opportunity for these regions, which have identified, among their priorities in the S3, activities oriented to support the bio-based industries. Other EU-supported programmes exist which could potentially overlap with the BBI JU programme. In order to avoid duplication, the Programme Office is working to promote synergies and avoid duplication with other public-private partnerships like SPIRE12. SPIRE’s activities cover the area of sustainable process industry through resource and energy efficiency. BBI JU initiated the creation of a joint working group between SPIRE and BBI JU, which plans to meet on a regular basis to coordinate topics under their respective Calls. A workshop organised by the European Commission to explore synergies with SPIRE took place in April 2016 and the official kick-off meeting of the Joint Working Group for BBI-SPIRE synergies, chaired by the BBI JU Executive Director, took place in September 2016. In this context, synergies, complementarities and ways to avoid unintended duplication of activities are sought, for example at the level of the preparation of the work plans to avoid 11http://www.bbi-europe.eu/news/bbi-ju-signs-letter-intent-develop-bioeconomy-partnerships-central-and-eastern-
regions-0 12https://www.spire2030.eu/
31
that similar topics are taken up in the AWP. Outreach activities to promote connections and networking between the SPIRE cPPP and BBI JU communities are also part of the tasks. In 2016, BBI JU has also started to explore synergies with FACCE SURPLUS13 (Sustainable and Resilient agriculture for food and non-food systems). It is an ERA-NET Cofund, formed between the European Commission and a partnership of 15 countries. FACCE SURPLUS is committed to improving collaboration across the European Research Area in the range of diverse, but integrated food and non-food biomass production and transformation systems, including biorefining. Future synergies and complementarities will be explored with other EU programmes as they arise.
1.3. Calls for proposals and grant information In the course of 2016, BBI JU operations have mainly focused on the implementation of AWP 2016 as well as the management of its growing project portfolio. The proposals from the Call 2015.2 were evaluated during the months of February and March 2016 and the resulting 23 grant agreements were signed between June and August 2016. Consequently, the portfolio of running projects grew from ten projects from Call 2014 to 36 running projects at the end of 2016.
The final ranking list was adopted by the BBI JU GB on 15 December 2016, the letter of information was sent to applicants on 16 December 2016, and the Grant Agreement Preparation process was initiated before the end of the year for 29 retained proposals, so that the portfolio of BBI JU is expected to reach 65 ongoing projects by May 2017.
The two sections below are structured as follows:
• Section 1.3.1 describes the current project portfolio, including the ongoing projects from Calls 2014, 2015.1&2 and projects invited to GAP as a result of Call 2016. The description covers the statistics and Key Performance Indicators (KPIs) which are common to all Horizon 2020 programmes as well as indicators specific to BBI JU.
• Section 1.3.2 describes the submission and evaluation statistics from Calls 2015.2 and 2016 together with some key lessons learned.
1.3.1. Progress against KPIs / Statistics The data in this section compares the progress of BBI JU against KPIs and statistics. It covers the current project portfolio to the end of 2016, including the ongoing projects from Calls 2014, 2015.1&2 and projects of Call 2016 invited to GAP. The progress of the BBI JU programme is monitored at four levels:
13http://faccesurplus.org/about-facce-surplus/
32
• Efficiency monitoring is based on Horizon 2020 KPIs common to all Joint Undertakings (JU)14 and further indicators linked to programme monitoring15 and cross-cutting issues, like gender dimension, widening participation, SME participation and private sector participation. More details are presented in section 1.3.1.1 below and in the tables in annexes 7.5 and 7.6.
• Project outcomes are monitored through level 2 KPIs described in the SIRA, measured against yearly project reporting and agreed objectives, in terms of new cooperation, new cross-sectors collaborations, new bio-based building blocks, new consumer products and new large scale biorefineries. More details in section 1.3.1.2 below.
• The leverage effect of private contribution versus public funding is monitored. For a public-private partnership the objective is to leverage private investment through public funding. For each € 1 of public money, it is expected that a minimum of € 2.7 of in-kind or financial contribution from BIC or its members will follow. The BBI JU reports in-kind contribution in projects (IKOP) and in-kind additional activities (IKAA) on a yearly basis, together with the calculation of the leverage effect. More details in section 1.3.1.3 below.
• Monitoring of expected socio-economic and environmental impact (first data expected in 2017).
1.3.1.1. Horizon 2020 KPIs and cross-cutting issues
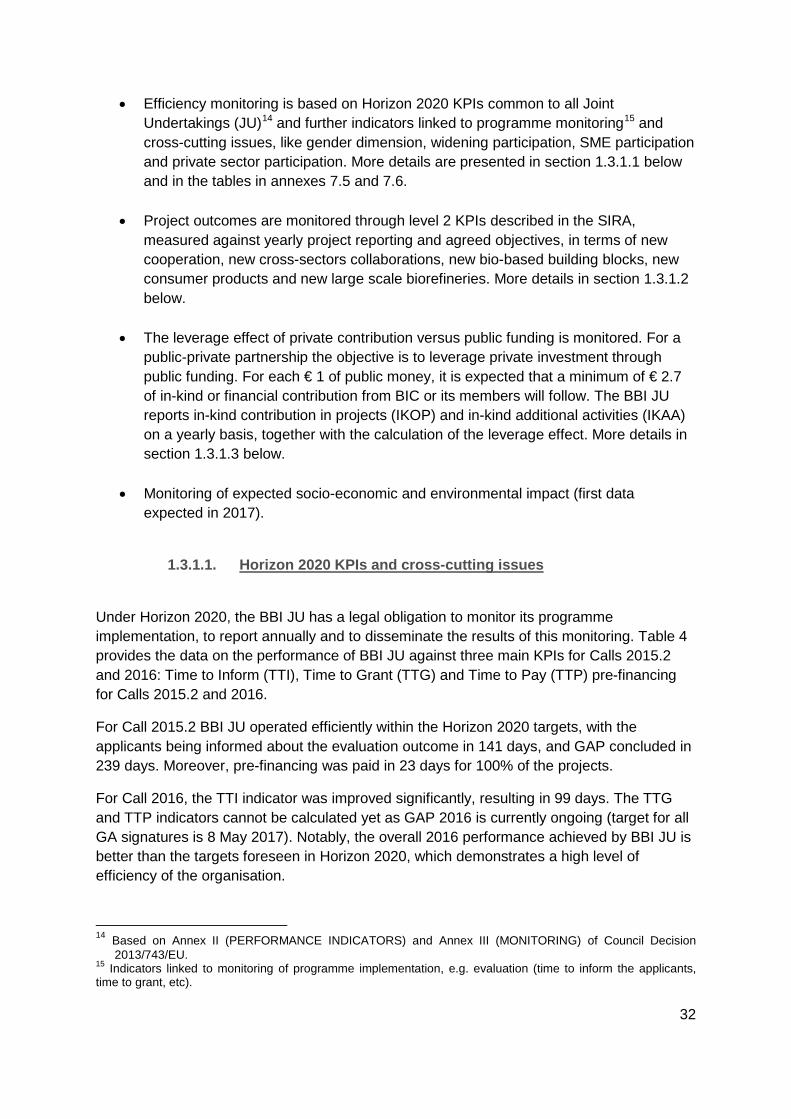
Under Horizon 2020, the BBI JU has a legal obligation to monitor its programme implementation, to report annually and to disseminate the results of this monitoring. Table 4 provides the data on the performance of BBI JU against three main KPIs for Calls 2015.2 and 2016: Time to Inform (TTI), Time to Grant (TTG) and Time to Pay (TTP) pre-financing for Calls 2015.2 and 2016.
For Call 2015.2 BBI JU operated efficiently within the Horizon 2020 targets, with the applicants being informed about the evaluation outcome in 141 days, and GAP concluded in 239 days. Moreover, pre-financing was paid in 23 days for 100% of the projects.
For Call 2016, the TTI indicator was improved significantly, resulting in 99 days. The TTG and TTP indicators cannot be calculated yet as GAP 2016 is currently ongoing (target for all GA signatures is 8 May 2017). Notably, the overall 2016 performance achieved by BBI JU is better than the targets foreseen in Horizon 2020, which demonstrates a high level of efficiency of the organisation.
14 Based on Annex II (PERFORMANCE INDICATORS) and Annex III (MONITORING) of Council Decision
2013/743/EU. 15 Indicators linked to monitoring of programme implementation, e.g. evaluation (time to inform the applicants, time to grant, etc).
33
CALL
EVALUATION KPI: Time To inform (TTI) all applicants on the evaluation results
GAP KPI: Time To Grant (TTG) measured (average) from Call deadline to signature of grants
PAYMENTS Pre-financing (PF) KPI: Time to pay pre-financing (% made on time – target is <30 days)
2015.1 86 days (target 153 days) 227 days (target 243 days) 66% on time with an average of 16 days
2015.2 141 days (target 153 days) 239 days (target 243 days) 23 days (100%) (target 30 days)
2016 99 days (target 153 days) GA signatures target: 8 May 2017 (target 243 days) PF to be paid in 2017
Table 4: Horizon 2020 KPIs on the evaluation of proposals, grant preparation of the proposals retained for funding and payments related to pre-financing.
Indicators for monitoring Horizon 2020 cross-cutting issues can be partly extracted from the general statistics based on the submission and grant agreement stage. In the next section an overview of the main Horizon 2020 cross-cutting issues is provided for:
• widening participation • SME participation • gender dimension
Call-specific data for these issues are shown for Call 2015.2 and Call 2016 respectively in section 1.3.2.
Widening participation
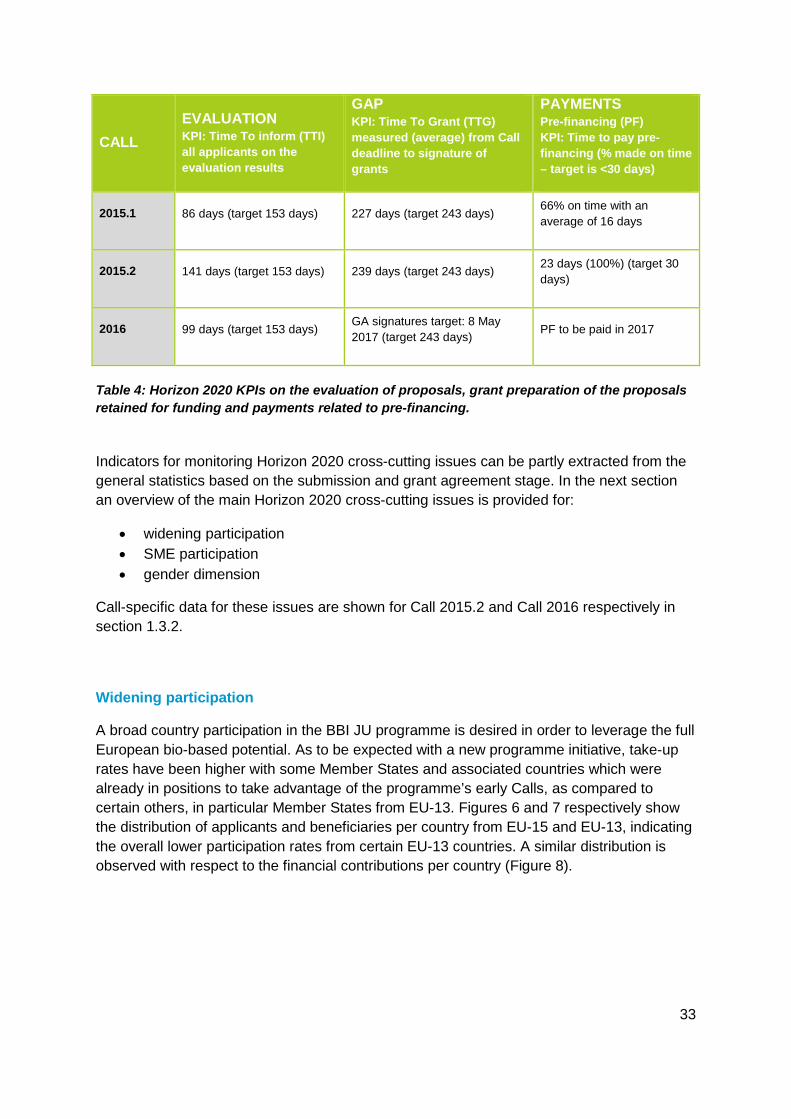
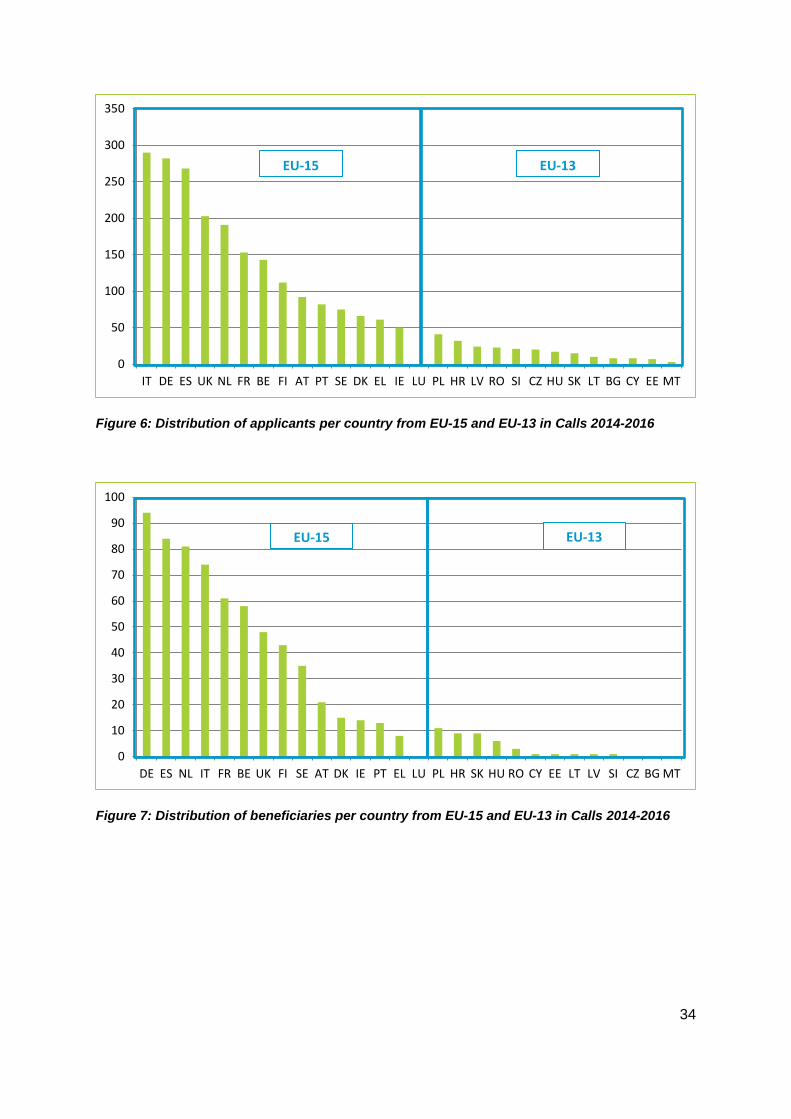
A broad country participation in the BBI JU programme is desired in order to leverage the full European bio-based potential. As to be expected with a new programme initiative, take-up rates have been higher with some Member States and associated countries which were already in positions to take advantage of the programme’s early Calls, as compared to certain others, in particular Member States from EU-13. Figures 6 and 7 respectively show the distribution of applicants and beneficiaries per country from EU-15 and EU-13, indicating the overall lower participation rates from certain EU-13 countries. A similar distribution is observed with respect to the financial contributions per country (Figure 8).
34
Figure 6: Distribution of applicants per country from EU-15 and EU-13 in Calls 2014-2016
Figure 7: Distribution of beneficiaries per country from EU-15 and EU-13 in Calls 2014-2016
0
50
100
150
200
250
300
350
IT DE ES UK NL FR BE FI AT PT SE DK EL IE LU PL HR LV RO SI CZ HU SK LT BG CY EE MT
0
10
20
30
40
50
60
70
80
90
100
DE ES NL IT FR BE UK FI SE AT DK IE PT EL LU PL HR SK HU RO CY EE LT LV SI CZ BG MT
EU-15 EU-13
EU-15 EU-13
35
Figure 8: Grants (in € millions) per EU-15 and EU-13 Member States in Calls 2014-2016
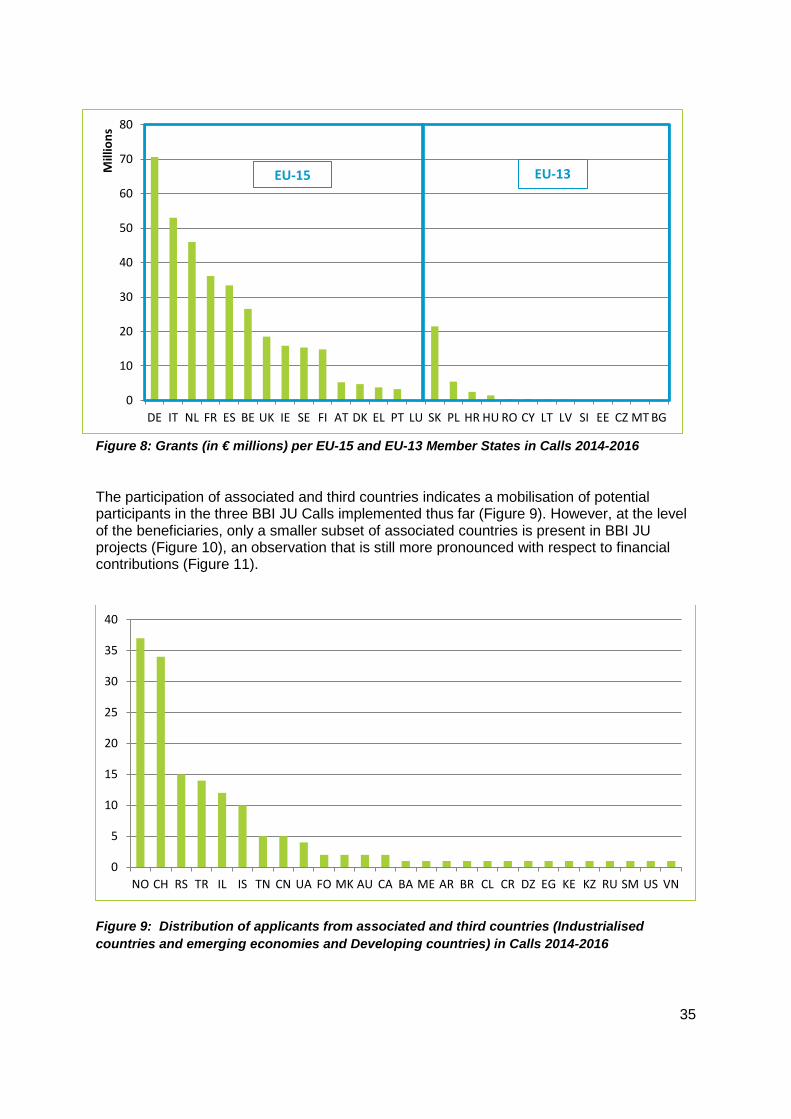
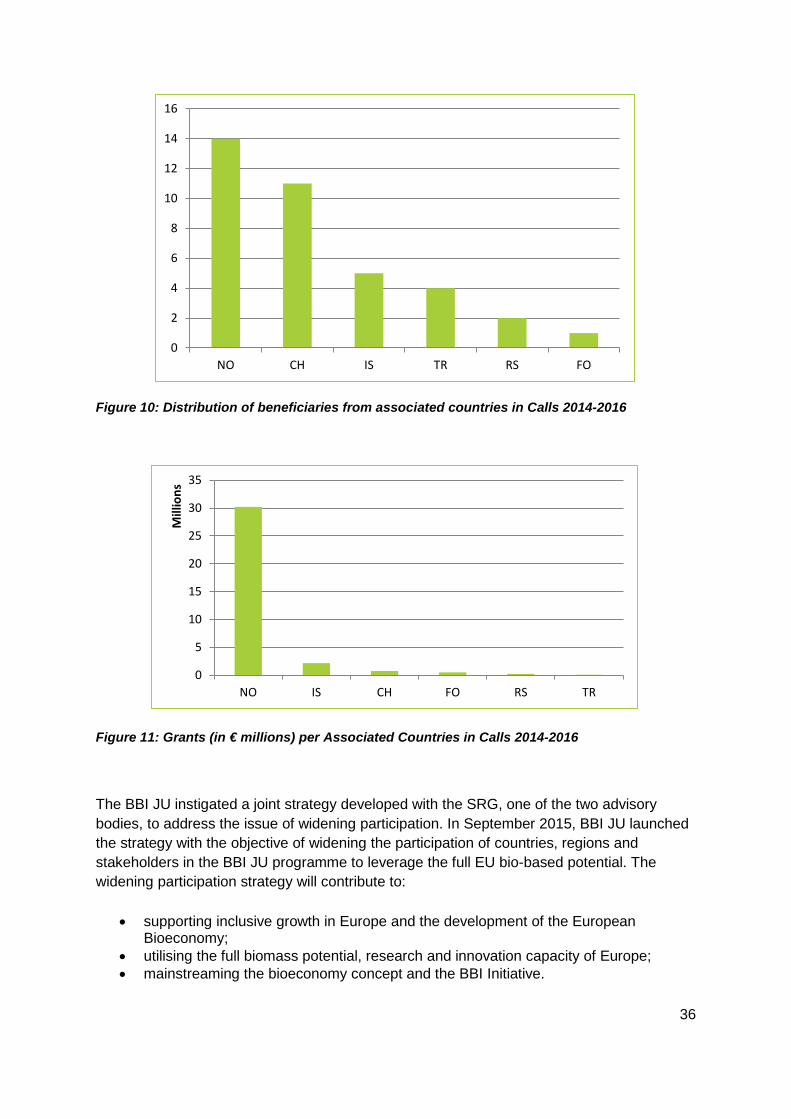
The participation of associated and third countries indicates a mobilisation of potential participants in the three BBI JU Calls implemented thus far (Figure 9). However, at the level of the beneficiaries, only a smaller subset of associated countries is present in BBI JU projects (Figure 10), an observation that is still more pronounced with respect to financial contributions (Figure 11).
Figure 9: Distribution of applicants from associated and third countries (Industrialised countries and emerging economies and Developing countries) in Calls 2014-2016
0
5
10
15
20
25
30
35
40
NO CH RS TR IL IS TN CN UA FO MK AU CA BA ME AR BR CL CR DZ EG KE KZ RU SM US VN
0
10
20
30
40
50
60
70
80
DE IT NL FR ES BE UK IE SE FI AT DK EL PT LU SK PL HR HU RO CY LT LV SI EE CZ MT BG
Mill
ions
EU-15 EU-13
36
Figure 10: Distribution of beneficiaries from associated countries in Calls 2014-2016
Figure 11: Grants (in € millions) per Associated Countries in Calls 2014-2016
The BBI JU instigated a joint strategy developed with the SRG, one of the two advisory bodies, to address the issue of widening participation. In September 2015, BBI JU launched the strategy with the objective of widening the participation of countries, regions and stakeholders in the BBI JU programme to leverage the full EU bio-based potential. The widening participation strategy will contribute to:
• supporting inclusive growth in Europe and the development of the European Bioeconomy;
• utilising the full biomass potential, research and innovation capacity of Europe; • mainstreaming the bioeconomy concept and the BBI Initiative.
0
2
4
6
8
10
12
14
16
NO CH IS TR RS FO
0
5
10
15
20
25
30
35
NO IS CH FO RS TR
Mill
ions
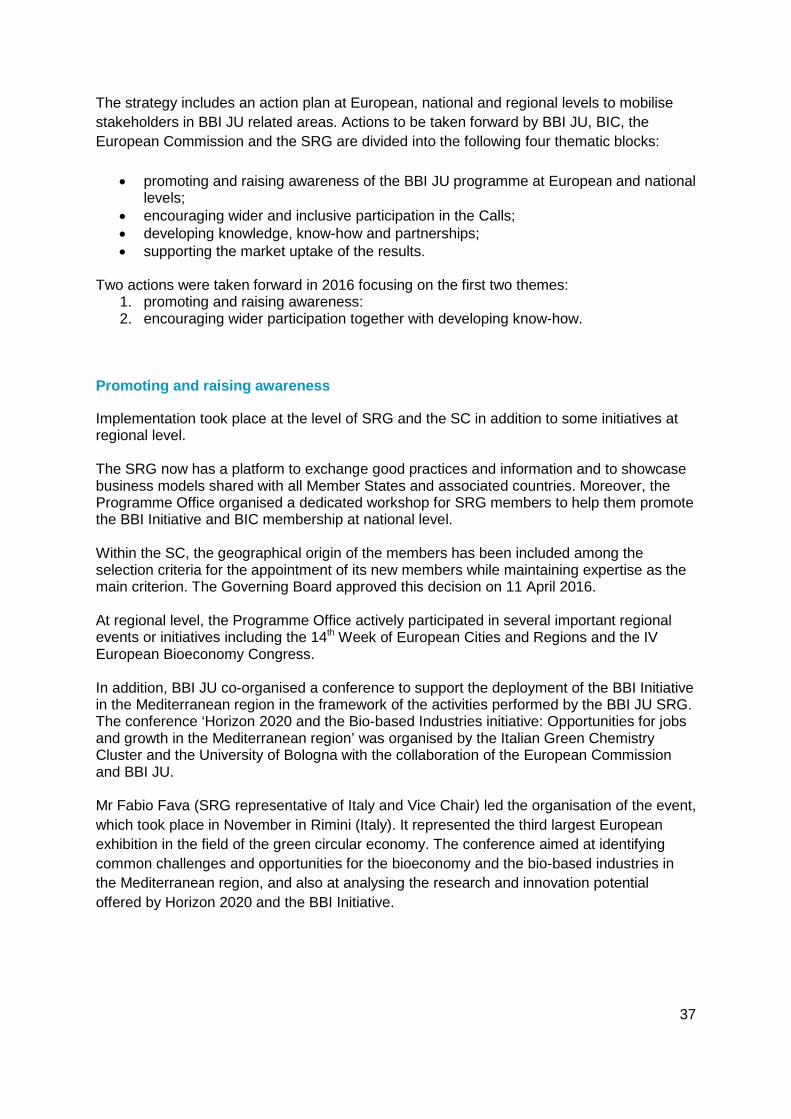
37
The strategy includes an action plan at European, national and regional levels to mobilise stakeholders in BBI JU related areas. Actions to be taken forward by BBI JU, BIC, the European Commission and the SRG are divided into the following four thematic blocks:
• promoting and raising awareness of the BBI JU programme at European and national levels;
• encouraging wider and inclusive participation in the Calls; • developing knowledge, know-how and partnerships; • supporting the market uptake of the results.
Two actions were taken forward in 2016 focusing on the first two themes:
1. promoting and raising awareness: 2. encouraging wider participation together with developing know-how.
Promoting and raising awareness
Implementation took place at the level of SRG and the SC in addition to some initiatives at regional level. The SRG now has a platform to exchange good practices and information and to showcase business models shared with all Member States and associated countries. Moreover, the Programme Office organised a dedicated workshop for SRG members to help them promote the BBI Initiative and BIC membership at national level. Within the SC, the geographical origin of the members has been included among the selection criteria for the appointment of its new members while maintaining expertise as the main criterion. The Governing Board approved this decision on 11 April 2016. At regional level, the Programme Office actively participated in several important regional events or initiatives including the 14th Week of European Cities and Regions and the IV European Bioeconomy Congress. In addition, BBI JU co-organised a conference to support the deployment of the BBI Initiative in the Mediterranean region in the framework of the activities performed by the BBI JU SRG. The conference ‘Horizon 2020 and the Bio-based Industries initiative: Opportunities for jobs and growth in the Mediterranean region’ was organised by the Italian Green Chemistry Cluster and the University of Bologna with the collaboration of the European Commission and BBI JU. Mr Fabio Fava (SRG representative of Italy and Vice Chair) led the organisation of the event, which took place in November in Rimini (Italy). It represented the third largest European exhibition in the field of the green circular economy. The conference aimed at identifying common challenges and opportunities for the bioeconomy and the bio-based industries in the Mediterranean region, and also at analysing the research and innovation potential offered by Horizon 2020 and the BBI Initiative.
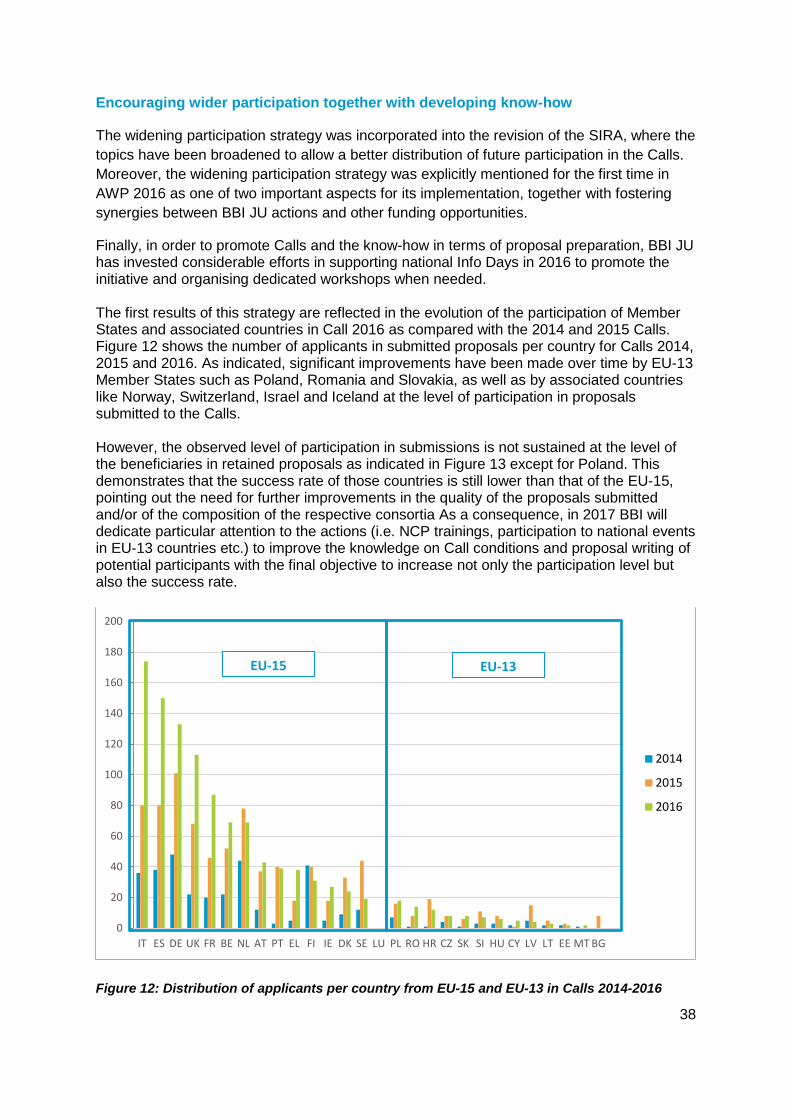
38
Encouraging wider participation together with developing know-how
The widening participation strategy was incorporated into the revision of the SIRA, where the topics have been broadened to allow a better distribution of future participation in the Calls. Moreover, the widening participation strategy was explicitly mentioned for the first time in AWP 2016 as one of two important aspects for its implementation, together with fostering synergies between BBI JU actions and other funding opportunities.
Finally, in order to promote Calls and the know-how in terms of proposal preparation, BBI JU has invested considerable efforts in supporting national Info Days in 2016 to promote the initiative and organising dedicated workshops when needed. The first results of this strategy are reflected in the evolution of the participation of Member States and associated countries in Call 2016 as compared with the 2014 and 2015 Calls. Figure 12 shows the number of applicants in submitted proposals per country for Calls 2014, 2015 and 2016. As indicated, significant improvements have been made over time by EU-13 Member States such as Poland, Romania and Slovakia, as well as by associated countries like Norway, Switzerland, Israel and Iceland at the level of participation in proposals submitted to the Calls. However, the observed level of participation in submissions is not sustained at the level of the beneficiaries in retained proposals as indicated in Figure 13 except for Poland. This demonstrates that the success rate of those countries is still lower than that of the EU-15, pointing out the need for further improvements in the quality of the proposals submitted and/or of the composition of the respective consortia As a consequence, in 2017 BBI will dedicate particular attention to the actions (i.e. NCP trainings, participation to national events in EU-13 countries etc.) to improve the knowledge on Call conditions and proposal writing of potential participants with the final objective to increase not only the participation level but also the success rate.
Figure 12: Distribution of applicants per country from EU-15 and EU-13 in Calls 2014-2016
0
20
40
60
80
100
120
140
160
180
200
IT ES DE UK FR BE NL AT PT EL FI IE DK SE LU PL RO HR CZ SK SI HU CY LV LT EE MT BG
2014
2015
2016
EU-15 EU-13
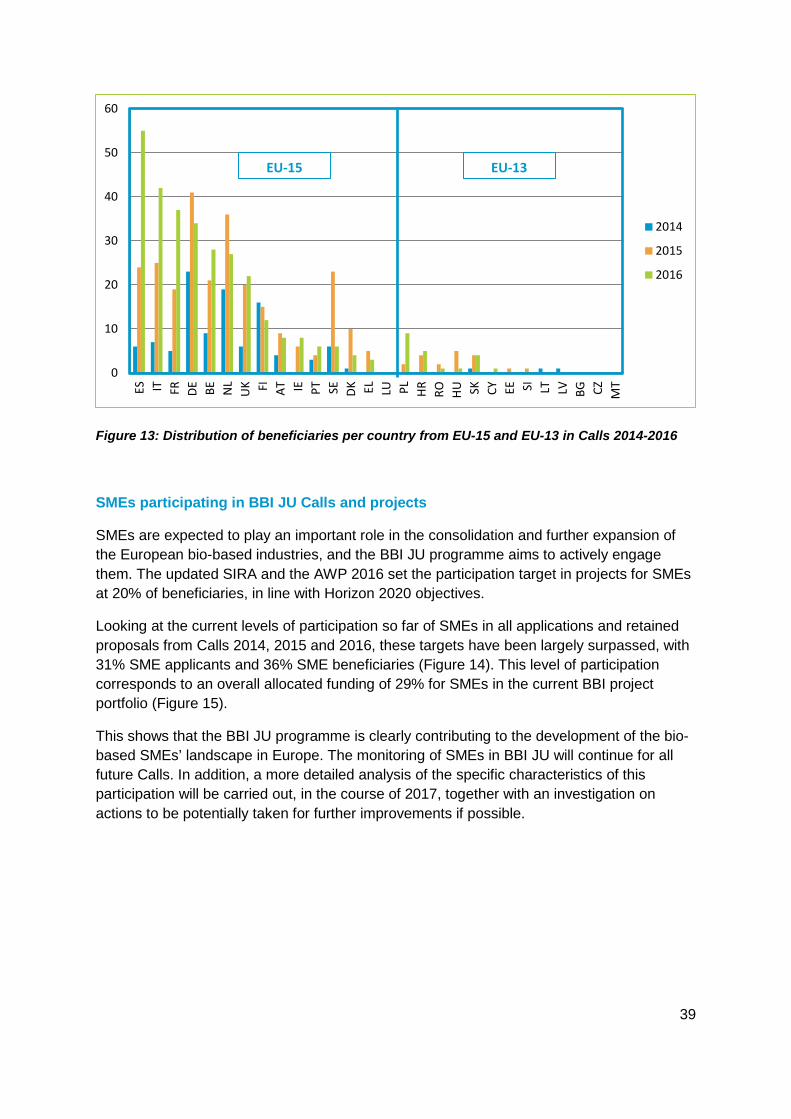
39
Figure 13: Distribution of beneficiaries per country from EU-15 and EU-13 in Calls 2014-2016
SMEs participating in BBI JU Calls and projects
SMEs are expected to play an important role in the consolidation and further expansion of the European bio-based industries, and the BBI JU programme aims to actively engage them. The updated SIRA and the AWP 2016 set the participation target in projects for SMEs at 20% of beneficiaries, in line with Horizon 2020 objectives.
Looking at the current levels of participation so far of SMEs in all applications and retained proposals from Calls 2014, 2015 and 2016, these targets have been largely surpassed, with 31% SME applicants and 36% SME beneficiaries (Figure 14). This level of participation corresponds to an overall allocated funding of 29% for SMEs in the current BBI project portfolio (Figure 15).
This shows that the BBI JU programme is clearly contributing to the development of the bio-based SMEs’ landscape in Europe. The monitoring of SMEs in BBI JU will continue for all future Calls. In addition, a more detailed analysis of the specific characteristics of this participation will be carried out, in the course of 2017, together with an investigation on actions to be potentially taken for further improvements if possible.
0
10
20
30
40
50
60
ES IT FR DE BE NL
UK FI AT IE PT SE DK EL LU PL HR RO HU SK CY EE SI LT LV BG CZ MT
2014
2015
2016
EU-15 EU-13
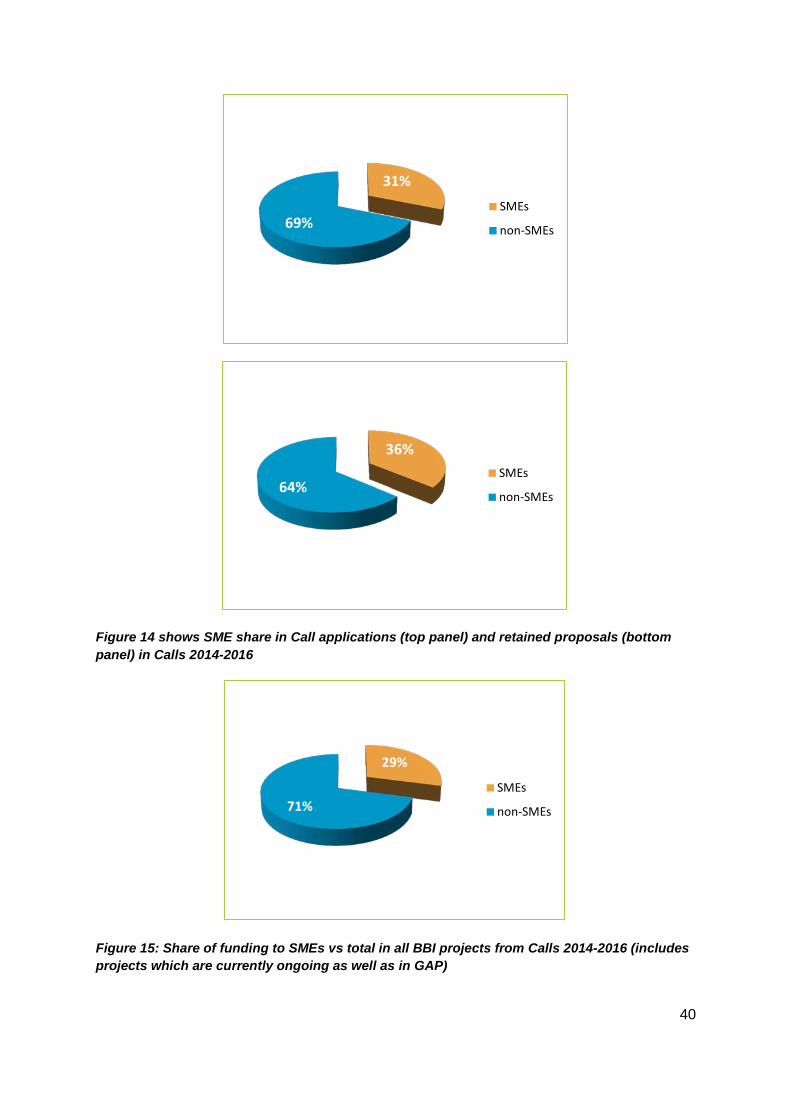
40
Figure 14 shows SME share in Call applications (top panel) and retained proposals (bottom panel) in Calls 2014-2016
Figure 15: Share of funding to SMEs vs total in all BBI projects from Calls 2014-2016 (includes projects which are currently ongoing as well as in GAP)
31%
69% SMEs
non-SMEs
36%
64% SMEs
non-SMEs
29%
71% SMEs
non-SMEs
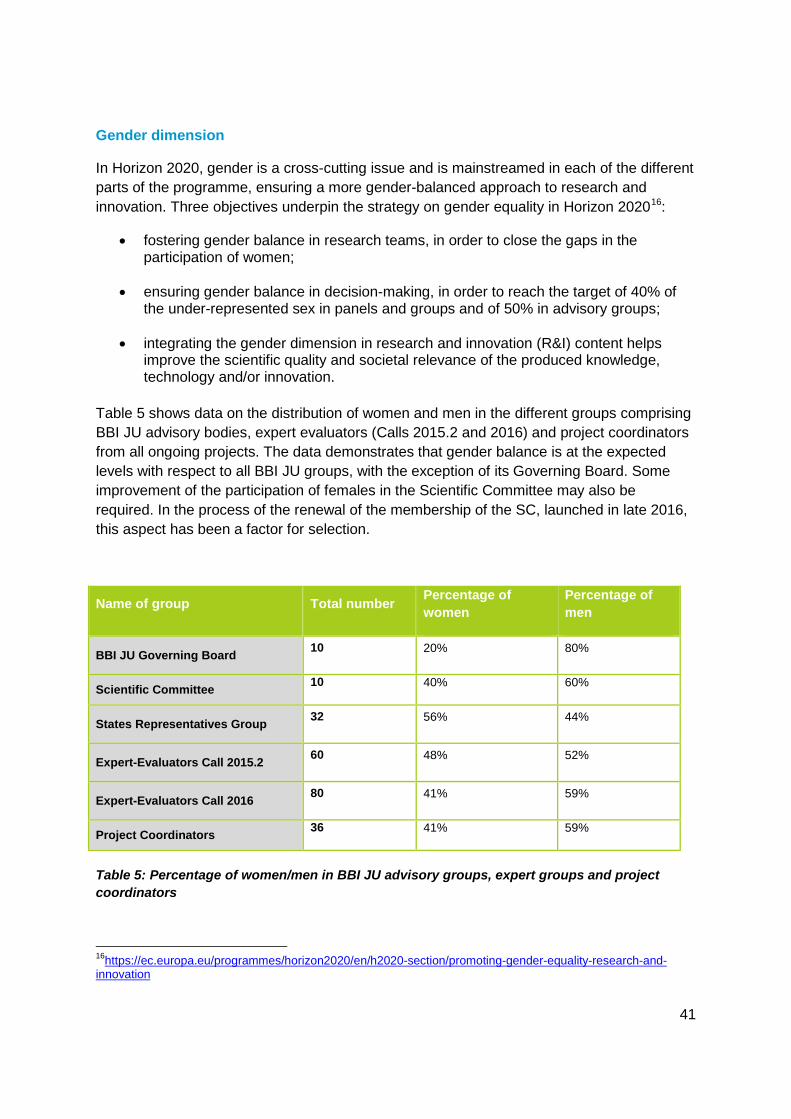
41
Gender dimension
In Horizon 2020, gender is a cross-cutting issue and is mainstreamed in each of the different parts of the programme, ensuring a more gender-balanced approach to research and innovation. Three objectives underpin the strategy on gender equality in Horizon 202016:
• fostering gender balance in research teams, in order to close the gaps in the participation of women;
• ensuring gender balance in decision-making, in order to reach the target of 40% of the under-represented sex in panels and groups and of 50% in advisory groups;
• integrating the gender dimension in research and innovation (R&I) content helps improve the scientific quality and societal relevance of the produced knowledge, technology and/or innovation.
Table 5 shows data on the distribution of women and men in the different groups comprising BBI JU advisory bodies, expert evaluators (Calls 2015.2 and 2016) and project coordinators from all ongoing projects. The data demonstrates that gender balance is at the expected levels with respect to all BBI JU groups, with the exception of its Governing Board. Some improvement of the participation of females in the Scientific Committee may also be required. In the process of the renewal of the membership of the SC, launched in late 2016, this aspect has been a factor for selection.
Name of group Total number Percentage of women
Percentage of men
BBI JU Governing Board 10 20% 80%
Scientific Committee 10 40% 60%
States Representatives Group 32 56% 44%
Expert-Evaluators Call 2015.2 60 48% 52%
Expert-Evaluators Call 2016 80 41% 59%
Project Coordinators 36 41% 59%
Table 5: Percentage of women/men in BBI JU advisory groups, expert groups and project coordinators
16https://ec.europa.eu/programmes/horizon2020/en/h2020-section/promoting-gender-equality-research-and-innovation
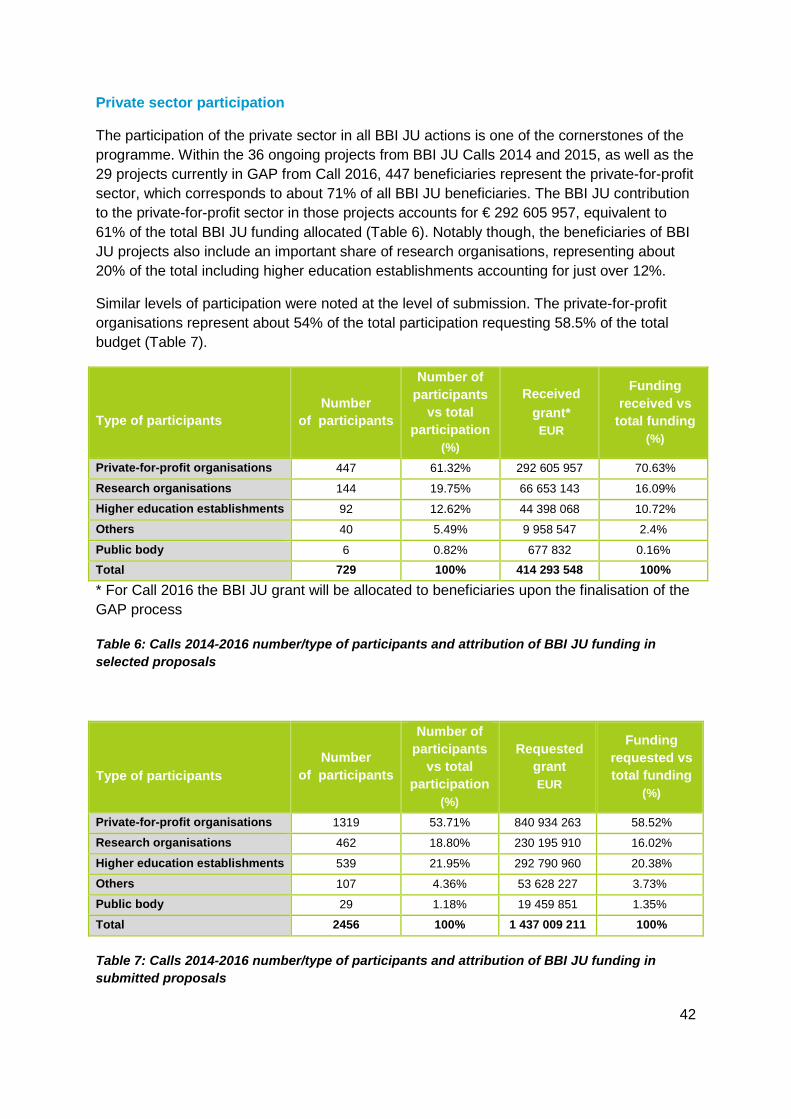
42
Private sector participation
The participation of the private sector in all BBI JU actions is one of the cornerstones of the programme. Within the 36 ongoing projects from BBI JU Calls 2014 and 2015, as well as the 29 projects currently in GAP from Call 2016, 447 beneficiaries represent the private-for-profit sector, which corresponds to about 71% of all BBI JU beneficiaries. The BBI JU contribution to the private-for-profit sector in those projects accounts for € 292 605 957, equivalent to 61% of the total BBI JU funding allocated (Table 6). Notably though, the beneficiaries of BBI JU projects also include an important share of research organisations, representing about 20% of the total including higher education establishments accounting for just over 12%.
Similar levels of participation were noted at the level of submission. The private-for-profit organisations represent about 54% of the total participation requesting 58.5% of the total budget (Table 7).
* For Call 2016 the BBI JU grant will be allocated to beneficiaries upon the finalisation of the GAP process
Table 6: Calls 2014-2016 number/type of participants and attribution of BBI JU funding in selected proposals
Type of participants
Number of participants
Number of participants
vs total participation
(%)
Requested grant EUR
Funding requested vs total funding
(%)
Private-for-profit organisations 1319 53.71% 840 934 263 58.52%
Research organisations 462 18.80% 230 195 910 16.02%
Higher education establishments 539 21.95% 292 790 960 20.38%
Others 107 4.36% 53 628 227 3.73%
Public body 29 1.18% 19 459 851 1.35%
Total 2456 100% 1 437 009 211 100%
Table 7: Calls 2014-2016 number/type of participants and attribution of BBI JU funding in submitted proposals
Type of participants
Number of participants
Number of participants
vs total participation
(%)
Received grant* EUR
Funding received vs
total funding (%)
Private-for-profit organisations 447 61.32% 292 605 957 70.63%
Research organisations 144 19.75% 66 653 143 16.09%
Higher education establishments 92 12.62% 44 398 068 10.72%
Others 40 5.49% 9 958 547 2.4%
Public body 6 0.82% 677 832 0.16% Total 729 100% 414 293 548 100%
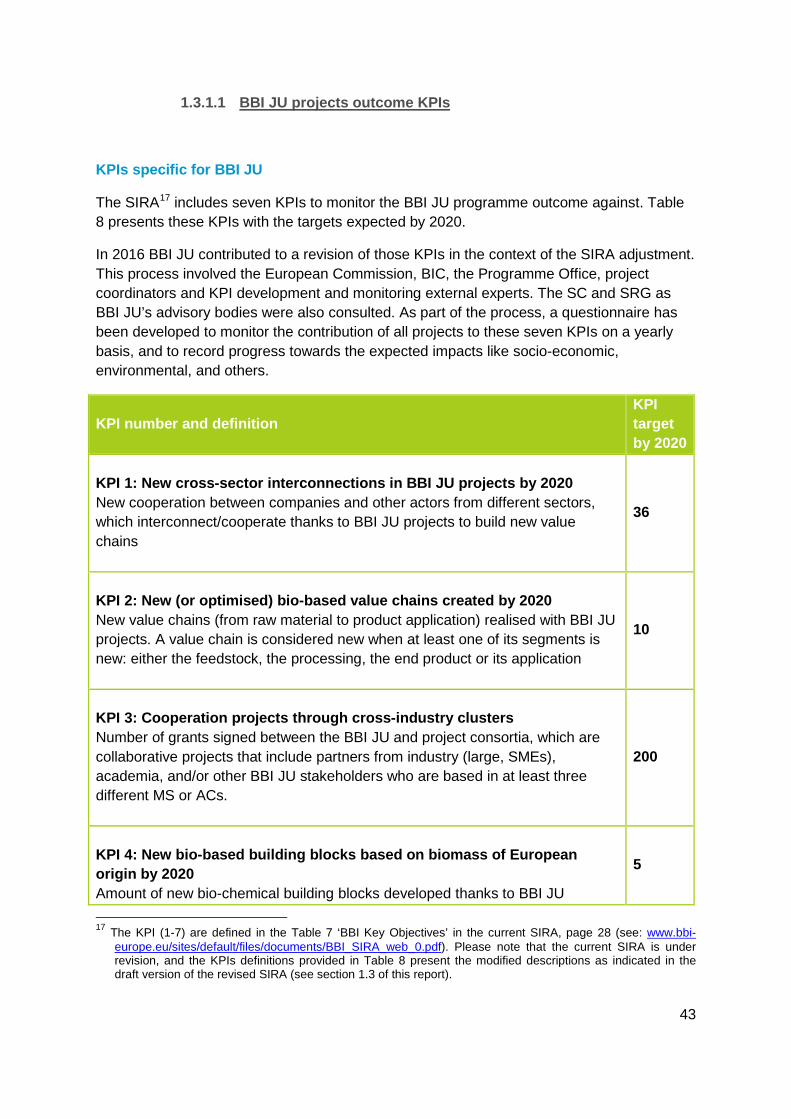
43
1.3.1.1 BBI JU projects outcome KPIs
KPIs specific for BBI JU
The SIRA17 includes seven KPIs to monitor the BBI JU programme outcome against. Table 8 presents these KPIs with the targets expected by 2020.
In 2016 BBI JU contributed to a revision of those KPIs in the context of the SIRA adjustment. This process involved the European Commission, BIC, the Programme Office, project coordinators and KPI development and monitoring external experts. The SC and SRG as BBI JU’s advisory bodies were also consulted. As part of the process, a questionnaire has been developed to monitor the contribution of all projects to these seven KPIs on a yearly basis, and to record progress towards the expected impacts like socio-economic, environmental, and others.
KPI number and definition KPI target by 2020
KPI 1: New cross-sector interconnections in BBI JU projects by 2020 New cooperation between companies and other actors from different sectors, which interconnect/cooperate thanks to BBI JU projects to build new value chains
36
KPI 2: New (or optimised) bio-based value chains created by 2020 New value chains (from raw material to product application) realised with BBI JU projects. A value chain is considered new when at least one of its segments is new: either the feedstock, the processing, the end product or its application
10
KPI 3: Cooperation projects through cross-industry clusters Number of grants signed between the BBI JU and project consortia, which are collaborative projects that include partners from industry (large, SMEs), academia, and/or other BBI JU stakeholders who are based in at least three different MS or ACs.
200
KPI 4: New bio-based building blocks based on biomass of European origin by 2020 Amount of new bio-chemical building blocks developed thanks to BBI JU
5
17 The KPI (1-7) are defined in the Table 7 ‘BBI Key Objectives’ in the current SIRA, page 28 (see: www.bbi-
europe.eu/sites/default/files/documents/BBI_SIRA_web_0.pdf). Please note that the current SIRA is under revision, and the KPIs definitions provided in Table 8 present the modified descriptions as indicated in the draft version of the revised SIRA (see section 1.3 of this report).
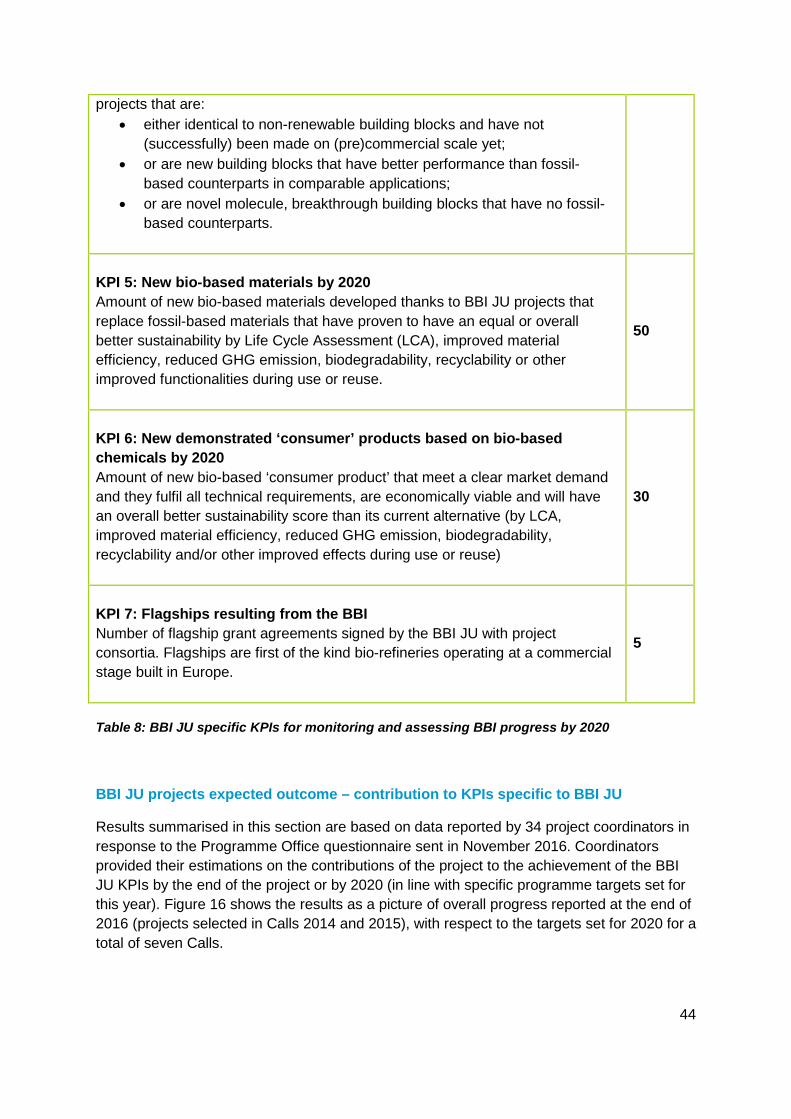
44
projects that are: • either identical to non-renewable building blocks and have not
(successfully) been made on (pre)commercial scale yet; • or are new building blocks that have better performance than fossil-
based counterparts in comparable applications; • or are novel molecule, breakthrough building blocks that have no fossil-
based counterparts.
KPI 5: New bio-based materials by 2020 Amount of new bio-based materials developed thanks to BBI JU projects that replace fossil-based materials that have proven to have an equal or overall better sustainability by Life Cycle Assessment (LCA), improved material efficiency, reduced GHG emission, biodegradability, recyclability or other improved functionalities during use or reuse.
50
KPI 6: New demonstrated ‘consumer’ products based on bio-based chemicals by 2020 Amount of new bio-based ‘consumer product’ that meet a clear market demand and they fulfil all technical requirements, are economically viable and will have an overall better sustainability score than its current alternative (by LCA, improved material efficiency, reduced GHG emission, biodegradability, recyclability and/or other improved effects during use or reuse)
30
KPI 7: Flagships resulting from the BBI Number of flagship grant agreements signed by the BBI JU with project consortia. Flagships are first of the kind bio-refineries operating at a commercial stage built in Europe.
5
Table 8: BBI JU specific KPIs for monitoring and assessing BBI progress by 2020
BBI JU projects expected outcome – contribution to KPIs specific to BBI JU
Results summarised in this section are based on data reported by 34 project coordinators in response to the Programme Office questionnaire sent in November 2016. Coordinators provided their estimations on the contributions of the project to the achievement of the BBI JU KPIs by the end of the project or by 2020 (in line with specific programme targets set for this year). Figure 16 shows the results as a picture of overall progress reported at the end of 2016 (projects selected in Calls 2014 and 2015), with respect to the targets set for 2020 for a total of seven Calls.
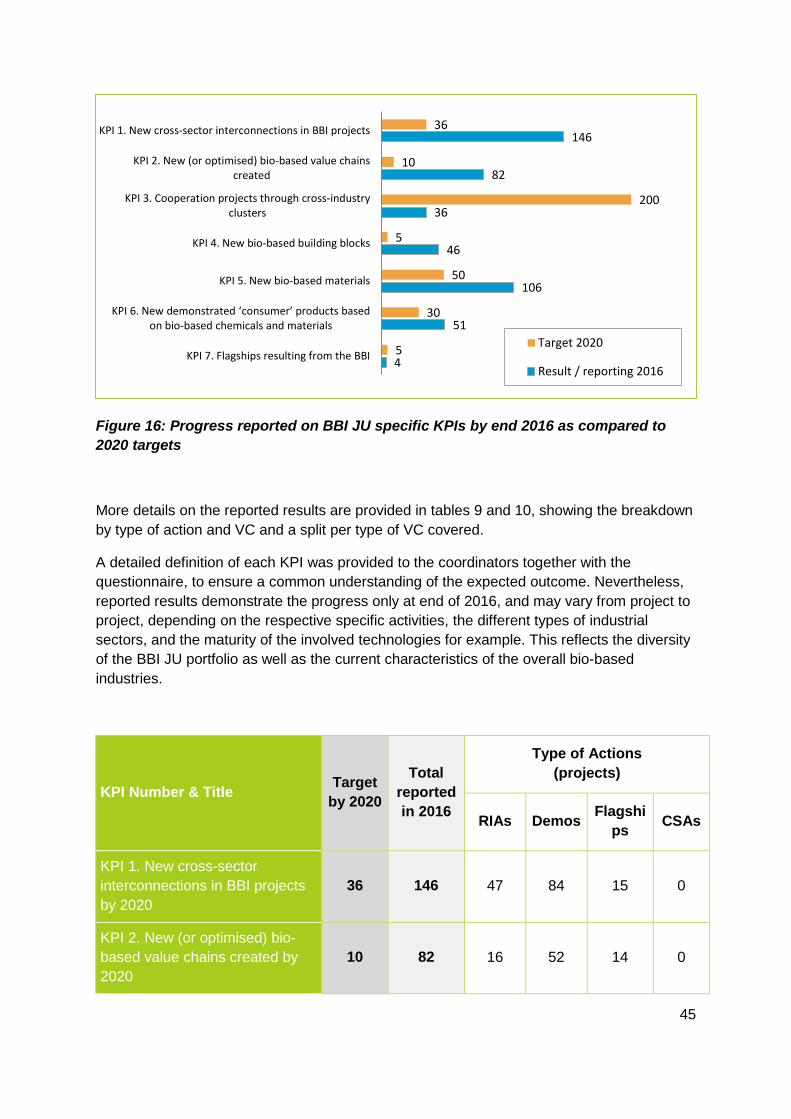
45
Figure 16: Progress reported on BBI JU specific KPIs by end 2016 as compared to 2020 targets
More details on the reported results are provided in tables 9 and 10, showing the breakdown by type of action and VC and a split per type of VC covered.
A detailed definition of each KPI was provided to the coordinators together with the questionnaire, to ensure a common understanding of the expected outcome. Nevertheless, reported results demonstrate the progress only at end of 2016, and may vary from project to project, depending on the respective specific activities, the different types of industrial sectors, and the maturity of the involved technologies for example. This reflects the diversity of the BBI JU portfolio as well as the current characteristics of the overall bio-based industries.
KPI Number & Title Target by 2020
Total reported in 2016
Type of Actions (projects)
RIAs Demos Flagships CSAs
KPI 1. New cross-sector interconnections in BBI projects by 2020
36 146 47 84 15 0
KPI 2. New (or optimised) bio-based value chains created by 2020
10 82 16 52 14 0
36
10
200
5
50
30
5
146
82
36
46
106
51
4
KPI 1. New cross-sector interconnections in BBI projects
KPI 2. New (or optimised) bio-based value chainscreated
KPI 3. Cooperation projects through cross-industryclusters
KPI 4. New bio-based building blocks
KPI 5. New bio-based materials
KPI 6. New demonstrated ‘consumer’ products based on bio-based chemicals and materials
KPI 7. Flagships resulting from the BBITarget 2020
Result / reporting 2016
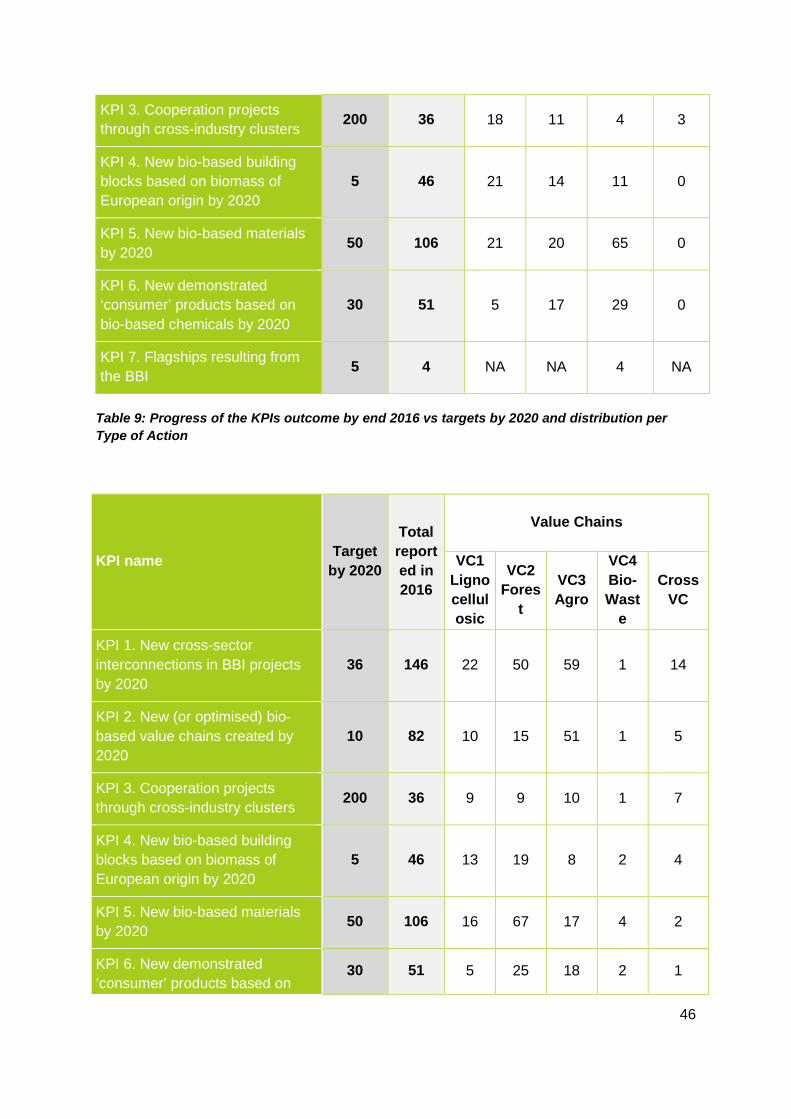
46
KPI 3. Cooperation projects through cross-industry clusters 200 36 18 11 4 3
KPI 4. New bio-based building blocks based on biomass of European origin by 2020
5 46 21 14 11 0
KPI 5. New bio-based materials by 2020
50 106 21 20 65 0
KPI 6. New demonstrated ‘consumer’ products based on bio-based chemicals by 2020
30 51 5 17 29 0
KPI 7. Flagships resulting from the BBI 5 4 NA NA 4 NA
Table 9: Progress of the KPIs outcome by end 2016 vs targets by 2020 and distribution per Type of Action
KPI name Target by 2020
Total reported in 2016
Value Chains
VC1 Lignocellulosic
VC2 Fores
t
VC3 Agro
VC4 Bio-Wast
e
Cross VC
KPI 1. New cross-sector interconnections in BBI projects by 2020
36 146 22 50 59 1 14
KPI 2. New (or optimised) bio-based value chains created by 2020
10 82 10 15 51 1 5
KPI 3. Cooperation projects through cross-industry clusters 200 36 9 9 10 1 7
KPI 4. New bio-based building blocks based on biomass of European origin by 2020
5 46 13 19 8 2 4
KPI 5. New bio-based materials by 2020
50 106 16 67 17 4 2
KPI 6. New demonstrated ‘consumer’ products based on
30 51 5 25 18 2 1
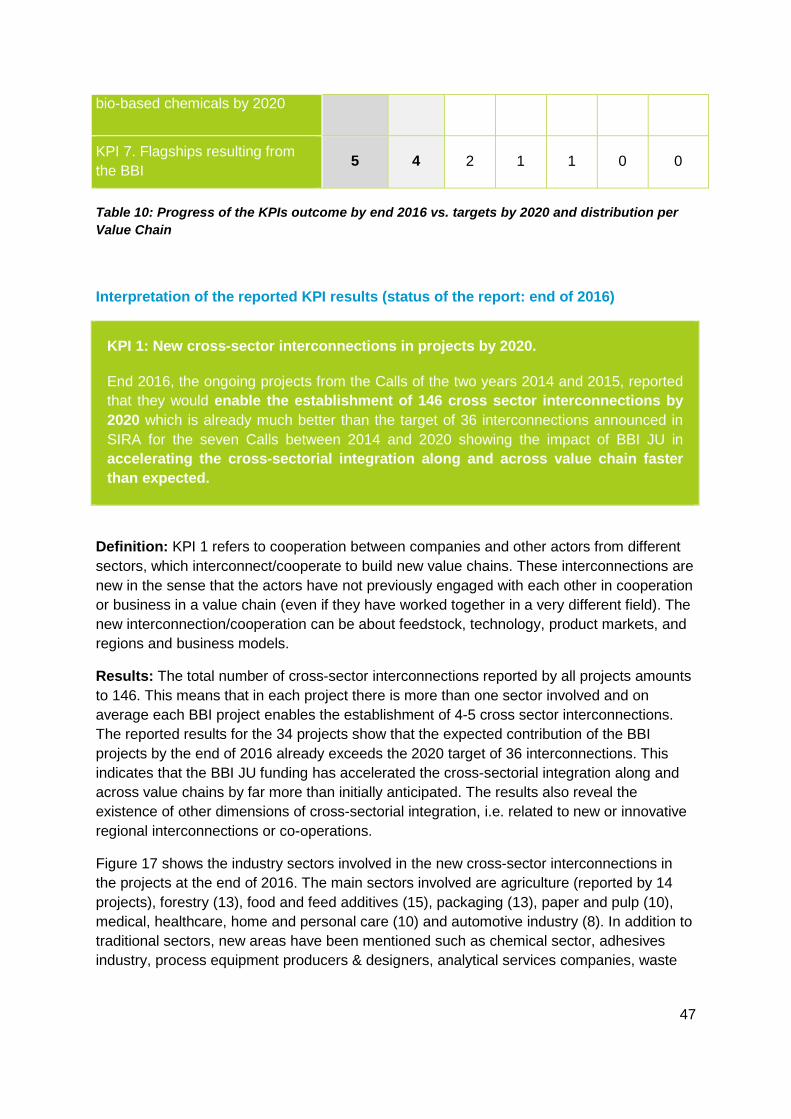
47
bio-based chemicals by 2020
KPI 7. Flagships resulting from the BBI
5 4 2 1 1 0 0
Table 10: Progress of the KPIs outcome by end 2016 vs. targets by 2020 and distribution per Value Chain
Interpretation of the reported KPI results (status of the report: end of 2016)
KPI 1: New cross-sector interconnections in projects by 2020.
End 2016, the ongoing projects from the Calls of the two years 2014 and 2015, reported that they would enable the establishment of 146 cross sector interconnections by 2020 which is already much better than the target of 36 interconnections announced in SIRA for the seven Calls between 2014 and 2020 showing the impact of BBI JU in accelerating the cross-sectorial integration along and across value chain faster than expected.
Definition: KPI 1 refers to cooperation between companies and other actors from different sectors, which interconnect/cooperate to build new value chains. These interconnections are new in the sense that the actors have not previously engaged with each other in cooperation or business in a value chain (even if they have worked together in a very different field). The new interconnection/cooperation can be about feedstock, technology, product markets, and regions and business models.
Results: The total number of cross-sector interconnections reported by all projects amounts to 146. This means that in each project there is more than one sector involved and on average each BBI project enables the establishment of 4-5 cross sector interconnections. The reported results for the 34 projects show that the expected contribution of the BBI projects by the end of 2016 already exceeds the 2020 target of 36 interconnections. This indicates that the BBI JU funding has accelerated the cross-sectorial integration along and across value chains by far more than initially anticipated. The results also reveal the existence of other dimensions of cross-sectorial integration, i.e. related to new or innovative regional interconnections or co-operations.
Figure 17 shows the industry sectors involved in the new cross-sector interconnections in the projects at the end of 2016. The main sectors involved are agriculture (reported by 14 projects), forestry (13), food and feed additives (15), packaging (13), paper and pulp (10), medical, healthcare, home and personal care (10) and automotive industry (8). In addition to traditional sectors, new areas have been mentioned such as chemical sector, adhesives industry, process equipment producers & designers, analytical services companies, waste
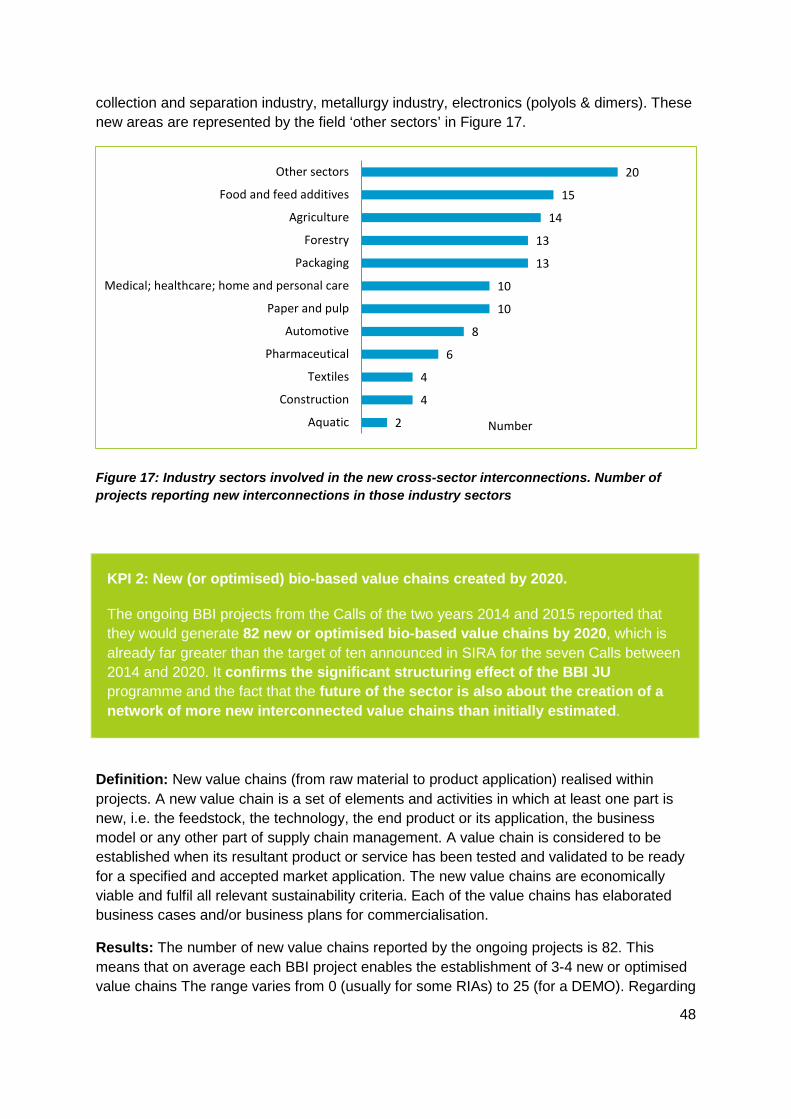
48
collection and separation industry, metallurgy industry, electronics (polyols & dimers). These new areas are represented by the field ‘other sectors’ in Figure 17.
Figure 17: Industry sectors involved in the new cross-sector interconnections. Number of projects reporting new interconnections in those industry sectors
KPI 2: New (or optimised) bio-based value chains created by 2020.
The ongoing BBI projects from the Calls of the two years 2014 and 2015 reported that they would generate 82 new or optimised bio-based value chains by 2020, which is already far greater than the target of ten announced in SIRA for the seven Calls between 2014 and 2020. It confirms the significant structuring effect of the BBI JU programme and the fact that the future of the sector is also about the creation of a network of more new interconnected value chains than initially estimated.
Definition: New value chains (from raw material to product application) realised within projects. A new value chain is a set of elements and activities in which at least one part is new, i.e. the feedstock, the technology, the end product or its application, the business model or any other part of supply chain management. A value chain is considered to be established when its resultant product or service has been tested and validated to be ready for a specified and accepted market application. The new value chains are economically viable and fulfil all relevant sustainability criteria. Each of the value chains has elaborated business cases and/or business plans for commercialisation.
Results: The number of new value chains reported by the ongoing projects is 82. This means that on average each BBI project enables the establishment of 3-4 new or optimised value chains The range varies from 0 (usually for some RIAs) to 25 (for a DEMO). Regarding
20
15
14
13
13
10
10
8
6
4
4
2
Other sectors
Food and feed additives
Agriculture
Forestry
Packaging
Medical; healthcare; home and personal care
Paper and pulp
Automotive
Pharmaceutical
Textiles
Construction
Aquatic Number
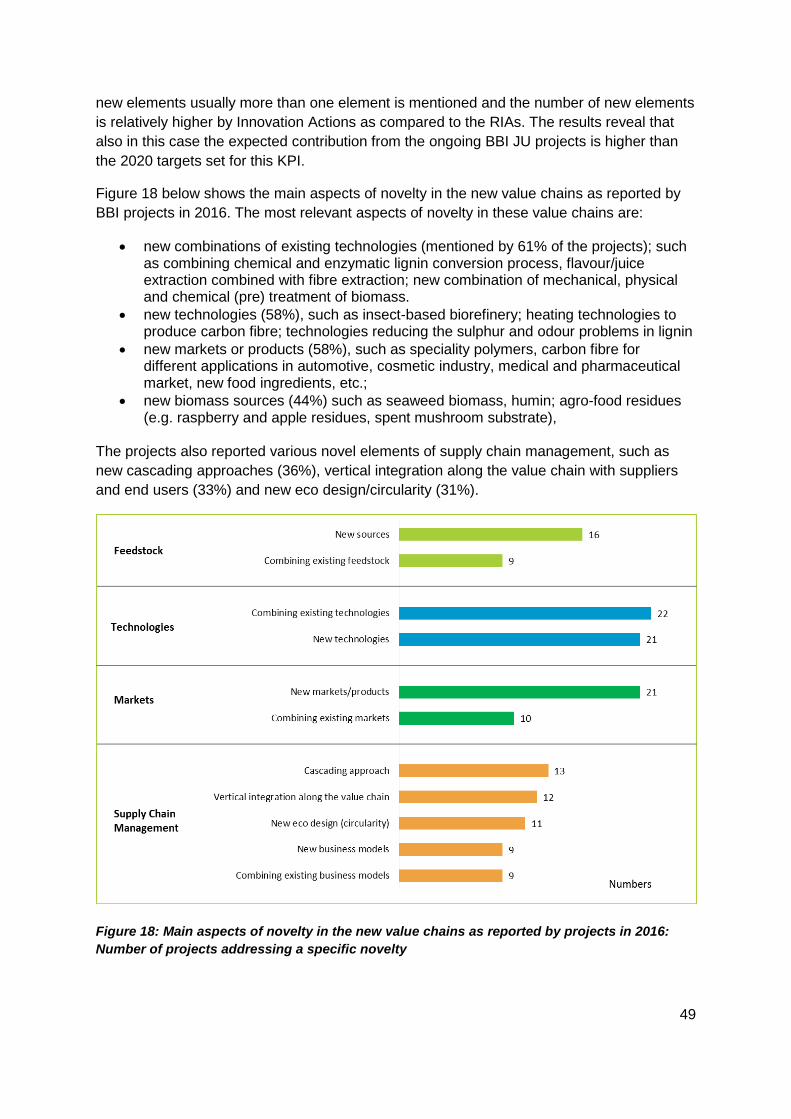
49
new elements usually more than one element is mentioned and the number of new elements is relatively higher by Innovation Actions as compared to the RIAs. The results reveal that also in this case the expected contribution from the ongoing BBI JU projects is higher than the 2020 targets set for this KPI.
Figure 18 below shows the main aspects of novelty in the new value chains as reported by BBI projects in 2016. The most relevant aspects of novelty in these value chains are:
• new combinations of existing technologies (mentioned by 61% of the projects); such as combining chemical and enzymatic lignin conversion process, flavour/juice extraction combined with fibre extraction; new combination of mechanical, physical and chemical (pre) treatment of biomass.
• new technologies (58%), such as insect-based biorefinery; heating technologies to produce carbon fibre; technologies reducing the sulphur and odour problems in lignin
• new markets or products (58%), such as speciality polymers, carbon fibre for different applications in automotive, cosmetic industry, medical and pharmaceutical market, new food ingredients, etc.;
• new biomass sources (44%) such as seaweed biomass, humin; agro-food residues (e.g. raspberry and apple residues, spent mushroom substrate),
The projects also reported various novel elements of supply chain management, such as new cascading approaches (36%), vertical integration along the value chain with suppliers and end users (33%) and new eco design/circularity (31%).
Figure 18: Main aspects of novelty in the new value chains as reported by projects in 2016: Number of projects addressing a specific novelty
50
Moreover, 50% of the projects reported that the model of their new value chains is applicable in other regions. The findings reveal the variety of possible combinations of elements to create new value chains and may explain the high number related to this KPI.
KPI 3: New cooperation projects through cross-industry clusters.
The current portfolio of projects from the Calls of the two years 2014 and 2015 is comprised of 36 ongoing projects with ten from 2014 and 26 from 2015 Calls. Considering the 29 proposals retained for funding for the Call 2016, the trend is in line with the objective of 2020 for the seven Calls between 2014 and 2020.
Definition: KPI3 refers to the number of BBI JU projects started since the launch of the programme. The number refers to projects with signed grant agreements which have delivered the expected outcomes.
Results: Calls 2014 and 2015 have delivered 36 cooperation projects, covering all value chains mentioned above: VC1 (9 projects), VC2 (9), VC3 (10), VC4 (1) and cross-VC (7). As only projects from Calls 2014 and 2015 are considered in this report, the result aligns well with the expected total number of 200 projects by the end of 2020.
KPI 4: New bio-based building blocks based on biomass of European origin by 2020.
The ongoing BBI projects from the Calls of the two years 2014 and 2015 reported that by 2020 they would deliver 46 new bio-based building blocks based on biomass from European origin. This is already much higher than the target of five new building blocks announced in the SIRA for the seven Calls between 2014 and 2020, confirming the impact of BBI JU in bridging the gap between the research and the market.
Definition: New building blocks developed, validated or demonstrated at a scale enabling its technical and economic viability through BBI projects. New bio-based building blocks are:
• chemical building blocks that are identical to fossil-based building blocks and have not (successfully) been made on (pre)commercial scale yet, or
• new building blocks that demonstrate a better performance than their fossil-based counterparts in comparable applications, or
• novel, breakthrough building blocks that have no fossil-based counterparts.
The new building blocks should meet a clear B2B market demand and fulfil all technical requirements. They are economically viable and match all relevant sustainability criteria.
51
As an example, one of the demonstration projects will obtain galactaric acid and galactaric acid derivatives from sugar beet side-streams. These chemical building blocks have no fossil-based counterparts and the mild processing routes lead to a reduced energy consumption. The galactaric acid derivatives will be used to produce bio-based products in different applications, such as painting, coatings and detergents, which are also expected to have improved functionalities (easier to use, taste, durability colour, transparency)
Results: The total number of new building blocks reported by the projects is 46, corresponding to approximately 1-3 new building blocks per project.
The mentioned new bio-based building blocks include the following examples:
• lignin-derived phenols from agricultural residues to produce several types of bio-polymers,
• branched saccharides from food-processing residues to substitute petrol-based polymers,
• ammonium from organic waste as building block for the production of nitrogen and NPK fertilisers,
• lignin-based resins and composites, chitin derivatives, functional peptides, starch-based polymers,
• different varieties of micro-fibrillated cellulose (MFC) for multiple application in home and personal care products, adhesives or paintings, among others.
Figure 19 shows the aspects of novelty in the new bio-based building blocks as reported by the projects in 2016. The most reported aspects of novelty are:
• feedstock with a reduced share of fossil-based counterparts (36% of the projects) or zero fossil-based counterparts (31%).
• environmental performance, thanks to CO2 emission reduction (47% of the projects), reduced energy consumption (33%), reduced emission of other greenhouse gas (25%) and improved land use (28%).
• economic performance due to better resource/material efficiency (42%) or better processing yields efficiency (39%).
• product performance, covering health and safety benefits (33%), biodegradability (28%), recyclability (25%), lighter structural and semi-structural materials (14%)
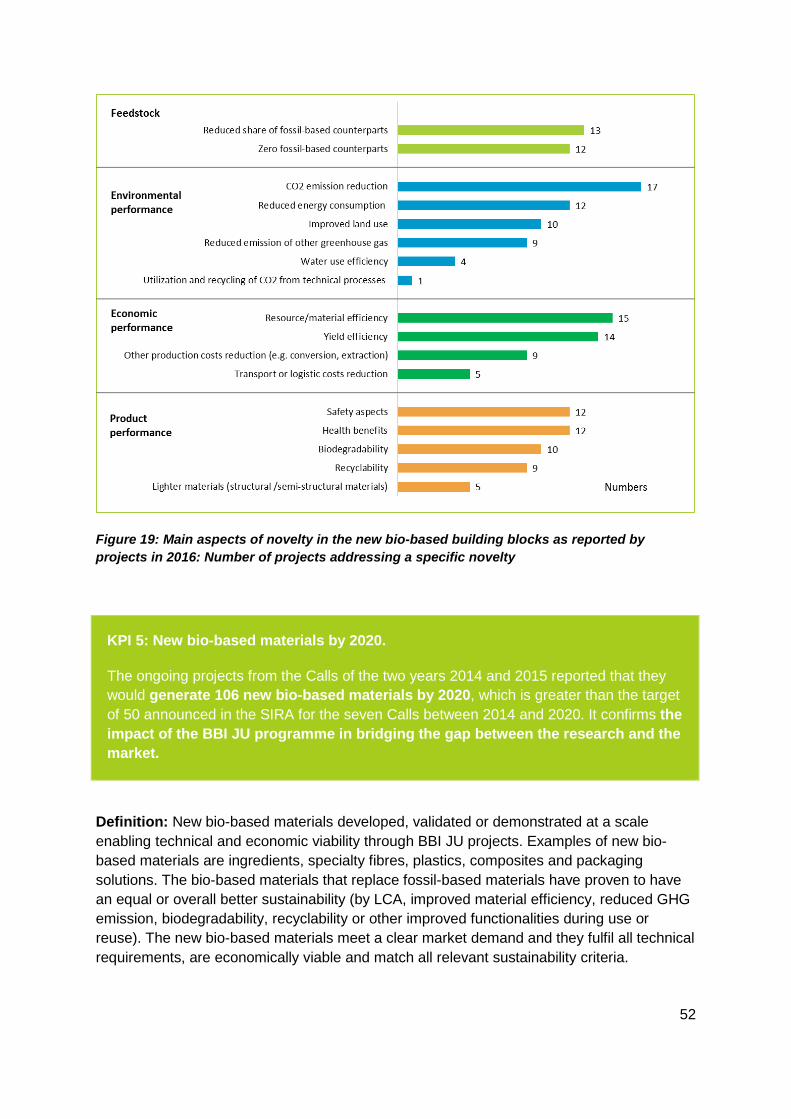
52
Figure 19: Main aspects of novelty in the new bio-based building blocks as reported by projects in 2016: Number of projects addressing a specific novelty
KPI 5: New bio-based materials by 2020.
The ongoing projects from the Calls of the two years 2014 and 2015 reported that they would generate 106 new bio-based materials by 2020, which is greater than the target of 50 announced in the SIRA for the seven Calls between 2014 and 2020. It confirms the impact of the BBI JU programme in bridging the gap between the research and the market.
Definition: New bio-based materials developed, validated or demonstrated at a scale enabling technical and economic viability through BBI JU projects. Examples of new bio-based materials are ingredients, specialty fibres, plastics, composites and packaging solutions. The bio-based materials that replace fossil-based materials have proven to have an equal or overall better sustainability (by LCA, improved material efficiency, reduced GHG emission, biodegradability, recyclability or other improved functionalities during use or reuse). The new bio-based materials meet a clear market demand and they fulfil all technical requirements, are economically viable and match all relevant sustainability criteria.
53
An illustrative example is provided by one of demo projects, which will produce different bio-based materials, such as barrier films, trays or printing inks from cellulosic origin that will be part of different packaging solutions for the food and electronic industry. These bio-based materials will improve the final performance of the products as they will be 100% biodegradable or recyclable and reduce the weight, thereby reducing CO2 emissions related to transportation.
Results: The total number of new bio-based materials reported by the projects amounts to 106. There is a high variety of the above-mentioned new bio-based materials Some examples are: antioxidants, composites, cosmetics, ingredients, biopolymers, packaging films and trays, fibres for papermaking, renewable polyesters, Nano carriers, specialty fibres, copolyesters for automotive & electronics.
Figure 20 shows the main aspects of novelty in the new bio-based materials as reported by the BBI projects in 2016. The most reported aspects of novelty are the following:
• feedstock with a reduced share of fossil-based counterparts (33%) or zero fossil-based counterparts (33%).
• environmental performance through CO2 emission reduction (47% of the projects), reduced energy consumption (31%), reduced emission of other greenhouse gas (22%) and improved land use (22%).
• economic performance due to lower input costs (resource/material efficiency, 42%), better process yields efficiency (31%) or other reduced production costs (incl. conversion, extraction, industrial processes) (31%), as well as transport or logistic costs (22%).
• product performance including health benefits (42%), biodegradability (36%), improved safety (31%) or recyclability (28%).
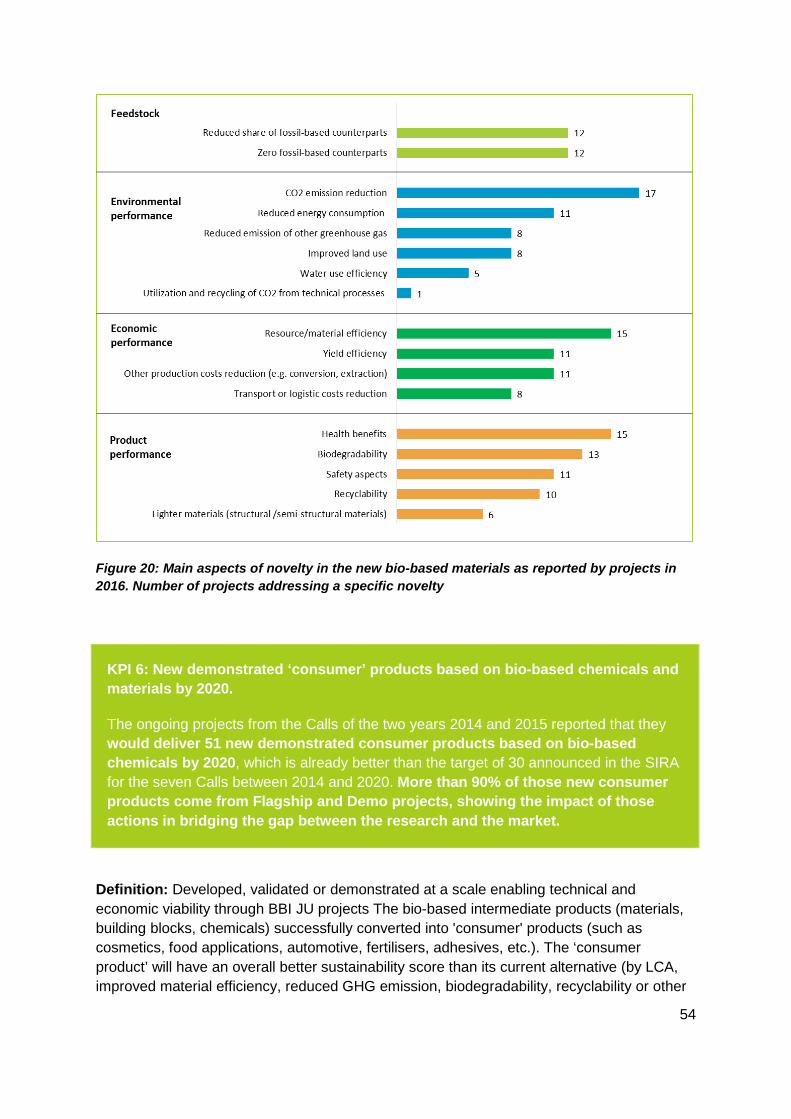
54
Figure 20: Main aspects of novelty in the new bio-based materials as reported by projects in 2016. Number of projects addressing a specific novelty
KPI 6: New demonstrated ‘consumer’ products based on bio-based chemicals and materials by 2020.
The ongoing projects from the Calls of the two years 2014 and 2015 reported that they would deliver 51 new demonstrated consumer products based on bio-based chemicals by 2020, which is already better than the target of 30 announced in the SIRA for the seven Calls between 2014 and 2020. More than 90% of those new consumer products come from Flagship and Demo projects, showing the impact of those actions in bridging the gap between the research and the market.
Definition: Developed, validated or demonstrated at a scale enabling technical and economic viability through BBI JU projects The bio-based intermediate products (materials, building blocks, chemicals) successfully converted into 'consumer' products (such as cosmetics, food applications, automotive, fertilisers, adhesives, etc.). The ‘consumer product’ will have an overall better sustainability score than its current alternative (by LCA, improved material efficiency, reduced GHG emission, biodegradability, recyclability or other
55
improved effects during use or reuse). The bio-based ‘consumer products’ meet a clear market demand and they fulfil all technical requirements, are economically viable and match all relevant sustainability criteria.
A representative example of the variety and multiplicity of products with bio-based origin are the bio-based products developed by one the flagship projects with the use of Microfibres of cellulose (MFC) as a replacement for fossil-based elements. MFC will be used to produce bio-based products in the areas of personal and home care, adhesives, coatings, paintings, chemicals for agriculture or construction. Apart from improving the functionalities of the products (e.g. rheological properties), the substitution of fossil-based chemicals by MFC is expected to result into significant CO2 reduction (70-90% CO2 savings depending on the final product).
Results: The total number of new bio-based consumer products reported by the projects is 51. With respect to the value chains, 25 of the new products come from VC2, 17 from VC3, two from VC1, two from VC4 and one from cross VC.
The new bio-based products include: fertilizers, cosmetics, proteins, aromas, enzymes, paints, coatings, adhesives, personal care products, cleaning products, packaging solutions, lubricants and different types of bioplastics.
Figure 21 shows the aspects of novelty in the new bio-based products as reported by the BBI projects in 2016. The most reported aspects of novelty are:
• environmental performance through reduced CO2 emission (28% of the projects), reduced energy consumption (25%) and water use efficiency (17%);
• economic performance: reduced input costs due to resource/ material efficiency (33%) and other production costs reduction, including conversion, extraction, industrial processes (22%) and improved process yields (19%);
• product performance, including biodegradability (25%), health aspects (25%) and safety aspects (17%).
• feedstock with a reduced share of fossil-based counterparts (25%) or zero fossil-based counterparts (17%)
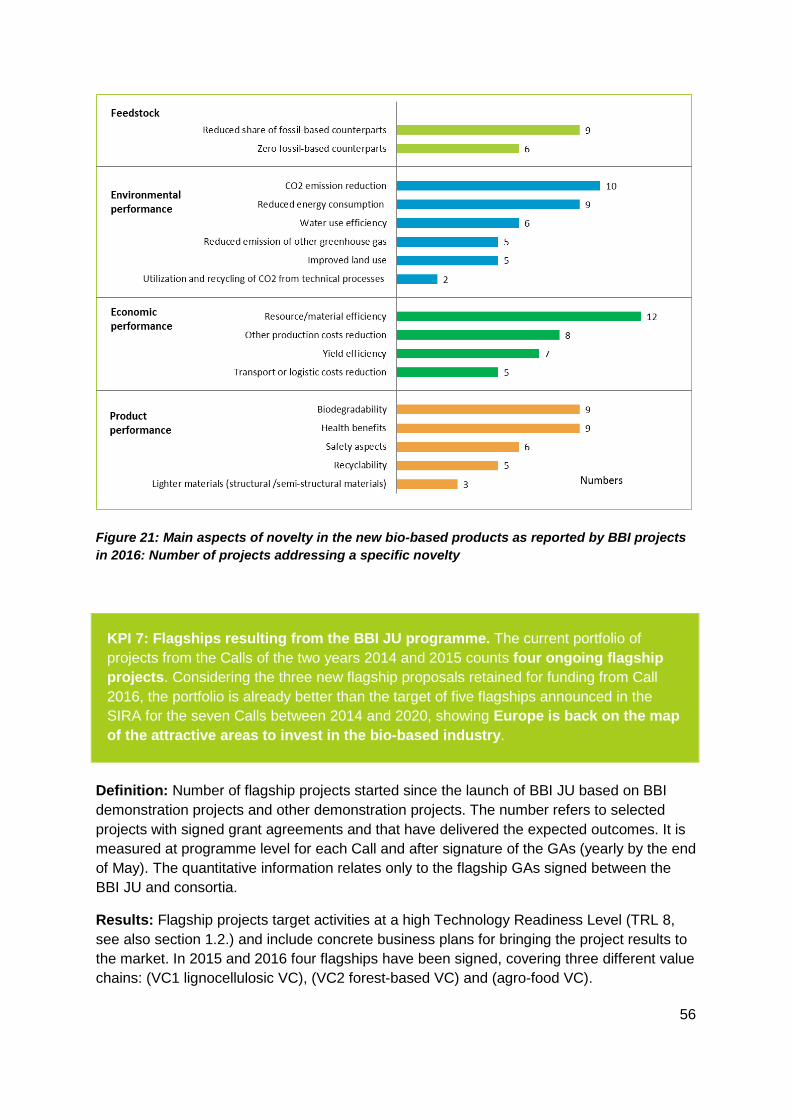
56
Figure 21: Main aspects of novelty in the new bio-based products as reported by BBI projects in 2016: Number of projects addressing a specific novelty
KPI 7: Flagships resulting from the BBI JU programme. The current portfolio of projects from the Calls of the two years 2014 and 2015 counts four ongoing flagship projects. Considering the three new flagship proposals retained for funding from Call 2016, the portfolio is already better than the target of five flagships announced in the SIRA for the seven Calls between 2014 and 2020, showing Europe is back on the map of the attractive areas to invest in the bio-based industry.
Definition: Number of flagship projects started since the launch of BBI JU based on BBI demonstration projects and other demonstration projects. The number refers to selected projects with signed grant agreements and that have delivered the expected outcomes. It is measured at programme level for each Call and after signature of the GAs (yearly by the end of May). The quantitative information relates only to the flagship GAs signed between the BBI JU and consortia.
Results: Flagship projects target activities at a high Technology Readiness Level (TRL 8, see also section 1.2.) and include concrete business plans for bringing the project results to the market. In 2015 and 2016 four flagships have been signed, covering three different value chains: (VC1 lignocellulosic VC), (VC2 forest-based VC) and (agro-food VC).
57
FIRST2RUN (Started 2016 for five years): The project will demonstrate the techno-economic and environmental sustainability at industrial scale of an integrated biorefinery, in which underutilised oil crops, like cardoon, grown on arid and marginal lands are exploited for the extraction of vegetable oils to be further converted into bio-products, such as bioplastics, cosmetics and lubricants. By- and co-products from the process will be valorised and used for the production of energy, animal feed and added-value chemicals.
The project implements new business models aimed at implementing optimal value chains for each identified cluster of products. It is targeting at a development of three new (or optimised) bio-based value chains by 2020, delivering three new bio-based building blocks (azelaic acid, pelargonic acid and glycerine), three new bio-based materials (biopolymers based on the three building blocks) and four new consumer products.
BIOSKOH (Started 2016 for five years): The project utilises agricultural residues (e.g. wheat, rye, soya straw, rapeseed straw, sorghum bicolor) and formerly unused woody biomass for the industrial production of biofuels, and will develop new business models based on using agricultural residues and energy crops. Through developing or combining new technologies, the project will deliver at least two new bio-based building blocks (bioethanol and lignin) and three bio-based materials (formaldehyde, bioethylene, carbon fibres).
LIGNOFLAG (Started 2016 for five years): Commercial flagship plant for bio-ethanol production involving a bio-based value chain built on lignocellulosic feedstock. The project is expected to build and operate a commercial flagship to convert biochemical lignocellulose into cellulosic bioethanol to be used as sustainable transport fuel or chemical building block. The project involves the collaboration of all relevant actors along the whole value chain, from feedstock (straw) supply and logistics via process co-products (lignin as biochar, sludge as fertilizer) utilisation and valorisation to advanced bio-ethanol production and product distribution.
EXILVA (Started 2016 for three years): Flagship of an integrated plant towards large-scale supply and market assessment of Microfibrillated Cellulose (MFC), which will be used for application in a wide range of market segments, such as home and care products, adhesives, paints and coatings. The project is targeting the development of ten new (or optimised) bio-based value chains by 2020, while combining various sectors and delivering MFC with lower CO2 and energy footprint.
1.3.1.2 Monitoring the leverage effect
The leverage effect aims to measure the ability of the BBI JU in attracting additional financing and multiplying Horizon 2020 budget resources, including additional activities. The BBI JU regulation sets out that for the period from 2014 until the end of the initiative in 2024, the total private contribution of BIC and/or its constituent entities shall be at least € 2.73 billion and that the EU contribution shall be up to € 975 million. So by 2024 a minimum of € 2.8 of private in-kind and/or financial contribution shall be leveraged for each euro of EU funding.
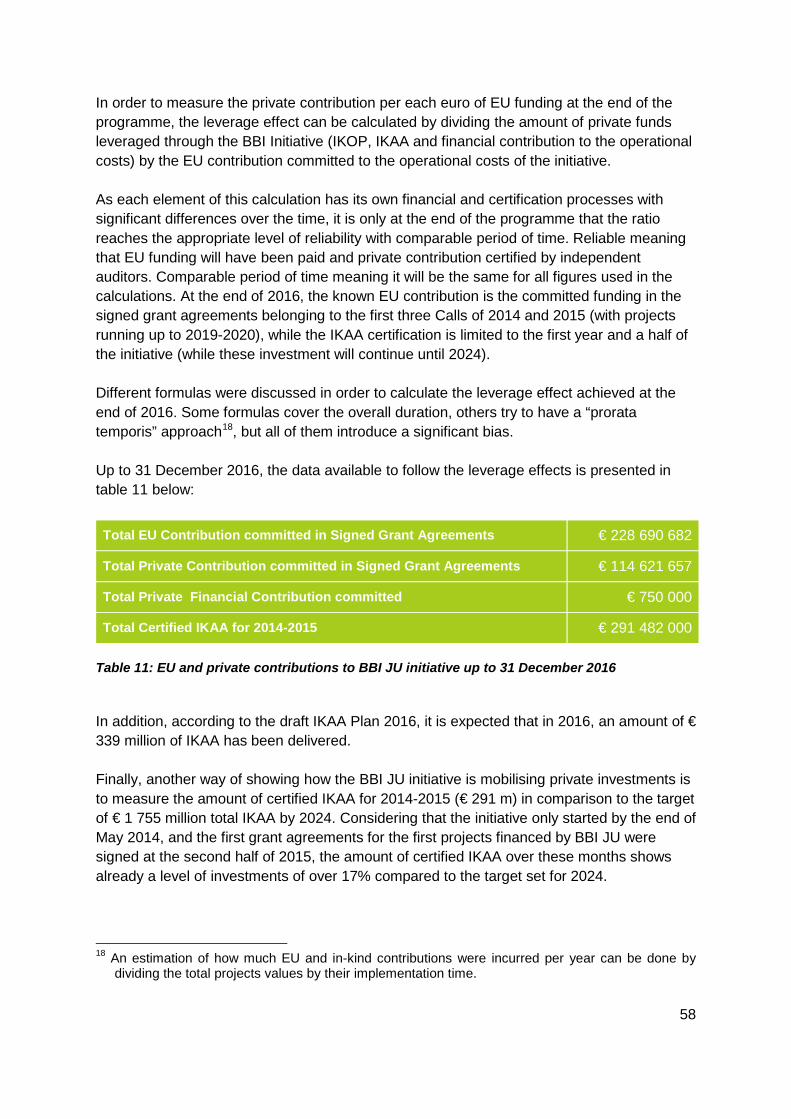
58
In order to measure the private contribution per each euro of EU funding at the end of the programme, the leverage effect can be calculated by dividing the amount of private funds leveraged through the BBI Initiative (IKOP, IKAA and financial contribution to the operational costs) by the EU contribution committed to the operational costs of the initiative. As each element of this calculation has its own financial and certification processes with significant differences over the time, it is only at the end of the programme that the ratio reaches the appropriate level of reliability with comparable period of time. Reliable meaning that EU funding will have been paid and private contribution certified by independent auditors. Comparable period of time meaning it will be the same for all figures used in the calculations. At the end of 2016, the known EU contribution is the committed funding in the signed grant agreements belonging to the first three Calls of 2014 and 2015 (with projects running up to 2019-2020), while the IKAA certification is limited to the first year and a half of the initiative (while these investment will continue until 2024). Different formulas were discussed in order to calculate the leverage effect achieved at the end of 2016. Some formulas cover the overall duration, others try to have a “prorata temporis” approach18, but all of them introduce a significant bias. Up to 31 December 2016, the data available to follow the leverage effects is presented in table 11 below:
Total EU Contribution committed in Signed Grant Agreements € 228 690 682
Total Private Contribution committed in Signed Grant Agreements € 114 621 657
Total Private Financial Contribution committed € 750 000
Total Certified IKAA for 2014-2015 € 291 482 000
Table 11: EU and private contributions to BBI JU initiative up to 31 December 2016
In addition, according to the draft IKAA Plan 2016, it is expected that in 2016, an amount of € 339 million of IKAA has been delivered. Finally, another way of showing how the BBI JU initiative is mobilising private investments is to measure the amount of certified IKAA for 2014-2015 (€ 291 m) in comparison to the target of € 1 755 million total IKAA by 2024. Considering that the initiative only started by the end of May 2014, and the first grant agreements for the first projects financed by BBI JU were signed at the second half of 2015, the amount of certified IKAA over these months shows already a level of investments of over 17% compared to the target set for 2024.
18 An estimation of how much EU and in-kind contributions were incurred per year can be done by
dividing the total projects values by their implementation time.
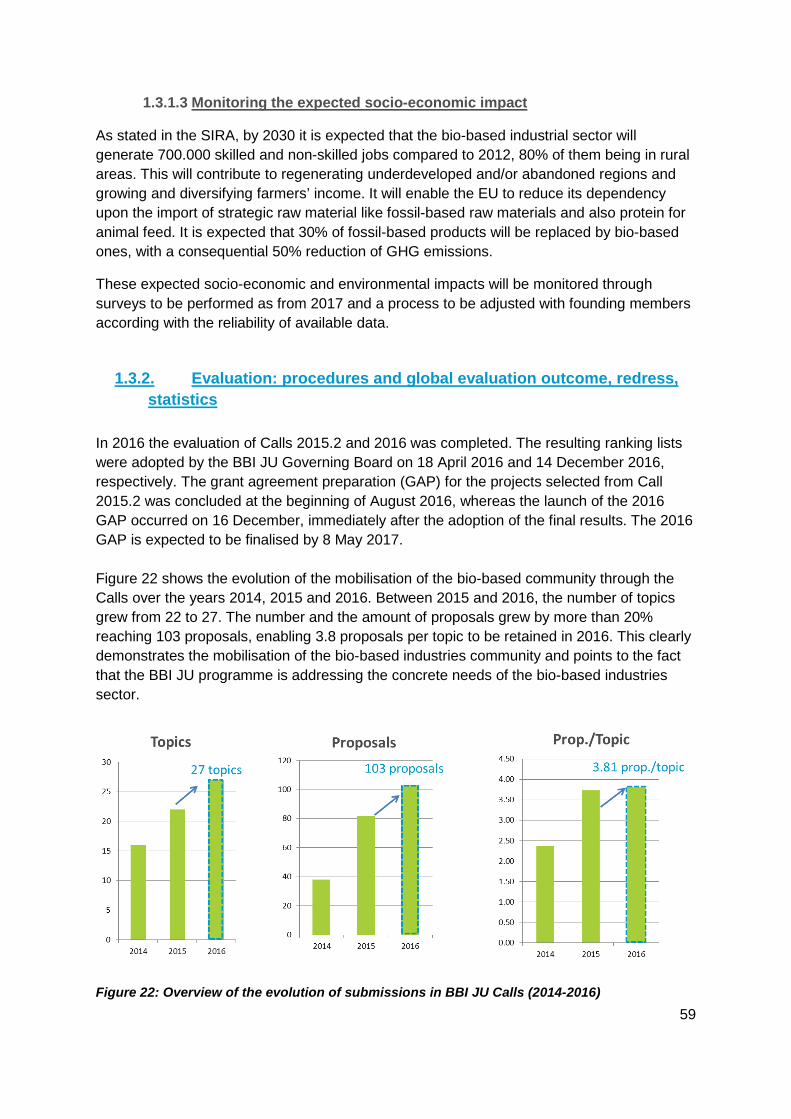
59
1.3.1.3 Monitoring the expected socio-economic impact
As stated in the SIRA, by 2030 it is expected that the bio-based industrial sector will generate 700.000 skilled and non-skilled jobs compared to 2012, 80% of them being in rural areas. This will contribute to regenerating underdeveloped and/or abandoned regions and growing and diversifying farmers’ income. It will enable the EU to reduce its dependency upon the import of strategic raw material like fossil-based raw materials and also protein for animal feed. It is expected that 30% of fossil-based products will be replaced by bio-based ones, with a consequential 50% reduction of GHG emissions.
These expected socio-economic and environmental impacts will be monitored through surveys to be performed as from 2017 and a process to be adjusted with founding members according with the reliability of available data.
1.3.2. Evaluation: procedures and global evaluation outcome, redress, statistics
In 2016 the evaluation of Calls 2015.2 and 2016 was completed. The resulting ranking lists were adopted by the BBI JU Governing Board on 18 April 2016 and 14 December 2016, respectively. The grant agreement preparation (GAP) for the projects selected from Call 2015.2 was concluded at the beginning of August 2016, whereas the launch of the 2016 GAP occurred on 16 December, immediately after the adoption of the final results. The 2016 GAP is expected to be finalised by 8 May 2017. Figure 22 shows the evolution of the mobilisation of the bio-based community through the Calls over the years 2014, 2015 and 2016. Between 2015 and 2016, the number of topics grew from 22 to 27. The number and the amount of proposals grew by more than 20% reaching 103 proposals, enabling 3.8 proposals per topic to be retained in 2016. This clearly demonstrates the mobilisation of the bio-based industries community and points to the fact that the BBI JU programme is addressing the concrete needs of the bio-based industries sector.
Figure 22: Overview of the evolution of submissions in BBI JU Calls (2014-2016)
60
In the sections below, more detailed information is provided on the submissions as well as on the proposals retained for funding, specifically in Calls 2015.2 and 2016. In particular, the following information is included:
• number of proposals submitted per topic and success rates;
• types of participants (submissions and retained for funding);
• country distribution in proposals submitted and retained for funding;
• share of SMEs in submitted and retained proposals;
• share of SME funding in retained proposals
Call 2015.2 Evaluation: key statistics and information on topics
Summary
The 2015.2 Call for Proposals covered Research and Innovation Actions (RIA), Innovation Actions (IA) – only Demonstration Actions (DEMO) –, and Coordination and Support Actions (CSA). The total indicative budget for the Call was € 106 million (the breakdown per type of action is shown in table 12). The Call contained 19 topics (7 DEMO, 10 RIA, 2 CSA). Seventy-three eligible proposals were submitted and evaluated and 23 proposals were retained for funding.
Evaluation process
The evaluation took place from mid-February until beginning of March 2016, with the assistance of 58 independent experts and two independent observers, in accordance with the procedures laid down in the Horizon 2020 Guide for proposal submission and evaluation. In addition, one expert assisted the Programme Office as Quality Controller. Two independent experts selected and appointed by the Programme Office conducted an ethical screening uniquely for proposals above the thresholds (main and reserve list). The ethical screening was finalised before the signature of the Grant Agreements (GAs).
In selecting experts, the primary objective was to ensure a high level of expertise in the areas of the topics in the Call as well as experience in Horizon 2020 evaluations. In addition, there was consideration given to achieving an appropriate gender balance and geographical diversity as well as participation of experts from the industry in the overall composition of the evaluation panels.
These considerations were reflected across the selection of 60 experts giving a gender balance of 32 men (53%) and 28 women (47%) and a healthy regional balance where 25 different countries were represented. Applicants were informed on the evaluation outcome on 22 April 2016, meeting the requirements for this process to notify applicants no later than five months after the proposal
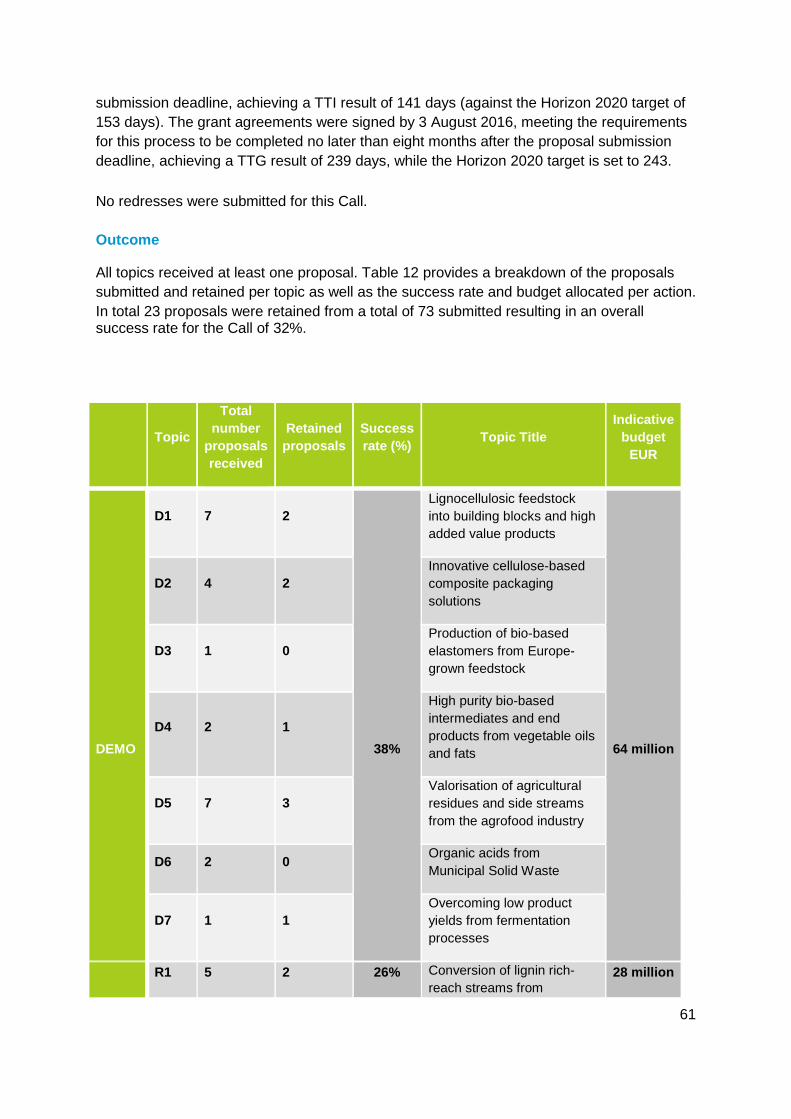
61
submission deadline, achieving a TTI result of 141 days (against the Horizon 2020 target of 153 days). The grant agreements were signed by 3 August 2016, meeting the requirements for this process to be completed no later than eight months after the proposal submission deadline, achieving a TTG result of 239 days, while the Horizon 2020 target is set to 243. No redresses were submitted for this Call. Outcome
All topics received at least one proposal. Table 12 provides a breakdown of the proposals submitted and retained per topic as well as the success rate and budget allocated per action. In total 23 proposals were retained from a total of 73 submitted resulting in an overall success rate for the Call of 32%.
Topic
Total number
proposals received
Retained proposals
Success rate (%) Topic Title
Indicative budget
EUR
DEMO
D1 7 2
38%
Lignocellulosic feedstock into building blocks and high added value products
64 million
D2 4 2 Innovative cellulose-based composite packaging solutions
D3 1 0 Production of bio-based elastomers from Europe-grown feedstock
D4 2 1
High purity bio-based intermediates and end products from vegetable oils and fats
D5 7 3 Valorisation of agricultural residues and side streams from the agrofood industry
D6 2 0 Organic acids from Municipal Solid Waste
D7 1 1 Overcoming low product yields from fermentation processes
R1 5 2 26% Conversion of lignin rich-reach streams from
28 million
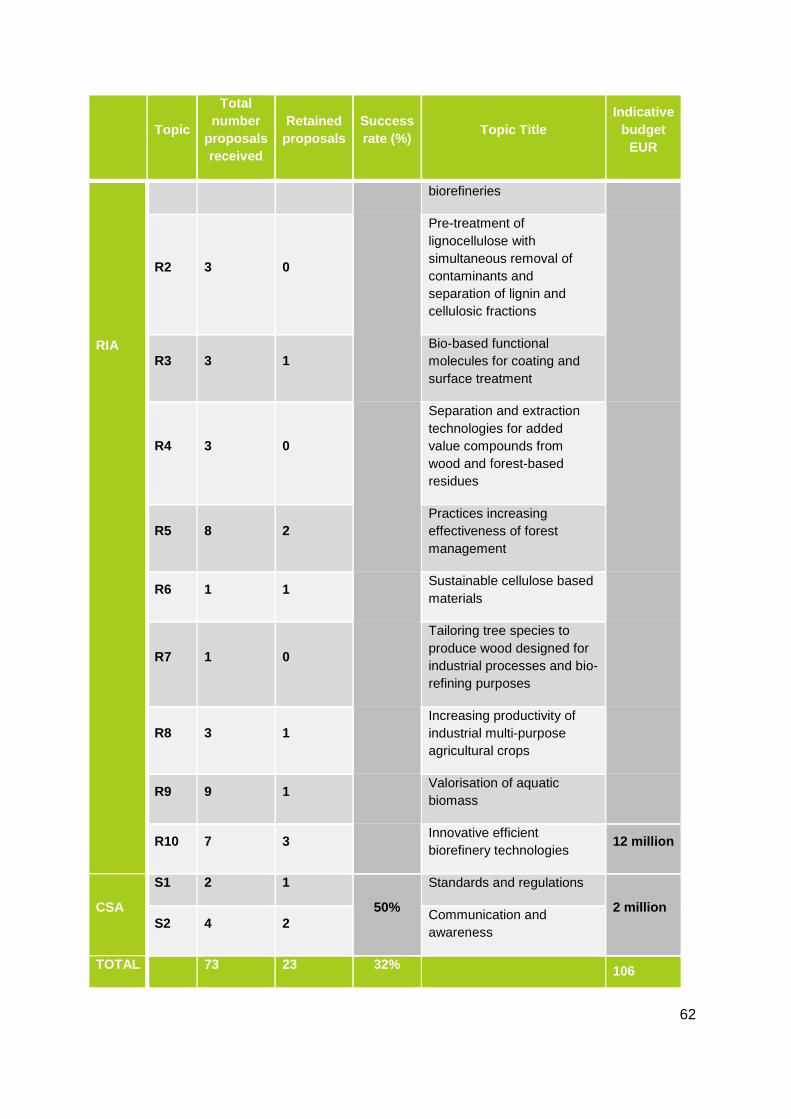
62
Topic
Total number
proposals received
Retained proposals
Success rate (%) Topic Title
Indicative budget
EUR
RIA
biorefineries
R2 3 0
Pre-treatment of lignocellulose with simultaneous removal of contaminants and separation of lignin and cellulosic fractions
R3 3 1 Bio-based functional molecules for coating and surface treatment
R4 3 0
Separation and extraction technologies for added value compounds from wood and forest-based residues
R5 8 2 Practices increasing effectiveness of forest management
R6 1 1 Sustainable cellulose based materials
R7 1 0
Tailoring tree species to produce wood designed for industrial processes and bio-refining purposes
R8 3 1 Increasing productivity of industrial multi-purpose agricultural crops
R9 9 1 Valorisation of aquatic biomass
R10 7 3 Innovative efficient biorefinery technologies
12 million
CSA
S1 2 1
50%
Standards and regulations
2 million S2 4 2 Communication and
awareness
TOTAL
73 23 32% 106
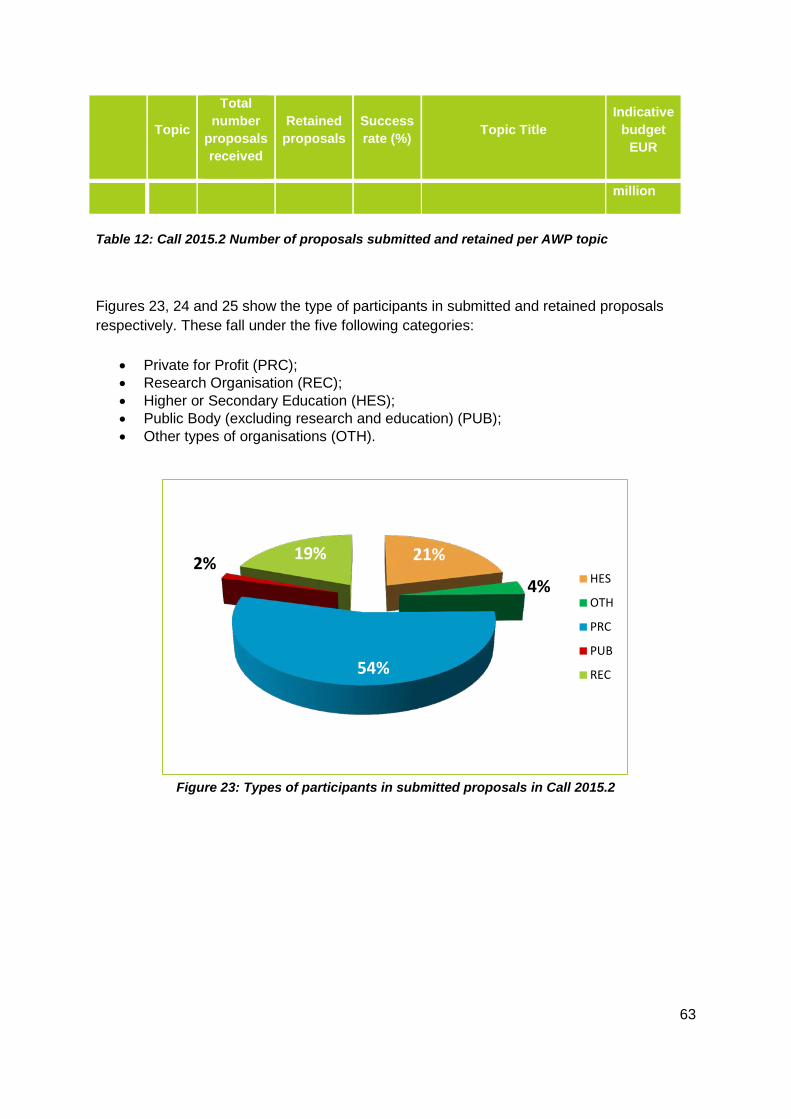
63
Topic
Total number
proposals received
Retained proposals
Success rate (%) Topic Title
Indicative budget
EUR
million
Table 12: Call 2015.2 Number of proposals submitted and retained per AWP topic
Figures 23, 24 and 25 show the type of participants in submitted and retained proposals respectively. These fall under the five following categories:
• Private for Profit (PRC); • Research Organisation (REC); • Higher or Secondary Education (HES); • Public Body (excluding research and education) (PUB); • Other types of organisations (OTH).
Figure 23: Types of participants in submitted proposals in Call 2015.2
21%
4%
54%
2% 19% HES
OTH
PRC
PUB
REC
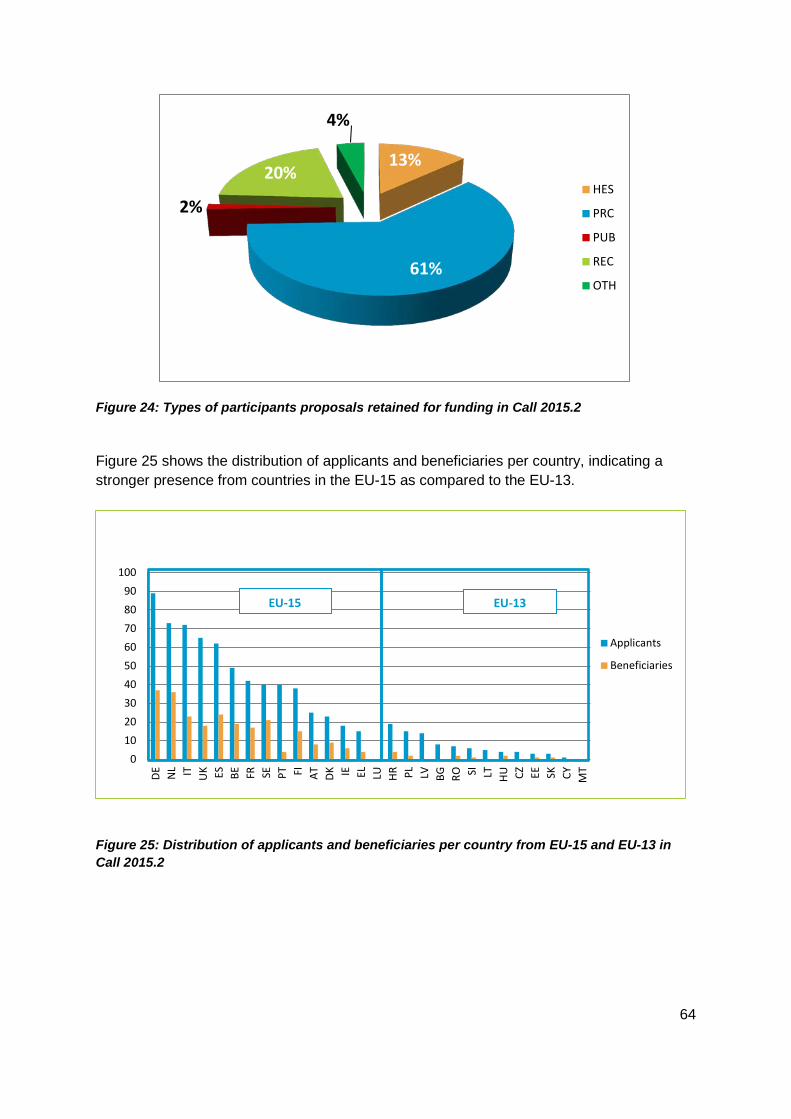
64
Figure 24: Types of participants proposals retained for funding in Call 2015.2
Figure 25 shows the distribution of applicants and beneficiaries per country, indicating a stronger presence from countries in the EU-15 as compared to the EU-13.
Figure 25: Distribution of applicants and beneficiaries per country from EU-15 and EU-13 in Call 2015.2
13%
61%
2%
20%
4%
HES
PRC
PUB
REC
OTH
0102030405060708090
100
DE NL IT UK ES BE FR SE PT FI AT DK IE EL LU HR PL LV BG RO SI LT HU CZ EE SK CY MT
Applicants
Beneficiaries
EU-15 EU-13
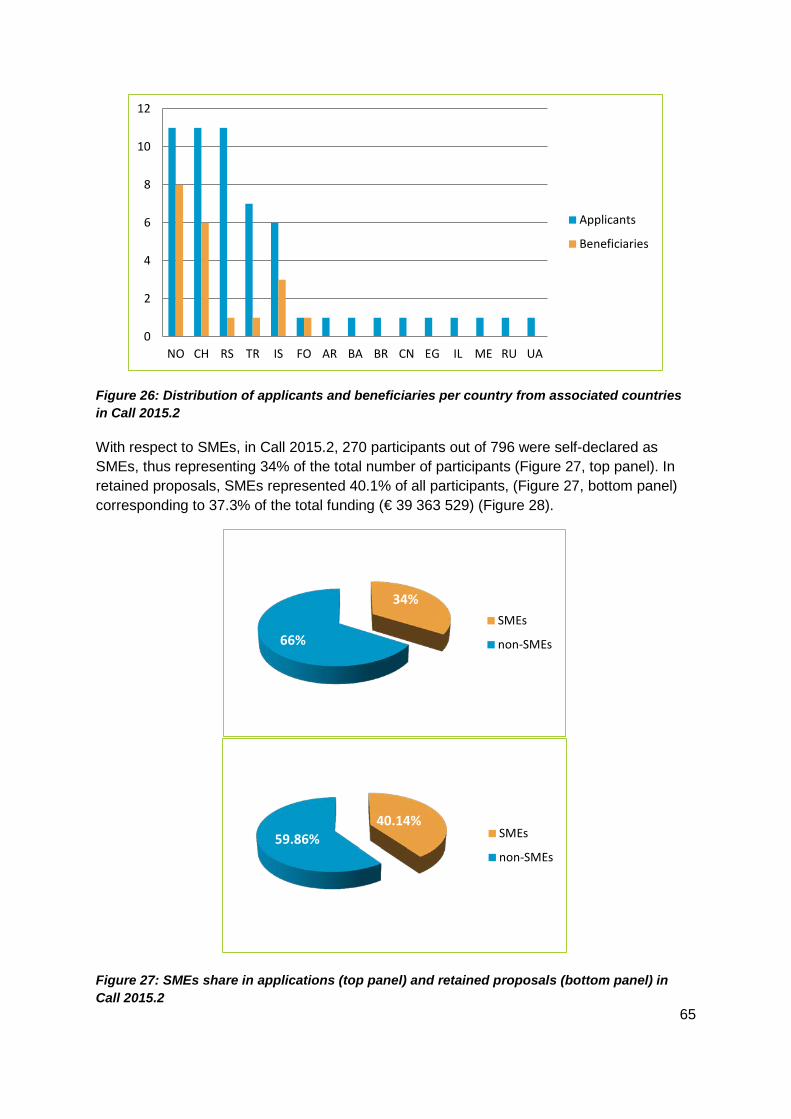
65
Figure 26: Distribution of applicants and beneficiaries per country from associated countries in Call 2015.2
With respect to SMEs, in Call 2015.2, 270 participants out of 796 were self-declared as SMEs, thus representing 34% of the total number of participants (Figure 27, top panel). In retained proposals, SMEs represented 40.1% of all participants, (Figure 27, bottom panel) corresponding to 37.3% of the total funding (€ 39 363 529) (Figure 28).
Figure 27: SMEs share in applications (top panel) and retained proposals (bottom panel) in Call 2015.2
0
2
4
6
8
10
12
NO CH RS TR IS FO AR BA BR CN EG IL ME RU UA
Applicants
Beneficiaries
34%
66% SMEs
non-SMEs
40.14% 59.86% SMEs
non-SMEs
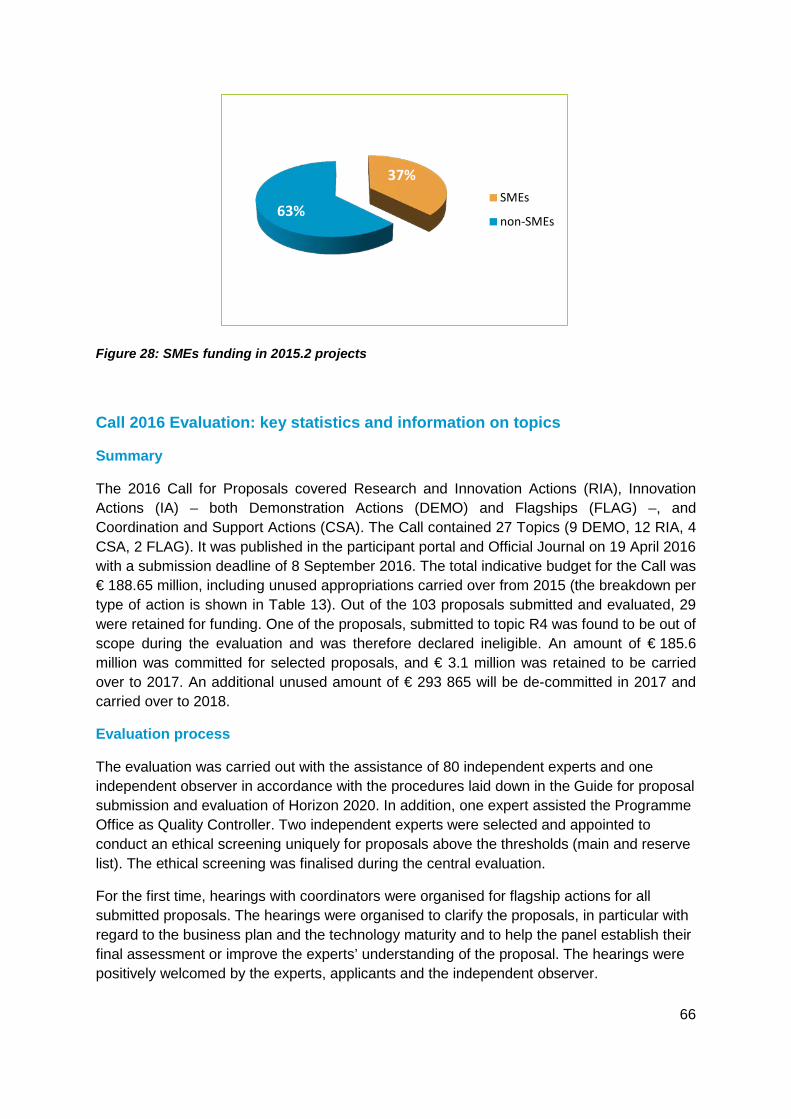
66
Figure 28: SMEs funding in 2015.2 projects
Call 2016 Evaluation: key statistics and information on topics
Summary
The 2016 Call for Proposals covered Research and Innovation Actions (RIA), Innovation Actions (IA) – both Demonstration Actions (DEMO) and Flagships (FLAG) –, and Coordination and Support Actions (CSA). The Call contained 27 Topics (9 DEMO, 12 RIA, 4 CSA, 2 FLAG). It was published in the participant portal and Official Journal on 19 April 2016 with a submission deadline of 8 September 2016. The total indicative budget for the Call was € 188.65 million, including unused appropriations carried over from 2015 (the breakdown per type of action is shown in Table 13). Out of the 103 proposals submitted and evaluated, 29 were retained for funding. One of the proposals, submitted to topic R4 was found to be out of scope during the evaluation and was therefore declared ineligible. An amount of € 185.6 million was committed for selected proposals, and € 3.1 million was retained to be carried over to 2017. An additional unused amount of € 293 865 will be de-committed in 2017 and carried over to 2018.
Evaluation process
The evaluation was carried out with the assistance of 80 independent experts and one independent observer in accordance with the procedures laid down in the Guide for proposal submission and evaluation of Horizon 2020. In addition, one expert assisted the Programme Office as Quality Controller. Two independent experts were selected and appointed to conduct an ethical screening uniquely for proposals above the thresholds (main and reserve list). The ethical screening was finalised during the central evaluation.
For the first time, hearings with coordinators were organised for flagship actions for all submitted proposals. The hearings were organised to clarify the proposals, in particular with regard to the business plan and the technology maturity and to help the panel establish their final assessment or improve the experts’ understanding of the proposal. The hearings were positively welcomed by the experts, applicants and the independent observer.
37%
63% SMEs
non-SMEs
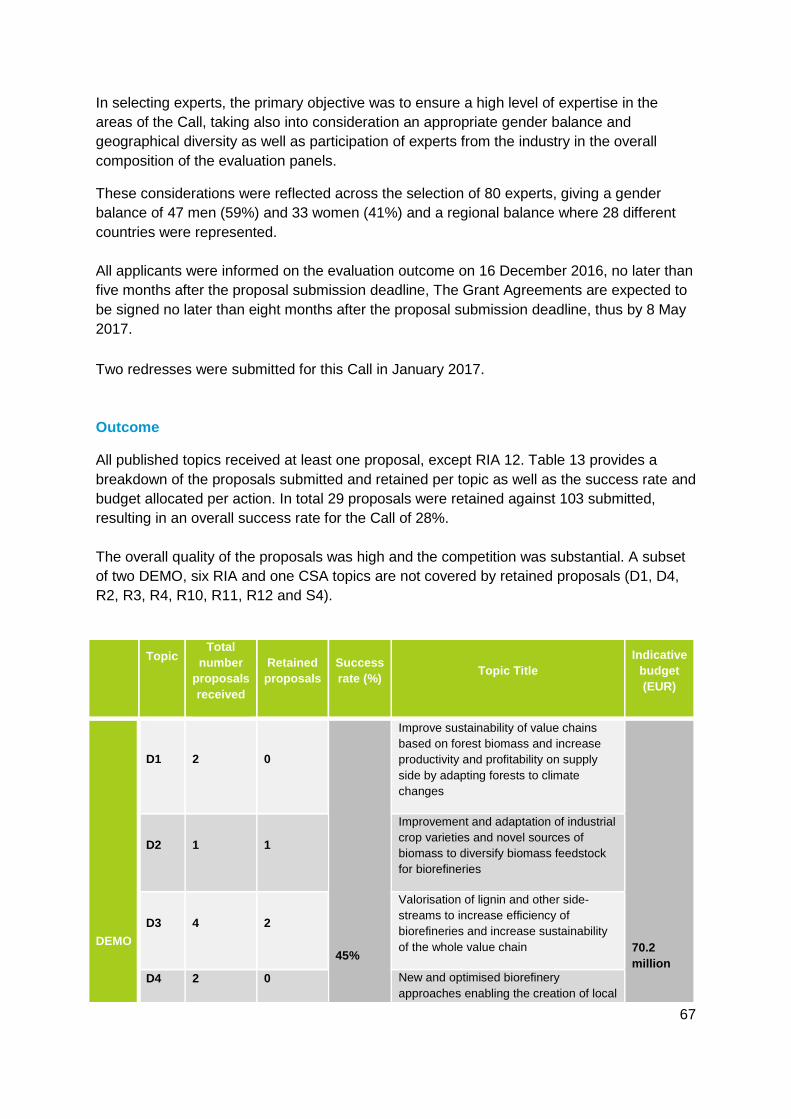
67
In selecting experts, the primary objective was to ensure a high level of expertise in the areas of the Call, taking also into consideration an appropriate gender balance and geographical diversity as well as participation of experts from the industry in the overall composition of the evaluation panels.
These considerations were reflected across the selection of 80 experts, giving a gender balance of 47 men (59%) and 33 women (41%) and a regional balance where 28 different countries were represented. All applicants were informed on the evaluation outcome on 16 December 2016, no later than five months after the proposal submission deadline, The Grant Agreements are expected to be signed no later than eight months after the proposal submission deadline, thus by 8 May 2017. Two redresses were submitted for this Call in January 2017. Outcome
All published topics received at least one proposal, except RIA 12. Table 13 provides a breakdown of the proposals submitted and retained per topic as well as the success rate and budget allocated per action. In total 29 proposals were retained against 103 submitted, resulting in an overall success rate for the Call of 28%. The overall quality of the proposals was high and the competition was substantial. A subset of two DEMO, six RIA and one CSA topics are not covered by retained proposals (D1, D4, R2, R3, R4, R10, R11, R12 and S4).
Topic
Total number
proposals received
Retained proposals
Success rate (%) Topic Title
Indicative budget (EUR)
DEMO
D1 2 0
45%
Improve sustainability of value chains based on forest biomass and increase productivity and profitability on supply side by adapting forests to climate changes
70.2 million
D2 1 1
Improvement and adaptation of industrial crop varieties and novel sources of biomass to diversify biomass feedstock for biorefineries
D3 4 2
Valorisation of lignin and other side-streams to increase efficiency of biorefineries and increase sustainability of the whole value chain
D4 2 0 New and optimised biorefinery approaches enabling the creation of local
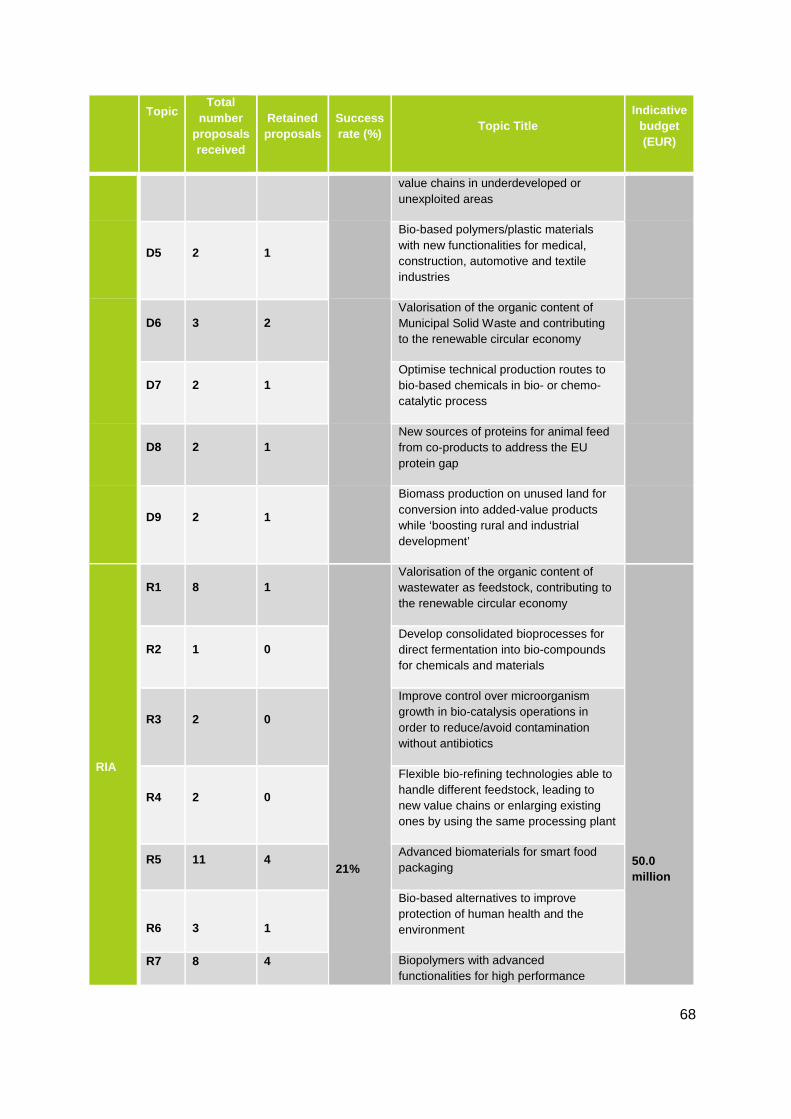
68
Topic
Total number
proposals received
Retained proposals
Success rate (%) Topic Title
Indicative budget (EUR)
value chains in underdeveloped or unexploited areas
D5 2 1
Bio-based polymers/plastic materials with new functionalities for medical, construction, automotive and textile industries
D6 3 2 Valorisation of the organic content of Municipal Solid Waste and contributing to the renewable circular economy
D7 2 1 Optimise technical production routes to bio-based chemicals in bio- or chemo-catalytic process
D8 2 1 New sources of proteins for animal feed from co-products to address the EU protein gap
D9 2 1
Biomass production on unused land for conversion into added-value products while ‘boosting rural and industrial development’
RIA
R1 8 1
21%
Valorisation of the organic content of wastewater as feedstock, contributing to the renewable circular economy
50.0 million
R2 1 0 Develop consolidated bioprocesses for direct fermentation into bio-compounds for chemicals and materials
R3 2 0
Improve control over microorganism growth in bio-catalysis operations in order to reduce/avoid contamination without antibiotics
R4 2 0
Flexible bio-refining technologies able to handle different feedstock, leading to new value chains or enlarging existing ones by using the same processing plant
R5 11 4 Advanced biomaterials for smart food packaging
R6
3
1
Bio-based alternatives to improve protection of human health and the environment
R7 8 4 Biopolymers with advanced functionalities for high performance
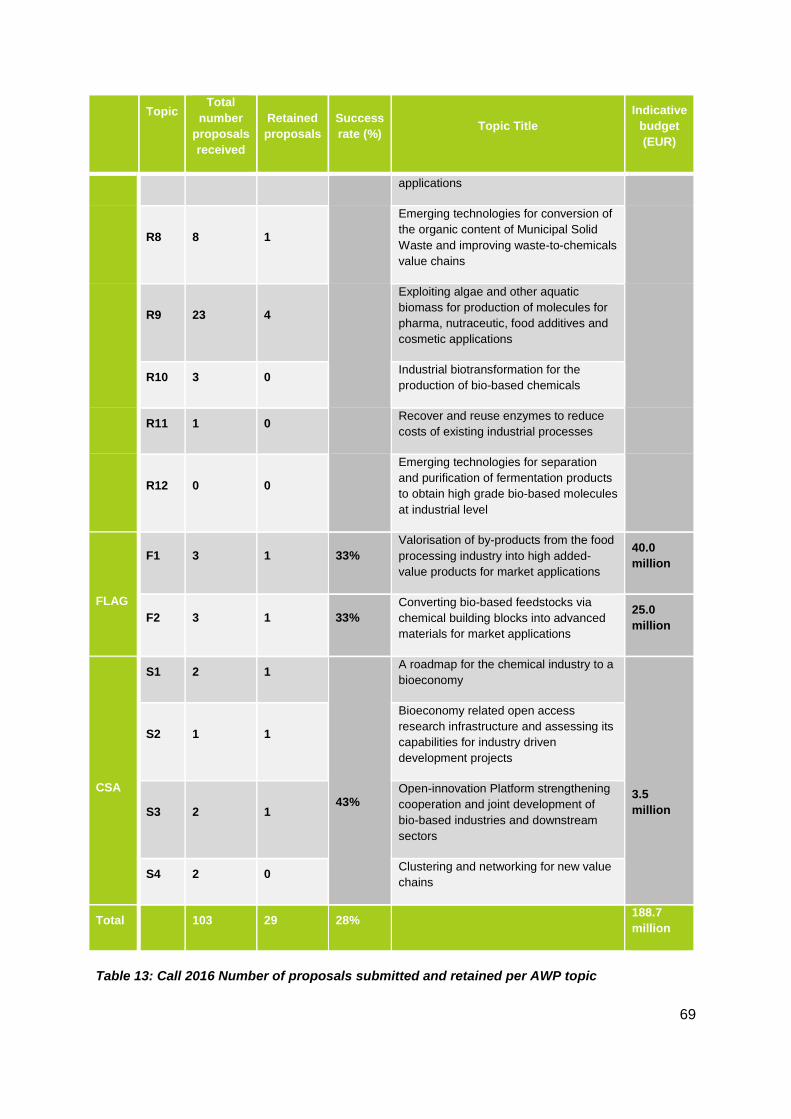
69
Topic
Total number
proposals received
Retained proposals
Success rate (%) Topic Title
Indicative budget (EUR)
applications
R8 8 1
Emerging technologies for conversion of the organic content of Municipal Solid Waste and improving waste-to-chemicals value chains
R9 23 4
Exploiting algae and other aquatic biomass for production of molecules for pharma, nutraceutic, food additives and cosmetic applications
R10 3 0 Industrial biotransformation for the production of bio-based chemicals
R11 1 0 Recover and reuse enzymes to reduce costs of existing industrial processes
R12 0 0
Emerging technologies for separation and purification of fermentation products to obtain high grade bio-based molecules at industrial level
FLAG
F1 3 1 33% Valorisation of by-products from the food processing industry into high added-value products for market applications
40.0 million
F2 3 1 33% Converting bio-based feedstocks via chemical building blocks into advanced materials for market applications
25.0 million
CSA
S1 2 1
43%
A roadmap for the chemical industry to a bioeconomy
3.5 million
S2 1 1
Bioeconomy related open access research infrastructure and assessing its capabilities for industry driven development projects
S3 2 1
Open-innovation Platform strengthening cooperation and joint development of bio-based industries and downstream sectors
S4 2 0 Clustering and networking for new value chains
Total 103 29 28% 188.7 million
Table 13: Call 2016 Number of proposals submitted and retained per AWP topic
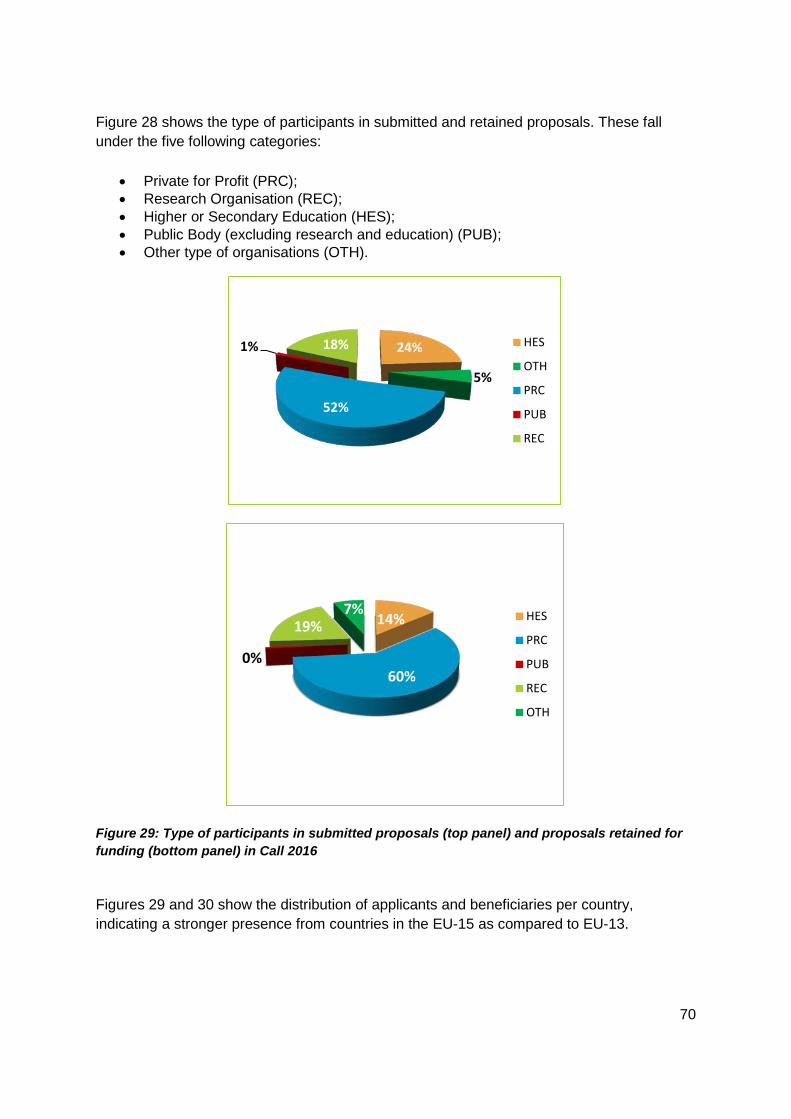
70
Figure 28 shows the type of participants in submitted and retained proposals. These fall under the five following categories:
• Private for Profit (PRC); • Research Organisation (REC); • Higher or Secondary Education (HES); • Public Body (excluding research and education) (PUB); • Other type of organisations (OTH).
Figure 29: Type of participants in submitted proposals (top panel) and proposals retained for funding (bottom panel) in Call 2016
Figures 29 and 30 show the distribution of applicants and beneficiaries per country, indicating a stronger presence from countries in the EU-15 as compared to EU-13.
24%
5%
52%
1% 18% HES
OTH
PRC
PUB
REC
14%
60%
0%
19% 7% HES
PRC
PUB
REC
OTH
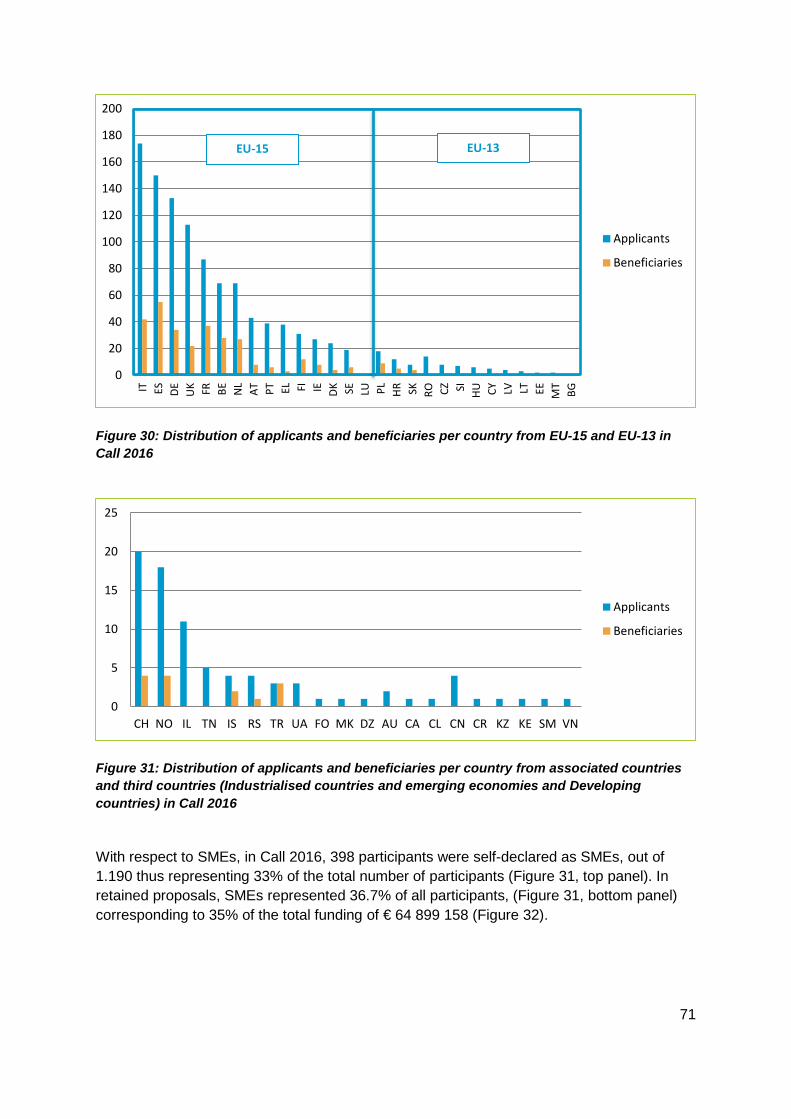
71
Figure 30: Distribution of applicants and beneficiaries per country from EU-15 and EU-13 in Call 2016
Figure 31: Distribution of applicants and beneficiaries per country from associated countries and third countries (Industrialised countries and emerging economies and Developing countries) in Call 2016
With respect to SMEs, in Call 2016, 398 participants were self-declared as SMEs, out of 1.190 thus representing 33% of the total number of participants (Figure 31, top panel). In retained proposals, SMEs represented 36.7% of all participants, (Figure 31, bottom panel) corresponding to 35% of the total funding of € 64 899 158 (Figure 32).
0
20
40
60
80
100
120
140
160
180
200
IT ES DE UK FR BE NL
AT PT EL FI IE DK SE LU PL HR SK RO CZ SI HU CY LV LT EE MT
BG
Applicants
Beneficiaries
0
5
10
15
20
25
CH NO IL TN IS RS TR UA FO MK DZ AU CA CL CN CR KZ KE SM VN
Applicants
Beneficiaries
EU-15 EU-13
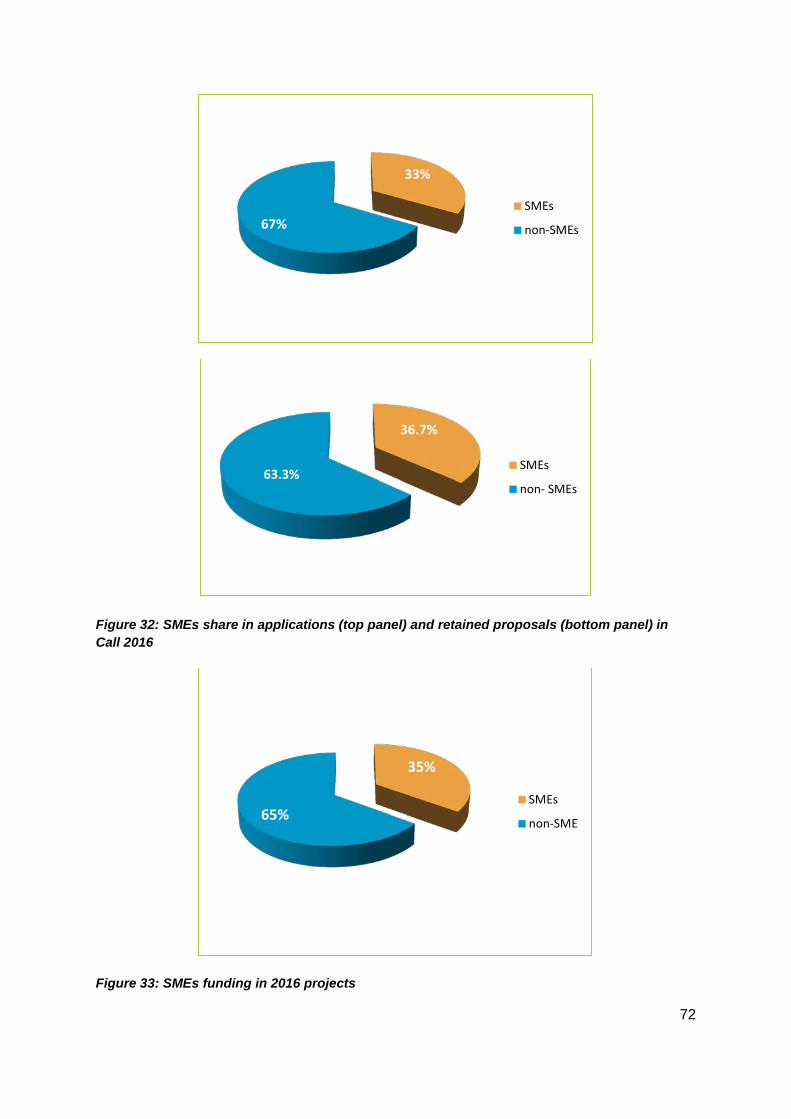
72
Figure 32: SMEs share in applications (top panel) and retained proposals (bottom panel) in Call 2016
Figure 33: SMEs funding in 2016 projects
33%
67% SMEs
non-SMEs
SMEs
non- SMEs63.3%
36.7%
35%
65% SMEs
non-SME
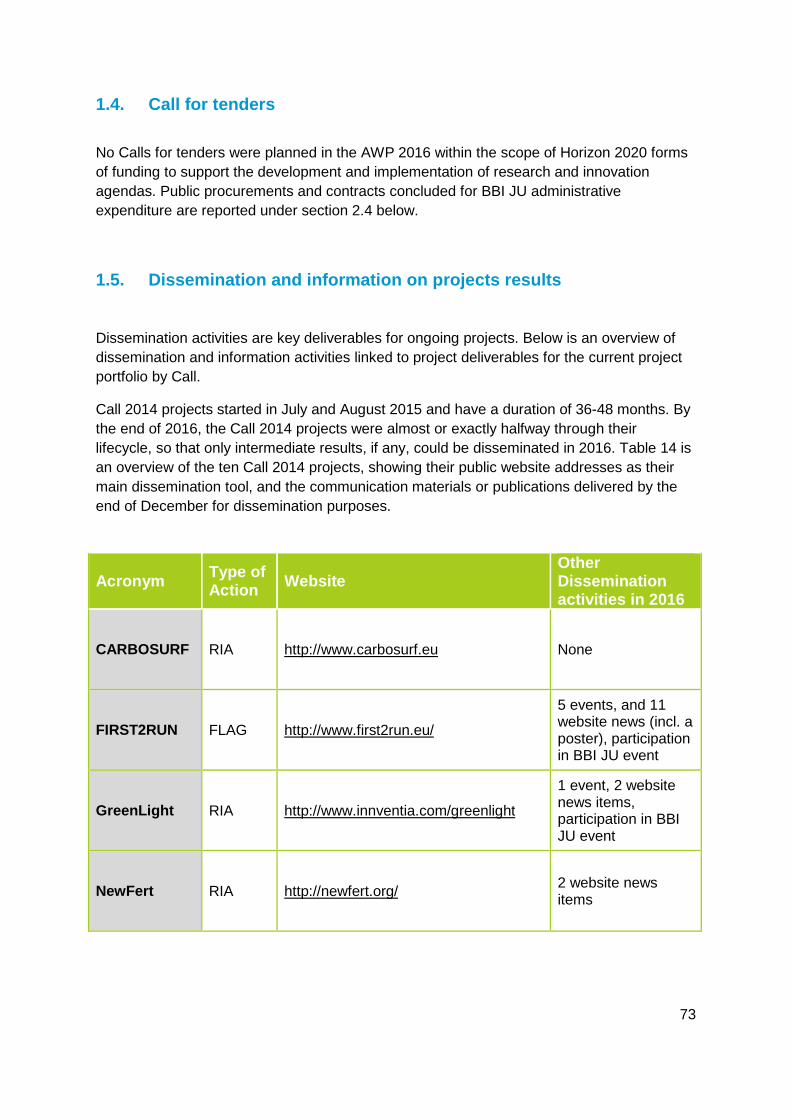
73
1.4. Call for tenders
No Calls for tenders were planned in the AWP 2016 within the scope of Horizon 2020 forms of funding to support the development and implementation of research and innovation agendas. Public procurements and contracts concluded for BBI JU administrative expenditure are reported under section 2.4 below.
1.5. Dissemination and information on projects results
Dissemination activities are key deliverables for ongoing projects. Below is an overview of dissemination and information activities linked to project deliverables for the current project portfolio by Call.
Call 2014 projects started in July and August 2015 and have a duration of 36-48 months. By the end of 2016, the Call 2014 projects were almost or exactly halfway through their lifecycle, so that only intermediate results, if any, could be disseminated in 2016. Table 14 is an overview of the ten Call 2014 projects, showing their public website addresses as their main dissemination tool, and the communication materials or publications delivered by the end of December for dissemination purposes.
Acronym Type of Action Website
Other Dissemination activities in 2016
CARBOSURF RIA http://www.carbosurf.eu None
FIRST2RUN FLAG http://www.first2run.eu/
5 events, and 11 website news (incl. a poster), participation in BBI JU event
GreenLight RIA http://www.innventia.com/greenlight
1 event, 2 website news items, participation in BBI JU event
NewFert RIA http://newfert.org/ 2 website news items
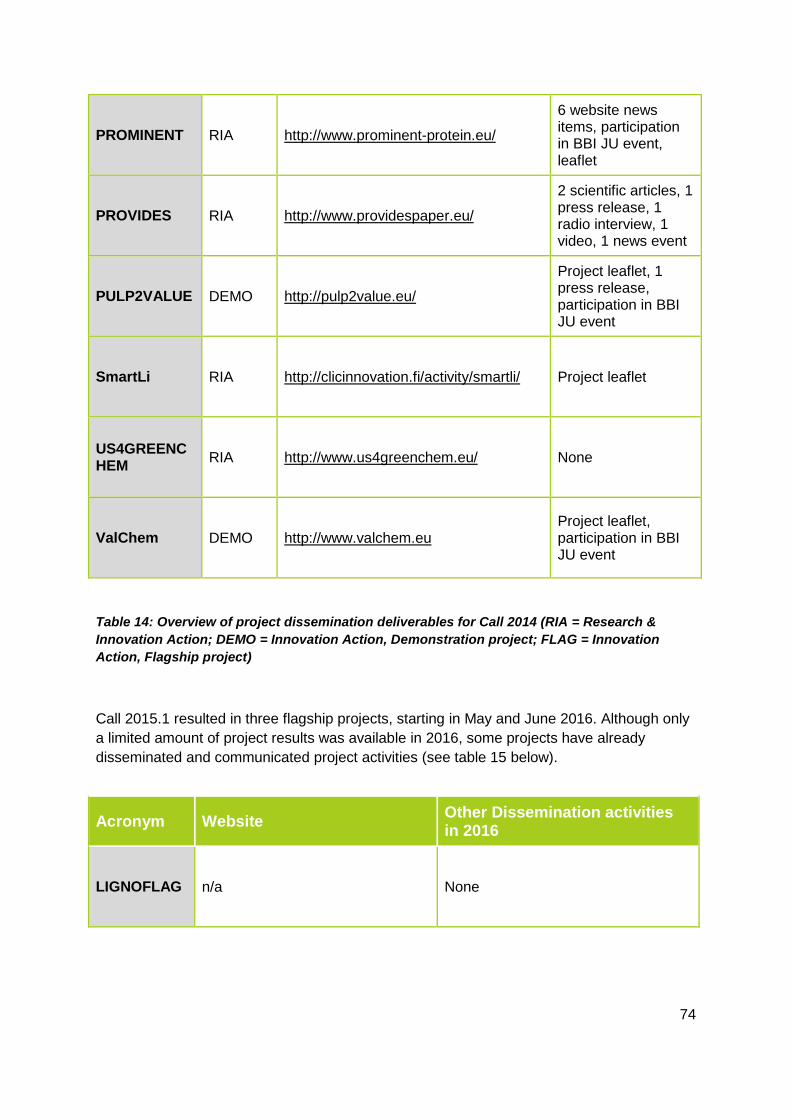
74
PROMINENT RIA http://www.prominent-protein.eu/
6 website news items, participation in BBI JU event, leaflet
PROVIDES RIA http://www.providespaper.eu/
2 scientific articles, 1 press release, 1 radio interview, 1 video, 1 news event
PULP2VALUE DEMO http://pulp2value.eu/
Project leaflet, 1 press release, participation in BBI JU event
SmartLi RIA http://clicinnovation.fi/activity/smartli/ Project leaflet
US4GREENCHEM RIA http://www.us4greenchem.eu/ None
ValChem DEMO http://www.valchem.eu Project leaflet, participation in BBI JU event
Table 14: Overview of project dissemination deliverables for Call 2014 (RIA = Research & Innovation Action; DEMO = Innovation Action, Demonstration project; FLAG = Innovation Action, Flagship project)
Call 2015.1 resulted in three flagship projects, starting in May and June 2016. Although only a limited amount of project results was available in 2016, some projects have already disseminated and communicated project activities (see table 15 below).
Acronym Website Other Dissemination activities in 2016
LIGNOFLAG n/a None
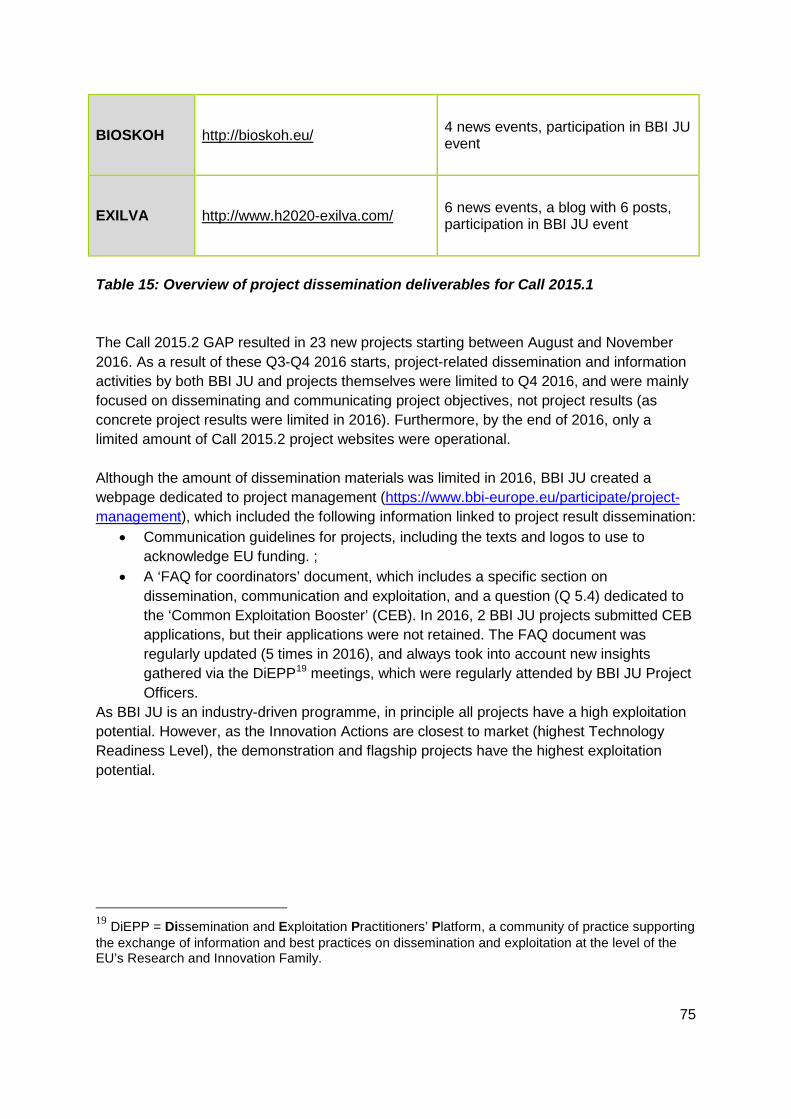
75
BIOSKOH http://bioskoh.eu/ 4 news events, participation in BBI JU event
EXILVA http://www.h2020-exilva.com/ 6 news events, a blog with 6 posts, participation in BBI JU event
Table 15: Overview of project dissemination deliverables for Call 2015.1 The Call 2015.2 GAP resulted in 23 new projects starting between August and November 2016. As a result of these Q3-Q4 2016 starts, project-related dissemination and information activities by both BBI JU and projects themselves were limited to Q4 2016, and were mainly focused on disseminating and communicating project objectives, not project results (as concrete project results were limited in 2016). Furthermore, by the end of 2016, only a limited amount of Call 2015.2 project websites were operational. Although the amount of dissemination materials was limited in 2016, BBI JU created a webpage dedicated to project management (https://www.bbi-europe.eu/participate/project-management), which included the following information linked to project result dissemination:
• Communication guidelines for projects, including the texts and logos to use to acknowledge EU funding. ;
• A ‘FAQ for coordinators’ document, which includes a specific section on dissemination, communication and exploitation, and a question (Q 5.4) dedicated to the ‘Common Exploitation Booster’ (CEB). In 2016, 2 BBI JU projects submitted CEB applications, but their applications were not retained. The FAQ document was regularly updated (5 times in 2016), and always took into account new insights gathered via the DiEPP19 meetings, which were regularly attended by BBI JU Project Officers.
As BBI JU is an industry-driven programme, in principle all projects have a high exploitation potential. However, as the Innovation Actions are closest to market (highest Technology Readiness Level), the demonstration and flagship projects have the highest exploitation potential.
19 DiEPP = Dissemination and Exploitation Practitioners’ Platform, a community of practice supporting the exchange of information and best practices on dissemination and exploitation at the level of the EU’s Research and Innovation Family.
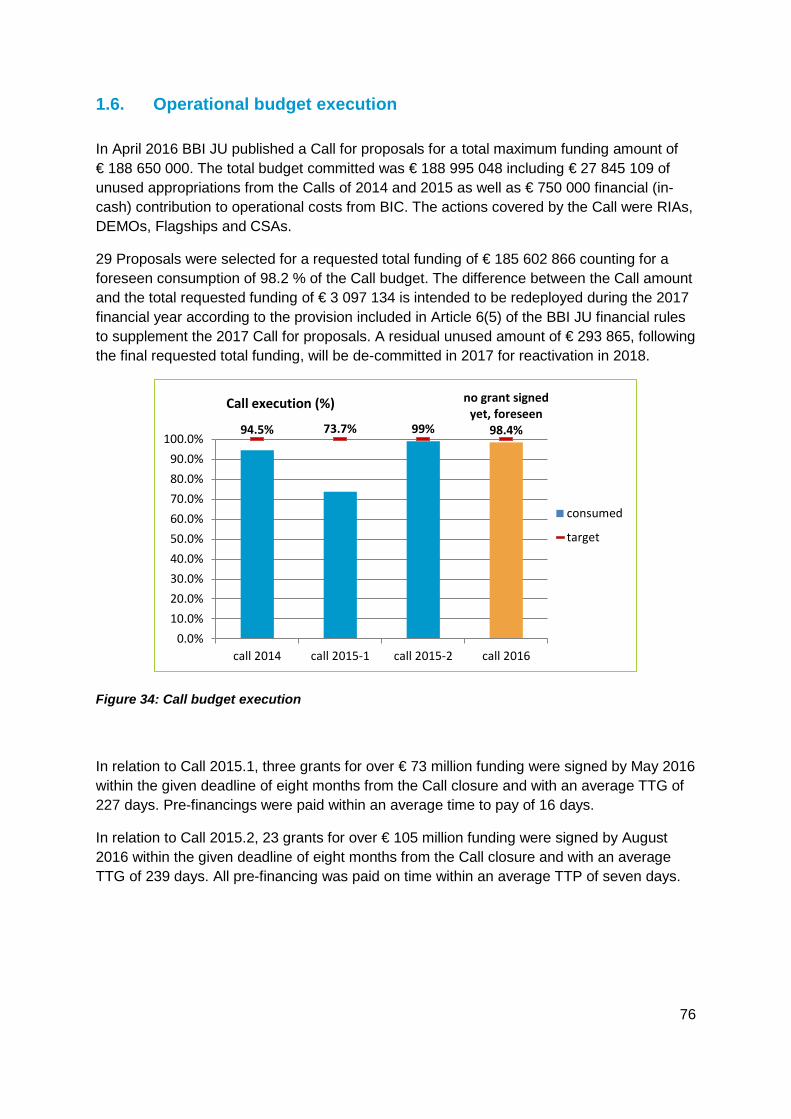
76
1.6. Operational budget execution In April 2016 BBI JU published a Call for proposals for a total maximum funding amount of € 188 650 000. The total budget committed was € 188 995 048 including € 27 845 109 of unused appropriations from the Calls of 2014 and 2015 as well as € 750 000 financial (in- cash) contribution to operational costs from BIC. The actions covered by the Call were RIAs, DEMOs, Flagships and CSAs.
29 Proposals were selected for a requested total funding of € 185 602 866 counting for a foreseen consumption of 98.2 % of the Call budget. The difference between the Call amount and the total requested funding of € 3 097 134 is intended to be redeployed during the 2017 financial year according to the provision included in Article 6(5) of the BBI JU financial rules to supplement the 2017 Call for proposals. A residual unused amount of € 293 865, following the final requested total funding, will be de-committed in 2017 for reactivation in 2018.
Figure 34: Call budget execution
In relation to Call 2015.1, three grants for over € 73 million funding were signed by May 2016 within the given deadline of eight months from the Call closure and with an average TTG of 227 days. Pre-financings were paid within an average time to pay of 16 days.
In relation to Call 2015.2, 23 grants for over € 105 million funding were signed by August 2016 within the given deadline of eight months from the Call closure and with an average TTG of 239 days. All pre-financing was paid on time within an average TTP of seven days.
94.5% 73.7% 99%
no grant signed yet, foreseen
98.4%
0.0%10.0%20.0%30.0%40.0%50.0%60.0%70.0%80.0%90.0%
100.0%
call 2014 call 2015-1 call 2015-2 call 2016
consumed
target
Call execution (%)
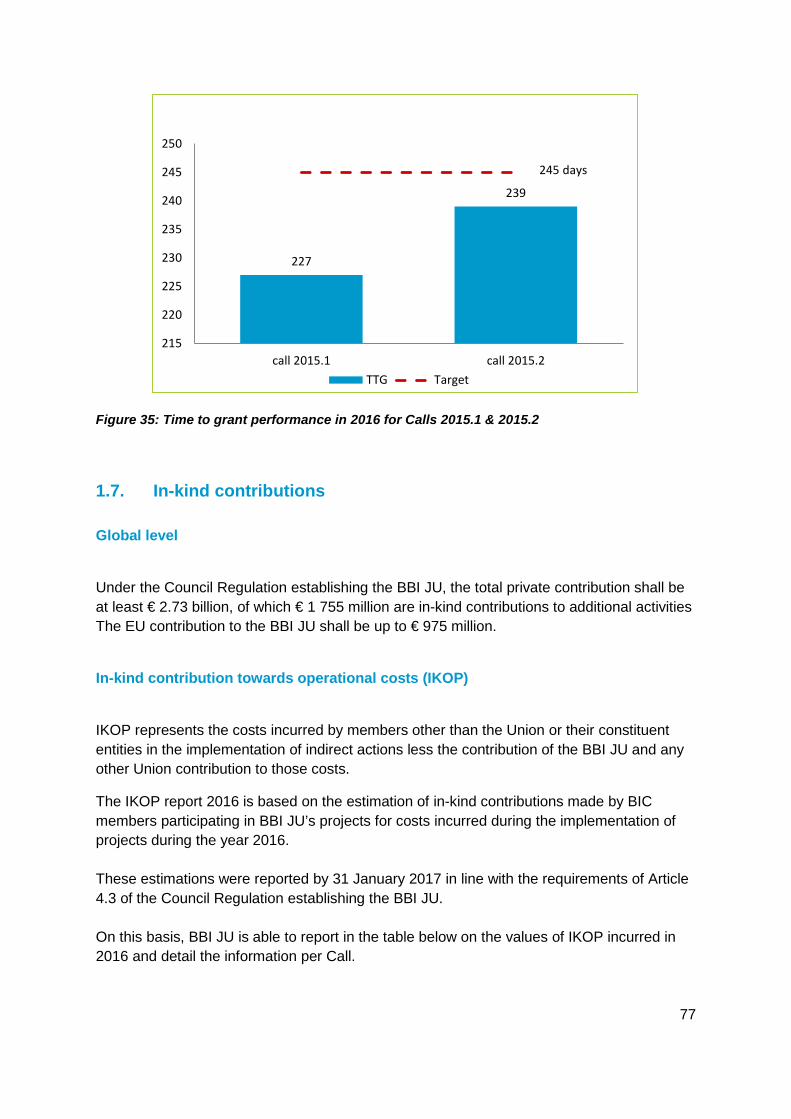
77
Figure 35: Time to grant performance in 2016 for Calls 2015.1 & 2015.2
1.7. In-kind contributions Global level
Under the Council Regulation establishing the BBI JU, the total private contribution shall be at least € 2.73 billion, of which € 1 755 million are in-kind contributions to additional activities The EU contribution to the BBI JU shall be up to € 975 million.
In-kind contribution towards operational costs (IKOP)
IKOP represents the costs incurred by members other than the Union or their constituent entities in the implementation of indirect actions less the contribution of the BBI JU and any other Union contribution to those costs.
The IKOP report 2016 is based on the estimation of in-kind contributions made by BIC members participating in BBI JU’s projects for costs incurred during the implementation of projects during the year 2016. These estimations were reported by 31 January 2017 in line with the requirements of Article 4.3 of the Council Regulation establishing the BBI JU. On this basis, BBI JU is able to report in the table below on the values of IKOP incurred in 2016 and detail the information per Call.
227
239
245 days
215
220
225
230
235
240
245
250
call 2015.1 call 2015.2TTG Target
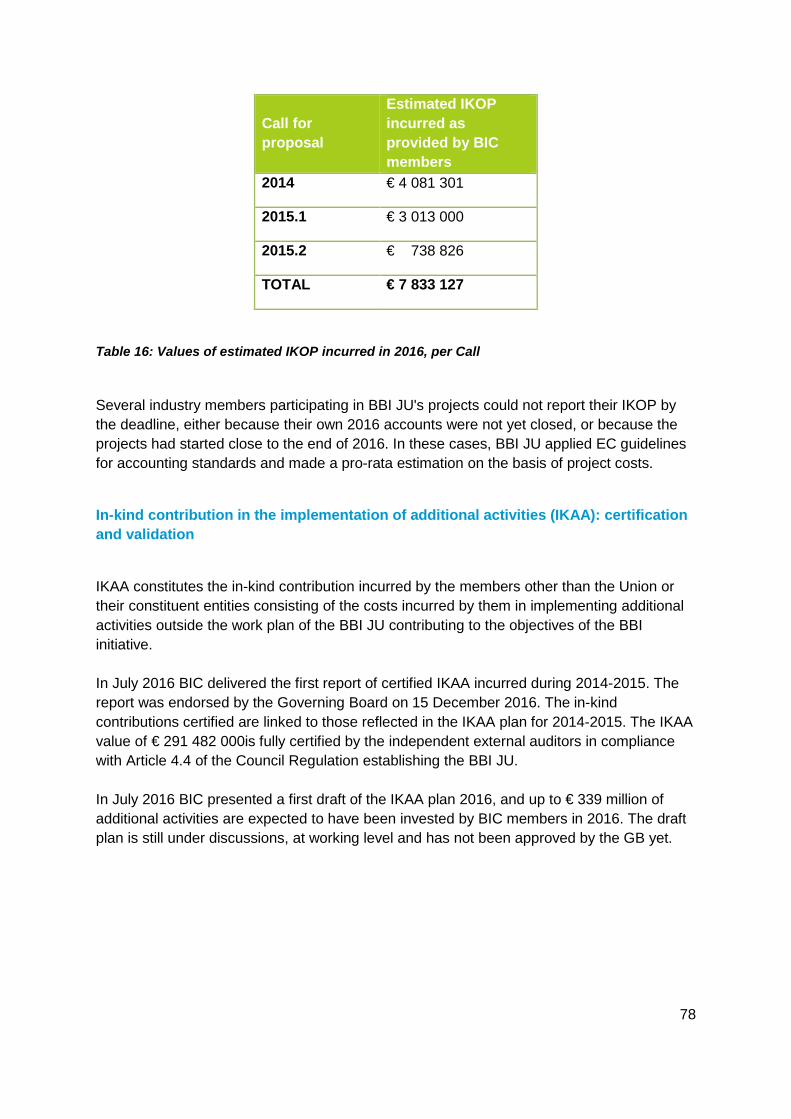
78
Call for proposal
Estimated IKOP incurred as provided by BIC members
2014 € 4 081 301
2015.1 € 3 013 000
2015.2 € 738 826
TOTAL € 7 833 127
Table 16: Values of estimated IKOP incurred in 2016, per Call
Several industry members participating in BBI JU's projects could not report their IKOP by the deadline, either because their own 2016 accounts were not yet closed, or because the projects had started close to the end of 2016. In these cases, BBI JU applied EC guidelines for accounting standards and made a pro-rata estimation on the basis of project costs.
In-kind contribution in the implementation of additional activities (IKAA): certification and validation
IKAA constitutes the in-kind contribution incurred by the members other than the Union or their constituent entities consisting of the costs incurred by them in implementing additional activities outside the work plan of the BBI JU contributing to the objectives of the BBI initiative. In July 2016 BIC delivered the first report of certified IKAA incurred during 2014-2015. The report was endorsed by the Governing Board on 15 December 2016. The in-kind contributions certified are linked to those reflected in the IKAA plan for 2014-2015. The IKAA value of € 291 482 000is fully certified by the independent external auditors in compliance with Article 4.4 of the Council Regulation establishing the BBI JU. In July 2016 BIC presented a first draft of the IKAA plan 2016, and up to € 339 million of additional activities are expected to have been invested by BIC members in 2016. The draft plan is still under discussions, at working level and has not been approved by the GB yet.
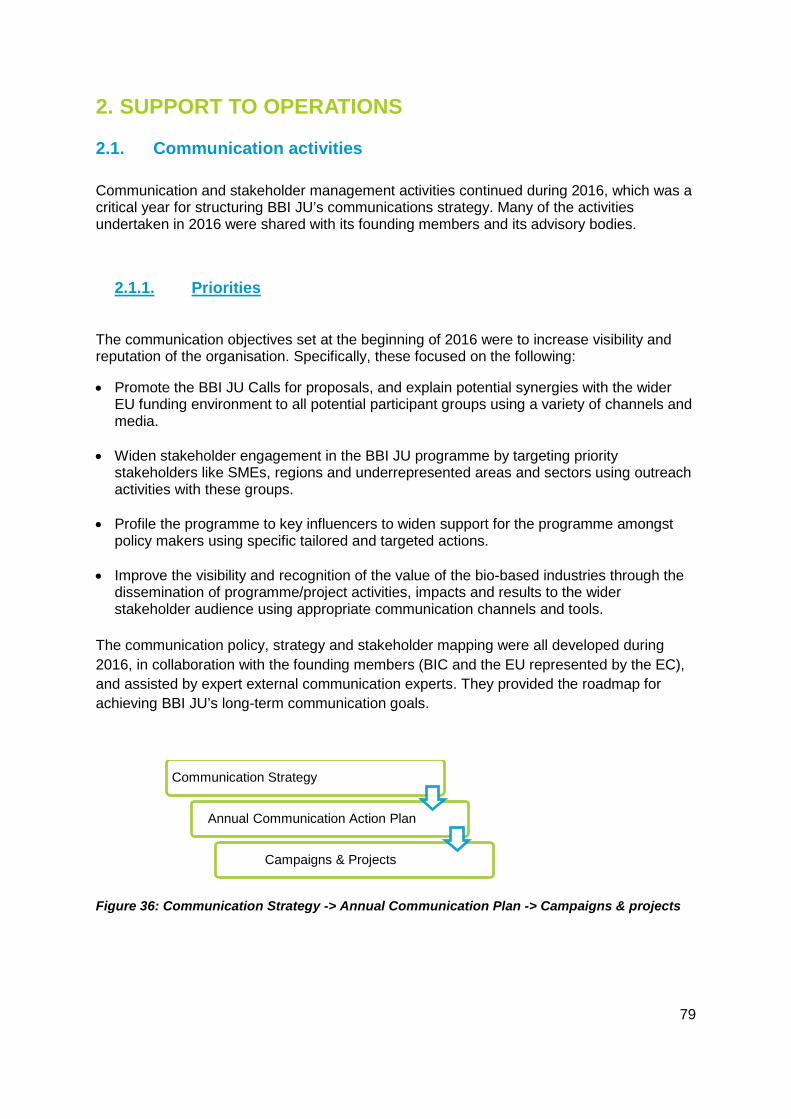
79
2. SUPPORT TO OPERATIONS
2.1. Communication activities Communication and stakeholder management activities continued during 2016, which was a critical year for structuring BBI JU’s communications strategy. Many of the activities undertaken in 2016 were shared with its founding members and its advisory bodies.
2.1.1. Priorities
The communication objectives set at the beginning of 2016 were to increase visibility and reputation of the organisation. Specifically, these focused on the following:
• Promote the BBI JU Calls for proposals, and explain potential synergies with the wider EU funding environment to all potential participant groups using a variety of channels and media.
• Widen stakeholder engagement in the BBI JU programme by targeting priority stakeholders like SMEs, regions and underrepresented areas and sectors using outreach activities with these groups.
• Profile the programme to key influencers to widen support for the programme amongst policy makers using specific tailored and targeted actions.
• Improve the visibility and recognition of the value of the bio-based industries through the dissemination of programme/project activities, impacts and results to the wider stakeholder audience using appropriate communication channels and tools.
The communication policy, strategy and stakeholder mapping were all developed during 2016, in collaboration with the founding members (BIC and the EU represented by the EC), and assisted by expert external communication experts. They provided the roadmap for achieving BBI JU’s long-term communication goals.
Figure 36: Communication Strategy -> Annual Communication Plan -> Campaigns & projects
Communication Strategy
Annual Communication Action Plan
Campaigns & Projects
80
2.1.2. Outreach activities The Programme Office was very active in its interactions and external relations with its stakeholders in 2016. The Programme Office participated in 15 national Info Days across member states and associated countries in 2016, compared with participation in four similar events in 2015. BBI JU was presented at a further 34 events (as guest speaker, session organiser, or as event co- or sole organiser), which were all advertised on the BBI website event pages.
In addition, the widening participation strategy was further implemented in an initiative to promote the programme directly with eight Polish regions through BBI’s first letter of intent.
2.1.3. Promoting BBI JU Calls The annual Call 2016 was launched on 19 April 2016 and was promoted through the following channels:
• BBI JU website – dedicated page and home page banner • Horizon 2020 Participants portal • Dedicated 2016 Call brochure • Social media – Twitter & Linked In • BBI Partnering platform • Direct mailing – over 3,800 individuals were sent ‘Save the date’ announcements • Via SRG, NCPs and SC • BBI Open Info Day event • Through other national Info Day events • Press release
BBI JU held its third Info Day on 21 April 2016 in Brussels. More than 530 participants registered for the event. Despite challenging security threats one month before the Open Info Day, which made travel to/from Brussel extremely difficult, more than 305 participants attended in person and more than 80 participants joined via the live streaming, making more than 500 individual logins. Participants came from more than 40 different Member States and associated countries. This represented an increase of 25% from 2015.
The format of the day was similar to previous years. New for 2016, a representative from the GREENLIGHT project consortium presented a testimony of preparing a proposal. The BBI Programme Office provided manned info booths of relevant services, organisations and initiatives, including one for the Programme Office and both founding members. There was strong support from the Bio NCPs and BBI’s advisory State Representatives Group, who attended in numbers at the Info Day.
In addition to plenty of informal networking during breaks, the afternoon formal brokerage event saw more than 600 face-to-face meetings scheduled through the BBI JU Partnering Platform. Users, including 270 participants actively updated their profiles for the event, and more than 50 participants used the partnering platform on site for the first time. This level of participant activity, which included users accessing the newly launched BBI JU Partnering mobile meeting app, represents a two-fold increase in use compared with 2015.

81
DG RTD F.1 & D.2
Table 17: Organisations with Info Booths present at the BBI OID 2016
Media Consulta handled media coverage of the event which resulted in 11 articles or citations in the media/press (monitored until 30 June). BBI JU issued a press release, which was circulated to approximately 230 members of the press/press organisations.
Full recordings of the sessions and the presentation files were published and can be viewed or downloaded from the Info Day event page of the BBI JU website.
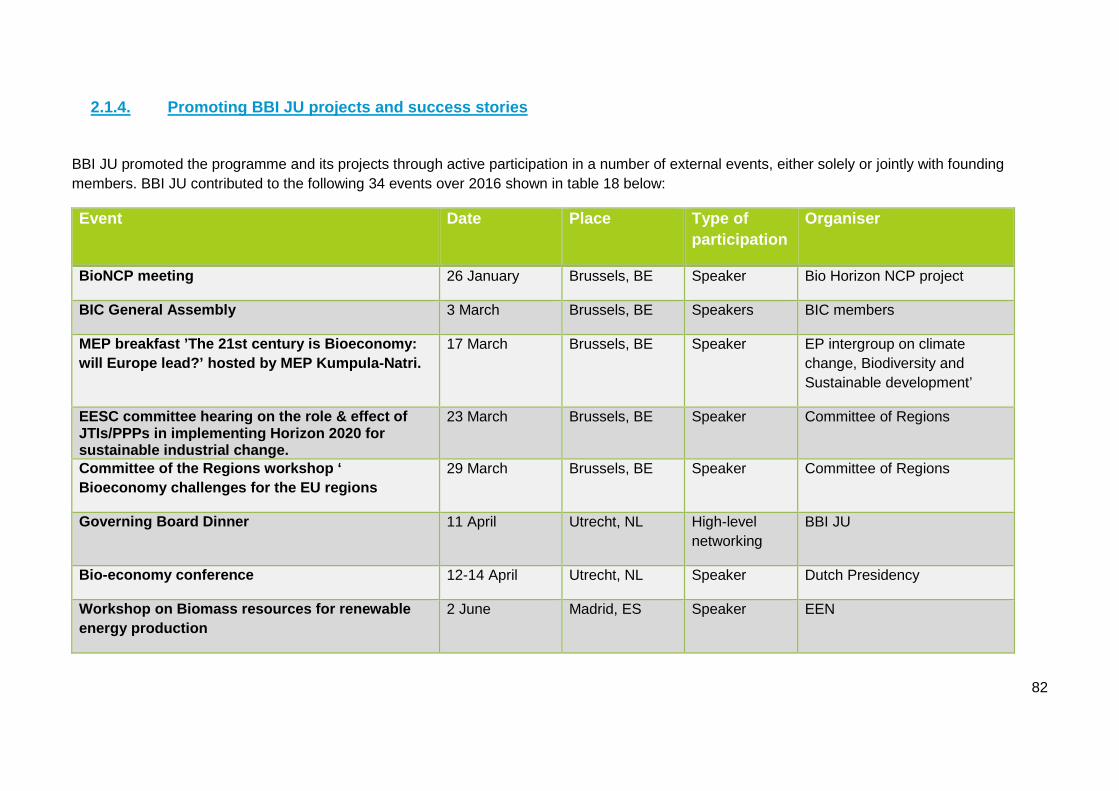
82
2.1.4. Promoting BBI JU projects and success stories
BBI JU promoted the programme and its projects through active participation in a number of external events, either solely or jointly with founding members. BBI JU contributed to the following 34 events over 2016 shown in table 18 below:
Event Date Place Type of participation
Organiser
BioNCP meeting 26 January Brussels, BE Speaker Bio Horizon NCP project
BIC General Assembly 3 March Brussels, BE Speakers BIC members
MEP breakfast ’The 21st century is Bioeconomy: will Europe lead?’ hosted by MEP Kumpula-Natri.
17 March Brussels, BE Speaker EP intergroup on climate change, Biodiversity and Sustainable development’
EESC committee hearing on the role & effect of JTIs/PPPs in implementing Horizon 2020 for sustainable industrial change.
23 March Brussels, BE Speaker Committee of Regions
Committee of the Regions workshop ‘ Bioeconomy challenges for the EU regions
29 March Brussels, BE Speaker Committee of Regions
Governing Board Dinner 11 April Utrecht, NL High-level networking
BBI JU
Bio-economy conference 12-14 April Utrecht, NL Speaker Dutch Presidency
Workshop on Biomass resources for renewable energy production
2 June Madrid, ES Speaker EEN
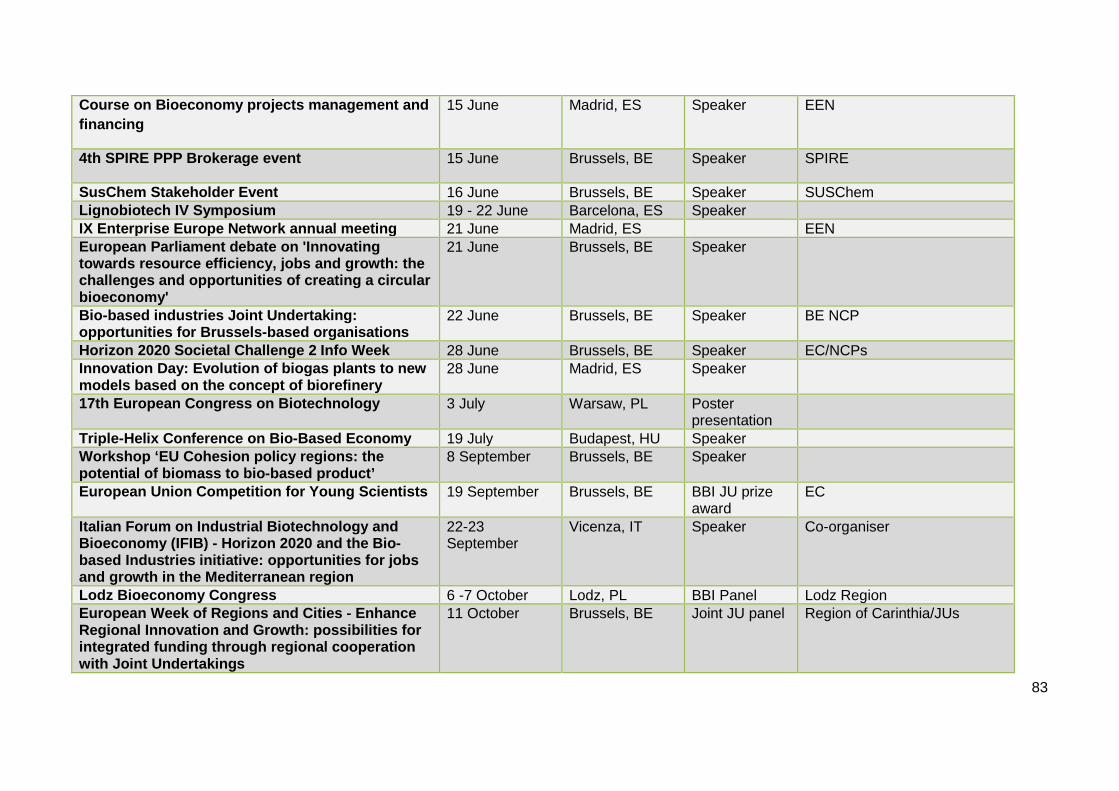
83
Course on Bioeconomy projects management and financing
15 June Madrid, ES Speaker EEN
4th SPIRE PPP Brokerage event 15 June Brussels, BE Speaker SPIRE
SusChem Stakeholder Event 16 June Brussels, BE Speaker SUSChem Lignobiotech IV Symposium 19 - 22 June Barcelona, ES Speaker IX Enterprise Europe Network annual meeting 21 June Madrid, ES EEN European Parliament debate on 'Innovating towards resource efficiency, jobs and growth: the challenges and opportunities of creating a circular bioeconomy'
21 June Brussels, BE Speaker
Bio-based industries Joint Undertaking: opportunities for Brussels-based organisations
22 June Brussels, BE Speaker BE NCP
Horizon 2020 Societal Challenge 2 Info Week 28 June Brussels, BE Speaker EC/NCPs Innovation Day: Evolution of biogas plants to new models based on the concept of biorefinery
28 June Madrid, ES Speaker
17th European Congress on Biotechnology 3 July Warsaw, PL Poster presentation
Triple-Helix Conference on Bio-Based Economy 19 July Budapest, HU Speaker Workshop ‘EU Cohesion policy regions: the potential of biomass to bio-based product’
8 September Brussels, BE Speaker
European Union Competition for Young Scientists 19 September Brussels, BE BBI JU prize award
EC
Italian Forum on Industrial Biotechnology and Bioeconomy (IFIB) - Horizon 2020 and the Bio-based Industries initiative: opportunities for jobs and growth in the Mediterranean region
22-23 September
Vicenza, IT Speaker Co-organiser
Lodz Bioeconomy Congress 6 -7 October Lodz, PL BBI Panel Lodz Region European Week of Regions and Cities - Enhance Regional Innovation and Growth: possibilities for integrated funding through regional cooperation with Joint Undertakings
11 October Brussels, BE Joint JU panel Region of Carinthia/JUs
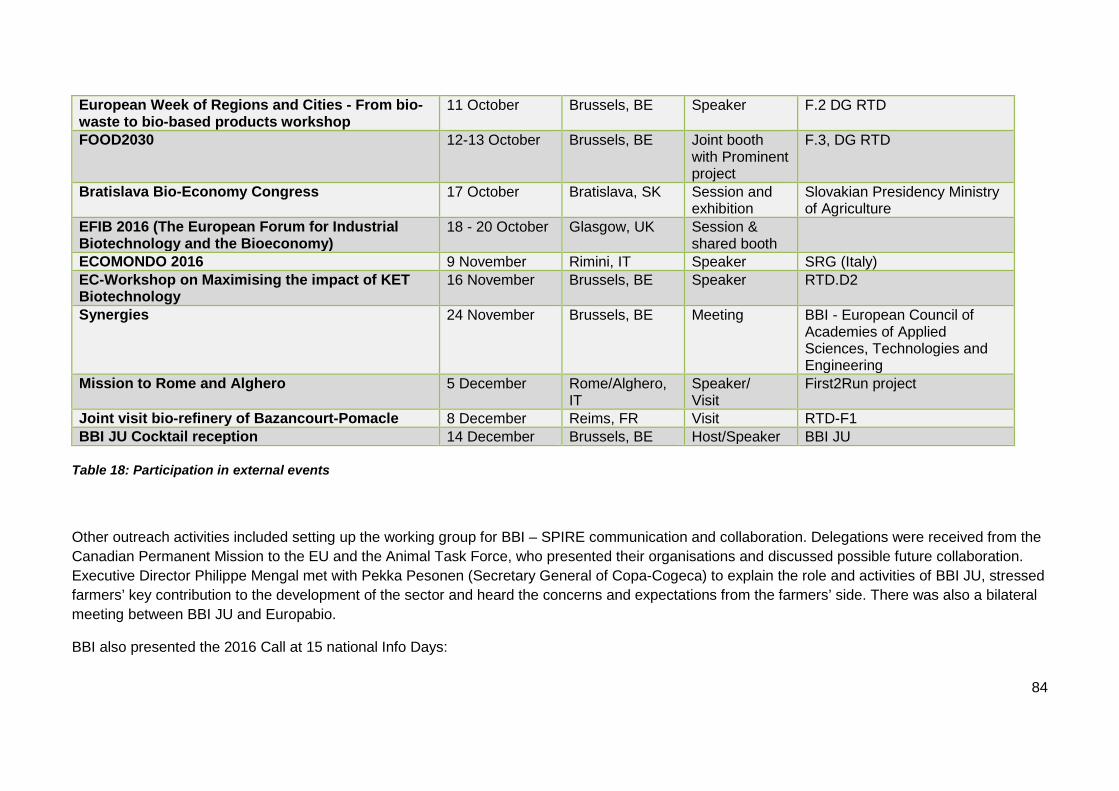
84
European Week of Regions and Cities - From bio- waste to bio-based products workshop
11 October Brussels, BE Speaker F.2 DG RTD
FOOD2030 12-13 October Brussels, BE Joint booth with Prominent project
F.3, DG RTD
Bratislava Bio-Economy Congress 17 October Bratislava, SK Session and exhibition
Slovakian Presidency Ministry of Agriculture
EFIB 2016 (The European Forum for Industrial Biotechnology and the Bioeconomy)
18 - 20 October Glasgow, UK Session & shared booth
ECOMONDO 2016 9 November Rimini, IT Speaker SRG (Italy) EC-Workshop on Maximising the impact of KET Biotechnology
16 November Brussels, BE Speaker RTD.D2
Synergies 24 November Brussels, BE Meeting BBI - European Council of Academies of Applied Sciences, Technologies and Engineering
Mission to Rome and Alghero 5 December Rome/Alghero, IT
Speaker/ Visit
First2Run project
Joint visit bio-refinery of Bazancourt-Pomacle 8 December Reims, FR Visit RTD-F1 BBI JU Cocktail reception 14 December Brussels, BE Host/Speaker BBI JU
Table 18: Participation in external events
Other outreach activities included setting up the working group for BBI – SPIRE communication and collaboration. Delegations were received from the Canadian Permanent Mission to the EU and the Animal Task Force, who presented their organisations and discussed possible future collaboration. Executive Director Philippe Mengal met with Pekka Pesonen (Secretary General of Copa-Cogeca) to explain the role and activities of BBI JU, stressed farmers’ key contribution to the development of the sector and heard the concerns and expectations from the farmers’ side. There was also a bilateral meeting between BBI JU and Europabio.
BBI also presented the 2016 Call at 15 national Info Days:
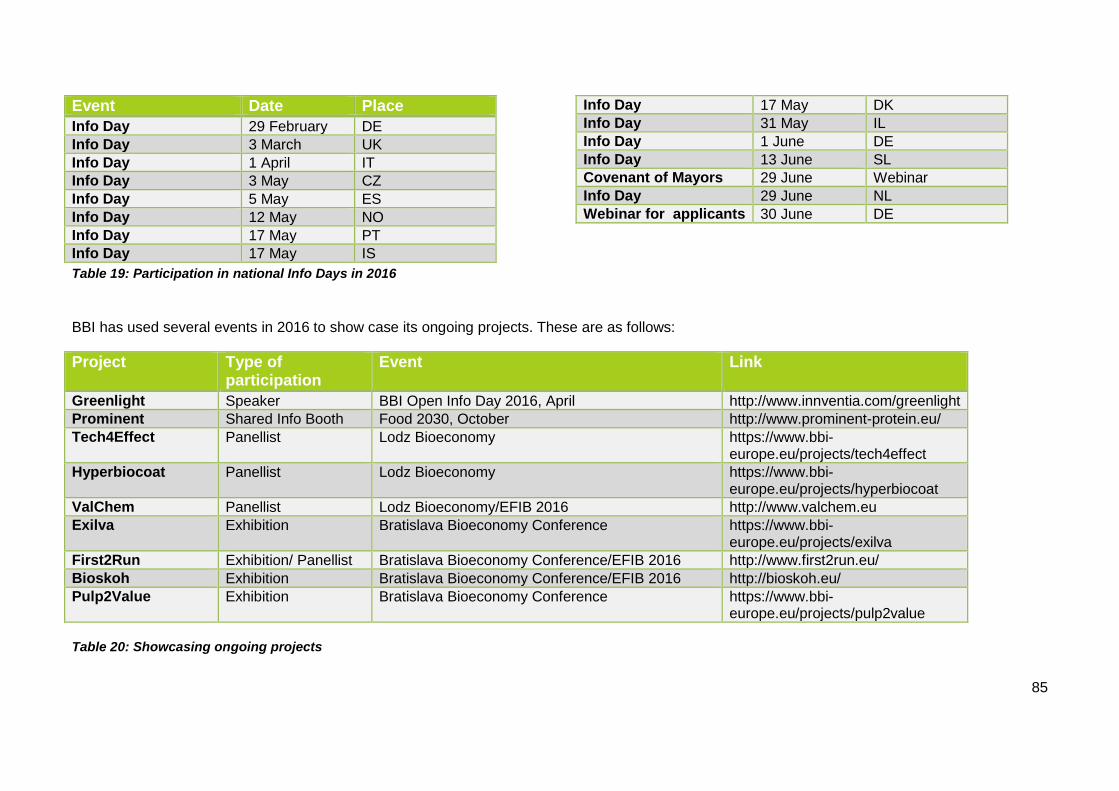
85
Event Date Place Info Day 29 February DE Info Day 3 March UK Info Day 1 April IT Info Day 3 May CZ Info Day 5 May ES Info Day 12 May NO Info Day 17 May PT Info Day 17 May IS
Info Day 17 May DK Info Day 31 May IL Info Day 1 June DE Info Day 13 June SL Covenant of Mayors 29 June Webinar Info Day 29 June NL Webinar for applicants 30 June DE
Table 19: Participation in national Info Days in 2016
BBI has used several events in 2016 to show case its ongoing projects. These are as follows:
Project Type of participation
Event Link
Greenlight Speaker BBI Open Info Day 2016, April http://www.innventia.com/greenlight Prominent Shared Info Booth Food 2030, October http://www.prominent-protein.eu/ Tech4Effect Panellist Lodz Bioeconomy https://www.bbi-
europe.eu/projects/tech4effect Hyperbiocoat Panellist Lodz Bioeconomy https://www.bbi-
europe.eu/projects/hyperbiocoat ValChem Panellist Lodz Bioeconomy/EFIB 2016 http://www.valchem.eu Exilva Exhibition Bratislava Bioeconomy Conference https://www.bbi-
europe.eu/projects/exilva First2Run Exhibition/ Panellist Bratislava Bioeconomy Conference/EFIB 2016 http://www.first2run.eu/ Bioskoh Exhibition Bratislava Bioeconomy Conference/EFIB 2016 http://bioskoh.eu/ Pulp2Value Exhibition Bratislava Bioeconomy Conference https://www.bbi-
europe.eu/projects/pulp2value
Table 20: Showcasing ongoing projects
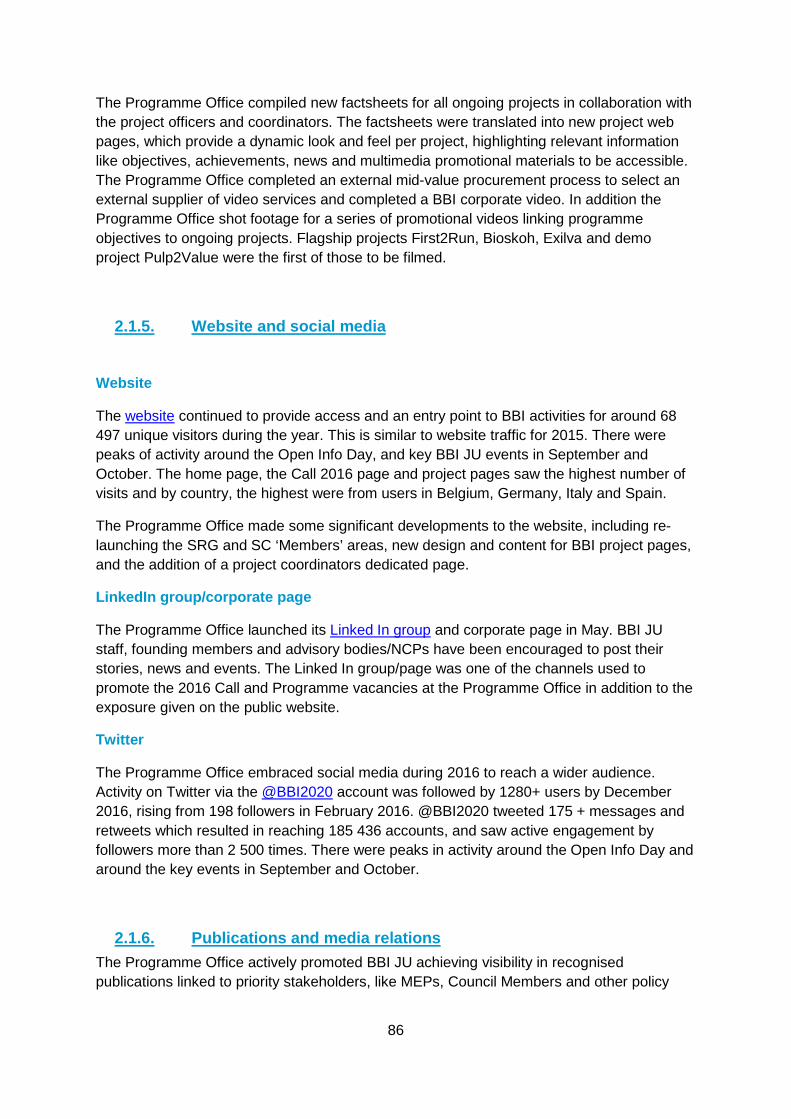
86
The Programme Office compiled new factsheets for all ongoing projects in collaboration with the project officers and coordinators. The factsheets were translated into new project web pages, which provide a dynamic look and feel per project, highlighting relevant information like objectives, achievements, news and multimedia promotional materials to be accessible. The Programme Office completed an external mid-value procurement process to select an external supplier of video services and completed a BBI corporate video. In addition the Programme Office shot footage for a series of promotional videos linking programme objectives to ongoing projects. Flagship projects First2Run, Bioskoh, Exilva and demo project Pulp2Value were the first of those to be filmed.
2.1.5. Website and social media
Website
The website continued to provide access and an entry point to BBI activities for around 68 497 unique visitors during the year. This is similar to website traffic for 2015. There were peaks of activity around the Open Info Day, and key BBI JU events in September and October. The home page, the Call 2016 page and project pages saw the highest number of visits and by country, the highest were from users in Belgium, Germany, Italy and Spain.
The Programme Office made some significant developments to the website, including re-launching the SRG and SC ‘Members’ areas, new design and content for BBI project pages, and the addition of a project coordinators dedicated page.
LinkedIn group/corporate page
The Programme Office launched its Linked In group and corporate page in May. BBI JU staff, founding members and advisory bodies/NCPs have been encouraged to post their stories, news and events. The Linked In group/page was one of the channels used to promote the 2016 Call and Programme vacancies at the Programme Office in addition to the exposure given on the public website.
The Programme Office embraced social media during 2016 to reach a wider audience. Activity on Twitter via the @BBI2020 account was followed by 1280+ users by December 2016, rising from 198 followers in February 2016. @BBI2020 tweeted 175 + messages and retweets which resulted in reaching 185 436 accounts, and saw active engagement by followers more than 2 500 times. There were peaks in activity around the Open Info Day and around the key events in September and October.
2.1.6. Publications and media relations The Programme Office actively promoted BBI JU achieving visibility in recognised publications linked to priority stakeholders, like MEPs, Council Members and other policy
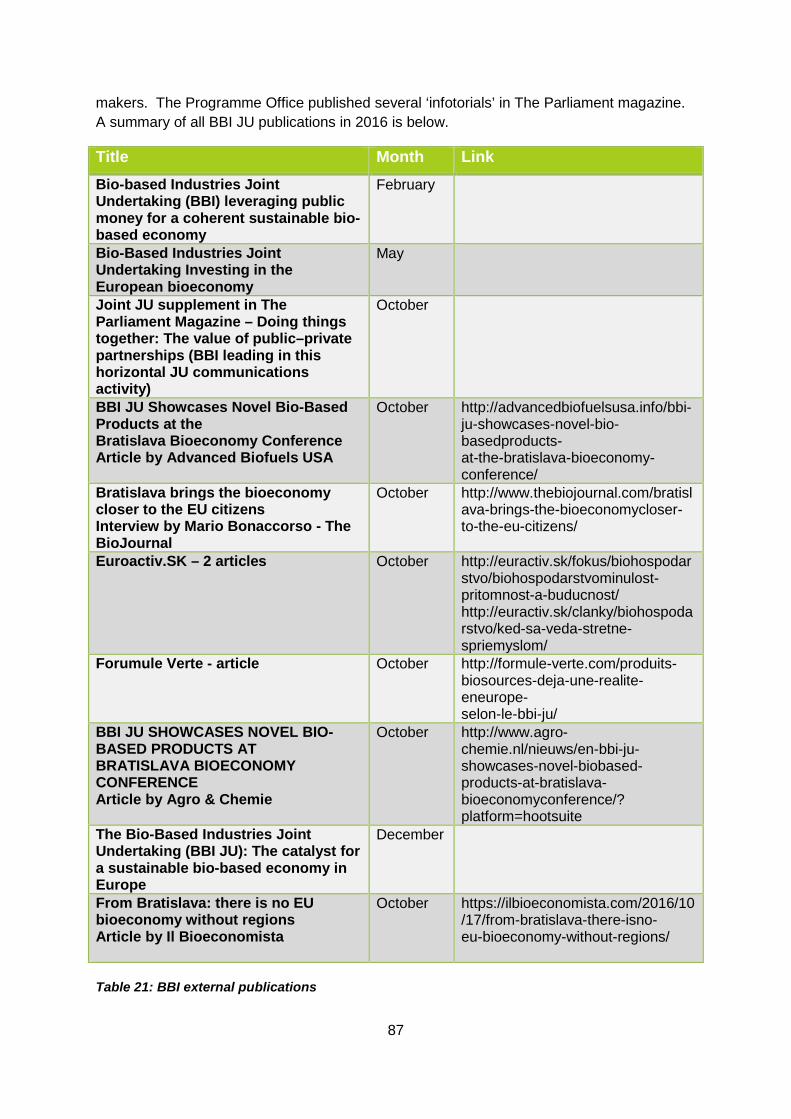
87
makers. The Programme Office published several ‘infotorials’ in The Parliament magazine. A summary of all BBI JU publications in 2016 is below.
Title Month Link Bio-based Industries Joint Undertaking (BBI) leveraging public money for a coherent sustainable bio-based economy
February
Bio-Based Industries Joint Undertaking Investing in the European bioeconomy
May
Joint JU supplement in The Parliament Magazine – Doing things together: The value of public–private partnerships (BBI leading in this horizontal JU communications activity)
October
BBI JU Showcases Novel Bio-Based Products at the Bratislava Bioeconomy Conference Article by Advanced Biofuels USA
October http://advancedbiofuelsusa.info/bbi-ju-showcases-novel-bio-basedproducts- at-the-bratislava-bioeconomy-conference/
Bratislava brings the bioeconomy closer to the EU citizens Interview by Mario Bonaccorso - The BioJournal
October http://www.thebiojournal.com/bratislava-brings-the-bioeconomycloser- to-the-eu-citizens/
Euroactiv.SK – 2 articles October http://euractiv.sk/fokus/biohospodarstvo/biohospodarstvominulost-pritomnost-a-buducnost/ http://euractiv.sk/clanky/biohospodarstvo/ked-sa-veda-stretne-spriemyslom/
Forumule Verte - article October http://formule-verte.com/produits-biosources-deja-une-realite-eneurope- selon-le-bbi-ju/
BBI JU SHOWCASES NOVEL BIO-BASED PRODUCTS AT BRATISLAVA BIOECONOMY CONFERENCE Article by Agro & Chemie
October http://www.agro-chemie.nl/nieuws/en-bbi-ju-showcases-novel-biobased- products-at-bratislava-bioeconomyconference/? platform=hootsuite
The Bio-Based Industries Joint Undertaking (BBI JU): The catalyst for a sustainable bio-based economy in Europe
December
From Bratislava: there is no EU bioeconomy without regions Article by Il Bioeconomista
October https://ilbioeconomista.com/2016/10/17/from-bratislava-there-isno- eu-bioeconomy-without-regions/
Table 21: BBI external publications
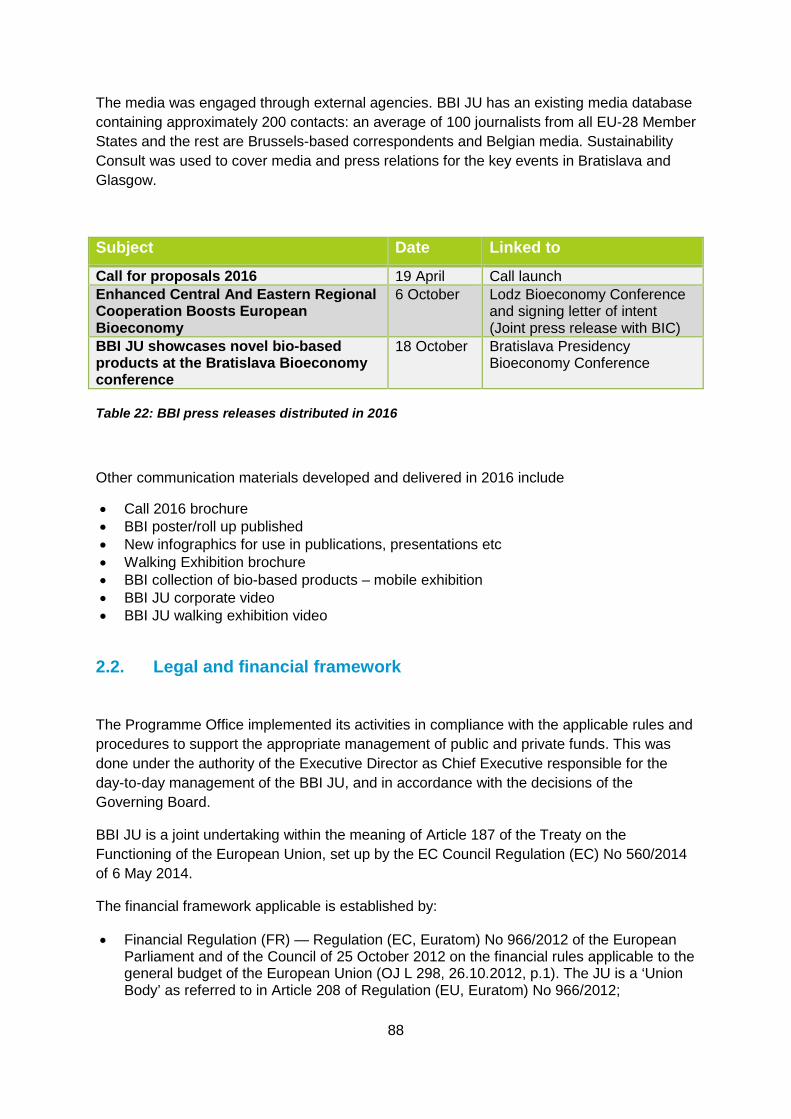
88
The media was engaged through external agencies. BBI JU has an existing media database containing approximately 200 contacts: an average of 100 journalists from all EU-28 Member States and the rest are Brussels-based correspondents and Belgian media. Sustainability Consult was used to cover media and press relations for the key events in Bratislava and Glasgow.
Subject Date Linked to
Call for proposals 2016 19 April Call launch Enhanced Central And Eastern Regional Cooperation Boosts European Bioeconomy
6 October Lodz Bioeconomy Conference and signing letter of intent (Joint press release with BIC)
BBI JU showcases novel bio-based products at the Bratislava Bioeconomy conference
18 October
Bratislava Presidency Bioeconomy Conference
Table 22: BBI press releases distributed in 2016
Other communication materials developed and delivered in 2016 include
• Call 2016 brochure • BBI poster/roll up published • New infographics for use in publications, presentations etc • Walking Exhibition brochure • BBI collection of bio-based products – mobile exhibition • BBI JU corporate video • BBI JU walking exhibition video
2.2. Legal and financial framework
The Programme Office implemented its activities in compliance with the applicable rules and procedures to support the appropriate management of public and private funds. This was done under the authority of the Executive Director as Chief Executive responsible for the day-to-day management of the BBI JU, and in accordance with the decisions of the Governing Board.
BBI JU is a joint undertaking within the meaning of Article 187 of the Treaty on the Functioning of the European Union, set up by the EC Council Regulation (EC) No 560/2014 of 6 May 2014.
The financial framework applicable is established by:
• Financial Regulation (FR) — Regulation (EC, Euratom) No 966/2012 of the European Parliament and of the Council of 25 October 2012 on the financial rules applicable to the general budget of the European Union (OJ L 298, 26.10.2012, p.1). The JU is a ‘Union Body’ as referred to in Article 208 of Regulation (EU, Euratom) No 966/2012;
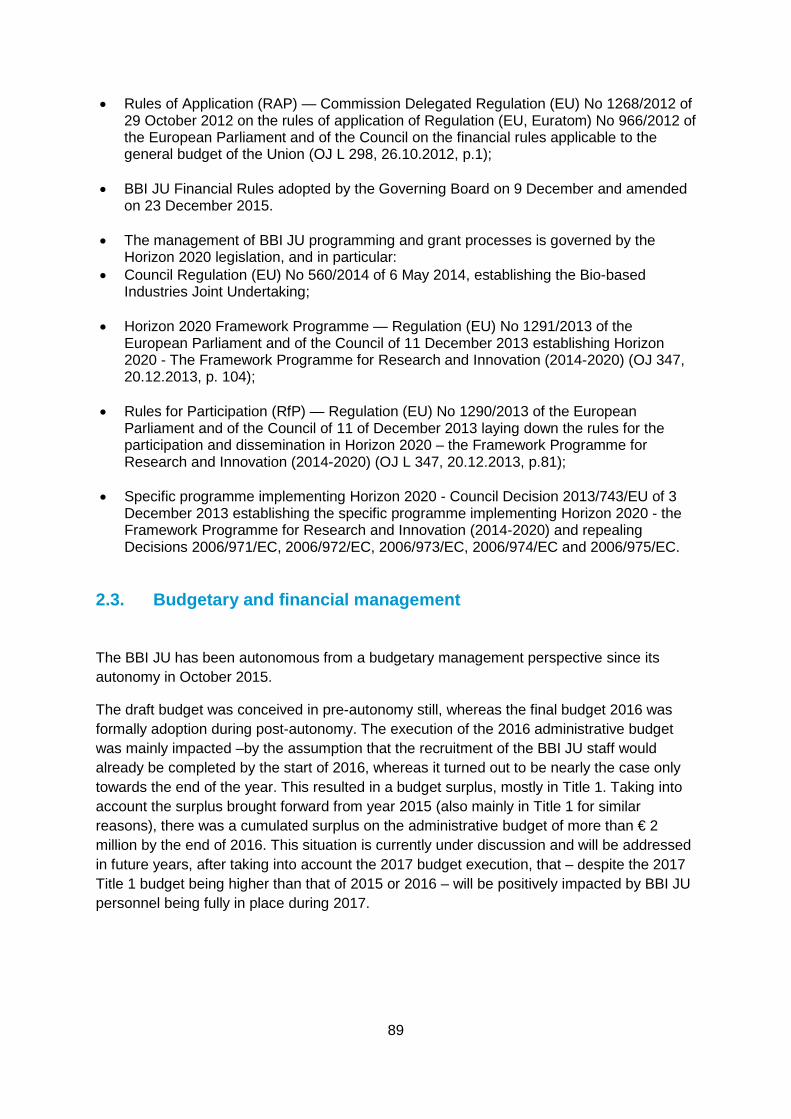
89
• Rules of Application (RAP) — Commission Delegated Regulation (EU) No 1268/2012 of 29 October 2012 on the rules of application of Regulation (EU, Euratom) No 966/2012 of the European Parliament and of the Council on the financial rules applicable to the general budget of the Union (OJ L 298, 26.10.2012, p.1);
• BBI JU Financial Rules adopted by the Governing Board on 9 December and amended on 23 December 2015.
• The management of BBI JU programming and grant processes is governed by the Horizon 2020 legislation, and in particular:
• Council Regulation (EU) No 560/2014 of 6 May 2014, establishing the Bio-based Industries Joint Undertaking;
• Horizon 2020 Framework Programme — Regulation (EU) No 1291/2013 of the European Parliament and of the Council of 11 December 2013 establishing Horizon 2020 - The Framework Programme for Research and Innovation (2014-2020) (OJ 347, 20.12.2013, p. 104);
• Rules for Participation (RfP) — Regulation (EU) No 1290/2013 of the European Parliament and of the Council of 11 of December 2013 laying down the rules for the participation and dissemination in Horizon 2020 – the Framework Programme for Research and Innovation (2014-2020) (OJ L 347, 20.12.2013, p.81);
• Specific programme implementing Horizon 2020 - Council Decision 2013/743/EU of 3 December 2013 establishing the specific programme implementing Horizon 2020 - the Framework Programme for Research and Innovation (2014-2020) and repealing Decisions 2006/971/EC, 2006/972/EC, 2006/973/EC, 2006/974/EC and 2006/975/EC.
2.3. Budgetary and financial management
The BBI JU has been autonomous from a budgetary management perspective since its autonomy in October 2015.
The draft budget was conceived in pre-autonomy still, whereas the final budget 2016 was formally adoption during post-autonomy. The execution of the 2016 administrative budget was mainly impacted –by the assumption that the recruitment of the BBI JU staff would already be completed by the start of 2016, whereas it turned out to be nearly the case only towards the end of the year. This resulted in a budget surplus, mostly in Title 1. Taking into account the surplus brought forward from year 2015 (also mainly in Title 1 for similar reasons), there was a cumulated surplus on the administrative budget of more than € 2 million by the end of 2016. This situation is currently under discussion and will be addressed in future years, after taking into account the 2017 budget execution, that – despite the 2017 Title 1 budget being higher than that of 2015 or 2016 – will be positively impacted by BBI JU personnel being fully in place during 2017.
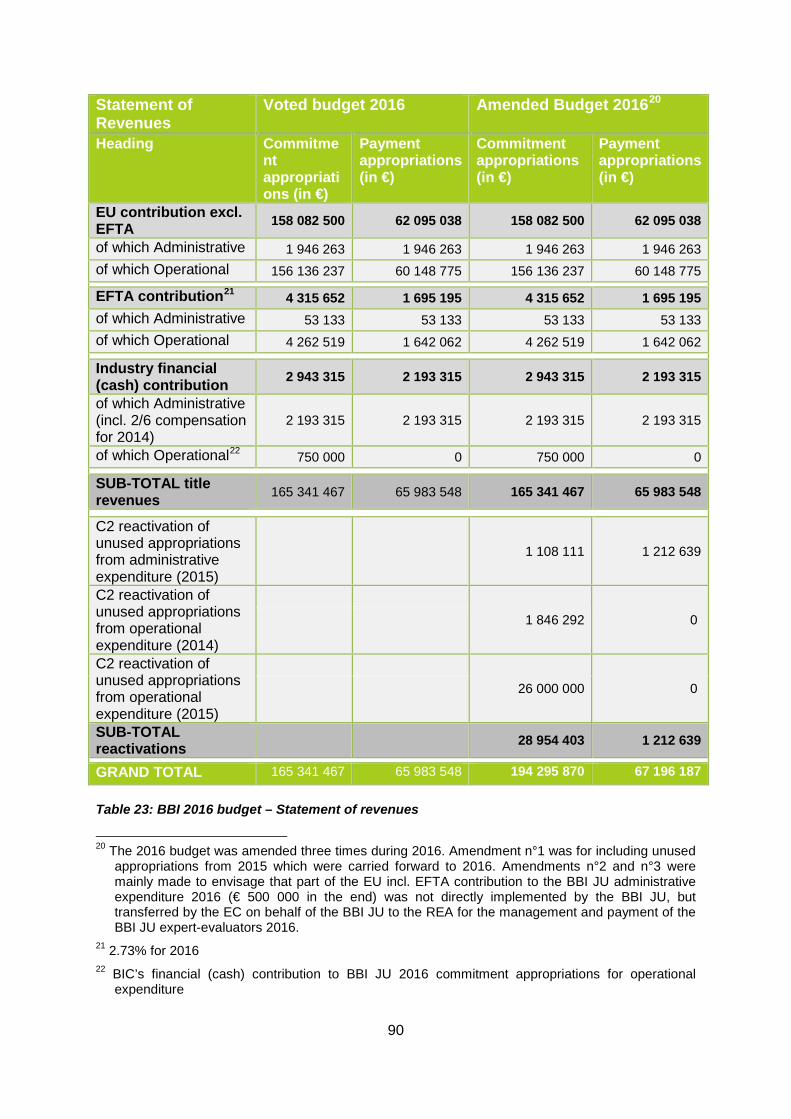
90
Statement of Revenues
Voted budget 2016 Amended Budget 201620
Heading Commitment appropriations (in €)
Payment appropriations (in €)
Commitment appropriations (in €)
Payment appropriations (in €)
EU contribution excl. EFTA 158 082 500 62 095 038 158 082 500 62 095 038
of which Administrative 1 946 263 1 946 263 1 946 263 1 946 263 of which Operational 156 136 237 60 148 775 156 136 237 60 148 775
EFTA contribution21 4 315 652 1 695 195 4 315 652 1 695 195 of which Administrative 53 133 53 133 53 133 53 133 of which Operational 4 262 519 1 642 062 4 262 519 1 642 062
Industry financial (cash) contribution 2 943 315 2 193 315 2 943 315 2 193 315
of which Administrative (incl. 2/6 compensation for 2014)
2 193 315 2 193 315 2 193 315 2 193 315
of which Operational22 750 000 0 750 000 0
SUB-TOTAL title revenues 165 341 467 65 983 548 165 341 467 65 983 548
C2 reactivation of unused appropriations from administrative expenditure (2015)
1 108 111 1 212 639
C2 reactivation of unused appropriations from operational expenditure (2014)
1 846 292 0
C2 reactivation of unused appropriations from operational expenditure (2015)
26 000 000 0
SUB-TOTAL reactivations 28 954 403 1 212 639
GRAND TOTAL 165 341 467 65 983 548 194 295 870 67 196 187
Table 23: BBI 2016 budget – Statement of revenues
20 The 2016 budget was amended three times during 2016. Amendment n°1 was for including unused
appropriations from 2015 which were carried forward to 2016. Amendments n°2 and n°3 were mainly made to envisage that part of the EU incl. EFTA contribution to the BBI JU administrative expenditure 2016 (€ 500 000 in the end) was not directly implemented by the BBI JU, but transferred by the EC on behalf of the BBI JU to the REA for the management and payment of the BBI JU expert-evaluators 2016.
21 2.73% for 2016 22 BIC’s financial (cash) contribution to BBI JU 2016 commitment appropriations for operational
expenditure
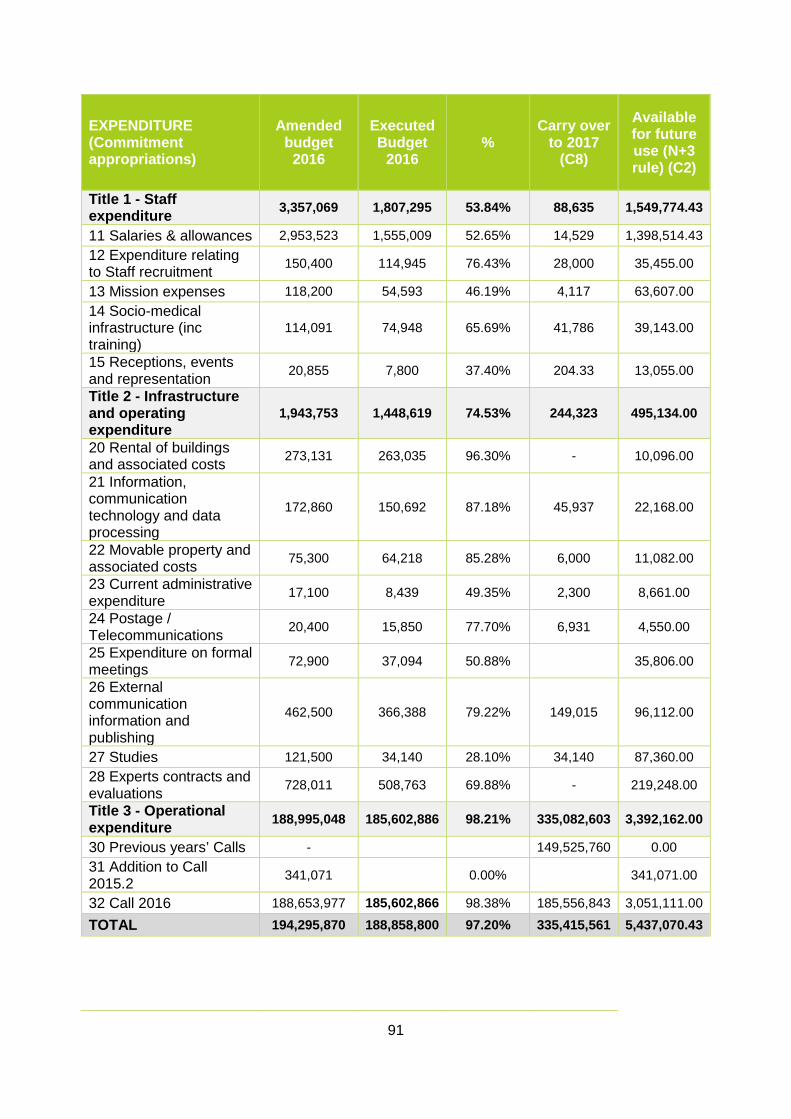
91
EXPENDITURE (Commitment appropriations)
Amended budget 2016
Executed Budget
2016 %
Carry over to 2017
(C8)
Available for future use (N+3 rule) (C2)
Title 1 - Staff expenditure 3,357,069 1,807,295 53.84% 88,635 1,549,774.43
11 Salaries & allowances 2,953,523 1,555,009 52.65% 14,529 1,398,514.43 12 Expenditure relating to Staff recruitment 150,400 114,945 76.43% 28,000 35,455.00
13 Mission expenses 118,200 54,593 46.19% 4,117 63,607.00 14 Socio-medical infrastructure (inc training)
114,091 74,948 65.69% 41,786 39,143.00
15 Receptions, events and representation 20,855 7,800 37.40% 204.33 13,055.00
Title 2 - Infrastructure and operating expenditure
1,943,753 1,448,619 74.53% 244,323 495,134.00
20 Rental of buildings and associated costs 273,131 263,035 96.30% - 10,096.00
21 Information, communication technology and data processing
172,860 150,692 87.18% 45,937 22,168.00
22 Movable property and associated costs 75,300 64,218 85.28% 6,000 11,082.00
23 Current administrative expenditure 17,100 8,439 49.35% 2,300 8,661.00
24 Postage / Telecommunications 20,400 15,850 77.70% 6,931 4,550.00
25 Expenditure on formal meetings 72,900 37,094 50.88% 35,806.00
26 External communication information and publishing
462,500 366,388 79.22% 149,015 96,112.00
27 Studies 121,500 34,140 28.10% 34,140 87,360.00 28 Experts contracts and evaluations 728,011 508,763 69.88% - 219,248.00
Title 3 - Operational expenditure 188,995,048 185,602,886 98.21% 335,082,603 3,392,162.00
30 Previous years’ Calls - 149,525,760 0.00 31 Addition to Call 2015.2 341,071 0.00% 341,071.00
32 Call 2016 188,653,977 185,602,866 98.38% 185,556,843 3,051,111.00
TOTAL 194,295,870 188,858,800 97.20% 335,415,561 5,437,070.43
92
EXPENDITURE (Payment appropriations)
Amended Budget
2016
Executed Budget
2016 %
Available for future use (N+3 rule) (C2)
Title 1 - Staff expenditure 3,338,335 1,747,743 52.35% 1,590,592
11 Salaries & allowances 2,991,168 1,549,151 51.79% 1,442,017
12 Expenditure relating to Staff recruitment 106,139 95,585 90.06% 10,554
13 Mission expenses 141,913 52,501 37.00% 89,412
14 Socio-medical infrastructure (inc training)
91,133 61,525 67.51% 29,608
15 Receptions, events and representation 7,982 7,881 98.73% 101
Title 2 - Infrastructure and operating expenditure
2,065,831 1,309,625 63.39% 756,206
20 Rental of buildings and associated costs 381,871 263,035 68.88% 118,836
21 Information, communication technology and data processing
184,095 177,599 96.47% 6,496
22 Movable property and associated costs 135,081 58,218 43.10% 76,863
23 Current administrative expenditure 33,174 19,773 59.60% 13,401
24 Postage / Telecommunications 26,757 12,831 47.95% 13,926
25 Expenditure on formal meetings 98,665 37,094 37.60% 61,571
26 External communication information and publishing
384,177 232,312 60.47% 151,865
27 Studies 94,000 - 0.00% 94,000
28 Experts contracts and evaluations 728,011 508,763 69.88% 219,248
Title 3 - Operational expenditure 61,792,021 61,792,021 100.00% 0
30 Previous years’ Calls 61,792,021 61,792,021 100.00% 0
31 Addition to Call 2015.2 0 00
32 Call 2016 0 00
TOTAL 67,196,187 64,849,389 96.51% 2,346,798
Table 24: BBI 2016 budget – statement of expenditure
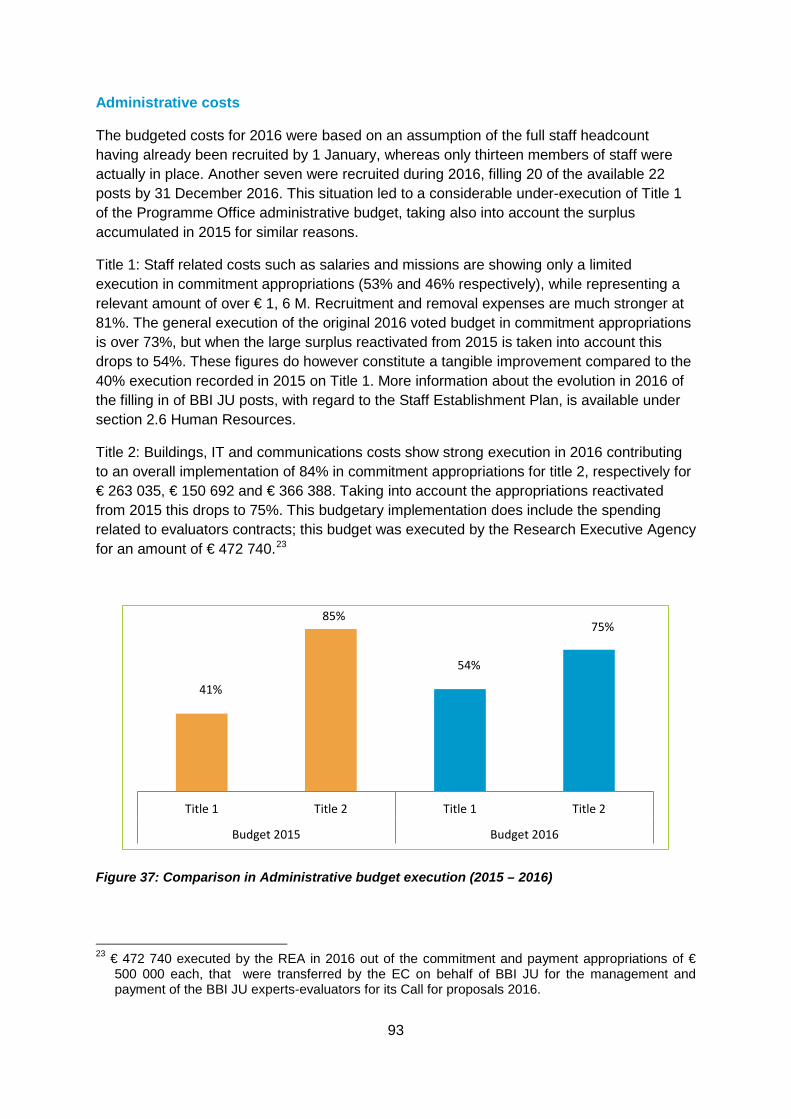
93
Administrative costs
The budgeted costs for 2016 were based on an assumption of the full staff headcount having already been recruited by 1 January, whereas only thirteen members of staff were actually in place. Another seven were recruited during 2016, filling 20 of the available 22 posts by 31 December 2016. This situation led to a considerable under-execution of Title 1 of the Programme Office administrative budget, taking also into account the surplus accumulated in 2015 for similar reasons.
Title 1: Staff related costs such as salaries and missions are showing only a limited execution in commitment appropriations (53% and 46% respectively), while representing a relevant amount of over € 1, 6 M. Recruitment and removal expenses are much stronger at 81%. The general execution of the original 2016 voted budget in commitment appropriations is over 73%, but when the large surplus reactivated from 2015 is taken into account this drops to 54%. These figures do however constitute a tangible improvement compared to the 40% execution recorded in 2015 on Title 1. More information about the evolution in 2016 of the filling in of BBI JU posts, with regard to the Staff Establishment Plan, is available under section 2.6 Human Resources.
Title 2: Buildings, IT and communications costs show strong execution in 2016 contributing to an overall implementation of 84% in commitment appropriations for title 2, respectively for € 263 035, € 150 692 and € 366 388. Taking into account the appropriations reactivated from 2015 this drops to 75%. This budgetary implementation does include the spending related to evaluators contracts; this budget was executed by the Research Executive Agency for an amount of € 472 740.23
Figure 37: Comparison in Administrative budget execution (2015 – 2016)
23 € 472 740 executed by the REA in 2016 out of the commitment and payment appropriations of €
500 000 each, that were transferred by the EC on behalf of BBI JU for the management and payment of the BBI JU experts-evaluators for its Call for proposals 2016.
41%
85%
54%
75%
Title 1 Title 2 Title 1 Title 2
Budget 2015 Budget 2016
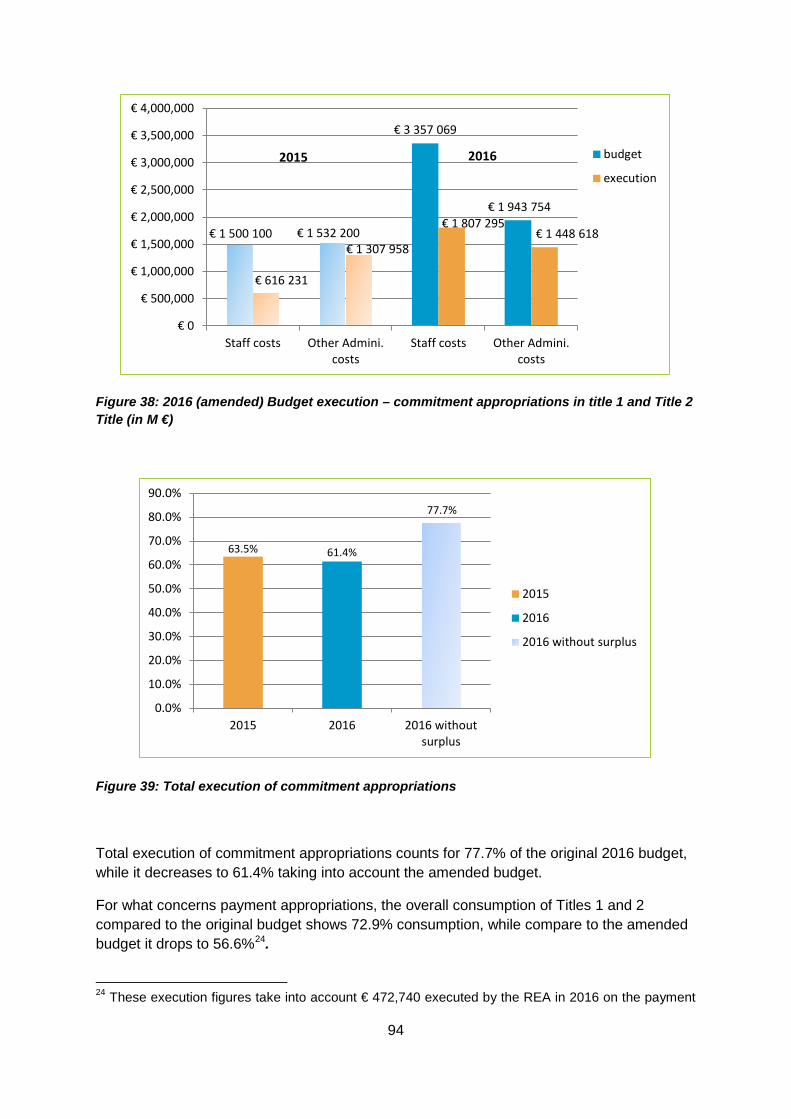
94
Figure 38: 2016 (amended) Budget execution – commitment appropriations in title 1 and Title 2 Title (in M €)
Figure 39: Total execution of commitment appropriations
Total execution of commitment appropriations counts for 77.7% of the original 2016 budget, while it decreases to 61.4% taking into account the amended budget.
For what concerns payment appropriations, the overall consumption of Titles 1 and 2 compared to the original budget shows 72.9% consumption, while compare to the amended budget it drops to 56.6%24.
24 These execution figures take into account € 472,740 executed by the REA in 2016 on the payment
€ 1 500 100 € 1 532 200
€ 3 357 069
€ 1 943 754
€ 616 231
€ 1 307 958
€ 1 807 295 € 1 448 618
€ 0
€ 500,000
€ 1,000,000
€ 1,500,000
€ 2,000,000
€ 2,500,000
€ 3,000,000
€ 3,500,000
€ 4,000,000
Staff costs Other Admini.costs
Staff costs Other Admini.costs
budget
execution2015 2016
63.5% 61.4%
77.7%
0.0%
10.0%
20.0%
30.0%
40.0%
50.0%
60.0%
70.0%
80.0%
90.0%
2015 2016 2016 withoutsurplus
2015
2016
2016 without surplus
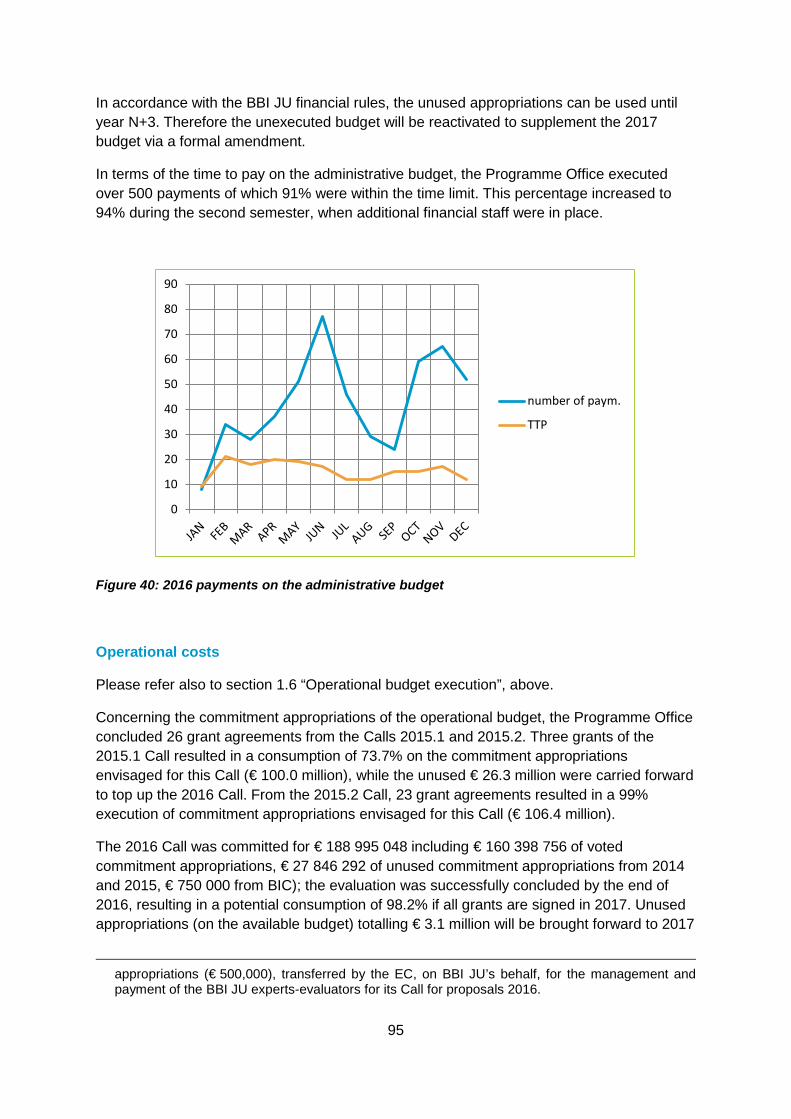
95
In accordance with the BBI JU financial rules, the unused appropriations can be used until year N+3. Therefore the unexecuted budget will be reactivated to supplement the 2017 budget via a formal amendment.
In terms of the time to pay on the administrative budget, the Programme Office executed over 500 payments of which 91% were within the time limit. This percentage increased to 94% during the second semester, when additional financial staff were in place.
Figure 40: 2016 payments on the administrative budget
Operational costs
Please refer also to section 1.6 “Operational budget execution”, above.
Concerning the commitment appropriations of the operational budget, the Programme Office concluded 26 grant agreements from the Calls 2015.1 and 2015.2. Three grants of the 2015.1 Call resulted in a consumption of 73.7% on the commitment appropriations envisaged for this Call (€ 100.0 million), while the unused € 26.3 million were carried forward to top up the 2016 Call. From the 2015.2 Call, 23 grant agreements resulted in a 99% execution of commitment appropriations envisaged for this Call (€ 106.4 million).
The 2016 Call was committed for € 188 995 048 including € 160 398 756 of voted commitment appropriations, € 27 846 292 of unused commitment appropriations from 2014 and 2015, € 750 000 from BIC); the evaluation was successfully concluded by the end of 2016, resulting in a potential consumption of 98.2% if all grants are signed in 2017. Unused appropriations (on the available budget) totalling € 3.1 million will be brought forward to 2017
appropriations (€ 500,000), transferred by the EC, on BBI JU’s behalf, for the management and payment of the BBI JU experts-evaluators for its Call for proposals 2016.
0
10
20
30
40
50
60
70
80
90
number of paym.
TTP
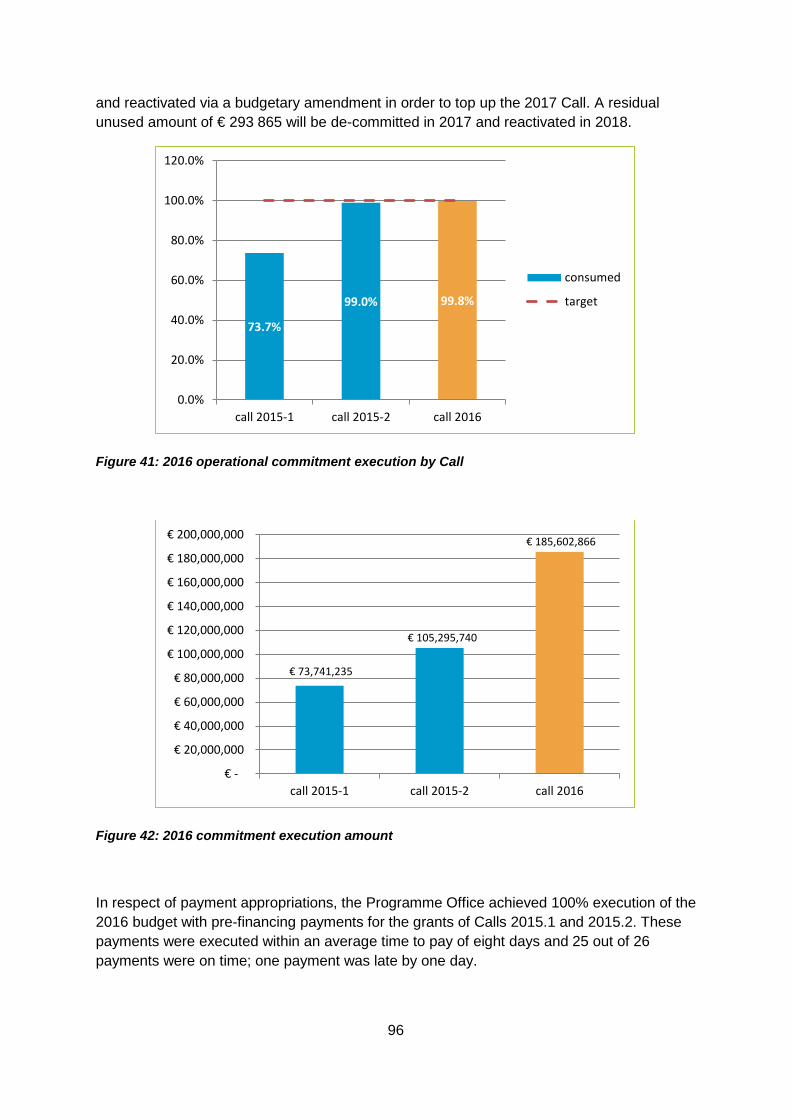
96
and reactivated via a budgetary amendment in order to top up the 2017 Call. A residual unused amount of € 293 865 will be de-committed in 2017 and reactivated in 2018.
Figure 41: 2016 operational commitment execution by Call
Figure 42: 2016 commitment execution amount
In respect of payment appropriations, the Programme Office achieved 100% execution of the 2016 budget with pre-financing payments for the grants of Calls 2015.1 and 2015.2. These payments were executed within an average time to pay of eight days and 25 out of 26 payments were on time; one payment was late by one day.
73.7%
99.0% 99.8%
0.0%
20.0%
40.0%
60.0%
80.0%
100.0%
120.0%
call 2015-1 call 2015-2 call 2016
consumed
target
€ 73,741,235
€ 105,295,740
€ 185,602,866
€ -
€ 20,000,000
€ 40,000,000
€ 60,000,000
€ 80,000,000
€ 100,000,000
€ 120,000,000
€ 140,000,000
€ 160,000,000
€ 180,000,000
€ 200,000,000
call 2015-1 call 2015-2 call 2016
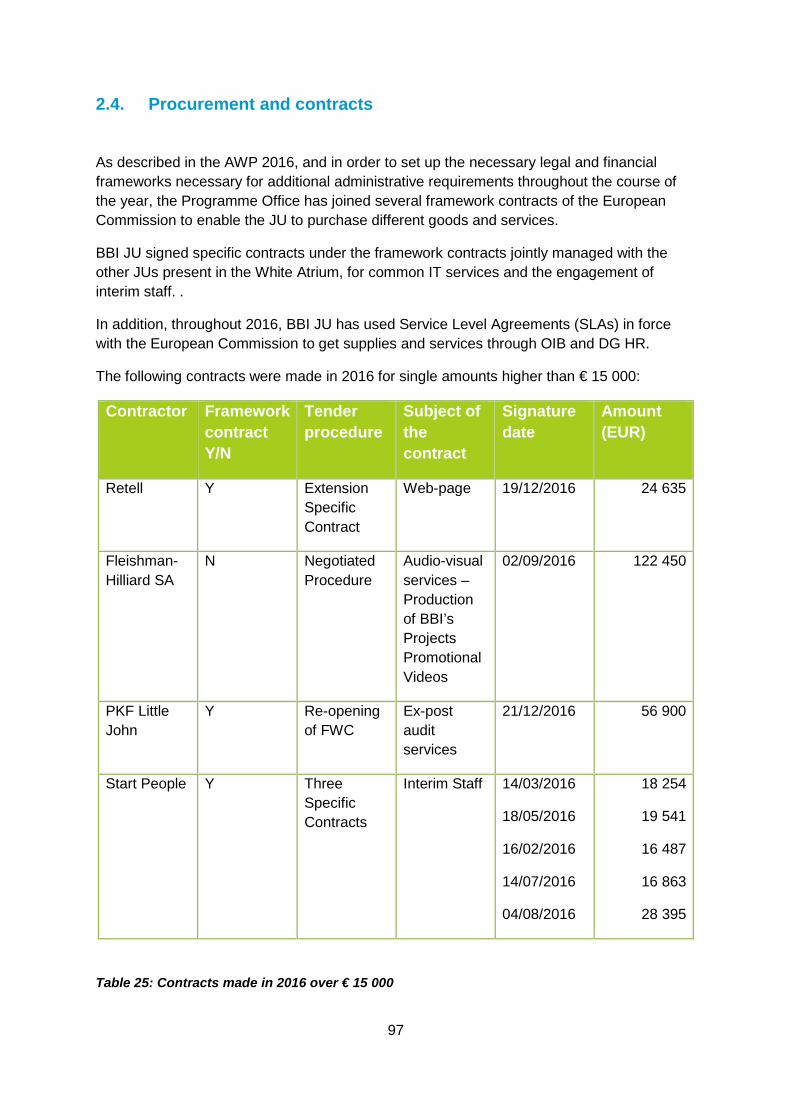
97
2.4. Procurement and contracts
As described in the AWP 2016, and in order to set up the necessary legal and financial frameworks necessary for additional administrative requirements throughout the course of the year, the Programme Office has joined several framework contracts of the European Commission to enable the JU to purchase different goods and services.
BBI JU signed specific contracts under the framework contracts jointly managed with the other JUs present in the White Atrium, for common IT services and the engagement of interim staff. .
In addition, throughout 2016, BBI JU has used Service Level Agreements (SLAs) in force with the European Commission to get supplies and services through OIB and DG HR.
The following contracts were made in 2016 for single amounts higher than € 15 000:
Contractor Framework contract Y/N
Tender procedure
Subject of the contract
Signature date
Amount (EUR)
Retell Y Extension Specific Contract
Web-page 19/12/2016 24 635
Fleishman-Hilliard SA
N Negotiated Procedure
Audio-visual services – Production of BBI’s Projects Promotional Videos
02/09/2016 122 450
PKF Little John
Y Re-opening of FWC
Ex-post audit services
21/12/2016 56 900
Start People Y Three Specific Contracts
Interim Staff 14/03/2016
18/05/2016
16/02/2016
14/07/2016
04/08/2016
18 254
19 541
16 487
16 863
28 395
Table 25: Contracts made in 2016 over € 15 000
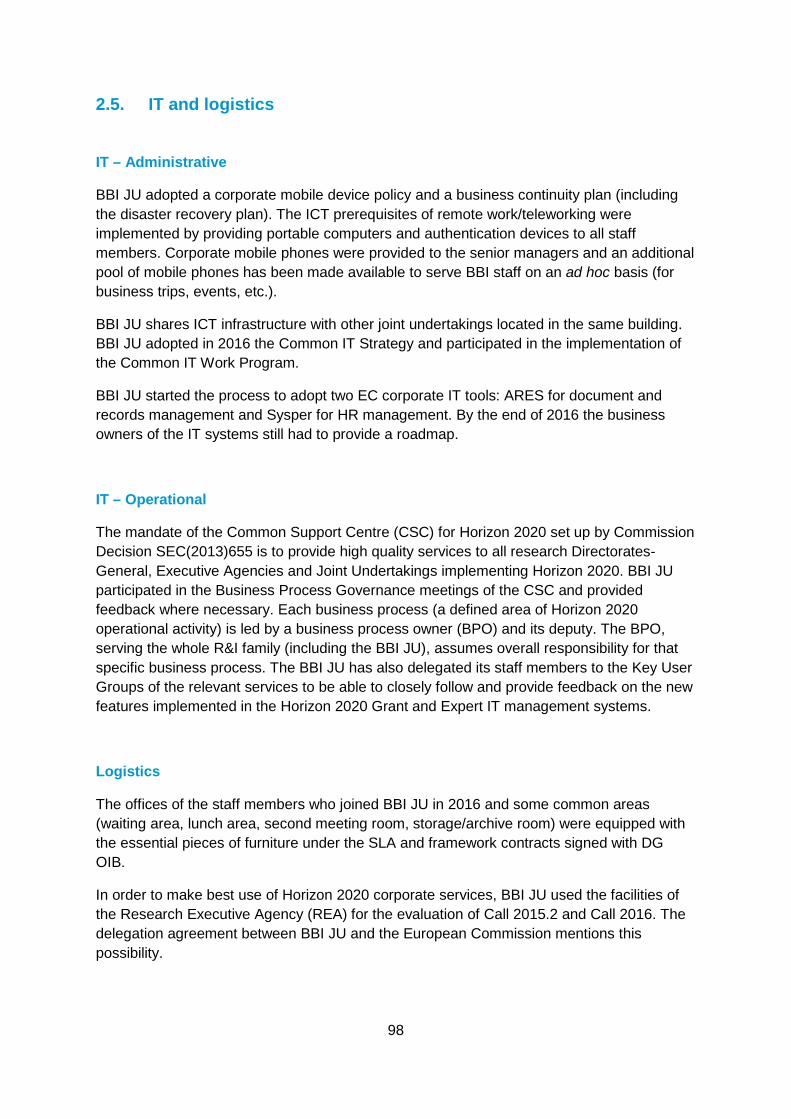
98
2.5. IT and logistics
IT – Administrative
BBI JU adopted a corporate mobile device policy and a business continuity plan (including the disaster recovery plan). The ICT prerequisites of remote work/teleworking were implemented by providing portable computers and authentication devices to all staff members. Corporate mobile phones were provided to the senior managers and an additional pool of mobile phones has been made available to serve BBI staff on an ad hoc basis (for business trips, events, etc.).
BBI JU shares ICT infrastructure with other joint undertakings located in the same building. BBI JU adopted in 2016 the Common IT Strategy and participated in the implementation of the Common IT Work Program.
BBI JU started the process to adopt two EC corporate IT tools: ARES for document and records management and Sysper for HR management. By the end of 2016 the business owners of the IT systems still had to provide a roadmap.
IT – Operational
The mandate of the Common Support Centre (CSC) for Horizon 2020 set up by Commission Decision SEC(2013)655 is to provide high quality services to all research Directorates-General, Executive Agencies and Joint Undertakings implementing Horizon 2020. BBI JU participated in the Business Process Governance meetings of the CSC and provided feedback where necessary. Each business process (a defined area of Horizon 2020 operational activity) is led by a business process owner (BPO) and its deputy. The BPO, serving the whole R&I family (including the BBI JU), assumes overall responsibility for that specific business process. The BBI JU has also delegated its staff members to the Key User Groups of the relevant services to be able to closely follow and provide feedback on the new features implemented in the Horizon 2020 Grant and Expert IT management systems.
Logistics
The offices of the staff members who joined BBI JU in 2016 and some common areas (waiting area, lunch area, second meeting room, storage/archive room) were equipped with the essential pieces of furniture under the SLA and framework contracts signed with DG OIB.
In order to make best use of Horizon 2020 corporate services, BBI JU used the facilities of the Research Executive Agency (REA) for the evaluation of Call 2015.2 and Call 2016. The delegation agreement between BBI JU and the European Commission mentions this possibility.
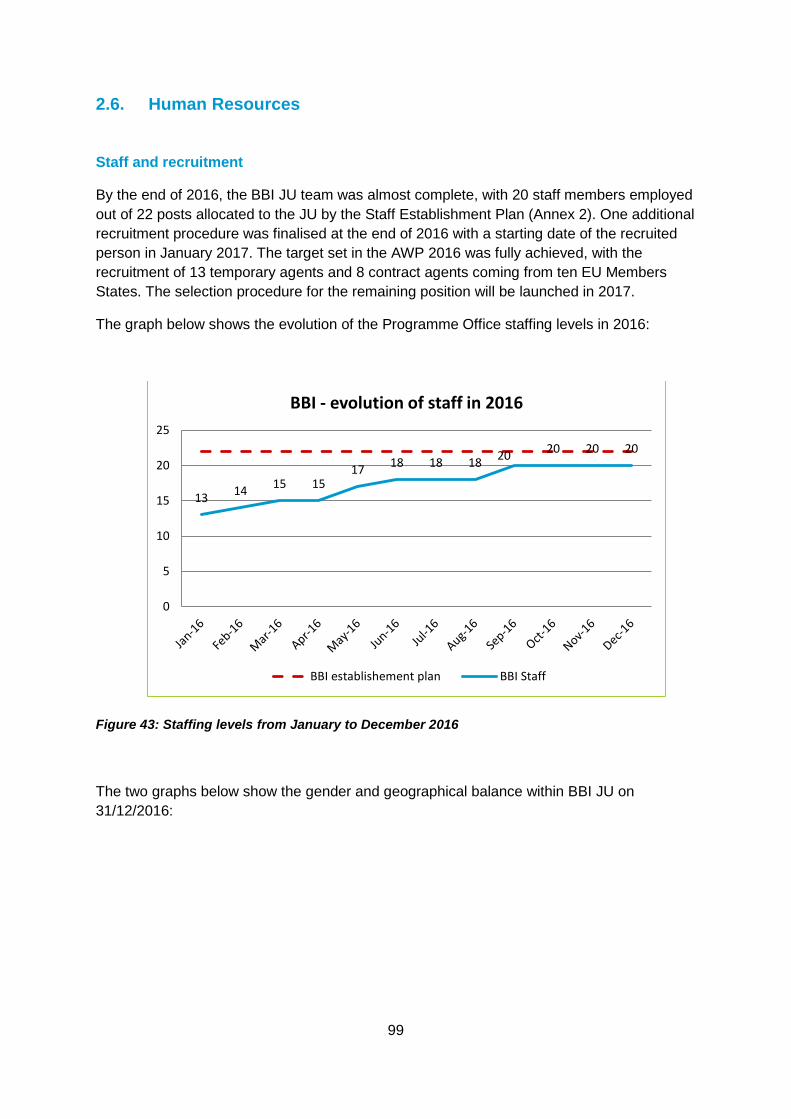
99
2.6. Human Resources
Staff and recruitment
By the end of 2016, the BBI JU team was almost complete, with 20 staff members employed out of 22 posts allocated to the JU by the Staff Establishment Plan (Annex 2). One additional recruitment procedure was finalised at the end of 2016 with a starting date of the recruited person in January 2017. The target set in the AWP 2016 was fully achieved, with the recruitment of 13 temporary agents and 8 contract agents coming from ten EU Members States. The selection procedure for the remaining position will be launched in 2017.
The graph below shows the evolution of the Programme Office staffing levels in 2016:
Figure 43: Staffing levels from January to December 2016
The two graphs below show the gender and geographical balance within BBI JU on 31/12/2016:
13 14 15 15 17 18 18 18 20 20 20 20
0
5
10
15
20
25
BBI - evolution of staff in 2016
BBI establishement plan BBI Staff
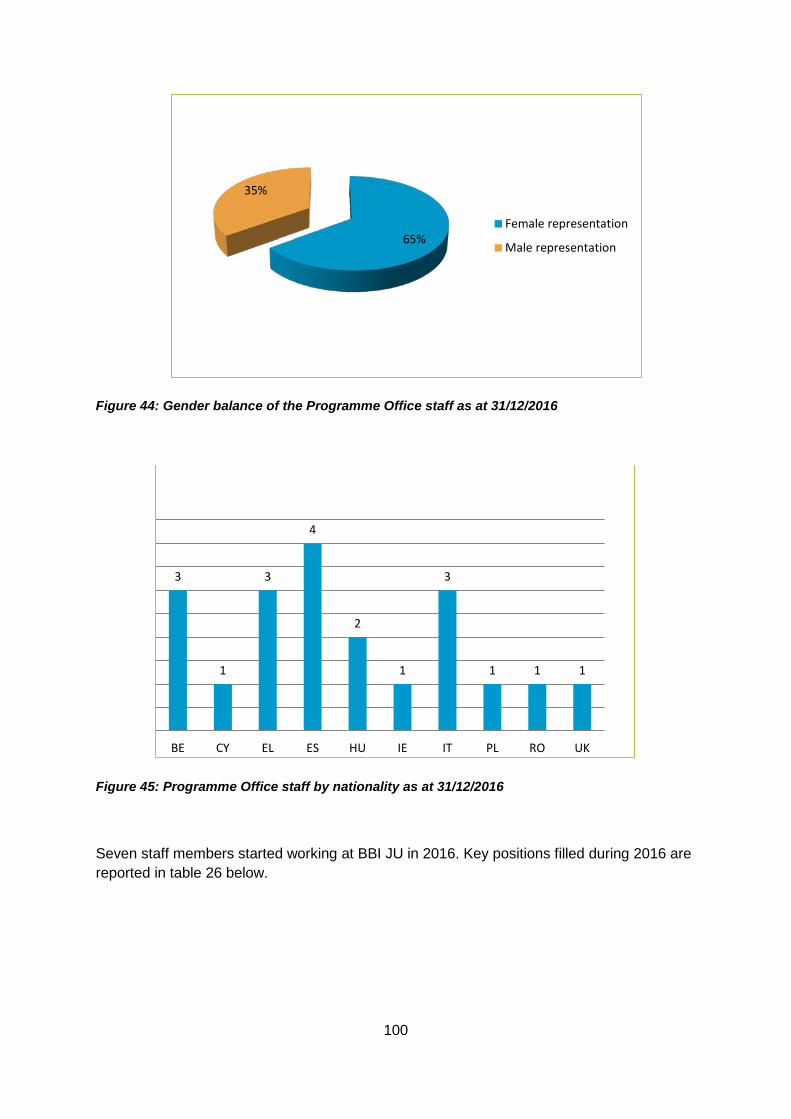
100
Figure 44: Gender balance of the Programme Office staff as at 31/12/2016
Figure 45: Programme Office staff by nationality as at 31/12/2016
Seven staff members started working at BBI JU in 2016. Key positions filled during 2016 are reported in table 26 below.
65%
35%
Female representation
Male representation
3
1
3
4
2
1
3
1 1 1
BE CY EL ES HU IE IT PL RO UK
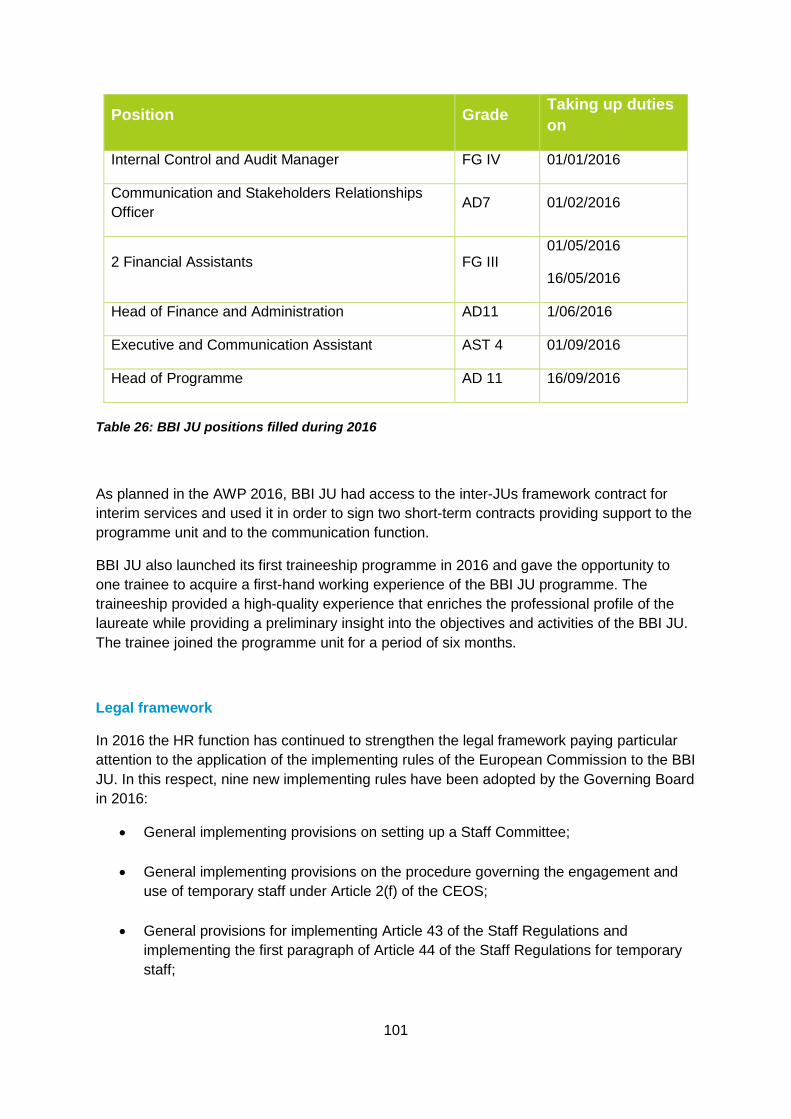
101
Position Grade Taking up duties on
Internal Control and Audit Manager FG IV 01/01/2016
Communication and Stakeholders Relationships Officer AD7 01/02/2016
2 Financial Assistants FG III 01/05/2016
16/05/2016
Head of Finance and Administration AD11 1/06/2016
Executive and Communication Assistant AST 4 01/09/2016
Head of Programme AD 11 16/09/2016
Table 26: BBI JU positions filled during 2016
As planned in the AWP 2016, BBI JU had access to the inter-JUs framework contract for interim services and used it in order to sign two short-term contracts providing support to the programme unit and to the communication function.
BBI JU also launched its first traineeship programme in 2016 and gave the opportunity to one trainee to acquire a first-hand working experience of the BBI JU programme. The traineeship provided a high-quality experience that enriches the professional profile of the laureate while providing a preliminary insight into the objectives and activities of the BBI JU. The trainee joined the programme unit for a period of six months.
Legal framework
In 2016 the HR function has continued to strengthen the legal framework paying particular attention to the application of the implementing rules of the European Commission to the BBI JU. In this respect, nine new implementing rules have been adopted by the Governing Board in 2016:
• General implementing provisions on setting up a Staff Committee;
• General implementing provisions on the procedure governing the engagement and use of temporary staff under Article 2(f) of the CEOS;
• General provisions for implementing Article 43 of the Staff Regulations and implementing the first paragraph of Article 44 of the Staff Regulations for temporary staff;
102
• General provisions for implementing Article 87(1) of the Conditions of Employment of Other Servants of the European Union and implementing the first paragraph of Article 44 of the Staff Regulations;
• General implementing provisions regarding Article 87(3) of the Conditions of Employment of Other Servants of the European Union;
• General implementing provisions regarding Article 54 of the Conditions of Employment of Other Servants of the European Union;
• General implementing provisions on the application by analogy of the implementing rules on part-time work;
• General implementing provisions on the application by analogy of the implementing rules on telework;
• General implementing provisions on measures concerning unpaid leave for temporary and contract staff of the European Union.
Following the adoption of the relevant Implementing Rules by the BBI JU Governing Board, BBI JU organised the elections of its Staff Committee at the end of 2016. Three members and one alternate member were appointed in November 2016.
Learning and career development
The BBI JU values the continuous development of its staff in order to ensure that staff members are competent in their roles and can respond to changing requirements. A Learning and Development Framework was developed in 2016 in line with the importance given to competence and career development of individuals. A Service Level Agreement in force with the European Commission provided access to a wide catalogue of trainings and ad hoc learning opportunities have been constantly communicated to staff members across the year. In addition, a wide range of training activities and workshops has also been organised in house:
• Priority management;
• Stakeholders management;
• Ethics and integrity;
• Preserving dignity and respect at work;
• Media handling workshop;
• Training on procurement rule.

103
In addition mandatory and highly recommended trainings for several key functions have been organised. For example, during 2016 the Executive Director and the two Heads of Unit attended a training for newly appointed Directors and newly appointed Heads of Unit delivered by European School of Administration.
Individual training maps have been developed for each staff member and, as a general rule, BBI JU staff dedicated at least ten days to learning and development activities in 2016, including traditional classroom learning, and also informal learning such as on-the-job learning, coaching, e-learning, teambuilding activities, etc. A welcome brochure has been developed to facilitate the integration of newly recruited staff.
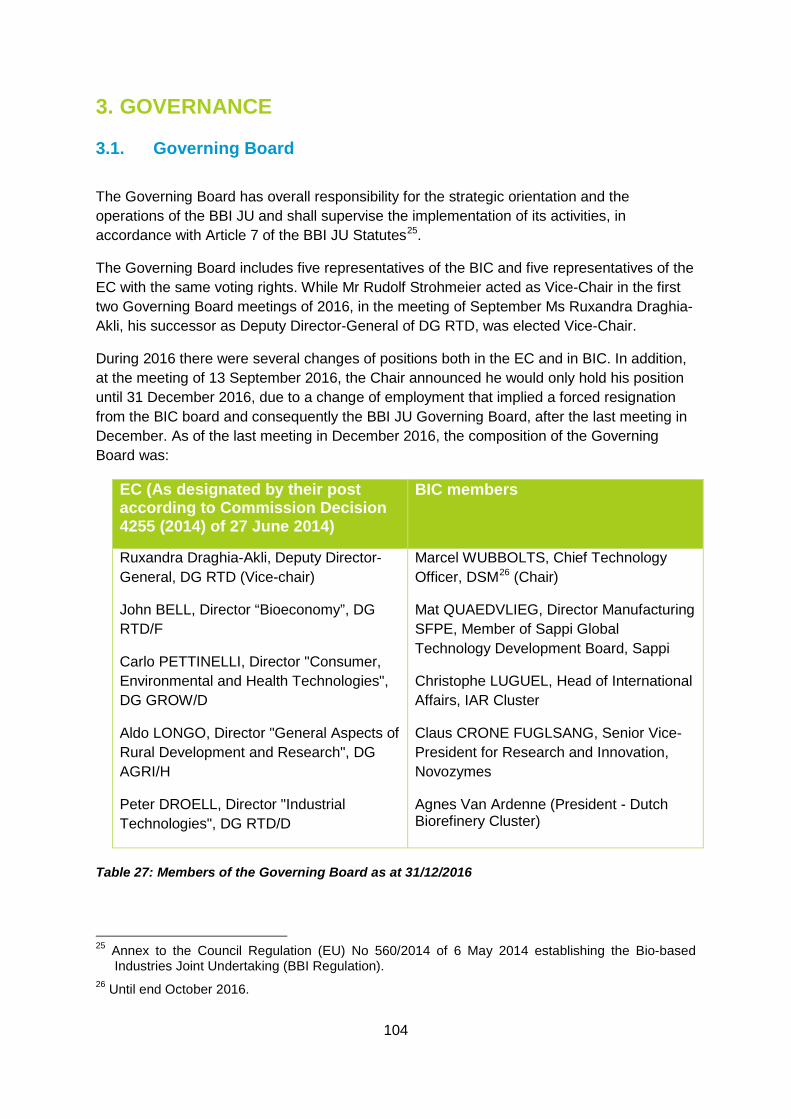
104
3. GOVERNANCE
3.1. Governing Board
The Governing Board has overall responsibility for the strategic orientation and the operations of the BBI JU and shall supervise the implementation of its activities, in accordance with Article 7 of the BBI JU Statutes25.
The Governing Board includes five representatives of the BIC and five representatives of the EC with the same voting rights. While Mr Rudolf Strohmeier acted as Vice-Chair in the first two Governing Board meetings of 2016, in the meeting of September Ms Ruxandra Draghia-Akli, his successor as Deputy Director-General of DG RTD, was elected Vice-Chair.
During 2016 there were several changes of positions both in the EC and in BIC. In addition, at the meeting of 13 September 2016, the Chair announced he would only hold his position until 31 December 2016, due to a change of employment that implied a forced resignation from the BIC board and consequently the BBI JU Governing Board, after the last meeting in December. As of the last meeting in December 2016, the composition of the Governing Board was:
EC (As designated by their post according to Commission Decision 4255 (2014) of 27 June 2014)
BIC members
Ruxandra Draghia-Akli, Deputy Director-General, DG RTD (Vice-chair)
John BELL, Director “Bioeconomy”, DG RTD/F
Carlo PETTINELLI, Director "Consumer, Environmental and Health Technologies", DG GROW/D
Aldo LONGO, Director "General Aspects of Rural Development and Research", DG AGRI/H
Peter DROELL, Director "Industrial Technologies", DG RTD/D
Marcel WUBBOLTS, Chief Technology Officer, DSM26 (Chair)
Mat QUAEDVLIEG, Director Manufacturing SFPE, Member of Sappi Global Technology Development Board, Sappi
Christophe LUGUEL, Head of International Affairs, IAR Cluster
Claus CRONE FUGLSANG, Senior Vice-President for Research and Innovation, Novozymes
Agnes Van Ardenne (President - Dutch Biorefinery Cluster)
Table 27: Members of the Governing Board as at 31/12/2016
25 Annex to the Council Regulation (EU) No 560/2014 of 6 May 2014 establishing the Bio-based
Industries Joint Undertaking (BBI Regulation). 26 Until end October 2016.
105
In 2016 four ordinary meetings took place as planned in the AWP 2016, of which one was held by teleconference (9 March), and three were face-to-face (11 April, 13 September and 15 December). The GB meeting of April took place in Utrecht in the framework of the 4th Bio-economy Stakeholder Conference.
The main decisions taken by the GB during 2016 respected the indicative timetable set in the AWP and were the following:
• First amendment of the 2016 Annual Work Plan and Budget to include in the Call 2016 the leftover budget from Call 2015 and Call 2014, and to reactivate unused administrative appropriations from 2015;
• Second and third amendments of the 2016 budget (and thus of the Annual Work Plan) to foresee that part of the EU contribution to BBI JU’s 2016 administrative expenditure was transferred by the EC to the REA, on the BBI JU’s behalf, for the management and payment of the experts-evaluators of its Call 2016;
• Amendment of the Specific Criteria for the selection of new Scientific Committee members;
• Funding of indirect actions pursuant to the 2015.2 Call for proposals;
• Adoption of the Annual Activity Report 2015;
• Adoption of the Call for new Scientific Committee members;
• Adoption of the Mission Charter of the Internal Audit Service of the European Commission in relation to bodies having legal personality set up by a basic act and entrusted with the implementation of a public private partnership;
• Decision on the setting up a Staff Committee;
• Adoption of the BBI JU Work Plan and Budget for 2017.
3.2. Executive Director
The Executive Director is the chief executive responsible person for the day-to-day management of the BBI JU in accordance with the decisions of the Governing Board. Mr Philippe Mengal has been Executive Director of the Programme Office since 1 October 2015.
Each year the Executive Director presents his proposals of priorities for the coming year to the Governing Board. The priorities are translated into yearly objectives for the BBI JU programme team and then cascaded into individual objectives for all staff members according to the SMART principles (Specific, Measurable, Accepted, Realistic and Time-related).

106
For 2016 the priorities and objectives were presented to the Governing Board at the meeting held on 11 April 2016. The priorities were mainly about building the organisation: the team, its tools, processes and procedures, while managing the Calls 2015.1 & 2. An important priority of 2016 was also to build communication and stakeholder management strategy while already performing communication activities to promote BBI and its Calls.
The objectives 2016 were organised around five priorities further explained below:
• Target operational excellence; • Solve main key issues; • Build trust and commitment; • Establish strong, clear and reliable KPIs and reporting; • Build visibility and recognition for the initiative.
For 2017, the Executive Director and his management team proposed five priorities to the Governing Board and the BBI Advisory Bodies:
• Have the Programme Office operate successfully at full speed; • Continue to build an effective and well-balanced project portfolio; • Confirm the industry commitment to the overall initiative; • Reinforce BBI JU operational excellence thanks to successful reporting and
audits; • Move the BBI JU image from awareness to reputation and recognition.
The Executive Director and his management team have incorporated these priorities in the AWP2017. They will be cascaded into Programme Office objectives and further into individual objectives for the Programme Office staff by the end of February 2017.
3.3. States Representatives Group The SRG is an advisory body of the BBI JU established in accordance with the BBI JU Regulation27. The SRG represents the interests of Member States and associated countries under Horizon 2020. Its members provide advice to the Governing Board on the programme progress and achievement of its targets. It also provides advice on the definition of the strategic orientations for the programme and the AWP. It also has an important role in reporting on national activities and programmes related to the deployment of the bio-based industrial sector at national level, in order to promote synergies and complementarities with the programme, which operates at European level.
Tables 28 and 29 show the status of representation of Member States and associated countries linked to Horizon 2020 in the SRG as of 31/21/2016.
27 For the role of the SRG see art 11 of the Statuses of the BBI JU annexed to Council Regulation
(EU) No 560/2014.
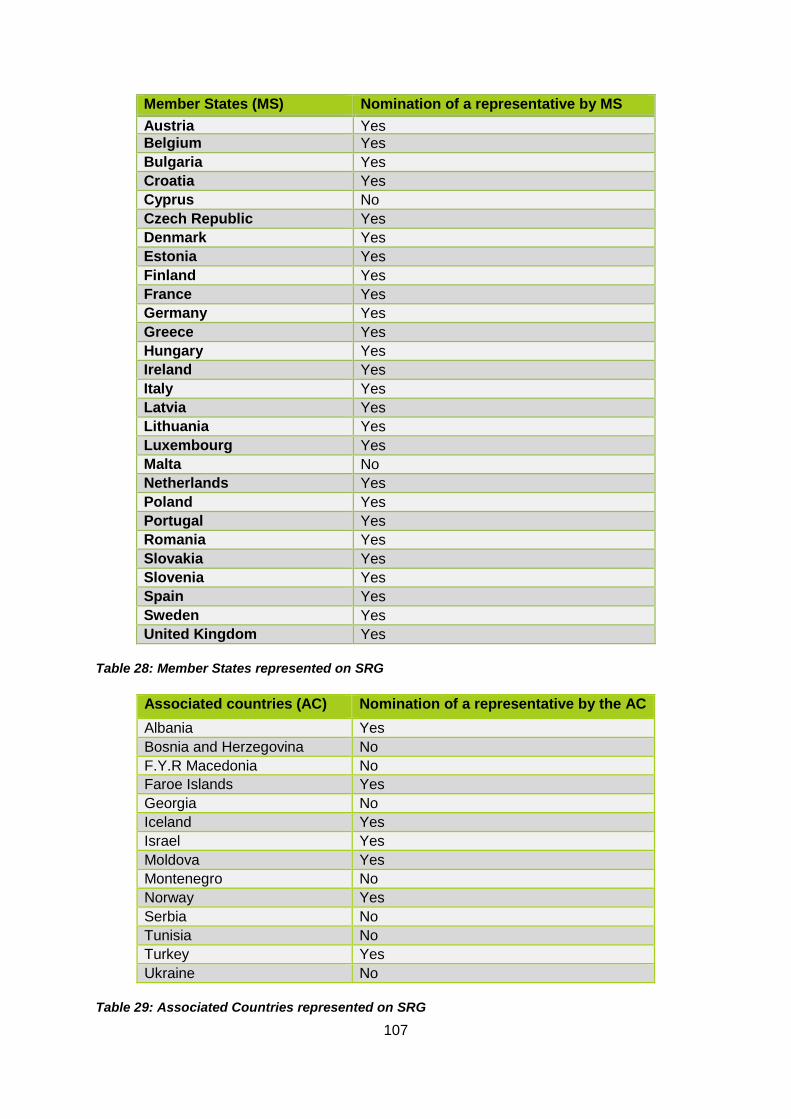
107
Member States (MS) Nomination of a representative by MS Austria Yes Belgium Yes Bulgaria Yes Croatia Yes Cyprus No Czech Republic Yes Denmark Yes Estonia Yes Finland Yes France Yes Germany Yes Greece Yes Hungary Yes Ireland
Yes
Italy Yes Latvia Yes Lithuania Yes Luxembourg Yes Malta No Netherlands Yes Poland Yes Portugal Yes Romania Yes Slovakia Yes Slovenia Yes Spain Yes Sweden Yes United Kingdom
Yes
Table 28: Member States represented on SRG
Associated countries (AC) Nomination of a representative by the AC Albania Yes Bosnia and Herzegovina No F.Y.R Macedonia No Faroe Islands
Yes Georgia No Iceland Yes Israel Yes Moldova Yes Montenegro No Norway Yes Serbia No Tunisia No Turkey Yes Ukraine No
Table 29: Associated Countries represented on SRG

108
Two Member States and seven associated countries have not nominated a representative yet, meaning that 20% of the Member States and associated countries are currently unrepresented.
SRG meetings in 2016
During 2016, two ordinary meetings of the SRG were organised by the Programme Office, on 25 May 2016 and 5 October 2016. The SRG made a valuable contribution to the strategic orientation of the programme in terms of the adjustment of the SIRA and the development of the AWP 2017. It also supported other programme-related activities by issuing concrete recommendations for the widening participation actions, improving communication and information to applicants, synergies and complementarities and was active in the deployment of the programme at national level.
In addition to the two ordinary meetings, on 26 May 2017 the Programme Office organised a half-day seminar between BIC and the SRG. The objective was to enable an informal discussion between BIC and the SRG on aspects related to the organisation and functioning of BIC. The seminar allowed the participants to gain a better understanding of the organisation and process of preparation of the work plan on BIC’s side and to discuss the challenges and benefits for national stakeholders of joining BIC. As a result, a set of recommendations to improve cooperation between the SRG and BIC were drawn up and implemented during 2016.
The SRG was chaired by Chair José Manuel González Vicente (Spanish representative) and Vice-Chair Niels Gøtke (Danish representative). Meetings were also attended by the Chair of the Scientific Committee, representatives of the Governing Board, the BBI JU Executive Director, BIC, the European Commission, and Programme Office staff.
The objectives for SRG meetings in 2016 were:
• to receive advice from the SRG on the adjustment of the SIRA and on the priority paper for the preparation of the 2017 AWP. The SRG discussed and presented their key messages on the SIRA adjustment and priorities for AWP to the Governing Board.
• to give advice to BBI JU on the final draft of the AWP 2017
• to inform the SRG on the progress of the programme towards the achievement of its targets, including the results of the 2015 Calls and information on ongoing projects results. Topics presented included SME participation, coverage of Call topics and value chains, the level of commitment of the industry in-kind (IKOP and IKAA) and in-cash (financial contributions), the balance of the budget of RIAs vs. IAs, KPIs and synergies and complementarities.
• to elect a second Vice-Chair, Fabio Fava (Italian representative), for the following two years.
109
• to discuss national activities on deployment, communication and dissemination, based on a questionnaire on national activities completed by the SRG members in advance. As a result, the SRG promoted the organisation of an event on barriers and opportunities for the deployment of the bio-based industrial sector in the Mediterranean region.
• to conduct elections for the position of SRG Chair for a period of two years, according to the SRG Rules of Procedure. The current Chair (José Manuel González Vicente) has held the position since September 2014 and was re-elected unanimously by the group for two additional years
• The SRG was also updated on the progress in the implementation of the programme towards the achievement of its targets, including preliminary submission results of the 2016 Call, synergies with other EU initiatives, information on the Scientific Committee composition and the BBI JU communication strategy.
One of the recommendations made by the SRG was the organisation of a dedicated training workshop for National Contact Points. The training should help NCPs to be better prepared to address questions from applicants and is planned for April 2017.
Minutes and documents from both meetings were distributed to the BBI JU members (BIC, EC) and all participants. A secure dedicated member area for the States Representatives Group was re-launched in 2016 to securely distribute and archive all related background documents, agendas and presentations and meeting minutes and recommendations.
3.4. Scientific Committee
The SC is the other advisory body of the BBI JU, established in accordance with the BBI JU Regulation. The SC assists the BBI JU in providing scientific advice on the areas of work undertaken by the BBI JU, such as advice on the scientific priorities to be addressed in the annual work plans, as well as commenting on the scientific achievements.
The SC met twice in 2016 in the Programme Office at Brussels. In 2016, the SC made valuable contributions to the strategic orientation of the programme, such as to the adjustment of the SIRA and the development of the AWP 2017. The SC also supported other activities by issuing concrete recommendations in the definition of programme KPIs, communication activities, and the SC selection process. This contribution was made via a two-stage consultation process.
The first stage in spring 2016 was to collect SC input for the need to adjust the SIRA based on recent scientific, technological and market developments, and to specify the priorities that should serve as the basis for the topics in the AWP 2017. The second stage of the consultation in Autumn 2016 was to review the draft versions of the SIRA and the AWP 2017, while giving detailed recommendations and advice on the scientific content. The consultation process was supported by the SC meetings.

110
Scientific Committee meetings in 2016
During 2016 two meetings of the SC took place on 24 May and 4 October 2016. The first meeting was also attended by the newly appointed Chair of the Governing Board (Marcel Wubbolts), the Vice-Chair of the SRG (Niels Gøtke) and representatives from BIC, the European Commission and Programme Office staff and its ED. The second meeting was attended by Ruxandra Draghia-Akli as the newly appointed Vice-Chair of the Governing Board along with representatives from BIC, the European Commission, the Executive Director and other Programme Office staff. Both meetings were chaired by Kevin O’Connor (SC Chair).
The objectives of the 2016 meetings were to:
• to update the SC on the progress of the programme towards the achievement of its targets, including the results of the 2015 Calls for proposals and information on ongoing projects.
• to discuss the SC input from the first stage consultation process on the adjustments of the SIRA and on the priorities for the AWP 2017. In general, the SC supported the priorities for AWP 2017 and there was a general agreement that the draft of the adjusted SIRA was heading in the right direction. The SC provided detailed written recommendations to the Programme Office, which were transferred to the founding members in BIC and the EC. The SC chair presented the main messages from the SC meeting during the SRG meeting the following day.
• to obtain the SC’s input from the second stage of the consultation on the AWP 2017. The AWP 2017 topics and budget had been sent to the SC members in advance. SC members provided their individual input to the SC Chair one week before the meeting. The input of the SC members was discussed during the meeting.
• to discuss the need to have complementary expertise represented in the SC in order to cover all relevant scientific domains in the broadening bio-based industries field. The feedback received from the participants was presented to the SRG and helped the Programme Office in setting up the workflow for the SC members’ selection (see below)
• to exchange information on communication, dissemination and deployment activities linked to BBI programme activities. Progress in the implementation of the BBI JU widening participation strategy and activities related to SRG and national activities was discussed.
• to discuss the progress and achievements made by the programme since the previous meeting and its ongoing work, including results of submissions to the 2016 Call for proposals, information on synergies with other EU initiatives, and on the progress made to complete the composition of the Scientific Committee.
• to present the ongoing process for establishing the BBI JU communication strategy. BIC and the Programme Office provided an update on the progress of adjustments to
111
the industry’s SIRA and on the planning and priorities for the AWP 2017.
In general, the SC members acknowledged that the AWP draft was of high quality and accurately reflected previous SC recommendations related to the priorities to be addressed in the AWP 2017. The SC members appreciated the need to select only a selection of the possible topics for AWP 2017 from the Priority Paper 2017-2018 due to budget restrictions, while retaining some topics for the AWP 2018.
Topic-specific recommendations were formulated and presented to the SRG the following day. These were provided to the Programme Office and the founding members (BIC and EC) in the form of a set of written recommendations. As a follow-up action the partners (BIC and EC) provided written feedback to the Programme Office on how the SC recommendations have been implemented in the final version of the AWP 2017. This feedback was distributed to the SC members.
Minutes and documents from both meetings were distributed to the BBI JU founding members (BIC, EC) and all participants. A secure dedicated member area for the members of the Scientific Committee was re-launched in 2016 to securely distribute and archive all related background documents, agendas and presentations and meeting minutes and recommendations.
Selection and Composition of the Scientific Committee
The Specific Criteria and Selection Process for the Composition of the SC was adopted at the Governing Board meeting on 27 June 2014 and amended in 2016 by the Governing Board Decision 4/16. The SC can consist of fifteen members who are appointed for three years. The appointment can be renewed once for a new three-year term upon confirmation by the Governing Board.
At the end of 2016 there were ten SC members, as two members left the SC in autumn 2016. One member left the SC due to personal matters and one member was withdrawn from the SC membership due to non-compliance with the SC rules (attendance of meetings).
Additionally, one member resigned from the SC membership in January 2017 due to a conflict of interest (change of employment/full BIC member). The mandate of the remaining nine SC members will conclude in 2017. The majority of the currently active members expressed interest to continue their SC membership for another three-year term (seven SC members).
In order to ensure cover for any missing expertise in the SC and to create a reserve list the Programme Office launched a new selection process of SC members.
The call for expressions of interest for independent experts to be appointed as SC members of BBI JU was published on 3 December 2016 in the Official Journal of the European Union (OJ), on the BBI JU and BIC websites and distributed via the relevant networks (SRG, SC, GB, and others). The appointment of the additional SC members is expected to take place before the start of the consultation process of the AWP 2018 in April 2017.
112
4. INTERNAL CONTROL FRAMEWORK BBI JU adopted its Internal Control Framework in September 2015 in order to provide reasonable assurance to the Governing Board regarding the achievement of its objectives. This framework involves all the measures taken to ensure that:
• Operational activities are effective and efficient – the BBI JU meets its objectives defined in the Annual Work Plan using the adequate human and financial resources and avoiding misuse.
• Legal and regulatory requirements are met – the BBI JU operates fully in accordance with all legal and regulatory requirements.
• Reporting is reliable – Programme Office management produces regular, reliable and easily accessible management information on financial management, use of resources and progress on the achievement of operational objectives.
• Assets and information are safeguarded – Programme Office management takes the necessary measures to ensure the completeness and preserve the integrity of the data on which management decisions are taken and reports are issued.
All Programme Office management processes and functions meet these four objectives, meaning that the largest possible preventive, detective and corrective controls are in place. The main activities performed in 2016 include the following:
• Ensure awareness and implementation of BBI JU Internal Control Standards (ICS) through yearly assessment;
• Report on compliance and effectiveness in the annual activity report;
• Carry out periodic review of risks at least yearly in the context of preparing the annual work programme;
• Coordinate visits of the European Court of Auditors;
• Liaise with the auditors of the Internal Audit Service;
• Follow up on the implementation of action plans on audit recommendations and on observations of the discharge authority.
4.1. Financial Procedures
The BBI JU adopted a Manual of Financial Procedures in October 2015 as a requirement for its autonomy. These procedures were revised during 2016 in light of the EC DG Budget guidelines and in order to better address the particular risks and various other specificities
113
of the joint undertaking. This revision also took into account the increased number of Programme Office staff in order to establish a clearer definition of roles. The Programme Office carried out an analysis to establish a common procedure for tendering and signing procurement contracts, which will be definitively put in place from the beginning of 2017.
4.2. Ex-ante controls on operational expenditure The Programme Office, under the administration and finance unit, has been performing ex-ante controls in line with the provision of article 18 of the BBI JU Financial Rules28 in order to provide assurance to the authorising officer on the correctness of all payments.
Checklists further complement guidance on ex-ante controls included in the financial rules and in the Manual of Financial procedures of BBI JU. For the operational expenditure, the processing and recording of the transactions in the accounting IT system (ABAC) are mostly performed via the corporate Horizon 2020 IT tools (SYGMA/COMPASS), which assures a high degree of automation, and controls are embedded in each workflow. In addition to this, the Programme Office has established internal step-by-step procedures for financial verification in order to ensure coherence in controls and to facilitate the learning curve of newly recruited staff.
During 2016, the only operational expenditure was the grant pre-financing payments from the Calls 2015.1 (3 payments) and 2015.2 (23 payments). The average TTP was eight days (against a target of 30 days) and 25 out of 26 payments were on time.
Throughout 2016 the Programme Office has been cooperating with other members of the Horizon 2020 research family in the definition of a common ex-ante strategy for interim and final payments related to grants, under the coordination of the Common Support Centre (CSC) of DG RTD of the European Commission. The overall objective was to define cost-effective, efficient, rapid and harmonised ex-ante controls avoiding unnecessary burden for beneficiaries while ensuring a reasonable level of controls. In parallel to this process, taking into account risk-based and cost-effectiveness considerations, the Programme Office has commenced the setup of internal procedures defining the ex-ante controls to be performed on the first batch of periodic reports and cost claims that are expected to be received by the first quarter of 2017. Additionally, the Programme Office has planned mid-term project reviews to be carried out by external experts and ad-hoc technical reviews to be launched when deemed necessary.
28 ‘each operation shall be subject at least to an ex-ante control based on a desk review of documents
and on the available results of controls already carried out relating to the operational and financial aspects of the operation’
114
4.3. Ex-post control of operational expenditure and error rates identified
No ex-post audits were carried out on operational expenditure in 2016 because the first batch of periodic reports and cost claims are to be processed and paid only by Q2 of 2017. This means that in October 2016 it was not possible to proceed with the selection of audits for the audit planning of 2017 along with the other clients of the Common Audit Service (CAS) of DG RTD. The Programme Office requested the CAS to proceed with a dedicated selection during 2017.
The Programme Office has been cooperating with other members of the Horizon 2020 research family, under the coordination of the CSC, on the update of the Horizon 2020 Common Audit Strategy for interim and final payments of operational expenditure and in the definition of implementing rules. These cover the Audit Approach for Bankruptcy Cases, Materiality Threshold for Extrapolations, Indicative Audit Programme instructions on the audit findings, Sampling methodology, Working Arrangements for Horizon 2020 Processes, Coordination of Horizon 2020 audits under the coordination of the CSC.
4.4. Audit of the European Court of Auditors On 15 November 2016 the European Court of Auditors (ECA) published its report on BBI JU’s annual accounts for the financial year 2015, in which the ECA issued a ‘clean opinion’ (with no qualifications) on the reliability of the accounts and the legality and regularity of all transactions underlying the annual accounts.
4.5. Internal Audit The Internal Audit Service (IAS) of the European Commission performs the internal audit function for the BBI JU as specified in its financial rules adopted by the Governing Board on 09 December 2014 as amended by the GB decision of 23 December 2015. On 11 April 2016 the Governing Board ratified the IAS mission charter and, during July/August 2016, the IAS carried out a risk assessment exercise covering the Programme Office’s major processes, both operational and administrative.
The exercise consisted of the following steps:
• a desk review of the main documents concerning the BBI JU; interviewing on-site key BBI JU staff in order to obtain an overview of the processes and the related key controls;
• assessing the most important risks related to these processes; • drafting a strategic audit plan with a short list of future audit topics.
The assessment of the administrative processes, including the IT processes of the joint undertaking, was based on a standardised, structured risk assessment questionnaire.
115
Questions specifically adapted to the operational processes of the programme were used for the assessment of the operational processes.
The results of the risk assessment have been summarised in a matrix mapping the processes of the Programme Office according to their maturity in relation to risks and related controls. Auditors have assessed the risks in order to establish the possible audit topics and to prioritise them in view of the future audit plan.
On that basis, on 22 December 2016 the IAS delivered its Strategic Internal Audit Plan (SIAP) 2017-2019 to the Executive Director and Governing Board and the following prospective topics have been proposed for the three years to come:
• in 2017: a limited review of the implementation of the Internal Control Standards (ICS);
• in 2018: Horizon 2020 grant process (from the identification of the Call topics to the signature of the grant agreement);
• in 2019: a performance management of activities.
The strategic internal audit plan will be subject to an annual review and the topics may be adjusted or new topics may be added to reflect new and emerging risks as well as significant changes in the processes. The next in-depth risk assessment is planned for 2020.
4.6. Risk management and Conflict of Interest The Programme Office has put a comprehensive risk management process in place, in line with applicable provisions and guidelines. In 2016, the Programme Office conducted the risk assessment exercise at two levels:
• risk assessment within the scope of the objectives set in the AWP 2017. • risk assessment within the scope of the priorities set for the organisation and
cascaded to individuals for 2017.
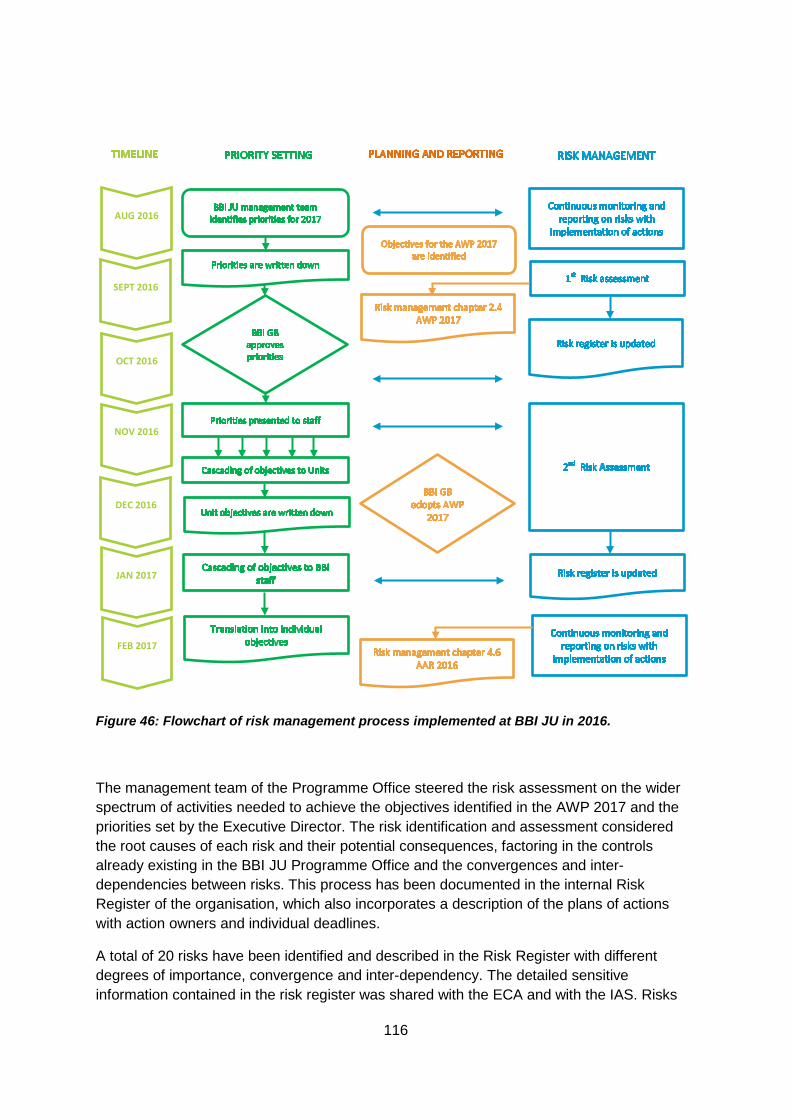
116
Figure 46: Flowchart of risk management process implemented at BBI JU in 2016.
The management team of the Programme Office steered the risk assessment on the wider spectrum of activities needed to achieve the objectives identified in the AWP 2017 and the priorities set by the Executive Director. The risk identification and assessment considered the root causes of each risk and their potential consequences, factoring in the controls already existing in the BBI JU Programme Office and the convergences and inter-dependencies between risks. This process has been documented in the internal Risk Register of the organisation, which also incorporates a description of the plans of actions with action owners and individual deadlines.
A total of 20 risks have been identified and described in the Risk Register with different degrees of importance, convergence and inter-dependency. The detailed sensitive information contained in the risk register was shared with the ECA and with the IAS. Risks
SEPT 2016
OCT 2016
NOV 2016
DEC 2016
JAN 2017
FEB 2017
AUG 2016
117
whose management relies on the cooperation with the principal stakeholders of the joint undertaking (the European Commission, BIC and the BBI JU advisory bodies), were communicated before the adoption of the AWP.
The most important risks currently requiring further actions in addition to existing controls are:
• Programme Management: Risks related to the external environment potentially affecting reporting and certification of in-kind contributions;
• Project Management: Risks related to the external environment and to the Programme Office planning, processes and systems potentially affecting payments of pre-financing, ex-ante controls and, more in general, the swiftly processing of reports and payments; Risks related to legality and regularity aspects potentially affecting ex-post controls on operational expenditure and their timely implementation and reporting of their results;
• HR management: Risks related to people and to the organisations potentially affecting availability and efficient allocation of resources.
As risks naturally evolve, the Programme Office has established a continuous reporting process to the Executive Director. This process covers updating the Risk Register, monitoring of identified risks and implementing relevant actions for assurance purposes.
Other sensitive topics have been assessed as effectively and efficiently addressed through the controls already implemented at BBI JU. The following points are reported in more detail:
• Management of potential conflicts of interest:
The Programme Office has developed a comprehensive set of rules and procedures that are effectively implemented across its entire governance structure on a day-to-day basis as follows:
• On joining the Programme Office team, each staff member acknowledges and agrees the application of the staff regulations and signs a declaration of honour on the management of conflicts of interests.
• A copy of the code of good administrative behaviour is also provided to staff members. Furthermore, training on identification and management of conflict of
118
interests and whistleblowing was provided in 2016.
• Conflict of Interest procedures for the members of the Governing Board and of the advisory boards of BBI JU are effectively implemented.
• Specific measures have been implemented for prevention and management of conflicts of interest of experts in charge of the evaluation of grant applications, projects and tenders and for providing opinions and advice in specific cases.
The European Commission has been consulted since 2015 on the Implementing Rules (IRs) on the prevention and management of conflicts of interests for the Programme Office staff. In January 2017 DG HR of the European Commission agreed on a final version of the IRs and launched the procedure for a formal decision. Following this, the Programme Office will be able to submit these rules to the Governing Board for adoption. This will allow in particular the adoption of a common template for the declaration of absence of a conflict of interest, and also enable a reporting to the discharge authority on the completion of these declarations.
• Fraud prevention and detection
According to Article 12 of the BBI JU’s Financial Rules, the budget should be implemented in compliance with effective and efficient internal control, including prevention, detection, correction and follow-up of fraud and irregularities.
Following the adoption of an Anti-Fraud Strategy by the Commission in June 2011, the first common Research Anti-Fraud Strategy was adopted in July 2012, and updated in March 2015 to take account of changes introduced by Horizon 2020. The Research Anti-Fraud Strategy includes an action plan to be implemented in cooperation with all the members of the Research Family.
In 2016 BBI JU continued to cooperate in this field within the Fraud and Irregularities network of Horizon 2020 research family. No potential fraud cases have been detected in the course of the year.
Relevant Programme Office staff have had training on fraud detection and the possibility to refresh knowledge in the field has been promoted within the learning and development framework of the BBI JU.
• Data protection
The Programme Office has taken the necessary measures to assure that appropriate data protection measures are in place and appointed two key internal functions in this field and in line with legal and framework requirements. These two functions are:
• The Local Informatics Security Officer (LISO) in charge of ensuring the security of information systems at a local level.
119
• The Data Protection Officer (DPO) in charge to ensure that any controller of BBI data
respects the data protection obligations and that data subjects are informed of their rights and obligations pursuant to the Regulation (EC) 45/2001.
BBI JU shares ICT infrastructure with other Joint Undertakings located in the same building. BBI JU adopted in 2016 the Common Security Policy, which sets out the security and data protection requirements and principles to be applied by data processors on outsourced activities.
Preservation of internal information security is covered under the Security Plan of Managed Services. Preservation of data integrity, legibility and accessibility is assured in the IT infrastructure of BBI JU and relevant elements of assurance are addressed in the Business Continuity Plan and in the Disaster Recovery Plan.
Within the processing of personal data, application of Regulation (EC) No 45/2001 is ensured in two distinct contexts:
• Data collection in the context of the Calls for proposals under Horizon 2020; this data is collected and treated within the corporate specifications of Horizon 2020 IT tools;
• Processing of personal data in the context of public procurement, recruitment29, spontaneous contact, etc. Such data is also processed pursuant to Regulation (EC) No 45/2001 under the responsibility of the BBI JU Data Protection Officer (DPO).
4.7. Compliance and effectiveness of Internal Control
In line with articles 12 and 17.3 of the BBI JU Financial Rules, the Governing Board adopted 16 Internal Control Standards (ICSs) on 14 September 2015 on the basis of the equivalent standards laid down by the European Commission for its own departments, having due regard to the risks associated with the Joint Undertaking management environment.
The 16 ICSs are structured around six major areas:
• Mission and values (ICS1 Mission, ICS2 Ethical and organisational values);
• Human resources (ICS3 Staff allocation and flexibility, ICS4 Staff evaluation and development);
• Planning and risk management process (ICS5 Objective and performance indicators, ICS6 Risk management process);
29 Personal files are subject to a different procedure and directly communicated to the European Data
Protection Services (EDPS) by the HR Manager.
120
• Operations and control activities (ICS7 Operational structure, ICS8 Processes and procedures, ICS9 Management supervision, ICS10 Business continuity, ICS11 Document management);
• Information and financial reporting (ICS12 Information and communication, ICS13 Accounting and financial reporting);
• Evaluation and audit (ICS14 Evaluation activities, ICS15 Assessment of internal control systems, ICS16 Internal audit function).
Each ICS consists of two components: the standard itself that defines the minimum control objectives to be achieved, and the requirements that detail the relevant systems that shall be put in place and the practical actions that shall be implemented in order to assure the effective implementation of each standard.
The compliance with ICSs and the effectiveness of the internal control systems have been monitored and assessed across the full year. IAS activities in this regard did not provide any assurance audit on Programme Office processes and systems. However, the risk assessment performed with the IAS provided to the Programme Office the opportunity to map and assess the level of documented controls in place. This also provided valuable information on the state of implementation of IC systems. The internal risk management process is an integral part of BBI JU’s internal control framework and it incorporates an assessment of internal controls measures in place against identified risks.
The information available from other internal and external control monitoring tools was analysed for its impact on the effectiveness of BBI JU’s internal control system. This was carried out in addition to complement the compliance and effectiveness assessment. The information used came mainly from: quality controls from the accountant at the European Commission, reports from the European Courts of Auditors, quarterly reports to the Governing Boards, the registry of exceptions and internal control weaknesses.
The Programme Office achieved all the priority objectives set in the AWP 2016 for the ICSs. It implemented the necessary actions to assure compliance with the overall set of control objectives and continuously reviewed the underlying IC systems throughout. The responsible Programme Office staff identified initiatives with an updated action plan, monitored the implementation and reported to the management.
According to the AWP 2017 of BBI JU, in 2017 the focus will be put on a limited review of BBI JU ICS. This work will be performed in cooperation with the IAS, as agreed in its SIAP 2017-2019 for BBI JU. The aim will be to provide a higher degree of maturity of the system. The Programme Office will conduct a control gap analysis and correct any anomalies found. The Programme Office has also started the formal documentation of processes and procedures that will continue in 2017. The emphasis on controls will be placed on prevention vs. detection, with a focus on process owners being responsible for a robust self-assessment of operating effectiveness. These activities will be supported and complemented by an in depth self-assessment aimed to provide a critical analysis on organisation, processes and resources. This process is expected to assess compliance and effectiveness of the Programme Office IC systems, and to further promote its efficiency.
121
5. MANAGEMENT ASSURANCE
5.1. Assessment of the Annual Activity Report by the Governing Board
Introduction
The Bio-based Industries Joint Undertaking (BBI JU) Programme Office sent the first version of the BBI JU Annual Activity Report (AAR) for 2016 to the BBI JU Governing Board (GB) on 28 February 2017. Due to the substantial number of comments (and changes requested) by the European Commission (EC), the BBI JU Programme Office submitted a second version to the Commission on 27 April 2017, and a third version on 19 May 2017. This third version is the object of this assessment.
On 15 December 2016, the GB had mandated a ‘Working Group’ to assess the AAR 2016. The members of this Working Group are Mr Dirk Carrez (Executive Director of the Bio-Based Industries Consortium (BIC), the member other than the Union) and the Head of Unit DG RTD.F2 of the EC (now Ms Gaia Fantechi). The GB had agreed on the launching of a written procedure for its adoption, following the Working Group’s assessment.
In accordance with Article 15(3) of the GB’s rules of procedure, Ms Fantechi and Mr Carrez reported back to the GB on 16 June 2017 by providing a draft assessment, which is the basis for the GB’s current assessment.
Analysis
The Annual Work Plan (AWP) 2016 was adopted by the GB on 16 December 2015 and was subsequently amended on 23 March 2016 and on 15 December 2016. The GB recognises the progress made by the BBI JU towards achieving the objectives set in the AWP 2016. It notes in particular that:
• The grant agreements of Calls 2015.1 and 2015.2 were signed with an average time to grant of 227 days and 239 days respectively (against a target of 243 days), thus reflecting the efforts made. The Union provided a total amount of EUR 179 036 975 in funding for the 26 projects resulting from these calls.
• Call 2016 was published on 18 April 2016 with a deadline for submission of proposals on 8 September 2016. It had an estimated Union budget of EUR 188 650 000. The resulting 29 grant agreements, which included a Union contribution of EUR 185 602 866, were signed by May 2017.
• Including the projects resulting from Call 2016 – which had not yet been signed at the reference date of 31 December 2016, but had undergone selection only – the BBI JU project portfolio accounts for 65 projects, with a total Union contribution of EUR 414 293 549. The funding is allocated as follows: 33 % for six flagships; 40 % for 20 demonstration actions; 26 % for 33 research and innovation actions; 1 % for six coordination and support actions.
• Among the 729 beneficiaries of the Calls 2014-16, 264 (36 %) are small or medium-sized enterprises (SMEs), which received 29 % of the Union contribution. This is higher than the overall target for Leadership in Enabling and Industrial Technologies (LEIT) and the Societal Challenges in Horizon 2020. The share of the Union contribution going to SMEs
122
rose from 20 % in 2014 to 25.4 % in 2015 and further increased to 35 % in 2016 (in terms of SME participation: 24.5 % in 2014; 40 % in 2015; and 36.7 % in 2016).
• For the calculation of the leverage, only the signed grant agreements from Calls 2014 and 2015 can be considered, as the Call 2016 grant agreements have been signed during 2017 only. Until the end of 2016, the BBI JU funds committed to these projects amount to EUR 228 690 682. This Union contribution has leveraged a total contribution from the member other than the Union or its constituent entities of EUR 406 853 657. This total contribution consists of: • In kind contributions to operational activities (IKOP) of EUR 114 621 657 (signed
grant agreements from Calls 2014-15); • In kind contributions to additional activities (IKAA) of EUR 291 482 000 (certified for
2014 and 2015); • Financial contributions to operational costs (‘in cash’) of EUR 750 000 (Calls 2014 to
2016). This is far below the objective of EUR 182 500 000 for the full duration of the BBI JU.
• The in kind contributions to additional activities (IKAA) for 2016 can neither be taken into account, as they have not yet been certified at the time of finalising the AAR 2016.
• The financial contribution (‘cash’) at project level of EUR 2 939 158 (signed grant agreements from Calls 2014-15) cannot be taken into account yet, as the current Council Regulation does not allow for this.
• The GB observes that the BBI JU has refrained from showing figures highlighting the calculated leverage effect in the AAR 2016, in either of the sections that are announced for this (sections 1.3.1.3 and 1.7). The GB proposes to use the figures and calculation mentioned below.
• By applying the leverage formula used by the EC for the interim evaluation of the Joint Technology Initiatives (JTIs),i the total leverage effect obtained in the first three years of operations is already 1.8, meaning that the member other than the Union or its constituent entities have contributed 1.8 euro for every euro of Union contribution. Whereas the operational leverage is at 0.5, the additional leverage is at 1.3. By taking into account also the (not yet certified) figures given in the Draft IKAA Report 201630, the additional leverage reaches 2.1, giving a total leverage effect of 2.6. Taken together, this is a positive step in the attempt to achieve the expected leverage factor of 2.8 by 2024.
• In 2016, the BBI JU Programme Office successfully used the facilities of the Research Executive Agency (REA) for the evaluation of Calls 2015.2 and 2016 for the first time.
• The GB takes note of the reported under-execution of the administrative budget. The GB appreciates the efforts to absorb this administrative surplus, which was due to an over-budgeting of the staff costs for 2015 and 2016, which were decided before the autonomy of the BBI JU.
• The GB appreciates the very active work on communication and outreach done by the BBI JU Programme Office and its staff, which participated actively in 15 national info
30 Note that the IKAA Plan 2016 is in the process of being approved by the GB at the time of finalising
this assessment. The IKAA Report 2016, which is based on that plan, is expected to be certified just after the approval of the IKAA Plan 2016.
123
days and 34 further events, improved the web site and increased visibility on social media, and took part in external publications.
• The GB notes that the target of 22 staff members set in the AWP 2016 has almost been met, and that the BBI JU staff carried out activities in 2016 that were relevant to their role.
• The GB acknowledges that the Programme Office management processes and functions meet the four objectives of its Internal Control Framework as a result of: a yearly assessment of the BBI JU’s Internal Control Standards; a report on compliance and effectiveness in the AAR; yearly periodic reviews of risks; liaising with auditors from the Internal Audit Service and the European Court of Auditors; and follow-up on the implementation of action plans on audit recommendations and on observations by the discharge authority. The GB also appreciates the revision of the Manual of Financial Procedures of 2015 in light of the DG Budget guidelines with a view to better addressing the particular risks facing the joint undertaking. The BBI JU Programme Office has been performing ex-ante controls in line with Article 18 of the BBI JU Financial Rules in order to provide assurance to the authorising officer on the correctness of all payments: use of the IT tools of Horizon 2020, and internal step-by-step procedures for financial verification. Moreover, the GB also acknowledges that in 2016 the BBI JU Programme Office continued to participate in the Fraud and Irregularities network of the Horizon 2020 research family, and that no potential fraud cases were detected. The GB takes note that no ex-post audits were carried out on operational expenditure in 2016, because no periodic payments have been made yet.
The GB however considers that the following aspects of the report require improvement:
• The GB notes that the BBI JU has made an effort to address the numerous concerns the EC had on the first version of the report on key performance indicators (KPIs). Correct and sound reporting is crucial for avoiding any reputational risk to the BBI JU (and by extension, the EC and BIC), since the figures will be public and will be scrutinised with the utmost attention by various stakeholders.
• The GB also asks the BBI JU, the BIC and the EC to make a strong effort to improve the questionnaire to coordinators as well as to develop a consistent methodology to verify self-reported information (KPIs reported by the coordinators).
• The GB requests that the AAR 2017 gives and describes the value for the operational and additional leverage calculated according to the official leverage formula used by the EC for the interim evaluation of the JTIs. To remove the bias due to the unavoidable time lag between the finalisation of the AAR, the approval of the IKAA Plan and the certification of the IKAA Report, the figures of the Draft IKAA Report could be considered for the additional leverage calculation, in addition to those given in the already approved IKAA Reports, but clearly distinguishing between the results based on certified data and those based on the draft report.
• The GB asks the BBI JU to refrain from qualitative and premature statements, such as ‘… showing Europe is back on the map of the attractive areas to invest in the bio-based industry’.
• The GB notes that the AAR submitted should conform to the standards for publication. This was not the case for the first two versions submitted, requiring supervision by the EC. The GB asks all parties involved to perform a critical analysis of the AAR drafting process in order to deliver timely and efficiently an improved AAR fit for publication.
124
Conclusion
The GB believes that the technical and operational information provided in the AAR 2016 reflects the situation at the end of 2016 in a realistic way. It believes that the AAR 2016 provides a complete and accurate report of the progress made by the BBI JU during 2016, in particular on the objectives set in the AWP 2016 as last amended on 15 December 2016. The report clearly identifies the risks associated with the BBI JU’s operations, duly reports on how the resources provided were used, and indicates the efficiency and effectiveness of the BBI JU’s internal control system.
However, the GB also draws the BBI JU’s attention to the issues that merit improvement, such as the lack of leverage figures in the AAR, verifying and describing KPIs, and the quality management of outgoing documents. It also draws the attention of BIC to the still existing risk of BIC failing to deliver on the financial contribution to operational costs (in cash).
Based on the Working Group’s report, the declaration of the Authorising Officer, and the information provided in this report, the conclusion of the assessment of the GB is that the 2016 key objectives have been achieved in compliance with the principles of legality and of sound financial management.
The GB, taking note of the declarations of assurance provided by the BBI JU’s management, confirms that overall, suitable internal control standards have either been put in place or are still being developed, and that the BBI JU is properly monitoring and mitigating risks.
i The leverage refers to contributions from participants in the BBI Initiative to the activities of the initiative. It is calculated as the sum of two elements: operational leverage and additional leverage. These two are hereby described:
𝑂𝑂𝑂𝑂𝑂𝑂𝑂𝑂𝑂𝑂𝑂𝑂𝑂𝑂𝑂𝑂𝑂𝑂𝑂𝑂𝑂𝑂 𝑂𝑂𝑂𝑂𝑙𝑙𝑂𝑂𝑂𝑂𝑂𝑂𝑙𝑙𝑂𝑂 =∑ 𝐼𝐼𝐼𝐼𝑂𝑂𝐼𝐼 + ∑ "𝑂𝑂𝑂𝑂 𝑐𝑐𝑂𝑂𝑐𝑐ℎ"∑𝐸𝐸𝐸𝐸 𝑐𝑐𝑂𝑂𝑂𝑂𝑂𝑂𝑂𝑂𝑂𝑂𝑐𝑐𝑐𝑐𝑂𝑂𝑂𝑂𝑂𝑂𝑂𝑂
Based on the in-kind and financial (“in cash” contributions to operational costs of Calls 2014 to 2016 as well as the signed grant agreements of Calls 2014-15, the result by 31 December 2016 is:
𝑂𝑂𝑂𝑂𝑂𝑂𝑂𝑂𝑂𝑂𝑂𝑂𝑂𝑂𝑂𝑂𝑂𝑂𝑂𝑂𝑂𝑂 𝑂𝑂𝑂𝑂𝑙𝑙𝑂𝑂𝑂𝑂𝑂𝑂𝑙𝑙𝑂𝑂 = (114 621 657 + 750 000) / 228 690 682 = 0.504
The additional leverage refers to contributions from the member other than the Union or its constituent entities to the additional activities outside the work plan of the BBI JU contributing to the objectives of the BBI Initiative:
𝐴𝐴𝐴𝐴𝐴𝐴𝑂𝑂𝑂𝑂𝑂𝑂𝑂𝑂𝑂𝑂𝑂𝑂𝑂𝑂 𝑂𝑂𝑂𝑂𝑙𝑙𝑂𝑂𝑂𝑂𝑂𝑂𝑙𝑙𝑂𝑂 =∑𝐼𝐼𝐼𝐼𝐴𝐴𝐴𝐴
∑𝐸𝐸𝐸𝐸 𝑐𝑐𝑂𝑂𝑂𝑂𝑂𝑂𝑂𝑂𝑂𝑂𝑐𝑐𝑐𝑐𝑂𝑂𝑂𝑂𝑂𝑂𝑂𝑂
Based on the available certified contributions to additional activities in 2014 and 2015 and the signed grant agreements of Calls 2014-15, the result by 31 December 2016 is:
𝐴𝐴𝐴𝐴𝐴𝐴𝑂𝑂𝑂𝑂𝑂𝑂𝑂𝑂𝑂𝑂𝑂𝑂𝑂𝑂 𝑂𝑂𝑂𝑂𝑙𝑙𝑂𝑂𝑂𝑂𝑂𝑂𝑙𝑙𝑂𝑂 = 291 482 000 / 228 690 682 = 1.275
For 2016, the certified contributions to additional activities were not available by the date of drafting the current assessment and therefore had to be disregarded.
125
The total leverage effect is thus
𝑇𝑇𝑂𝑂𝑂𝑂𝑂𝑂𝑂𝑂 𝑂𝑂𝑂𝑂𝑙𝑙𝑂𝑂𝑂𝑂𝑂𝑂𝑙𝑙𝑂𝑂 = 0.504 + 1.275 = 1.779
By taking into account already now also the figures given in the Draft IKAA Report 2016,1 the result of the additional leverage would be:
𝐴𝐴𝐴𝐴𝐴𝐴𝑂𝑂𝑂𝑂𝑂𝑂𝑂𝑂𝑂𝑂𝑂𝑂𝑂𝑂 𝑂𝑂𝑂𝑂𝑙𝑙𝑂𝑂𝑂𝑂𝑂𝑂𝑙𝑙𝑂𝑂𝑖𝑖𝑖𝑖𝑖𝑖𝑖𝑖. 𝐷𝐷𝐷𝐷𝐷𝐷𝐷𝐷𝐷𝐷 𝐼𝐼𝐼𝐼𝐼𝐼𝐼𝐼 𝑅𝑅𝑅𝑅𝑅𝑅𝑅𝑅𝐷𝐷𝐷𝐷 2016 = (291 482 000 + 185 863 000) / 228 690 682 = 2.087
The total leverage effect including the not-yet certified figures of the Draft IKAA Report 2016 would be thus
𝑇𝑇𝑂𝑂𝑂𝑂𝑂𝑂𝑂𝑂 𝑂𝑂𝑂𝑂𝑙𝑙𝑂𝑂𝑂𝑂𝑂𝑂𝑙𝑙𝑂𝑂𝑖𝑖𝑖𝑖𝑖𝑖𝑖𝑖. 𝐷𝐷𝐷𝐷𝐷𝐷𝐷𝐷𝐷𝐷 𝐼𝐼𝐼𝐼𝐼𝐼𝐼𝐼 𝑅𝑅𝑅𝑅𝑅𝑅𝑅𝑅𝐷𝐷𝐷𝐷 2016 = 0.504 + 2.087 = 2.591
5.2. Elements supporting assurance This section reviews the assessment of the elements reported in chapters 2 and 4 and draws conclusions that enable the Executive Director to obtain a full picture of the state of play of the BBI JU, underpinning the reasonable assurance given by the Authorising Officer in his declaration of assurance of the Annual Activity Report.
The main elements supporting such assurance are based on the management assessment of results of key indicators related to the budget execution, the internal control self-assessment, the results of audits from the ECA and of the work performed by the IAS in the course of the reporting year, as well as the reporting from the Head of Administration and Finance, from the Head of Programme, from the Internal Control and Audit Manager and from the Accounting Officer of BBI JU.
All this information positively supports the statements of the declaration of assurance and no significant weaknesses were identified that Call into question the reasonable assurance as to the use of resources for their intended purpose, in accordance with the principles of sound financial management and the fact that the implemented control procedures give the necessary guarantees on the legality and regularity of the underlying transactions.
5.3. Reservations No reservation is made for 2016.
5.4. Overall conclusion In conclusion, management has reasonable assurance that, overall, suitable controls are in place and working as intended; risks are being appropriately monitored and mitigated; and necessary improvements and reinforcements are being implemented. Therefore, the Executive Director, in his capacity as Authorising Officer, has signed the declaration of assurance presented below.
126
6. DECLARATION OF ASSURANCE I, the undersigned, Philippe Mengal, Executive Director of the Bio-Based Industries Joint Undertaking,
In my capacity as authorising officer
Declare that the information contained in this report gives a true and fair view31.
State that I have reasonable assurance that the resources assigned to the activities described in this report have been used for their intended purpose and in accordance with the principles of sound financial management, and that the control procedures put in place give the necessary guarantees concerning the legality and regularity of the underlying transactions.
This reasonable assurance is based on my own judgement and on the information at my disposal, such as the results of the self-assessment, ex-ante controls the work of the Internal Audit Service, and the lessons learnt from the reports of the Court of Auditors for years prior to the year of this declaration.
Confirm that I am not aware of anything not reported here which could harm the interests of the Joint Undertaking.
Place: Brussels Date: 28/02/2017
(signature)
Philippe MENGAL Executive Director
31 True and fair in this context means a reliable, complete and correct view on the state of affairs in
the Joint Undertaking.
127
7. ANNEXES 7.1 Organisational chart
7.2 Staff Establishment plan
7.3 Publications from projects
7.4 Patent from projects
7.5 Scoreboard of Horizon 2020 common KPIs
7.6 Indicators for monitoring cross-cutting issues
7.7 Scoreboard of KPIs specific to BBIJU
7.8 Final annual accounts
7.9 Materiality criteria
7.10 Results of technical review
7.11 List of acronyms
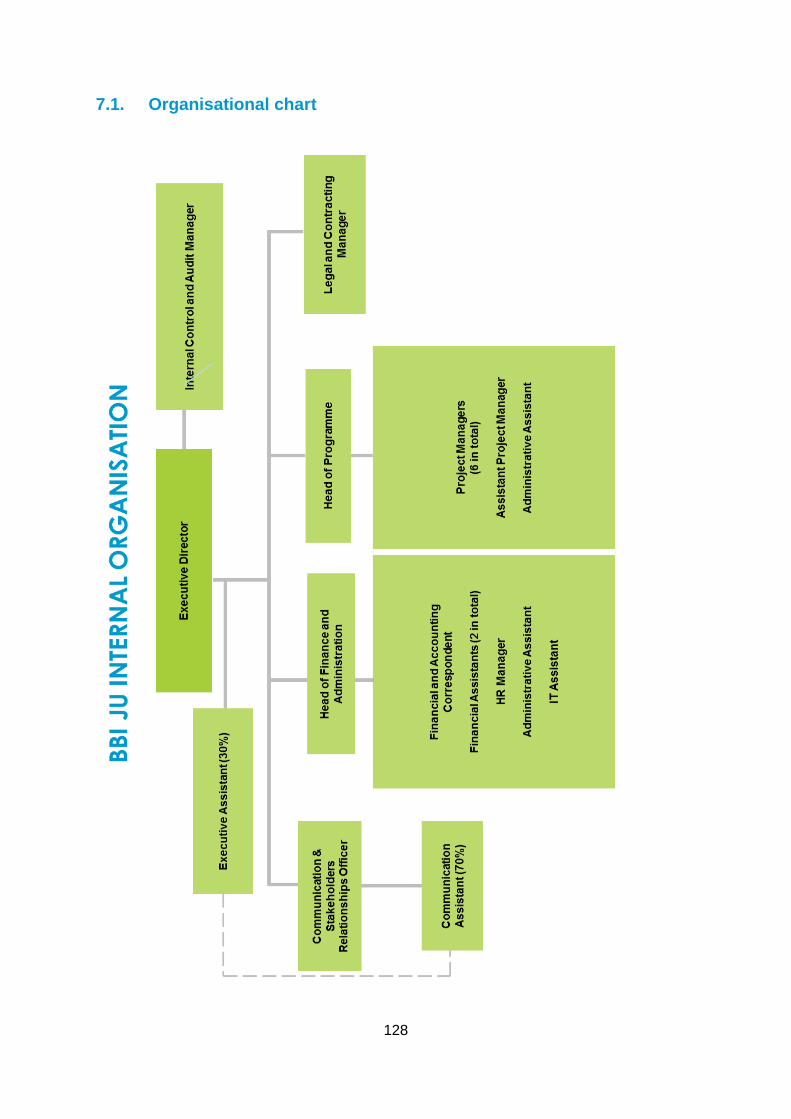
128
7.1. Organisational chart
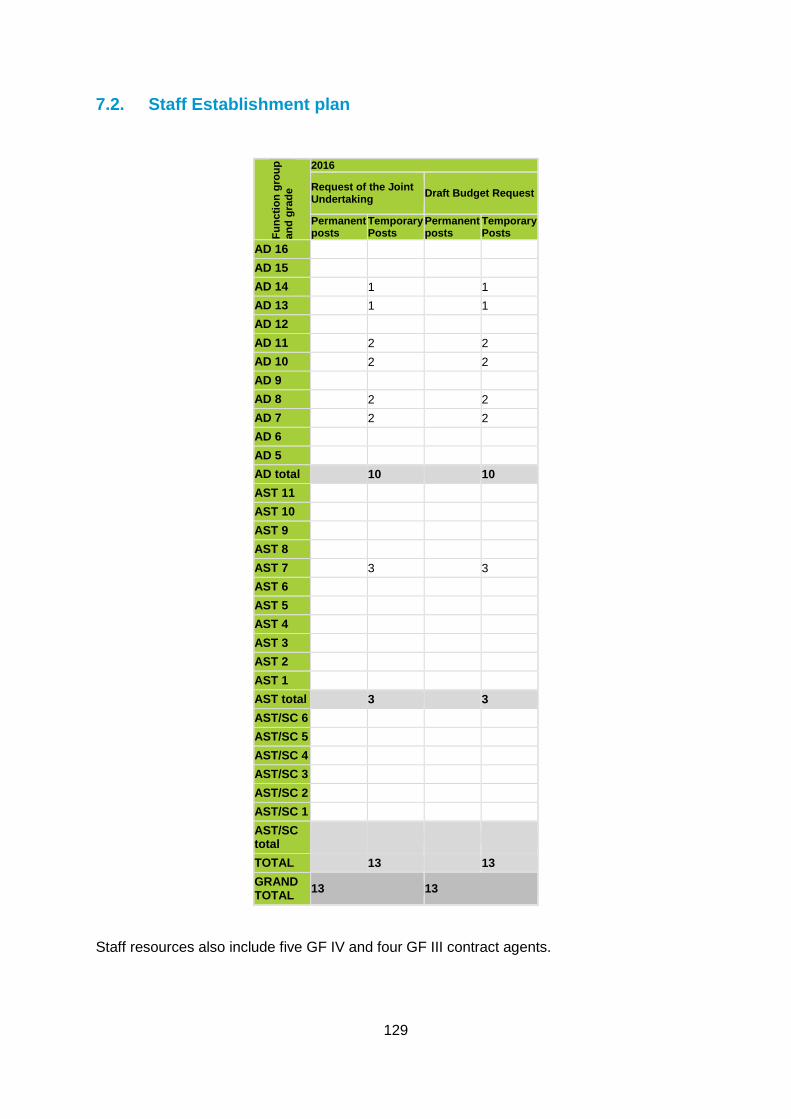
129
7.2. Staff Establishment plan
Func
tion
grou
p an
d gr
ade
2016
Request of the Joint Undertaking Draft Budget Request
Permanent posts
Temporary Posts
Permanent posts
Temporary Posts
AD 16 AD 15 AD 14 1 1 AD 13 1 1 AD 12 AD 11 2 2 AD 10 2 2 AD 9 AD 8 2 2 AD 7 2 2 AD 6 AD 5 AD total 10 10 AST 11 AST 10 AST 9 AST 8 AST 7 3 3 AST 6 AST 5 AST 4 AST 3 AST 2 AST 1 AST total 3 3 AST/SC 6 AST/SC 5 AST/SC 4 AST/SC 3 AST/SC 2 AST/SC 1 AST/SC total
TOTAL 13 13 GRAND TOTAL 13 13
Staff resources also include five GF IV and four GF III contract agents.

130
7.3. Publications from projects Not available yet.

131
7.4. Patent from projects Not available yet.
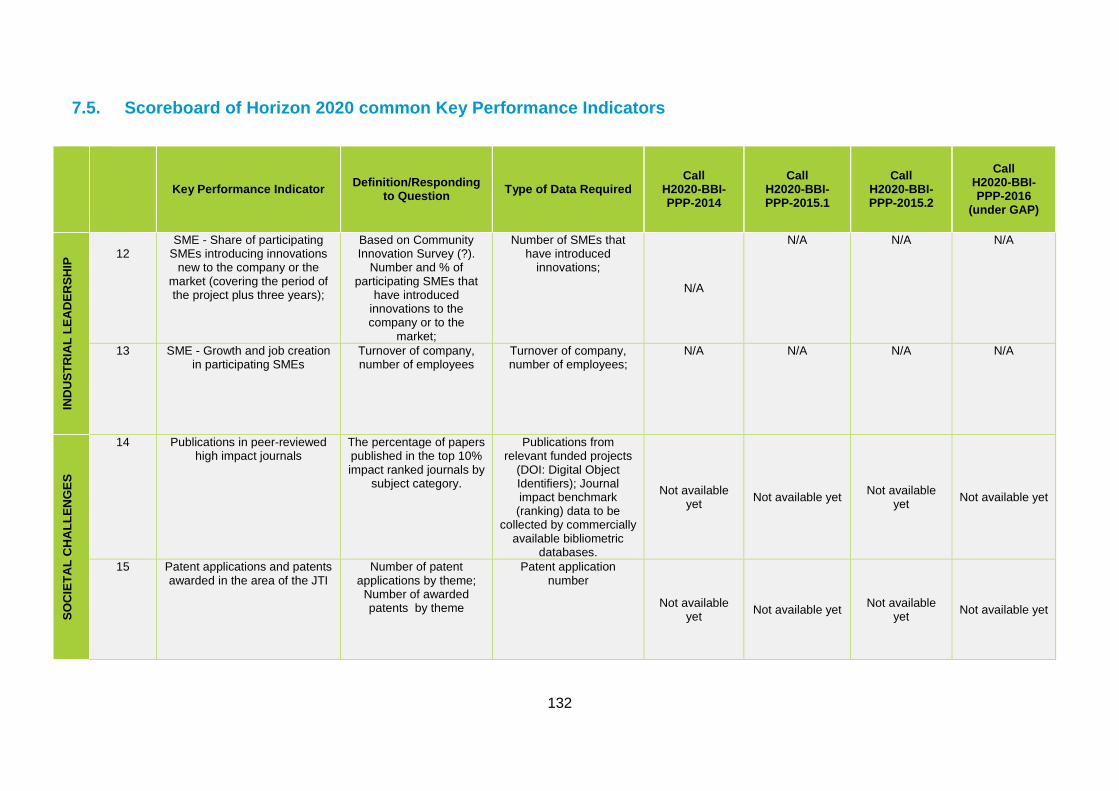
132
7.5. Scoreboard of Horizon 2020 common Key Performance Indicators
Key Performance Indicator Definition/Responding to Question Type of Data Required
Call H2020-BBI-PPP-2014
Call H2020-BBI-PPP-2015.1
Call H2020-BBI-PPP-2015.2
Call H2020-BBI-PPP-2016
(under GAP)
IND
UST
RIA
L LE
AD
ERSH
IP
12
SME - Share of participating SMEs introducing innovations
new to the company or the market (covering the period of the project plus three years);
Based on Community Innovation Survey (?).
Number and % of participating SMEs that
have introduced innovations to the company or to the
market;
Number of SMEs that have introduced
innovations;
N/A
N/A N/A N/A
13 SME - Growth and job creation in participating SMEs
Turnover of company, number of employees
Turnover of company, number of employees;
N/A N/A N/A N/A
SOC
IETA
L C
HA
LLEN
GES
14 Publications in peer-reviewed high impact journals
The percentage of papers published in the top 10% impact ranked journals by
subject category.
Publications from relevant funded projects
(DOI: Digital Object Identifiers); Journal impact benchmark (ranking) data to be
collected by commercially available bibliometric
databases.
Not available yet Not available yet Not available
yet Not available yet
15 Patent applications and patents awarded in the area of the JTI
Number of patent applications by theme;
Number of awarded patents by theme
Patent application number
Not available yet Not available yet Not available
yet Not available yet
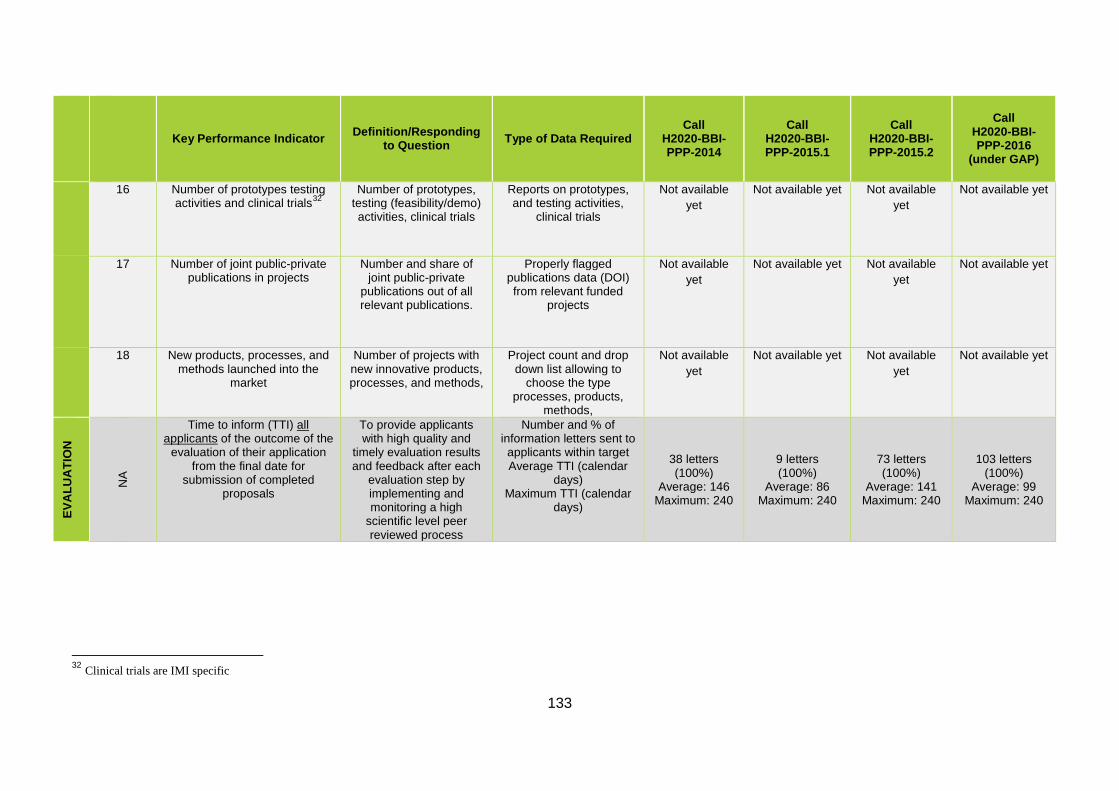
133
Key Performance Indicator Definition/Responding
to Question Type of Data Required Call
H2020-BBI-PPP-2014
Call H2020-BBI-PPP-2015.1
Call H2020-BBI-PPP-2015.2
Call H2020-BBI-PPP-2016
(under GAP)
16 Number of prototypes testing activities and clinical trials32
Number of prototypes, testing (feasibility/demo) activities, clinical trials
Reports on prototypes, and testing activities,
clinical trials
Not available yet
Not available yet Not available yet
Not available yet
17 Number of joint public-private publications in projects
Number and share of joint public-private
publications out of all relevant publications.
Properly flagged publications data (DOI) from relevant funded
projects
Not available yet
Not available yet Not available yet
Not available yet
18 New products, processes, and methods launched into the
market
Number of projects with new innovative products, processes, and methods,
Project count and drop down list allowing to
choose the type processes, products,
methods,
Not available yet
Not available yet Not available yet
Not available yet
EVA
LUA
TIO
N
NA
Time to inform (TTI) all applicants of the outcome of the
evaluation of their application from the final date for
submission of completed proposals
To provide applicants with high quality and
timely evaluation results and feedback after each
evaluation step by implementing and monitoring a high
scientific level peer reviewed process
Number and % of information letters sent to applicants within target Average TTI (calendar
days) Maximum TTI (calendar
days)
38 letters (100%)
Average: 146 Maximum: 240
9 letters (100%)
Average: 86 Maximum: 240
73 letters (100%)
Average: 141 Maximum: 240
103 letters (100%)
Average: 99 Maximum: 240
32 Clinical trials are IMI specific
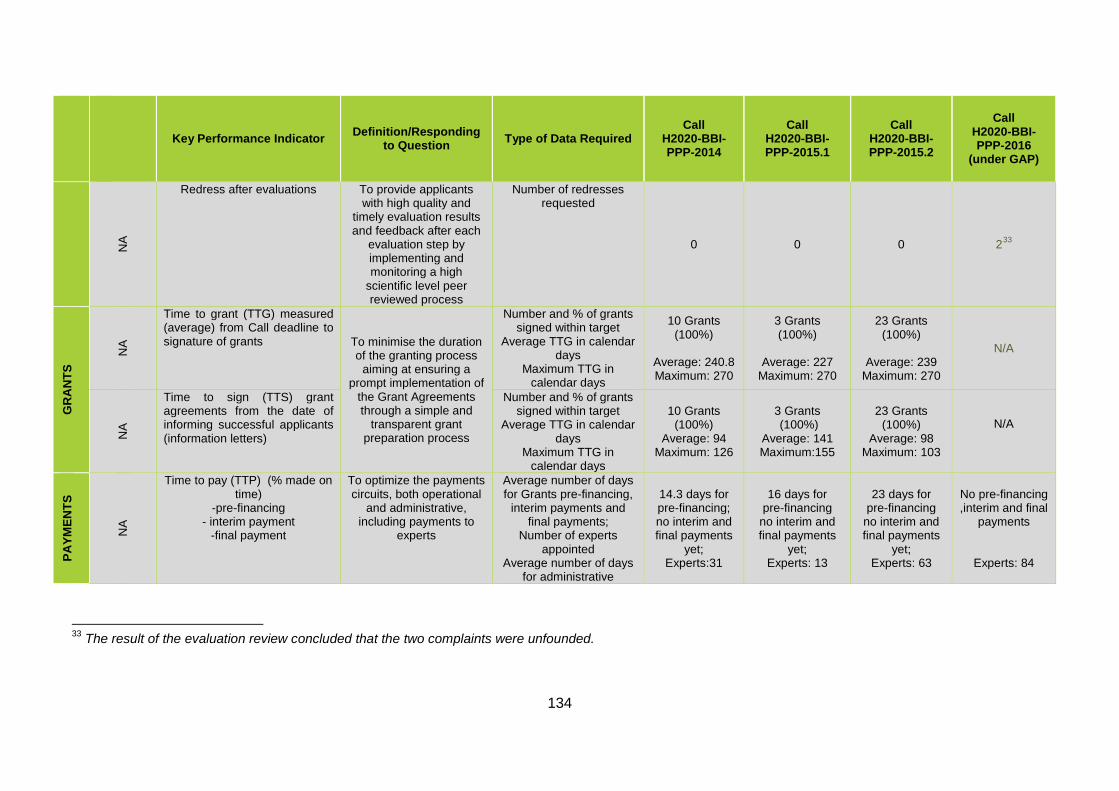
134
Key Performance Indicator Definition/Responding
to Question Type of Data Required Call
H2020-BBI-PPP-2014
Call H2020-BBI-PPP-2015.1
Call H2020-BBI-PPP-2015.2
Call H2020-BBI-PPP-2016
(under GAP)
NA
Redress after evaluations To provide applicants with high quality and
timely evaluation results and feedback after each
evaluation step by implementing and monitoring a high
scientific level peer reviewed process
Number of redresses requested
0 0 0 233
GR
AN
TS N
A
Time to grant (TTG) measured (average) from Call deadline to signature of grants To minimise the duration
of the granting process aiming at ensuring a
prompt implementation of the Grant Agreements through a simple and
transparent grant preparation process
Number and % of grants signed within target
Average TTG in calendar days
Maximum TTG in calendar days
10 Grants (100%)
Average: 240.8 Maximum: 270
3 Grants (100%)
Average: 227
Maximum: 270
23 Grants (100%)
Average: 239
Maximum: 270
N/A
NA
Time to sign (TTS) grant agreements from the date of informing successful applicants (information letters)
Number and % of grants signed within target
Average TTG in calendar days
Maximum TTG in calendar days
10 Grants (100%)
Average: 94 Maximum: 126
3 Grants (100%)
Average: 141 Maximum:155
23 Grants (100%)
Average: 98 Maximum: 103
N/A
PAYM
ENTS
NA
Time to pay (TTP) (% made on time)
-pre-financing - interim payment
-final payment
To optimize the payments circuits, both operational
and administrative, including payments to
experts
Average number of days for Grants pre-financing,
interim payments and final payments;
Number of experts appointed
Average number of days for administrative
14.3 days for pre-financing; no interim and final payments
yet; Experts:31
16 days for pre-financing
no interim and final payments
yet; Experts: 13
23 days for pre-financing
no interim and final payments
yet; Experts: 63
No pre-financing ,interim and final
payments
Experts: 84
33 The result of the evaluation review concluded that the two complaints were unfounded.
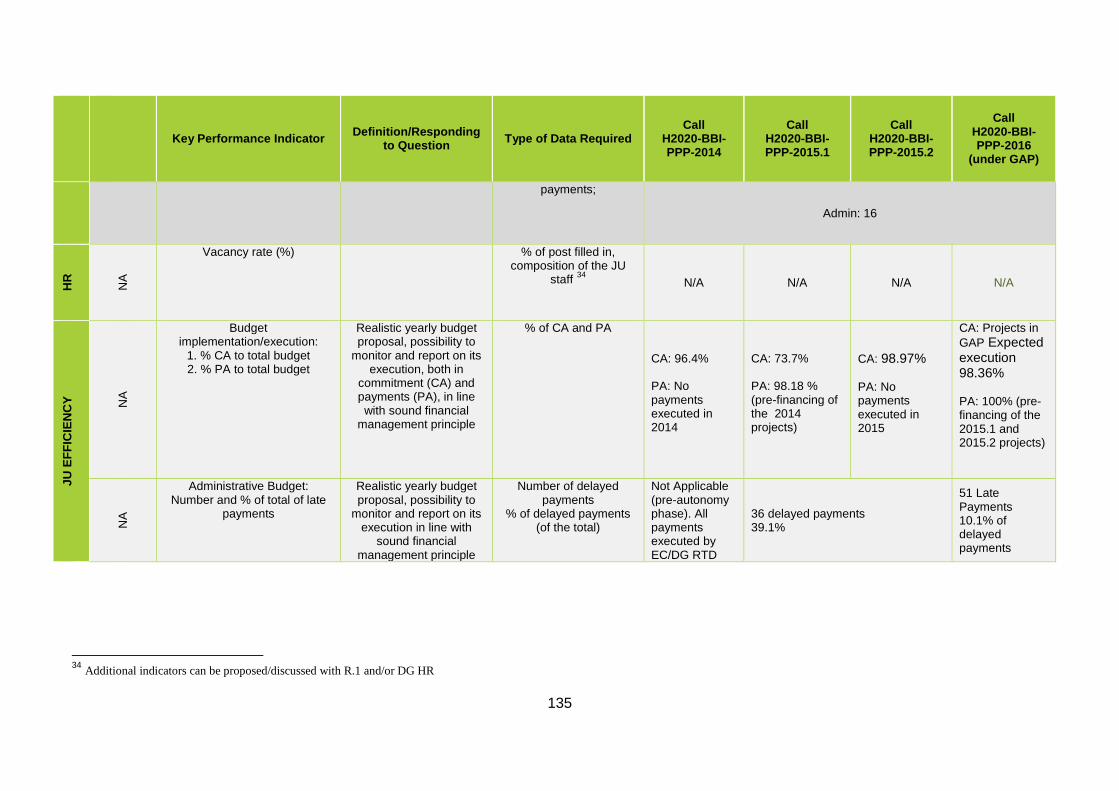
135
Key Performance Indicator Definition/Responding
to Question Type of Data Required Call
H2020-BBI-PPP-2014
Call H2020-BBI-PPP-2015.1
Call H2020-BBI-PPP-2015.2
Call H2020-BBI-PPP-2016
(under GAP)
payments;
Admin: 16
HR
NA
Vacancy rate (%) % of post filled in, composition of the JU
staff 34 N/A N/A N/A N/A
JU E
FFIC
IEN
CY NA
Budget implementation/execution:
1. % CA to total budget 2. % PA to total budget
Realistic yearly budget proposal, possibility to
monitor and report on its execution, both in
commitment (CA) and payments (PA), in line with sound financial
management principle
% of CA and PA
CA: 96.4% PA: No payments executed in 2014
CA: 73.7% PA: 98.18 % (pre-financing of the 2014 projects)
CA: 98.97% PA: No payments executed in 2015
CA: Projects in GAP Expected execution 98.36% PA: 100% (pre-financing of the 2015.1 and 2015.2 projects)
NA
Administrative Budget: Number and % of total of late
payments
Realistic yearly budget proposal, possibility to
monitor and report on its execution in line with
sound financial management principle
Number of delayed payments
% of delayed payments (of the total)
Not Applicable (pre-autonomy phase). All payments executed by EC/DG RTD
36 delayed payments 39.1%
51 Late Payments 10.1% of delayed payments
34 Additional indicators can be proposed/discussed with R.1 and/or DG HR
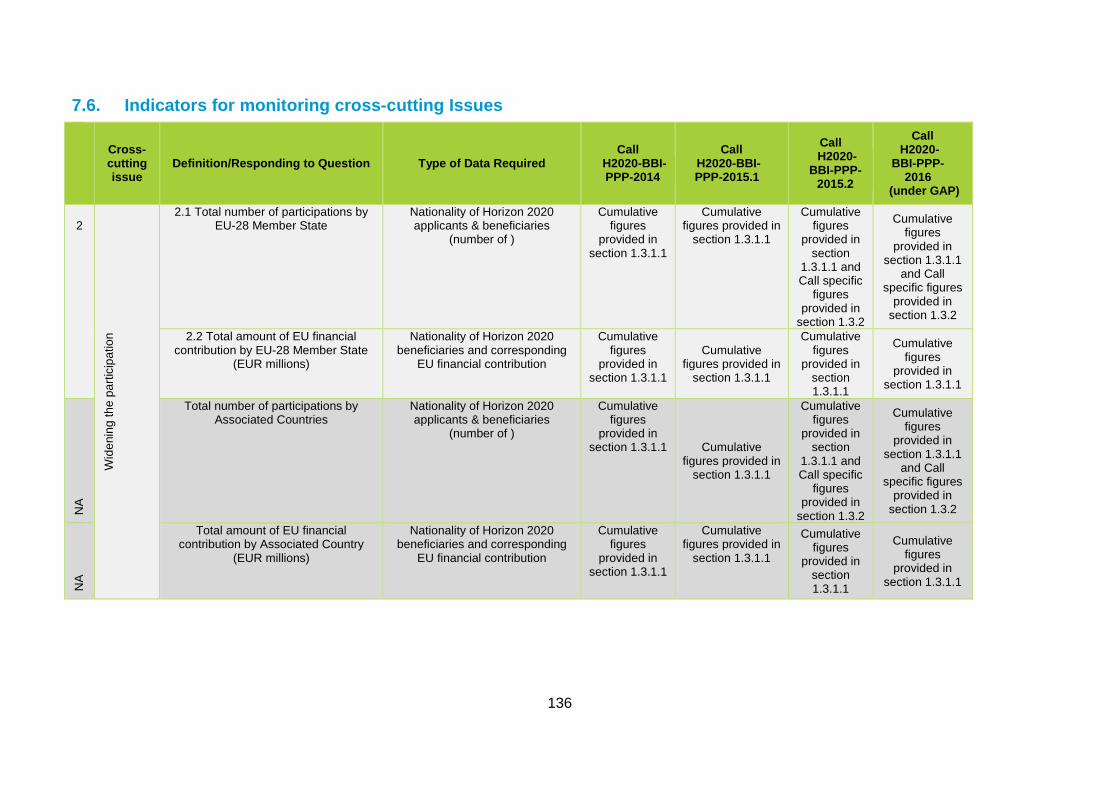
136
7.6. Indicators for monitoring cross-cutting Issues
Cross-cutting issue
Definition/Responding to Question Type of Data Required Call
H2020-BBI-PPP-2014
Call H2020-BBI-PPP-2015.1
Call H2020-
BBI-PPP-2015.2
Call H2020-
BBI-PPP-2016
(under GAP)
2
Wid
enin
g th
e pa
rtici
patio
n
2.1 Total number of participations by EU-28 Member State
Nationality of Horizon 2020 applicants & beneficiaries
(number of )
Cumulative figures
provided in section 1.3.1.1
Cumulative figures provided in
section 1.3.1.1
Cumulative figures
provided in section
1.3.1.1 and Call specific
figures provided in
section 1.3.2
Cumulative figures
provided in section 1.3.1.1
and Call specific figures
provided in section 1.3.2
2.2 Total amount of EU financial contribution by EU-28 Member State
(EUR millions)
Nationality of Horizon 2020 beneficiaries and corresponding
EU financial contribution
Cumulative figures
provided in section 1.3.1.1
Cumulative figures provided in
section 1.3.1.1
Cumulative figures
provided in section 1.3.1.1
Cumulative figures
provided in section 1.3.1.1
NA
Total number of participations by Associated Countries
Nationality of Horizon 2020 applicants & beneficiaries
(number of )
Cumulative figures
provided in section 1.3.1.1 Cumulative
figures provided in section 1.3.1.1
Cumulative figures
provided in section
1.3.1.1 and Call specific
figures provided in
section 1.3.2
Cumulative figures
provided in section 1.3.1.1
and Call specific figures
provided in section 1.3.2
NA
Total amount of EU financial contribution by Associated Country
(EUR millions)
Nationality of Horizon 2020 beneficiaries and corresponding
EU financial contribution
Cumulative figures
provided in section 1.3.1.1
Cumulative figures provided in
section 1.3.1.1
Cumulative figures
provided in section 1.3.1.1
Cumulative figures
provided in section 1.3.1.1
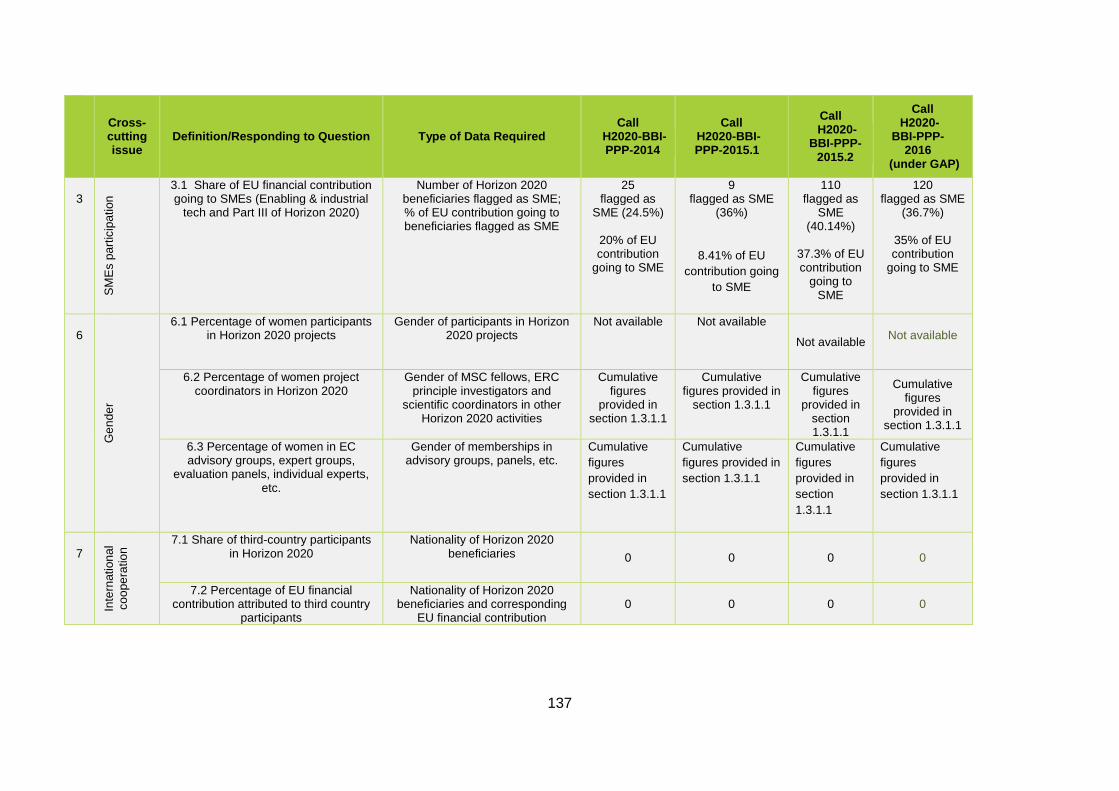
137
Cross-cutting issue
Definition/Responding to Question Type of Data Required Call
H2020-BBI-PPP-2014
Call H2020-BBI-PPP-2015.1
Call H2020-
BBI-PPP-2015.2
Call H2020-
BBI-PPP-2016
(under GAP)
3
SM
Es
parti
cipa
tion
3.1 Share of EU financial contribution going to SMEs (Enabling & industrial
tech and Part III of Horizon 2020)
Number of Horizon 2020 beneficiaries flagged as SME; % of EU contribution going to beneficiaries flagged as SME
25 flagged as
SME (24.5%)
20% of EU contribution
going to SME
9 flagged as SME
(36%)
8.41% of EU contribution going
to SME
110 flagged as
SME (40.14%)
37.3% of EU contribution
going to SME
120 flagged as SME
(36.7%)
35% of EU contribution
going to SME
6
Gen
der
6.1 Percentage of women participants in Horizon 2020 projects
Gender of participants in Horizon 2020 projects
Not available Not available
Not available Not available
6.2 Percentage of women project coordinators in Horizon 2020
Gender of MSC fellows, ERC principle investigators and
scientific coordinators in other Horizon 2020 activities
Cumulative figures
provided in section 1.3.1.1
Cumulative figures provided in
section 1.3.1.1
Cumulative figures
provided in section 1.3.1.1
Cumulative figures
provided in section 1.3.1.1
6.3 Percentage of women in EC advisory groups, expert groups,
evaluation panels, individual experts, etc.
Gender of memberships in advisory groups, panels, etc.
Cumulative figures provided in section 1.3.1.1
Cumulative figures provided in section 1.3.1.1
Cumulative figures provided in section 1.3.1.1
Cumulative figures provided in section 1.3.1.1
7
Inte
rnat
iona
l co
oper
atio
n
7.1 Share of third-country participants in Horizon 2020
Nationality of Horizon 2020 beneficiaries 0 0 0 0
7.2 Percentage of EU financial contribution attributed to third country
participants
Nationality of Horizon 2020 beneficiaries and corresponding
EU financial contribution 0 0 0 0
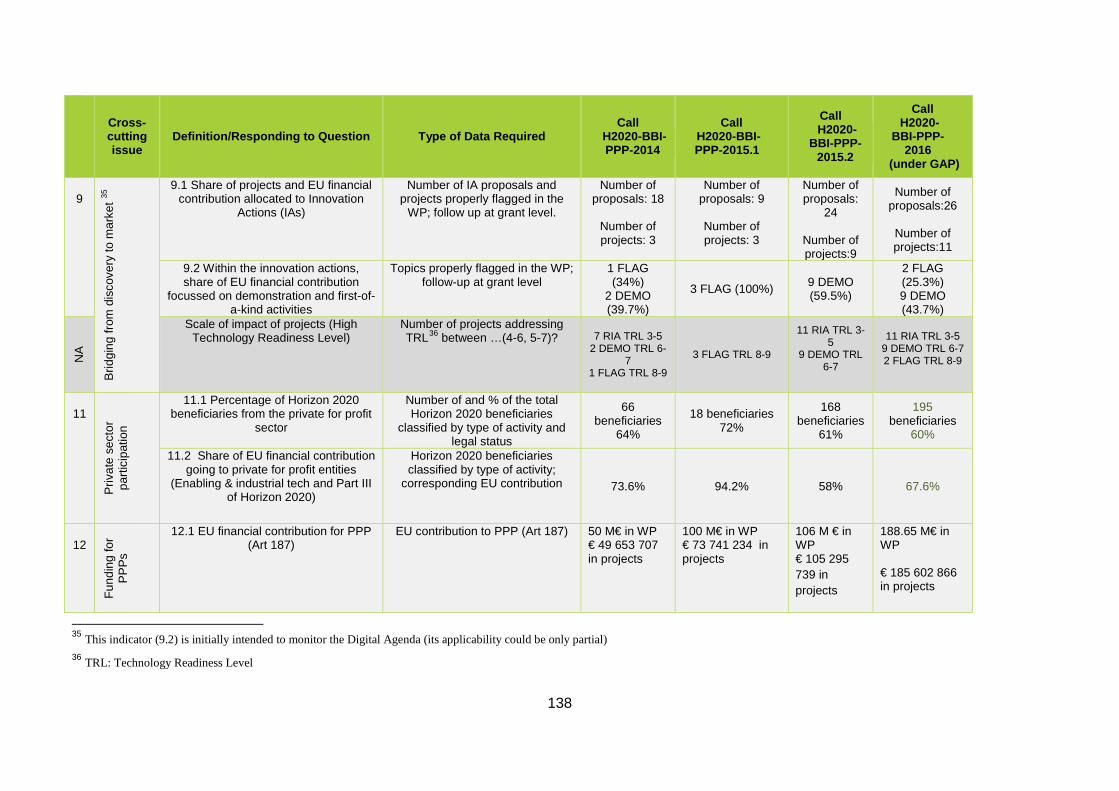
138
Cross-cutting issue
Definition/Responding to Question Type of Data Required Call
H2020-BBI-PPP-2014
Call H2020-BBI-PPP-2015.1
Call H2020-
BBI-PPP-2015.2
Call H2020-
BBI-PPP-2016
(under GAP)
9
Brid
ging
from
dis
cove
ry to
mar
ket 35
9.1 Share of projects and EU financial contribution allocated to Innovation
Actions (IAs)
Number of IA proposals and projects properly flagged in the
WP; follow up at grant level.
Number of proposals: 18
Number of projects: 3
Number of proposals: 9
Number of projects: 3
Number of proposals:
24
Number of projects:9
Number of proposals:26
Number of projects:11
9.2 Within the innovation actions, share of EU financial contribution
focussed on demonstration and first-of-a-kind activities
Topics properly flagged in the WP; follow-up at grant level
1 FLAG (34%)
2 DEMO (39.7%)
3 FLAG (100%) 9 DEMO (59.5%)
2 FLAG (25.3%) 9 DEMO (43.7%)
NA
Scale of impact of projects (High Technology Readiness Level)
Number of projects addressing TRL36 between …(4-6, 5-7)? 7 RIA TRL 3-5
2 DEMO TRL 6-7
1 FLAG TRL 8-9
3 FLAG TRL 8-9
11 RIA TRL 3-5
9 DEMO TRL 6-7
11 RIA TRL 3-5 9 DEMO TRL 6-7 2 FLAG TRL 8-9
11
Priv
ate
sect
or
parti
cipa
tion
11.1 Percentage of Horizon 2020 beneficiaries from the private for profit
sector
Number of and % of the total Horizon 2020 beneficiaries
classified by type of activity and legal status
66 beneficiaries
64%
18 beneficiaries 72%
168 beneficiaries
61%
195 beneficiaries
60%
11.2 Share of EU financial contribution going to private for profit entities
(Enabling & industrial tech and Part III of Horizon 2020)
Horizon 2020 beneficiaries classified by type of activity;
corresponding EU contribution 73.6% 94.2% 58% 67.6%
12
Fund
ing
for
PP
Ps
12.1 EU financial contribution for PPP (Art 187)
EU contribution to PPP (Art 187) 50 M€ in WP € 49 653 707 in projects
100 M€ in WP € 73 741 234 in projects
106 M € in WP € 105 295 739 in projects
188.65 M€ in WP € 185 602 866 in projects
35 This indicator (9.2) is initially intended to monitor the Digital Agenda (its applicability could be only partial) 36 TRL: Technology Readiness Level
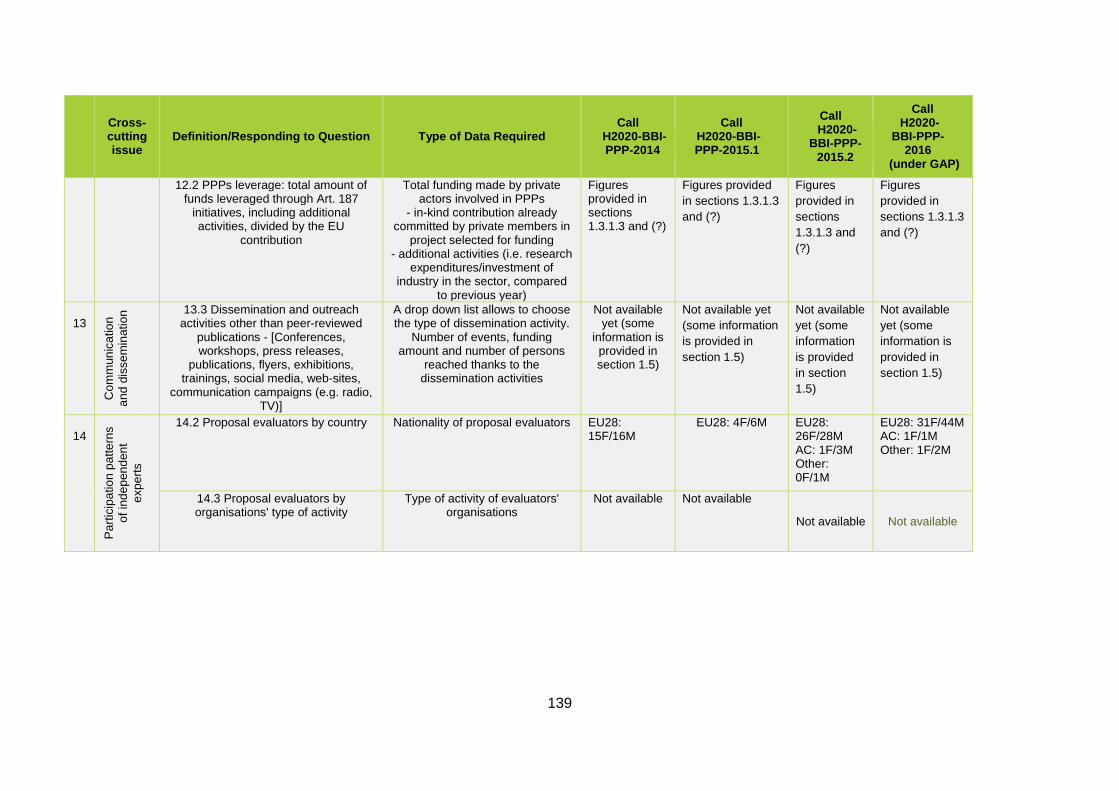
139
Cross-cutting issue
Definition/Responding to Question Type of Data Required Call
H2020-BBI-PPP-2014
Call H2020-BBI-PPP-2015.1
Call H2020-
BBI-PPP-2015.2
Call H2020-
BBI-PPP-2016
(under GAP)
12.2 PPPs leverage: total amount of funds leveraged through Art. 187
initiatives, including additional activities, divided by the EU
contribution
Total funding made by private actors involved in PPPs
- in-kind contribution already committed by private members in
project selected for funding - additional activities (i.e. research
expenditures/investment of industry in the sector, compared
to previous year)
Figures provided in sections 1.3.1.3 and (?)
Figures provided in sections 1.3.1.3 and (?)
Figures provided in sections 1.3.1.3 and (?)
Figures provided in sections 1.3.1.3 and (?)
13
Com
mun
icat
ion
and
diss
emin
atio
n 13.3 Dissemination and outreach activities other than peer-reviewed
publications - [Conferences, workshops, press releases,
publications, flyers, exhibitions, trainings, social media, web-sites,
communication campaigns (e.g. radio, TV)]
A drop down list allows to choose the type of dissemination activity.
Number of events, funding amount and number of persons
reached thanks to the dissemination activities
Not available yet (some
information is provided in section 1.5)
Not available yet (some information is provided in section 1.5)
Not available yet (some information is provided in section 1.5)
Not available yet (some information is provided in section 1.5)
14
Par
ticip
atio
n pa
ttern
s of
inde
pend
ent
expe
rts
14.2 Proposal evaluators by country Nationality of proposal evaluators EU28: 15F/16M
EU28: 4F/6M EU28: 26F/28M AC: 1F/3M Other: 0F/1M
EU28: 31F/44M AC: 1F/1M Other: 1F/2M
14.3 Proposal evaluators by organisations' type of activity
Type of activity of evaluators' organisations
Not available Not available
Not available Not available
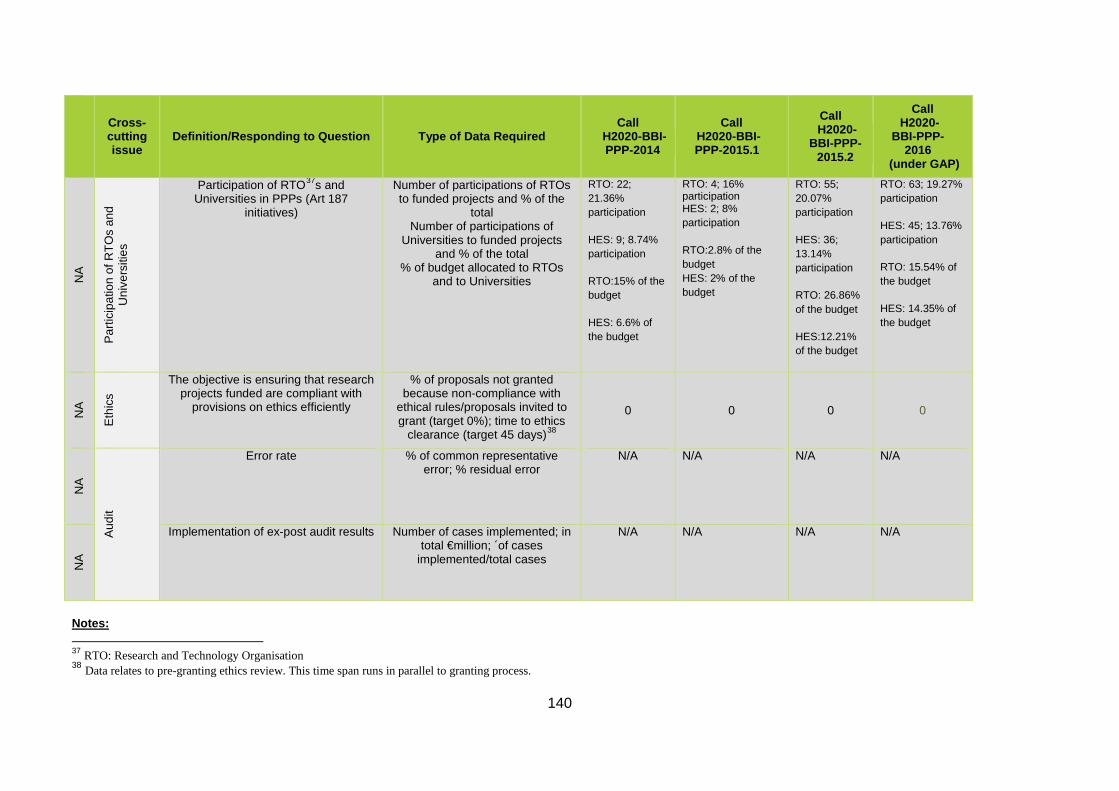
140
Cross-cutting issue
Definition/Responding to Question Type of Data Required Call
H2020-BBI-PPP-2014
Call H2020-BBI-PPP-2015.1
Call H2020-
BBI-PPP-2015.2
Call H2020-
BBI-PPP-2016
(under GAP)
NA
Par
ticip
atio
n of
RTO
s an
d U
nive
rsiti
es
Participation of RTO37s and Universities in PPPs (Art 187
initiatives)
Number of participations of RTOs to funded projects and % of the
total Number of participations of
Universities to funded projects and % of the total
% of budget allocated to RTOs and to Universities
RTO: 22; 21.36% participation
HES: 9; 8.74% participation
RTO:15% of the budget
HES: 6.6% of the budget
RTO: 4; 16% participation HES: 2; 8% participation
RTO:2.8% of the budget HES: 2% of the budget
RTO: 55; 20.07% participation
HES: 36; 13.14% participation
RTO: 26.86% of the budget
HES:12.21% of the budget
RTO: 63; 19.27% participation
HES: 45; 13.76% participation
RTO: 15.54% of the budget
HES: 14.35% of the budget
NA
Eth
ics
The objective is ensuring that research projects funded are compliant with
provisions on ethics efficiently
% of proposals not granted because non-compliance with
ethical rules/proposals invited to grant (target 0%); time to ethics
clearance (target 45 days)38
0 0 0 0
NA
Aud
it
Error rate % of common representative error; % residual error
N/A N/A N/A N/A
NA
Implementation of ex-post audit results Number of cases implemented; in total €million; ´of cases
implemented/total cases
N/A N/A N/A N/A
Notes: 37 RTO: Research and Technology Organisation 38 Data relates to pre-granting ethics review. This time span runs in parallel to granting process.
141
* Horizon 2020 applicants - all those who submitted Horizon 2020 proposals * Horizon 2020 beneficiaries - all those who have signed a Horizon 2020 Grant Agreement *Responsible Directorate - DG RTD Directorates and R&I DGs family in charge with management of Horizon 2020 activities *Services -Executive Agencies and other external bodies in charge with Horizon 2020 activities *Project officer - is in charge of managing Horizon 2020 projects in Responsible Directorate/Service including Executive Agencies
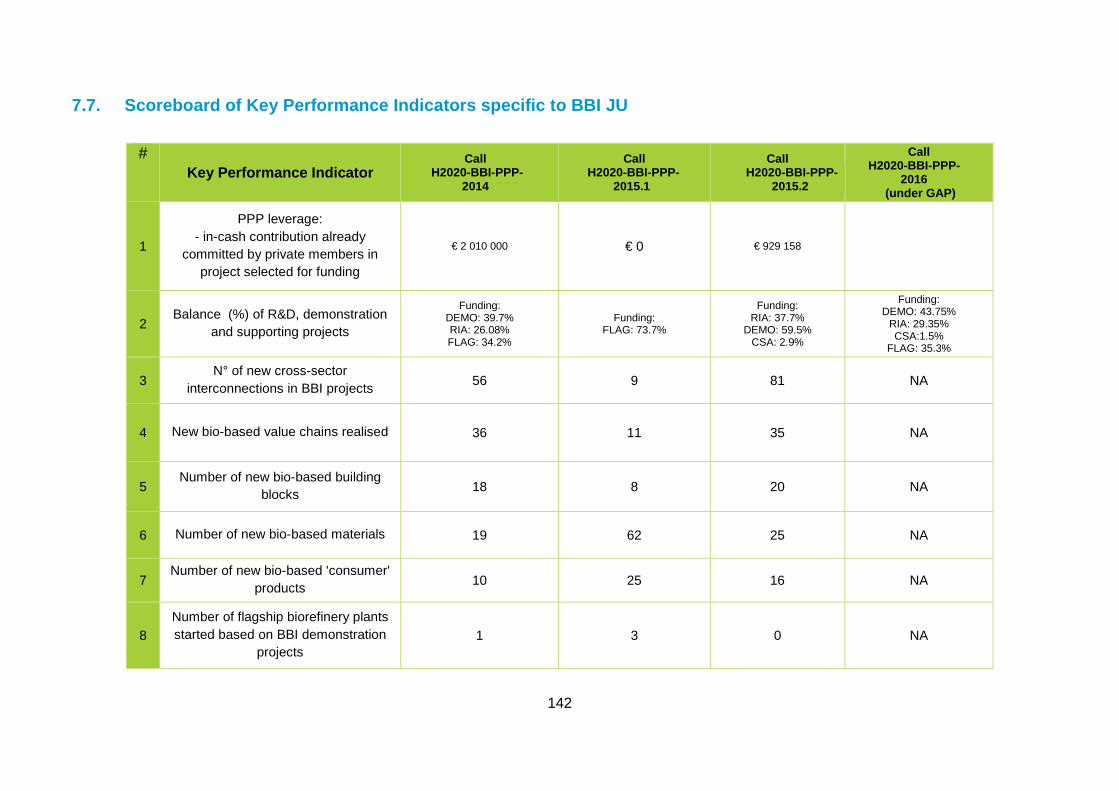
142
7.7. Scoreboard of Key Performance Indicators specific to BBI JU
# Key Performance Indicator
Call H2020-BBI-PPP-
2014
Call H2020-BBI-PPP-
2015.1
Call H2020-BBI-PPP-
2015.2
Call H2020-BBI-PPP-
2016 (under GAP)
1
PPP leverage: - in-cash contribution already
committed by private members in project selected for funding
€ 2 010 000 € 0 € 929 158
2 Balance (%) of R&D, demonstration
and supporting projects
Funding: DEMO: 39.7% RIA: 26.08% FLAG: 34.2%
Funding: FLAG: 73.7%
Funding: RIA: 37.7%
DEMO: 59.5% CSA: 2.9%
Funding: DEMO: 43.75%
RIA: 29.35% CSA:1.5%
FLAG: 35.3%
3 N° of new cross-sector
interconnections in BBI projects 56 9 81 NA
4 New bio-based value chains realised 36 11 35 NA
5 Number of new bio-based building
blocks 18 8 20 NA
6 Number of new bio-based materials 19 62 25 NA
7 Number of new bio-based 'consumer'
products 10 25 16 NA
8 Number of flagship biorefinery plants started based on BBI demonstration
projects 1 3 0 NA
143
7.8. Final annual accounts CERTIFICATION OF THE ACCOUNTS
The final annual accounts of the Bio-based Industries Joint Undertaking for the year 2016 have been prepared in accordance with the Financial Rules of the JU and the accounting rules adopted by the Commission's Accounting Officer, as are to be applied by all the institutions, agencies and joint undertakings.
I acknowledge my responsibility for the preparation and presentation of the annual accounts of the Joint Undertaking in accordance with Article 43 of the Financial Rules of the JU.
I have obtained from the Authorising Officer, who guaranteed its reliability, all the information necessary for the production of the accounts that show the JU's assets and liabilities and the budgetary implementation.
I hereby certify that based on this information, and on such checks as I deemed necessary to sign off the accounts, I have a reasonable assurance that the accounts present a true and fair view of the financial position of the JU in all material aspects.
[signed]
Rosa ALDEA BUSQUETS
Accounting Officer
June 2017
144
Background information on the BBI JU
The Bio-based Industries Joint Undertaking (BBI JU) was established by the Council Regulation (EU) 560/201439. The BBI JU is a public-private partnership between the European Union and the Bio-based Industries Consortium (BIC) and is based in Brussels. BBI JU is funded by the members contributing either in cash or in-kind to the administrative and operational costs of the JU. It aims to bring together all relevant stakeholders and contribute to establishing Europe as a key player in research, demonstration and deployment of advanced bio based products and biofuels.
BBI JU mission is to implement, under Horizon 2020 rules, the Strategic Innovation and Research Agenda (SIRA) developed by the industry, by organizing calls for proposals to support research, demonstration and deployment activities enabling the collaboration between stakeholders along the entire value chains covering primary production of biomass, processing industry and final use.
The objectives of BBI JU are to contribute to a more resource efficient and sustainable low-carbon economy and to increasing economic growth and employment, in particular in rural areas, by developing sustainable and competitive bio-based industries in Europe. This is based on advanced biorefineries that source their biomass sustainably and in particular aims to:
- Demonstrate technologies that enable new chemical building blocks, new materials and new consumer products from European biomass, that replace the need for fossil-based inputs;
- Develop business models that integrate economic actors along the value chain from supply of biomass to biorefinery plants to consumers of bio-based materials, chemicals and fuels, including the creation of new cross-sector interconnections and supporting cross-industry clusters;
- Set-up flagship biorefinery plants that deploy the technologies and business models for bio-based materials, chemicals and fuels and demonstrate cost and performance improvements to levels that are competitive with fossil-based alternatives.
Following Articles 38 and 43 of the BBI JU Financial Rules40, the Governing Board of BBI JU appoints the Accounting Officer who is, amongst other tasks, reponsible for preparation of the annual accounts of the joint undertaking. Following Article 40 of the BBI JU Financial Rules the annual accounts should be prepared in accordance with the accounting rules adopted by the Commission's Accounting Officer (EU Accounting Rules, EAR) that are based on the International Public Sector Accounting Standards (IPSAS). Following the decision of the BBI JU's Governing Board of 14 October 2014, the Accounting Officer of the Commission acts as the Accounting Officer of BBI JU.
39 Council Regulation (EU) No 560/2014 of 6 May 2014 establishing the Bio-based Industries Joint Undertaking. 40 Adopted by the decision of the BBI JU Governing Board.
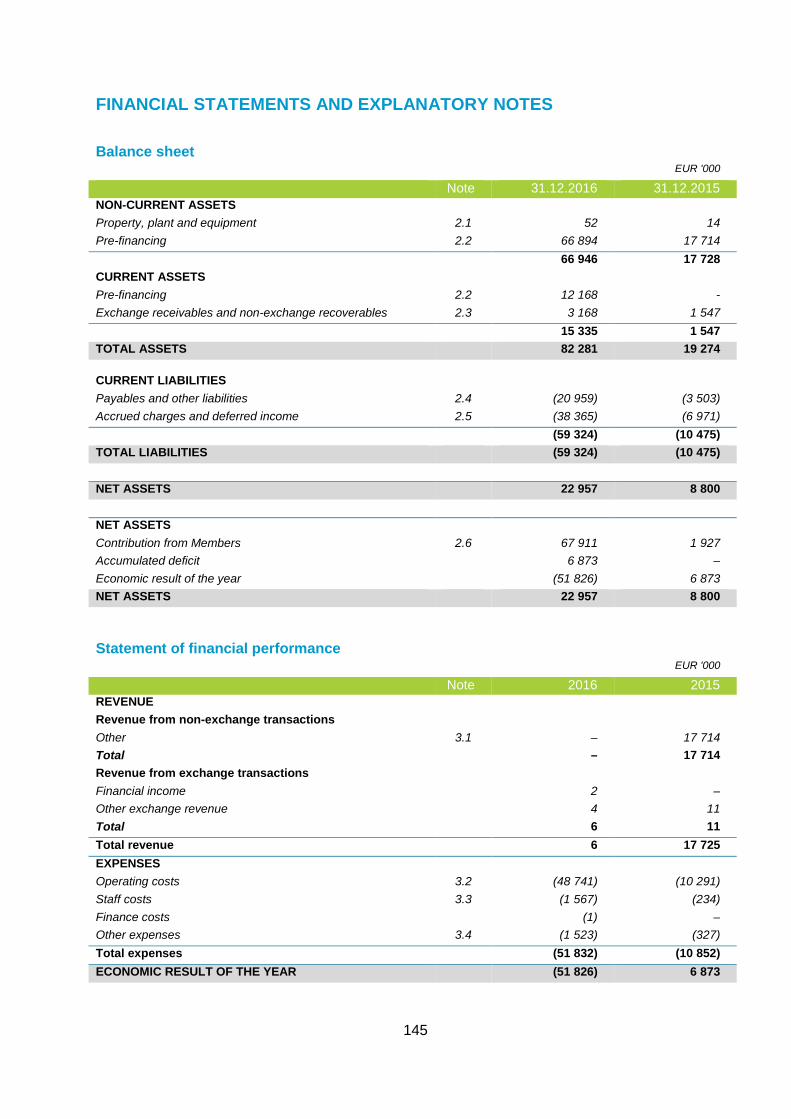
145
FINANCIAL STATEMENTS AND EXPLANATORY NOTES
Balance sheet EUR '000
Note 31.12.2016 31.12.2015 NON-CURRENT ASSETS Property, plant and equipment 2.1 52 14 Pre-financing 2.2 66 894 17 714 66 946 17 728 CURRENT ASSETS Pre-financing 2.2 12 168 - Exchange receivables and non-exchange recoverables 2.3 3 168 1 547 15 335 1 547 TOTAL ASSETS 82 281 19 274 CURRENT LIABILITIES Payables and other liabilities 2.4 (20 959) (3 503) Accrued charges and deferred income 2.5 (38 365) (6 971) (59 324) (10 475) TOTAL LIABILITIES (59 324) (10 475) NET ASSETS 22 957 8 800 NET ASSETS Contribution from Members 2.6 67 911 1 927 Accumulated deficit 6 873 – Economic result of the year (51 826) 6 873 NET ASSETS 22 957 8 800
Statement of financial performance EUR '000
Note 2016 2015 REVENUE Revenue from non-exchange transactions Other 3.1 – 17 714 Total – 17 714 Revenue from exchange transactions Financial income 2 – Other exchange revenue 4 11 Total 6 11 Total revenue 6 17 725 EXPENSES Operating costs 3.2 (48 741) (10 291) Staff costs 3.3 (1 567) (234) Finance costs (1) – Other expenses 3.4 (1 523) (327) Total expenses (51 832) (10 852) ECONOMIC RESULT OF THE YEAR (51 826) 6 873
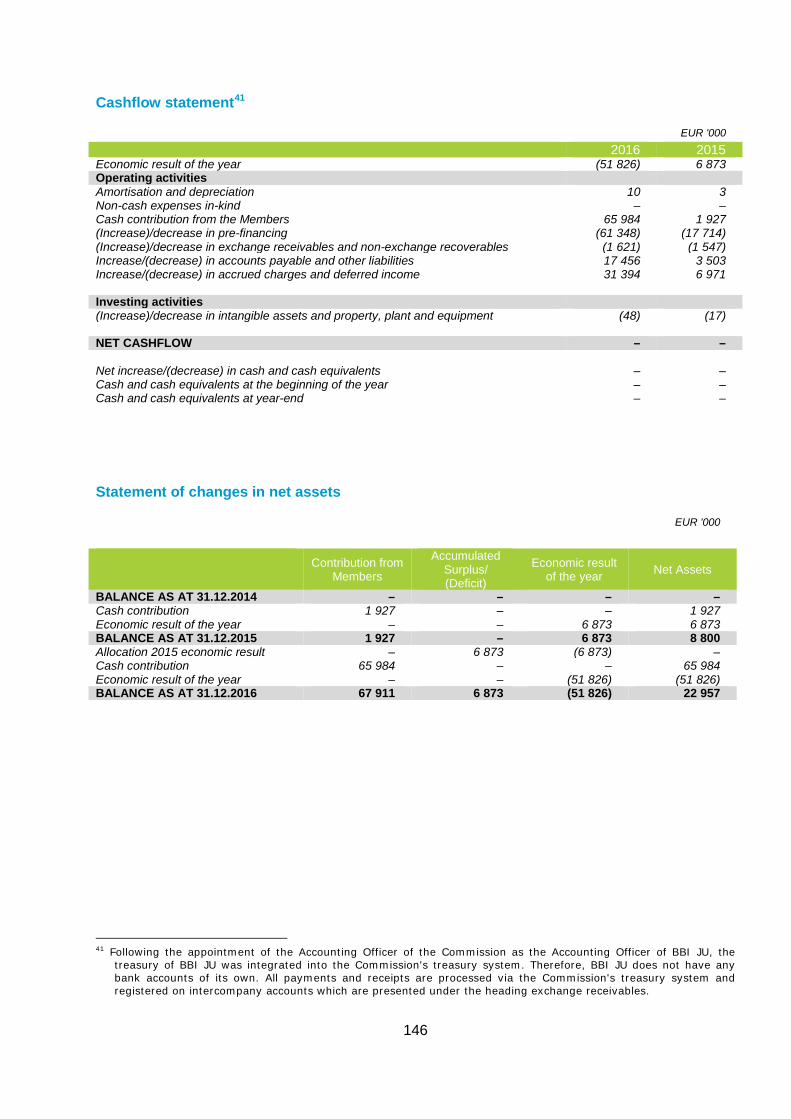
146
Cashflow statement41
EUR '000
2016 2015 Economic result of the year (51 826) 6 873 Operating activities Amortisation and depreciation 10 3 Non-cash expenses in-kind – – Cash contribution from the Members 65 984 1 927 (Increase)/decrease in pre-financing (61 348) (17 714) (Increase)/decrease in exchange receivables and non-exchange recoverables (1 621) (1 547) Increase/(decrease) in accounts payable and other liabilities 17 456 3 503 Increase/(decrease) in accrued charges and deferred income 31 394 6 971 Investing activities (Increase)/decrease in intangible assets and property, plant and equipment (48) (17) NET CASHFLOW – – Net increase/(decrease) in cash and cash equivalents – – Cash and cash equivalents at the beginning of the year – – Cash and cash equivalents at year-end – –
Statement of changes in net assets
EUR '000
Contribution from Members
Accumulated Surplus/ (Deficit)
Economic result of the year Net Assets
BALANCE AS AT 31.12.2014 – – – – Cash contribution 1 927 – – 1 927 Economic result of the year – – 6 873 6 873 BALANCE AS AT 31.12.2015 1 927 – 6 873 8 800 Allocation 2015 economic result – 6 873 (6 873) – Cash contribution 65 984 – – 65 984 Economic result of the year – – (51 826) (51 826) BALANCE AS AT 31.12.2016 67 911 6 873 (51 826) 22 957
41 Following the appointment of the Accounting Officer of the Commission as the Accounting Officer of BBI JU, the
treasury of BBI JU was integrated into the Commission's treasury system. Therefore, BBI JU does not have any bank accounts of its own. All payments and receipts are processed via the Commission's treasury system and registered on intercompany accounts which are presented under the heading exchange receivables.
147
NOTES TO THE FINANCIAL STATEMENTS
1. Significant accounting policies
1.1. Accounting principles
The objective of financial statements is to provide information about financial position, performance and cashflows of an entity that is useful to a wide range of users.
The overall considerations (or accounting principles) to be followed when preparing the financial statements are laid down in EU Accounting Rule 1 'Financial Statements' and are the same as those described in IPSAS 1: fair presentation, accrual basis, going concern, consistency of presentation, materiality, aggregation, offsetting and comparative information. The qualitative characteristics of financial reporting are relevance, reliability, understandability and comparability.
1.2. Basis of preparation
1.2.1. Reporting period
Financial statements are presented annually. The accounting year begins on 1 January and ends on 31 December.
1.2.2. Currency and basis for conversion
The annual accounts are presented in thousands of euros, the euro being the EU's functional and reporting currency. Foreign currency transactions are translated into euros using the exchange rates prevailing at the dates of the transactions. Foreign exchange gains and losses resulting from the settlement of foreign currency transactions and from the re-translation at year-end exchange rates of monetary assets and liabilities denominated in foreign currencies are recognised in the statement of financial performance. Different conversion methods apply to property, plant and equipment and intangible assets, which retain their value in euros at the date when they were purchased.
Year-end balances of monetary assets and liabilities denominated in foreign currencies are translated into euros on the basis of the European Central Bank (ECB) exchange rates applying on 31 December.
Euro exchange rates Currency 31.12.2016 31.12.2015 Currency 31.12.2016 31.12.2015 BGN 1.9558 1.9558 PLN 4.4103 4.2639 CZK 27.0210 27.0230 RON 4.5390 4.5240 DKK 7.4344 7.4626 SEK 9.5525 9.1895 GBP 0.8562 0.7340 CHF 1.0739 1.0835 HRK 7.5597 7.6380 JPY 123.4000 131.0700 HUF 309.8300 315.9800 USD 1.0541 1.0887
1.2.3. Use of estimates
In accordance with IPSAS and generally accepted accounting principles, the financial statements necessarily include amounts based on estimates and assumptions by management based on the most reliable information available. Significant estimates include, but are not limited to; accrued and deferred income and charges, provisions, financial risk on accounts receivables, contingent assets and liabilities, and degree of impairment of assets. Actual results could differ from those estimates.
Reasonable estimates are essential part of the preparation of financial statements and do not undermine their reliability. An estimate may need revision if changes occur in the circumstances on which the estimate was based or as a result of new information or more experience. By its nature, the revision of an estimate does not relate to prior periods and is not
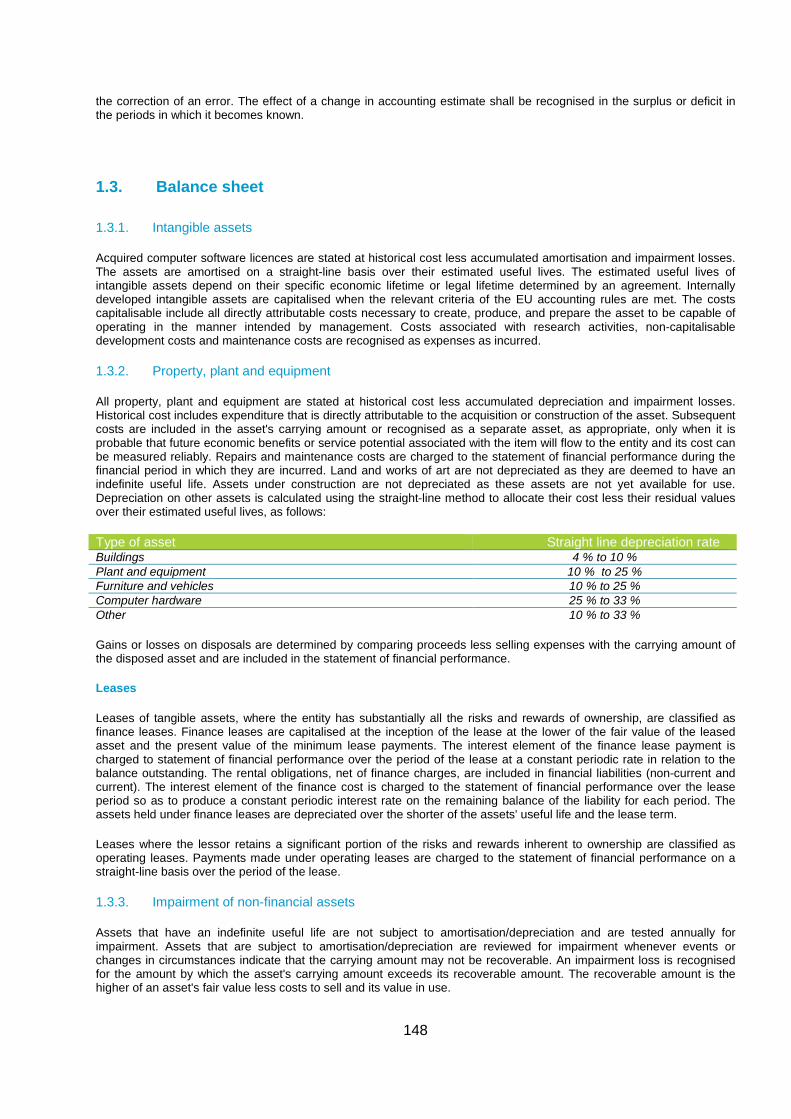
148
the correction of an error. The effect of a change in accounting estimate shall be recognised in the surplus or deficit in the periods in which it becomes known.
1.3. Balance sheet
1.3.1. Intangible assets
Acquired computer software licences are stated at historical cost less accumulated amortisation and impairment losses. The assets are amortised on a straight-line basis over their estimated useful lives. The estimated useful lives of intangible assets depend on their specific economic lifetime or legal lifetime determined by an agreement. Internally developed intangible assets are capitalised when the relevant criteria of the EU accounting rules are met. The costs capitalisable include all directly attributable costs necessary to create, produce, and prepare the asset to be capable of operating in the manner intended by management. Costs associated with research activities, non-capitalisable development costs and maintenance costs are recognised as expenses as incurred.
1.3.2. Property, plant and equipment
All property, plant and equipment are stated at historical cost less accumulated depreciation and impairment losses. Historical cost includes expenditure that is directly attributable to the acquisition or construction of the asset. Subsequent costs are included in the asset's carrying amount or recognised as a separate asset, as appropriate, only when it is probable that future economic benefits or service potential associated with the item will flow to the entity and its cost can be measured reliably. Repairs and maintenance costs are charged to the statement of financial performance during the financial period in which they are incurred. Land and works of art are not depreciated as they are deemed to have an indefinite useful life. Assets under construction are not depreciated as these assets are not yet available for use. Depreciation on other assets is calculated using the straight-line method to allocate their cost less their residual values over their estimated useful lives, as follows:
Type of asset Straight line depreciation rate Buildings 4 % to 10 % Plant and equipment 10 % to 25 % Furniture and vehicles 10 % to 25 % Computer hardware 25 % to 33 % Other 10 % to 33 %
Gains or losses on disposals are determined by comparing proceeds less selling expenses with the carrying amount of the disposed asset and are included in the statement of financial performance.
Leases
Leases of tangible assets, where the entity has substantially all the risks and rewards of ownership, are classified as finance leases. Finance leases are capitalised at the inception of the lease at the lower of the fair value of the leased asset and the present value of the minimum lease payments. The interest element of the finance lease payment is charged to statement of financial performance over the period of the lease at a constant periodic rate in relation to the balance outstanding. The rental obligations, net of finance charges, are included in financial liabilities (non-current and current). The interest element of the finance cost is charged to the statement of financial performance over the lease period so as to produce a constant periodic interest rate on the remaining balance of the liability for each period. The assets held under finance leases are depreciated over the shorter of the assets' useful life and the lease term.
Leases where the lessor retains a significant portion of the risks and rewards inherent to ownership are classified as operating leases. Payments made under operating leases are charged to the statement of financial performance on a straight-line basis over the period of the lease.
1.3.3. Impairment of non-financial assets
Assets that have an indefinite useful life are not subject to amortisation/depreciation and are tested annually for impairment. Assets that are subject to amortisation/depreciation are reviewed for impairment whenever events or changes in circumstances indicate that the carrying amount may not be recoverable. An impairment loss is recognised for the amount by which the asset's carrying amount exceeds its recoverable amount. The recoverable amount is the higher of an asset's fair value less costs to sell and its value in use.
149
Intangible assets and property, plant and equipment residual values and useful lives are reviewed, and adjusted if appropriate, at least once per year. An asset's carrying amount is written down immediately to its recoverable amount if the asset's carrying amount is greater than its estimated recoverable amount. If the reasons for impairments recognised in previous years no longer apply, the impairment losses are reversed accordingly.
1.3.4. Financial assets
The financial assets are classified in the following categories: financial assets at fair value through profit or loss; loans and receivables; held-to-maturity investments; and available for sale financial assets. The classification of the financial instruments is determined at initial recognition and re-evaluated at each balance sheet date.
(i) Financial assets at fair value through profit or loss
A financial asset is classified in this category if acquired principally for the purpose of selling in the short term or if so designated by the entity. Derivatives are also categorised in this category. Assets in this category are classified as current assets if they are expected to be realised within 12 months of the balance sheet date. During this financial year, the entity did not hold any investments in this category.
(ii) Loans and receivables
Loans and receivables are non-derivative financial assets with fixed or determinable payments that are not quoted in an active market. They arise when the entity provides money, goods or services directly to a debtor with no intention of trading the receivable. They are included in non-current assets, except for maturities within 12 months of the balance sheet date. Loans and receivables include term deposits with the original maturity above three months.
(iii) Held-to-maturity investments
Held-to-maturity investments are non-derivative financial assets with fixed or determinable payments and fixed maturities that the entity has the positive intention and ability to hold to maturity. During this financial year, the entity did not hold any investments in this category.
(iv) Available for sale financial assets
Available for sale financial assets are non-derivatives that are either designated in this category or not classified in any of the other categories. They are classified as either current or non-current assets, depending on the period of time the entity expects to hold them, which is usually the maturity date.
Initial recognition and measurement
Purchases and sales of financial assets at fair value through profit and loss, held-to-maturity and available for sale are recognised on trade date - the date on which the entity commits to purchase or sell the asset. Cash equivalents, loans and term deposits are recognised at settlement date. Financial instruments are initially recognised at fair value. For all financial assets not carried at fair value through profit and loss transaction costs are added to the fair value at initial recognition.
Financial instruments are derecognised when the rights to receive cashflows from the investments have expired or the entity has transferred substantially all risks and rewards of ownership to another party.
Subsequent measurement
Financial assets at fair value through profit and loss are subsequently carried at fair value with gains and losses arising changes in the fair value being included in the statement of financial performance in the period in which they arise.
Loans and receivables and held-to maturity investments are carried at amortised cost using the effective interest method.
Available for sale financial assets are subsequently carried at fair value. Gains and losses arising from changes in the fair value being recognised in the fairs value reserve. Interest on available for sale financial assets calculated using the effective interest method is recognised in the statement of financial performance.
The entity assesses at each balance sheet date whether there is objective evidence that a financial asset is impaired and whether an impairment loss should be recorded in the statement of financial performance.
1.3.5. Pre-financing amounts
150
Pre-financing is a payment intended to provide the beneficiary with a cash advance, i.e. a float. It may be split into a number of payments over a period defined in the particular contract, decision, agreement or basic legal act. The float or advance is either used for the purpose for which it was provided during the period defined in the agreement or it is repaid. If the beneficiary does not incur eligible expenditure, he has the obligation to return the pre-financing advance to the entity. The amount of the pre-financing may be reduced (wholly or partially) by the acceptance of eligible costs (which are recognised as expenses).
Pre-financing is, on subsequent balance sheet dates, measured at the amount initially recognised on the balance sheet less eligible expenses (including estimated amounts where necessary) incurred during the period.
1.3.6. Receivables and recoverables
As the EU accounting rules require a separate presentation of exchange and non-exchange transactions, for the purpose of drawing up the accounts, receivables are defined as stemming from non-exchange transactions and recoverables are defined as stemming from exchange transactions (when the entity receives value from another entity without directly giving approximately equal value in exchange).
Receivables from exchange transactions meet the definition of financial instruments and are thus classified as loans and receivables and measured accordingly (see 1.3.4 above).
Recoverables from non-exchange transactions are carried at original amount (adjusted for interests and penalties) less write-down for impairment. A write-down for impairment is established when there is objective evidence that the entity will not be able to collect all amounts due according to the original terms of the recoverables. The amount of the write-down is the difference between the asset's carrying amount and the recoverable amount. The amount of the write-down is recognised in the statement of financial performance.
1.3.7. Cash and cash equivalents
Cash and cash equivalents are financial instruments and classified and include cash at hand, deposits held at call or at short notice with banks, and other short-term highly liquid investments with original maturities of three months or less.
1.3.8. Provisions
Provisions are recognised when the entity has a present legal or constructive obligation towards third parties as a result of past events, it is more likely than not that an outflow of resources will be required to settle the obligation, and the amount can be reliably estimated. Provisions are not recognised for future operating losses. The amount of the provision is the best estimate of the expenditure expected to be required to settle the present obligation at the reporting date. Where the provision involves a large number of items, the obligation is estimated by weighting all possible outcomes by their associated probabilities ('expected value' method).
1.3.9. Payables
Included under accounts payable are both amounts related to exchange transactions such as the purchase of goods and services and non-exchange transactions related e.g. to cost claims from beneficiaries, grants or other EU funding.
Where grants or other funding is provided to the beneficiaries, the cost claims are recorded as payables for the requested amount when the cost claim is received. Upon verification and acceptance of the eligible costs, the payables are valued at the accepted and eligible amount.
Payables arising from the purchase of goods and services are recognised at invoice reception for the original amount and corresponding expenses are entered in the accounts when the supplies or services are delivered and accepted by the entity.
1.3.10. Accrued and deferred income and charges
Transactions and events are recognised in the financial statements in the period to which they relate. At year-end, if an invoice is not yet issued but the service has been rendered, the supplies have been delivered by the entity or a contractual agreement exists (e.g. by reference to a contract), an accrued income will be recognised in the financial statements. In addition, at year-end, if an invoice is issued but the services have not yet been rendered or the goods supplied have not yet been delivered, the revenue will be deferred and recognised in the subsequent accounting period.
Expenses are also accounted for in the period to which they relate. At the end of the accounting period, accrued expenses are recognised based on an estimated amount of the transfer obligation of the period. The calculation of accrued expenses is done in accordance with detailed operational and practical guidelines issued by the Accounting
151
Officer which aim at ensuring that the financial statements provide a faithful representation of the economic and other phenomena they purport to represent. By analogy, if a payment has been made in advance for services or goods that have not yet been received, the expense will be deferred and recognised in the subsequent accounting period.
1.4. Statement of financial performance
1.4.1. Revenue
Revenue comprises gross inflows of economic benefits or service potential received and receivable by the entity, which represents an increase in net assets, other than increases relating to contributions from owners.
Depending on the nature of the underlying transactions in the statement of financial performance it is distinguished between:
(i) Revenue from non-exchange transactions
Revenue from non-exchange transactions are taxes and transfers because the transferor provides resources to the recipient entity without the recipient entity providing approximately equal value directly in exchange.
Transfers are inflows of future economic benefits or service potential from non-exchange transactions, other than taxes. The entity shall recognise an asset in respect of transfers when the entity controls the resources as a result of a past event (the transfer) and expects to receive future economic benefits or service potential from those resources, and when the fair value can be reliably measured. An inflow of resources from a non-exchange transaction recognised as an asset (i.e. cash) is also recognised as revenue, except to the extent that the entity has a present obligation in respect of that transfer (condition), which needs to be satisfied before the revenue can be recognised. Until the condition is met the revenue is deferred and recognised as a liability (pre-financing received).
(ii) Revenue from exchange transactions
Revenue from the sale of goods and services is recognised when the significant risk and rewards of ownership of the goods are transferred to the purchaser. Revenue associated with a transaction involving the provision of services is recognised by reference to the stage of completion of the transaction at the reporting date.
1.4.2. Expenses
Expenses are decreases in economic benefits or service potential during the reporting period in the form of outflows or consumption of assets or incurrence of liabilities that result in decreases in net assets/equity. They include both the expenses from exchange transactions and expenses from non-exchange transactions.
Expenses from exchange transactions arising from the purchase of goods and services are recognised when the supplies are delivered and accepted by the entity. They are valued at original invoice amount. Furthermore, at the balance sheet date expenses related to the service delivered during the period for which an invoice has not yet been received or accepted are recognised in the statement of financial performance.
Expenses from non-exchange transactions account for the majority of the entity's operating expenses. They relate to transfers to beneficiaries and can be of three types: entitlements, transfers under agreement and discretionary grants, contributions and donations. Transfers are recognised as expenses in the period during which the events giving rise to the transfer occurred, as long as the nature of the transfer is allowed by regulation or an agreement has been signed authorising the transfer; any eligibility criteria have been met by the beneficiary; and a reasonable estimate of the amount can be made.
When a request for payment or cost claim is received and meets the recognition criteria, it is recognised as an expense for the eligible amount. At year-end, incurred eligible expenses due to the beneficiaries but not yet reported are estimated and recorded as accrued expense.
152
1.5. Contingent assets and liabilities
1.5.1. Contingent assets
A contingent asset is a possible asset that arises from past events and of which the existence will be confirmed only by the occurrence or non-occurrence of one or more uncertain future events not wholly within the control of the entity. A contingent asset is disclosed when an inflow of economic benefits or service potential is probable.
1.5.2. Contingent liabilities
A contingent liability is a possible obligation that arises from past events and of which the existence will be confirmed only by the occurrence or non-occurrence of one or more uncertain future events not wholly within the control of the entity; or a present obligation that arises from past events but is not recognised because: it is not probable that an outflow of resources embodying economic benefits or service potential will be required to settle the obligation or, in the rare circumstances where the amount of the obligation cannot be measured with sufficient reliability.
1.6. Contributions from members
The contributions from the Members of the joint undertakings (JU) form the funding of the JU and are treated as contributions from owners. An owner in this context does not mean an owner in the sense of owning shares (no shares are issued) of the JU but rather in the sense of political interest and governance of the JU by exercising the voting rights linked to these contributions.
1.6.1. Financial contributions
Financial contributions are contributions of Members made in cash in order to provide funding of the operational or administrative needs of the JU. The financial contributions are recognised in the net assets in the period in which the right to receive the payment was established.
1.6.2. In-kind contributions
Members other than the EU (i.e. 'Private Members') can also contribute resources other than cash, e.g. laboratory equipment, specialised staff, etc. These in-kind contributions consist of the costs incurred by Private Members in implementing indirect actions.
The Regulation distinguishes between two types of in-kind contributions: (1) In-kind contributions to operational activities (IKOP) and (2) in-kind contributions to additional activities (IKAA).
The IKOP represents in-kind contributions made to the JU linked to its work plan and co-financed by the EU. The IKOP are recognised in the net assets of the JU in the period when the conditions for Members' contributions stipulated by the Regulation were met.
The expenses related to the IKOP incurred in the financial year are recognised in the statement of financial performance. At year-end, incurred IKOP not yet reported are estimated and recorded as other liabilities ('Contributions of Members to be validated').
The IKAA relates to contributions linked to implementing additional activities outside the work plan of the JU that contribute to the objectives of the JU. Because the outflow of resources related to those activities is outside of control of the JU, the contributions are not recognised in the financial statements of the JU.
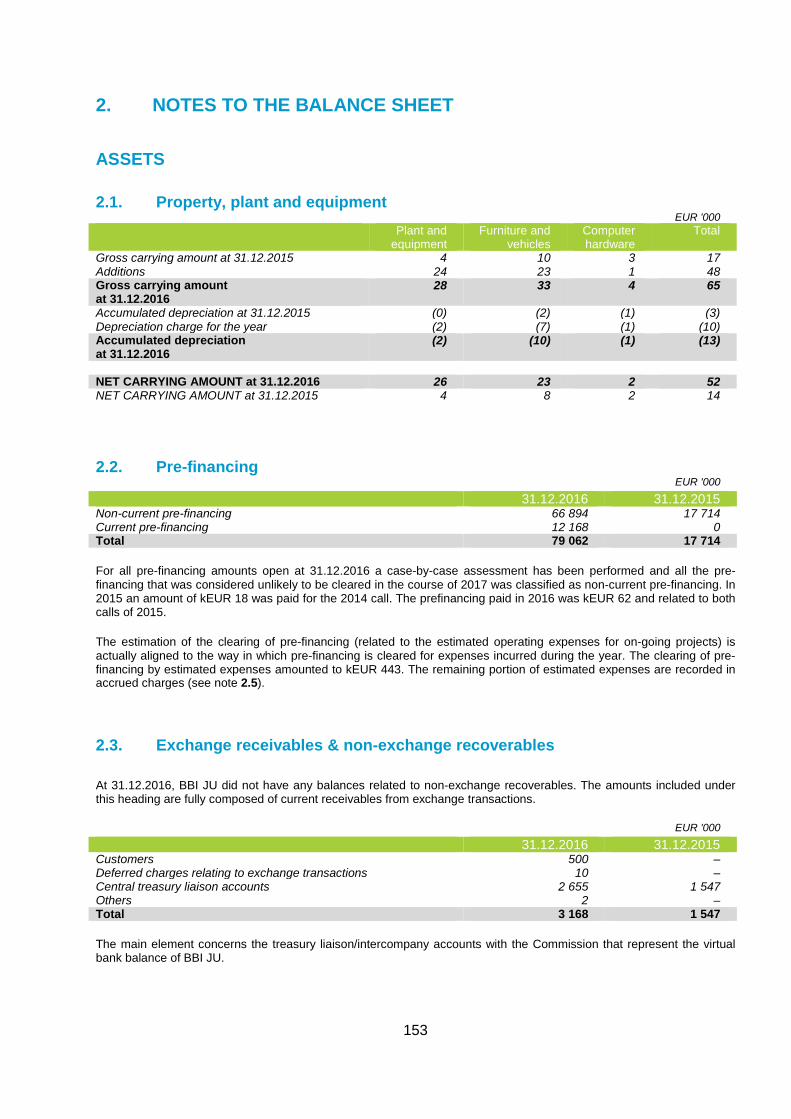
153
2. NOTES TO THE BALANCE SHEET
ASSETS
2.1. Property, plant and equipment EUR '000 Plant and
equipment Furniture and
vehicles Computer hardware
Total
Gross carrying amount at 31.12.2015 4 10 3 17 Additions 24 23 1 48 Gross carrying amount at 31.12.2016
28 33 4 65
Accumulated depreciation at 31.12.2015 (0) (2) (1) (3) Depreciation charge for the year (2) (7) (1) (10) Accumulated depreciation at 31.12.2016
(2) (10) (1) (13)
NET CARRYING AMOUNT at 31.12.2016 26 23 2 52 NET CARRYING AMOUNT at 31.12.2015 4 8 2 14
2.2. Pre-financing EUR '000
31.12.2016 31.12.2015 Non-current pre-financing 66 894 17 714 Current pre-financing 12 168 0 Total 79 062 17 714
For all pre-financing amounts open at 31.12.2016 a case-by-case assessment has been performed and all the pre-financing that was considered unlikely to be cleared in the course of 2017 was classified as non-current pre-financing. In 2015 an amount of kEUR 18 was paid for the 2014 call. The prefinancing paid in 2016 was kEUR 62 and related to both calls of 2015.
The estimation of the clearing of pre-financing (related to the estimated operating expenses for on-going projects) is actually aligned to the way in which pre-financing is cleared for expenses incurred during the year. The clearing of pre-financing by estimated expenses amounted to kEUR 443. The remaining portion of estimated expenses are recorded in accrued charges (see note 2.5).
2.3. Exchange receivables & non-exchange recoverables
At 31.12.2016, BBI JU did not have any balances related to non-exchange recoverables. The amounts included under this heading are fully composed of current receivables from exchange transactions.
EUR '000
31.12.2016 31.12.2015 Customers 500 – Deferred charges relating to exchange transactions 10 – Central treasury liaison accounts 2 655 1 547 Others 2 – Total 3 168 1 547
The main element concerns the treasury liaison/intercompany accounts with the Commission that represent the virtual bank balance of BBI JU.
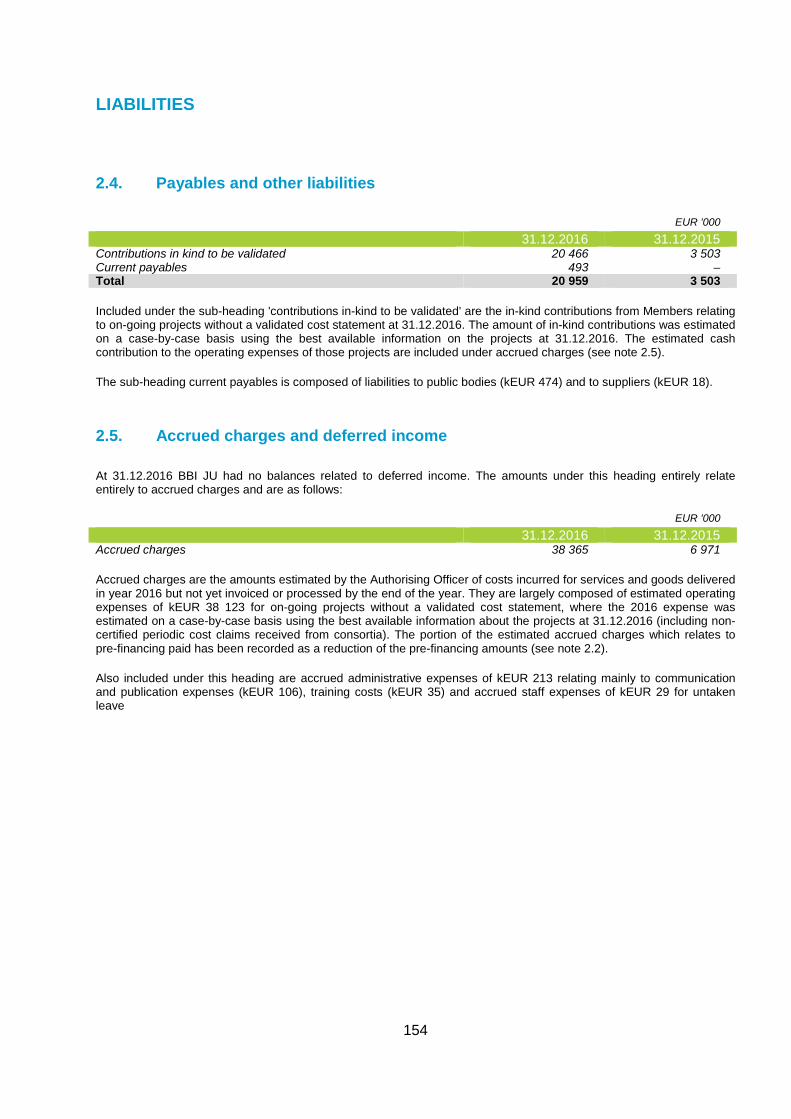
154
LIABILITIES
2.4. Payables and other liabilities
EUR '000
31.12.2016 31.12.2015 Contributions in kind to be validated 20 466 3 503 Current payables 493 – Total 20 959 3 503
Included under the sub-heading 'contributions in-kind to be validated' are the in-kind contributions from Members relating to on-going projects without a validated cost statement at 31.12.2016. The amount of in-kind contributions was estimated on a case-by-case basis using the best available information on the projects at 31.12.2016. The estimated cash contribution to the operating expenses of those projects are included under accrued charges (see note 2.5).
The sub-heading current payables is composed of liabilities to public bodies (kEUR 474) and to suppliers (kEUR 18).
2.5. Accrued charges and deferred income
At 31.12.2016 BBI JU had no balances related to deferred income. The amounts under this heading entirely relate entirely to accrued charges and are as follows:
EUR '000
31.12.2016 31.12.2015 Accrued charges 38 365 6 971
Accrued charges are the amounts estimated by the Authorising Officer of costs incurred for services and goods delivered in year 2016 but not yet invoiced or processed by the end of the year. They are largely composed of estimated operating expenses of kEUR 38 123 for on-going projects without a validated cost statement, where the 2016 expense was estimated on a case-by-case basis using the best available information about the projects at 31.12.2016 (including non-certified periodic cost claims received from consortia). The portion of the estimated accrued charges which relates to pre-financing paid has been recorded as a reduction of the pre-financing amounts (see note 2.2).
Also included under this heading are accrued administrative expenses of kEUR 213 relating mainly to communication and publication expenses (kEUR 106), training costs (kEUR 35) and accrued staff expenses of kEUR 29 for untaken leave
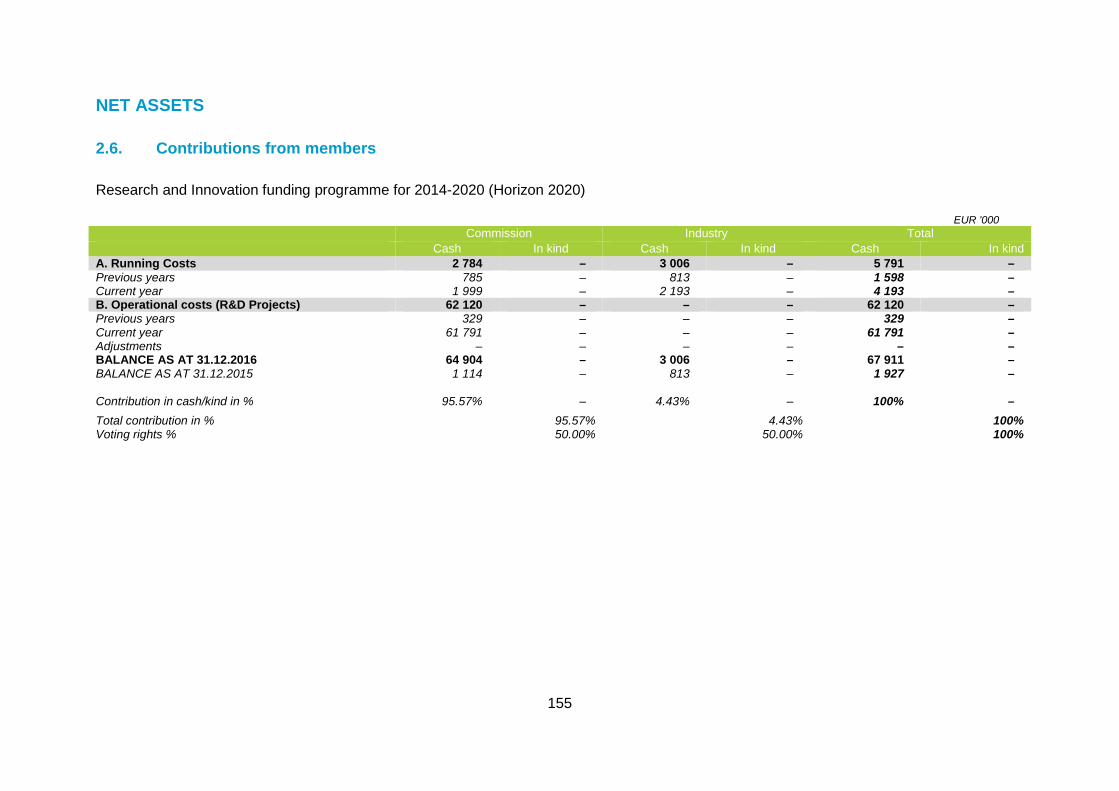
155
NET ASSETS
2.6. Contributions from members
Research and Innovation funding programme for 2014-2020 (Horizon 2020)
EUR '000 Commission Industry Total Cash In kind Cash In kind Cash In kind
A. Running Costs 2 784 – 3 006 – 5 791 – Previous years 785 – 813 – 1 598 – Current year 1 999 – 2 193 – 4 193 – B. Operational costs (R&D Projects) 62 120 – – – 62 120 – Previous years 329 – – – 329 – Current year 61 791 – – – 61 791 – Adjustments – – – – – – BALANCE AS AT 31.12.2016 64 904 – 3 006 – 67 911 – BALANCE AS AT 31.12.2015 1 114 – 813 – 1 927 – Contribution in cash/kind in % 95.57% – 4.43% – 100% – Total contribution in % 95.57% 4.43% 100% Voting rights % 50.00% 50.00% 100%
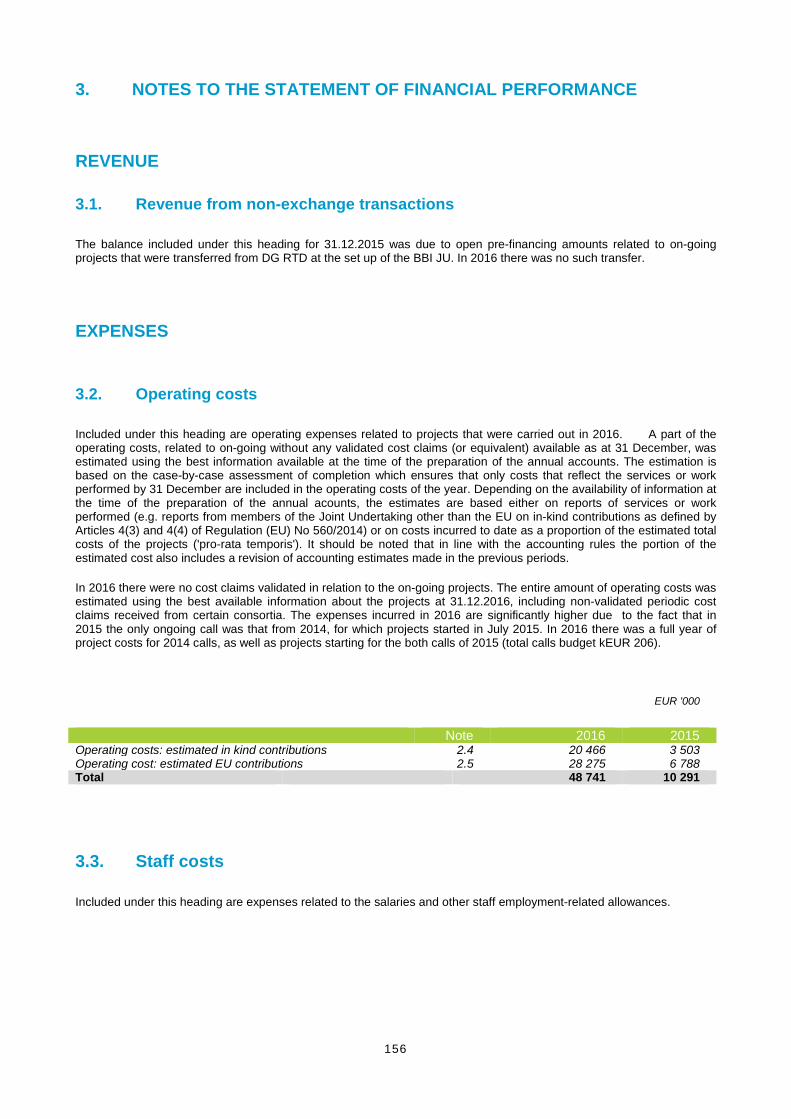
156
3. NOTES TO THE STATEMENT OF FINANCIAL PERFORMANCE
REVENUE
3.1. Revenue from non-exchange transactions
The balance included under this heading for 31.12.2015 was due to open pre-financing amounts related to on-going projects that were transferred from DG RTD at the set up of the BBI JU. In 2016 there was no such transfer.
EXPENSES
3.2. Operating costs
Included under this heading are operating expenses related to projects that were carried out in 2016. A part of the operating costs, related to on-going without any validated cost claims (or equivalent) available as at 31 December, was estimated using the best information available at the time of the preparation of the annual accounts. The estimation is based on the case-by-case assessment of completion which ensures that only costs that reflect the services or work performed by 31 December are included in the operating costs of the year. Depending on the availability of information at the time of the preparation of the annual acounts, the estimates are based either on reports of services or work performed (e.g. reports from members of the Joint Undertaking other than the EU on in-kind contributions as defined by Articles 4(3) and 4(4) of Regulation (EU) No 560/2014) or on costs incurred to date as a proportion of the estimated total costs of the projects ('pro-rata temporis'). It should be noted that in line with the accounting rules the portion of the estimated cost also includes a revision of accounting estimates made in the previous periods.
In 2016 there were no cost claims validated in relation to the on-going projects. The entire amount of operating costs was estimated using the best available information about the projects at 31.12.2016, including non-validated periodic cost claims received from certain consortia. The expenses incurred in 2016 are significantly higher due to the fact that in 2015 the only ongoing call was that from 2014, for which projects started in July 2015. In 2016 there was a full year of project costs for 2014 calls, as well as projects starting for the both calls of 2015 (total calls budget kEUR 206).
EUR '000
Note 2016 2015 Operating costs: estimated in kind contributions 2.4 20 466 3 503 Operating cost: estimated EU contributions 2.5 28 275 6 788 Total 48 741 10 291
3.3. Staff costs
Included under this heading are expenses related to the salaries and other staff employment-related allowances.
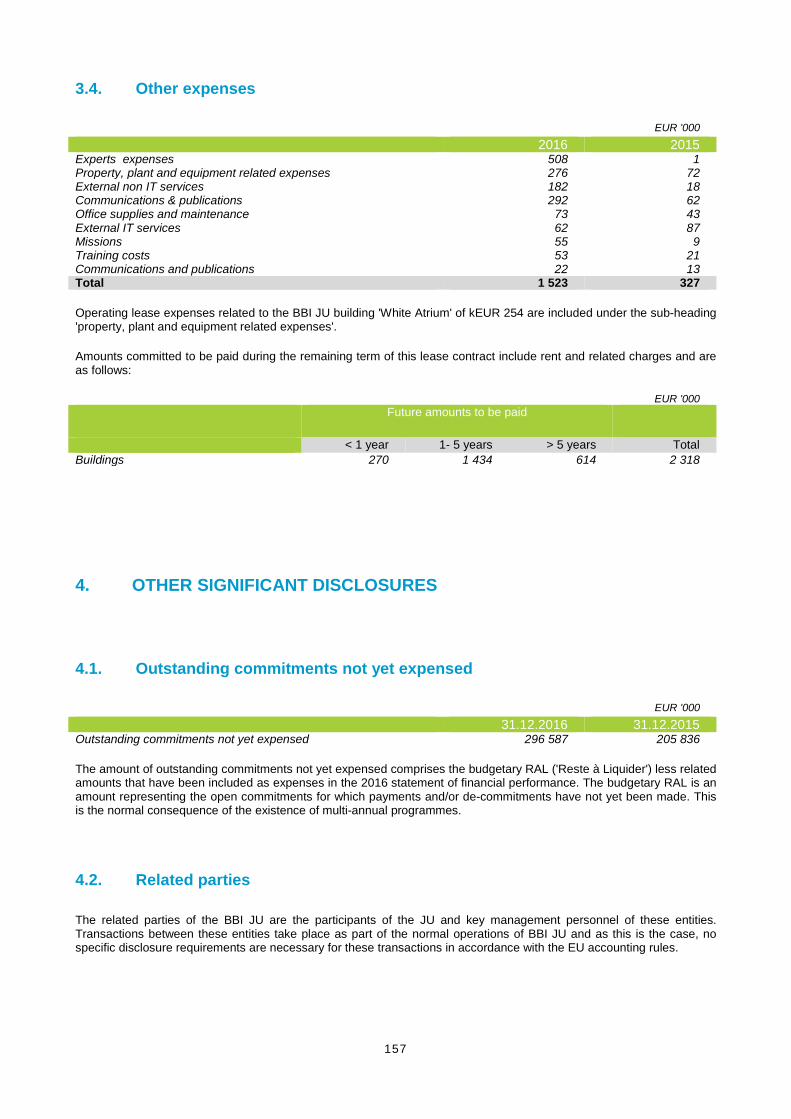
157
3.4. Other expenses
EUR '000
2016 2015 Experts expenses 508 1 Property, plant and equipment related expenses 276 72 External non IT services 182 18 Communications & publications 292 62 Office supplies and maintenance 73 43 External IT services 62 87 Missions 55 9 Training costs 53 21 Communications and publications 22 13 Total 1 523 327
Operating lease expenses related to the BBI JU building 'White Atrium' of kEUR 254 are included under the sub-heading 'property, plant and equipment related expenses'.
Amounts committed to be paid during the remaining term of this lease contract include rent and related charges and are as follows:
EUR '000 Future amounts to be paid
< 1 year 1- 5 years > 5 years Total Buildings 270 1 434 614 2 318
4. OTHER SIGNIFICANT DISCLOSURES
4.1. Outstanding commitments not yet expensed
EUR '000
31.12.2016 31.12.2015 Outstanding commitments not yet expensed 296 587 205 836
The amount of outstanding commitments not yet expensed comprises the budgetary RAL ('Reste à Liquider') less related amounts that have been included as expenses in the 2016 statement of financial performance. The budgetary RAL is an amount representing the open commitments for which payments and/or de-commitments have not yet been made. This is the normal consequence of the existence of multi-annual programmes.
4.2. Related parties
The related parties of the BBI JU are the participants of the JU and key management personnel of these entities. Transactions between these entities take place as part of the normal operations of BBI JU and as this is the case, no specific disclosure requirements are necessary for these transactions in accordance with the EU accounting rules.
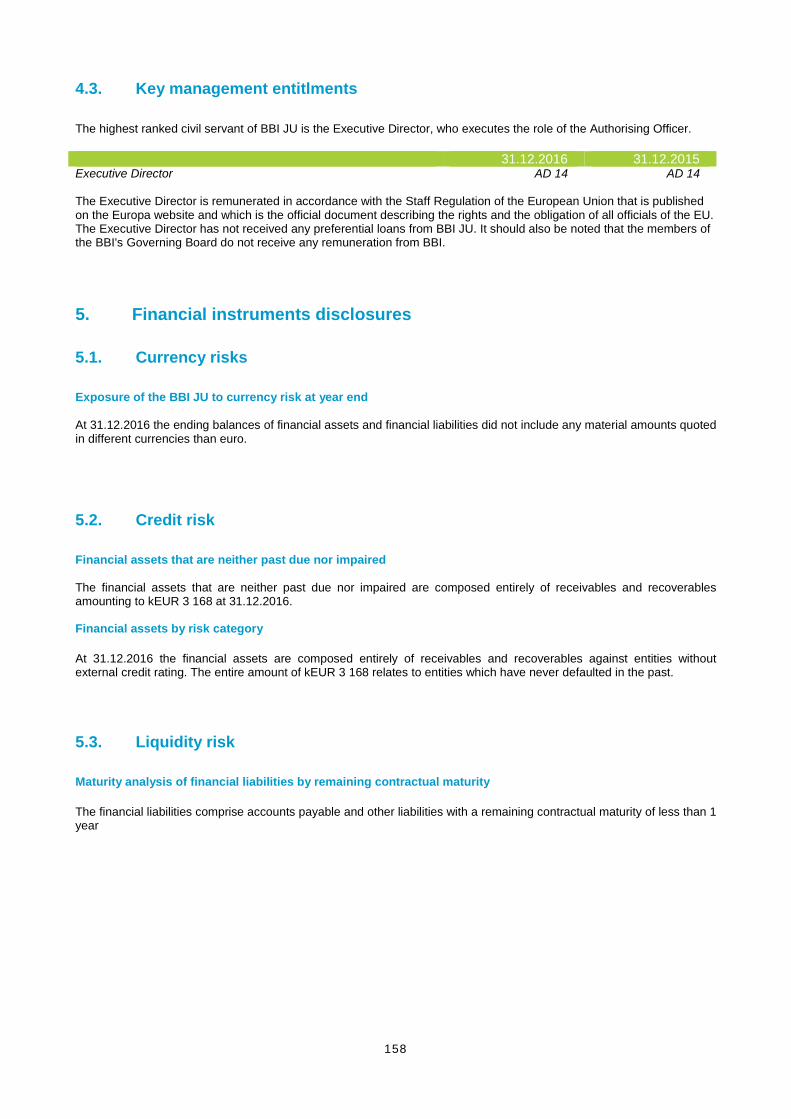
158
4.3. Key management entitlments
The highest ranked civil servant of BBI JU is the Executive Director, who executes the role of the Authorising Officer.
31.12.2016 31.12.2015 Executive Director AD 14 AD 14 The Executive Director is remunerated in accordance with the Staff Regulation of the European Union that is published on the Europa website and which is the official document describing the rights and the obligation of all officials of the EU. The Executive Director has not received any preferential loans from BBI JU. It should also be noted that the members of the BBI's Governing Board do not receive any remuneration from BBI. 5. Financial instruments disclosures
5.1. Currency risks
Exposure of the BBI JU to currency risk at year end At 31.12.2016 the ending balances of financial assets and financial liabilities did not include any material amounts quoted in different currencies than euro.
5.2. Credit risk
Financial assets that are neither past due nor impaired The financial assets that are neither past due nor impaired are composed entirely of receivables and recoverables amounting to kEUR 3 168 at 31.12.2016. Financial assets by risk category
At 31.12.2016 the financial assets are composed entirely of receivables and recoverables against entities without external credit rating. The entire amount of kEUR 3 168 relates to entities which have never defaulted in the past.
5.3. Liquidity risk
Maturity analysis of financial liabilities by remaining contractual maturity
The financial liabilities comprise accounts payable and other liabilities with a remaining contractual maturity of less than 1 year
159
REPORTS ON THE IMPLEMENTATION OF THE BUDGET
It should be noted that due to the rounding of figures into thousands of euros, some financial data in the tables below may appear not to add-up. 1. Budgetary principles, structure and implementation
1.1. Budgetary principles
The establishment and implementation of the budget of BBI JU is governed by the following basic principles set out in Chapter 2 of the Financial Rules of BBI JU:
Principles of unity and budget accuracy
This principle means that no revenue shall be collected and no expenditure effected unless booked to a line in the budget of BBI JU. No expenditure may be committed or authorised in excess of the appropriations authorised by the budget. An appropriation may be entered in the budget only if it is for an item of expenditure considered necessary.
Principle of annuality
The appropriations entered in the budget shall be authorised for a financial year which shall run from 1 January to 31 December. As specified in its Financial Rules, BBI JU is subject to an exception to the annuality principle, specific only to the joint undertakings (the “N+3” rule), whereby any unused appropriations may be entered in the estimate of revenue and expenditure of up to the following three financial years. These appropriations must be used first.
Principle of equilibrium
Revenue and payment appropriations shall be in balance.
Principle of unit of account
The budget shall be drawn up and implemented in euro and the accounts shall be presented in euro.
Principle of universality
Total revenue shall cover total payment appropriations and all revenue and expenditure shall be entered in full without any adjustment against each other.
Principle of specification
Appropriations shall be earmarked for specific purposes at least by title and chapter.
Principle of sound financial management
Appropriations shall be used in accordance with the principle of sound financial management, namely in accordance with the principles of economy, efficiency and effectiveness.
Principle of transparency
The budget shall be established and implemented and the accounts presented in accordance with the principle of transparency. The budget and any amending budgets shall be published on the internet site of the BBI JU within four weeks of their adoption and shall be transmitted to the Commission and the Court of Auditors.
160
1.2. Structure and presentation of the budget
Since 01/01/2015, no distinction between non-dissociated and dissociated appropriations is made. All appropriations follow the dissociated logic.
Following the provisions of the Financial Rules of BBI JU, the budget accounts shall consist of a statement of revenue and a statement of expenditure. The budget is distributed over the following titles:
Title 1 budget lines relate to staff expenditure such as salaries and allowances for personnel working with BBI JU. It also includes recruitment expenses, staff missions, expenses for the socio-medical infrastructure and representation costs.
Title 2 budget lines relate to all infrastructure, equipment and miscellaneous administrative expenditure.
Title 3 budget lines provide for the implementation of the activities and tasks assigned to BBI JU in accordance with its establishing Council Regulation (EC) No 560/2014.
1.3. Highlights of the budgetary implementation
The 2016 administrative budget has been managed by BBI JU following its autonomy (in late 2015) and still reflects some aspects inherited from the start-up phase of the organisation. In particular the surplus deriving from an over-budgeting of 2015 and 2016 costs (particularly Title 1) is heavily impacting the execution of the 2016 administrative budget. This situation is currently under discussion and will be addressed in future years, after taking into account the 2017 execution, which is based on a more realistic budget. For the operational budget, execution is showing satisfactory progress.
Administrative costs
The budgeted costs for 2016 were based on an assumption of the full staff headcount being recruited by 1st January, whereas roughly half were actually in place. Another 6 were recruited during 2016, filling 20 of the available 22 posts by 31st December 2016. This situation led to a considerable under-execution of the BBI administrative budget, taking also into account the surplus accumulated in 2015 for the same reasons.
Title 1: staff related costs such as salaries and missions are showing a poor execution (57 % and 46 % respectively), while recruitment and removal expenses are much stronger at 80 %.The general execution of the original 2016 voted budget is over 70 %, but when the large surplus brought forward from 2015 is taken into account this drops to 51 %. These figures do however constitute a tangible improvement compared to the 40 % execution recorded in 2015.
Title 2: buildings, IT and communications costs show strong execution in 2016 contributing to an overall implementation of 78 % in Title 2. Taking into account the brought-forward appropriations from 2015 this drops to 43 %. The budgetary implementation does not include the spending related to evaluators contracts; this budget was executed by the Research Executive Agency for an amount of kEUR 473 representing a 65 % execution.
In accordance with the BBI JU Financial Rules, the unused appropriations can be used until year N+3. Therefore the unexecuted budget will be carried forward to supplement the 2017 budget and a decision on the ultimate destination of the surplus will be presented to the BBI JU Governing Board.
Operational costs
Concerning the commitment appropriations of the operational budget, BBI JU concluded 26 grant agreements from the calls for proposals 2015.1 and 2015.2. Three grants of the 2015.1 call resulted in a consumption of 73.7 % of commitment appropriations, while the unused EUR 26 million were carried forward to top up the BBI 2016 call for proposals. Twenty-three grants of the 2015.2 call resulted in a 99 % execution of commitment appropriations.
The 2016 call for proposals was committed for EUR 188.9 million and was successfully evaluated by the end of 2016, resulting in a potential consumption of 98 % if all grants are signed in 2017. Unused appropriations totalling EUR 3 million will be brought forward to 2017 (via a budgetary amendment) in order to top up the BBI 2017 call for proposals.
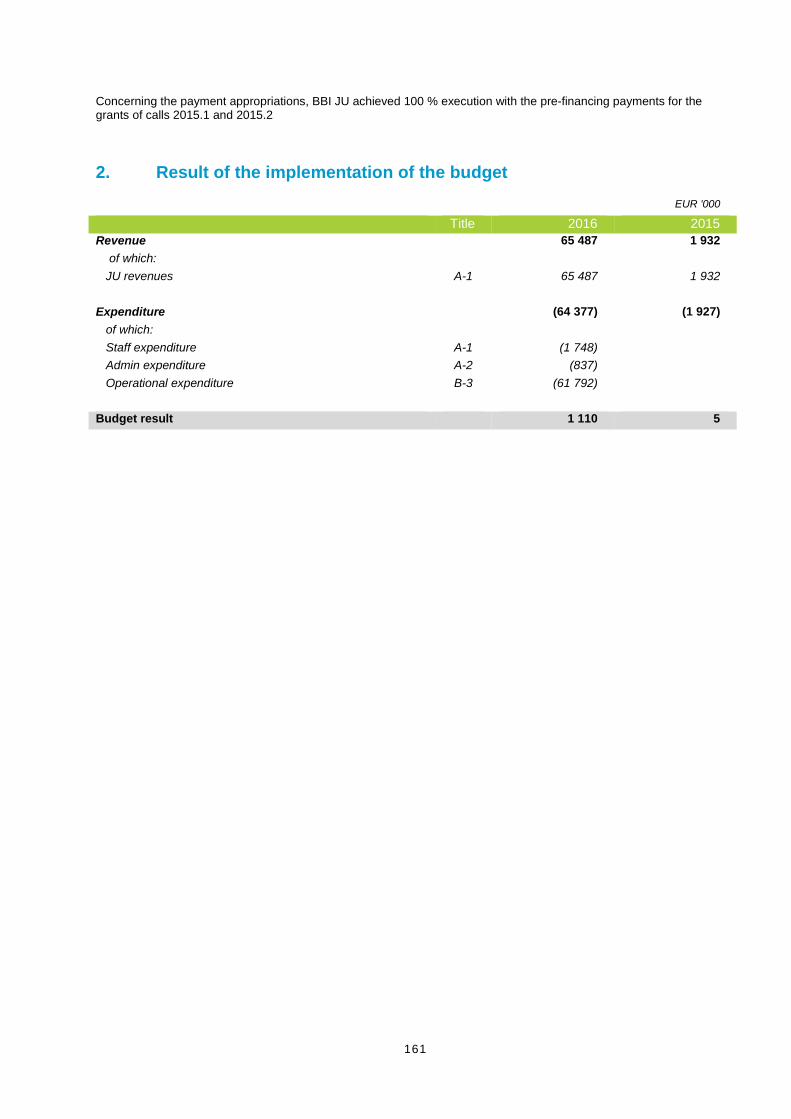
161
Concerning the payment appropriations, BBI JU achieved 100 % execution with the pre-financing payments for the grants of calls 2015.1 and 2015.2
2. Result of the implementation of the budget EUR '000
Title 2016 2015 Revenue 65 487 1 932 of which: JU revenues A-1 65 487 1 932 Expenditure (64 377) (1 927) of which: Staff expenditure A-1 (1 748) Admin expenditure A-2 (837) Operational expenditure B-3 (61 792) Budget result 1 110 5
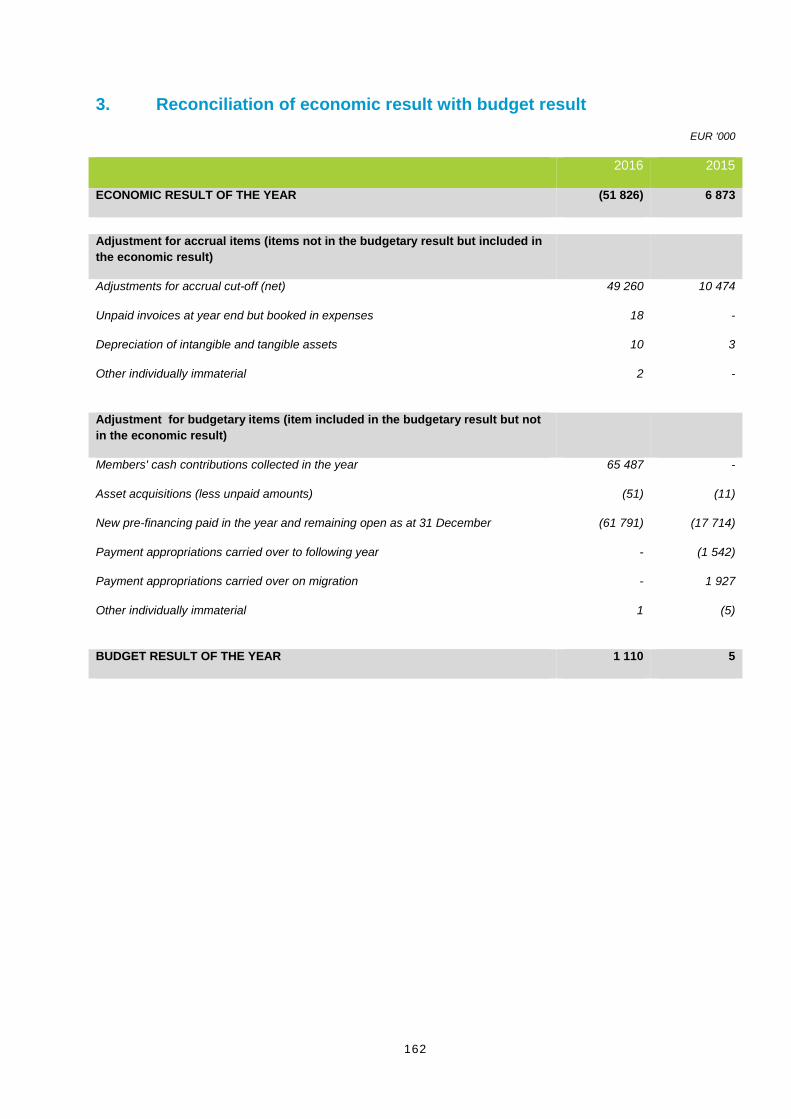
162
3. Reconciliation of economic result with budget result
EUR '000
2016 2015
ECONOMIC RESULT OF THE YEAR (51 826) 6 873
Adjustment for accrual items (items not in the budgetary result but included in the economic result)
Adjustments for accrual cut-off (net) 49 260 10 474
Unpaid invoices at year end but booked in expenses 18 -
Depreciation of intangible and tangible assets 10 3
Other individually immaterial 2 -
Adjustment for budgetary items (item included in the budgetary result but not in the economic result)
Members' cash contributions collected in the year 65 487 -
Asset acquisitions (less unpaid amounts) (51) (11)
New pre-financing paid in the year and remaining open as at 31 December (61 791) (17 714)
Payment appropriations carried over to following year - (1 542)
Payment appropriations carried over on migration - 1 927
Other individually immaterial 1 (5)
BUDGET RESULT OF THE YEAR 1 110 5
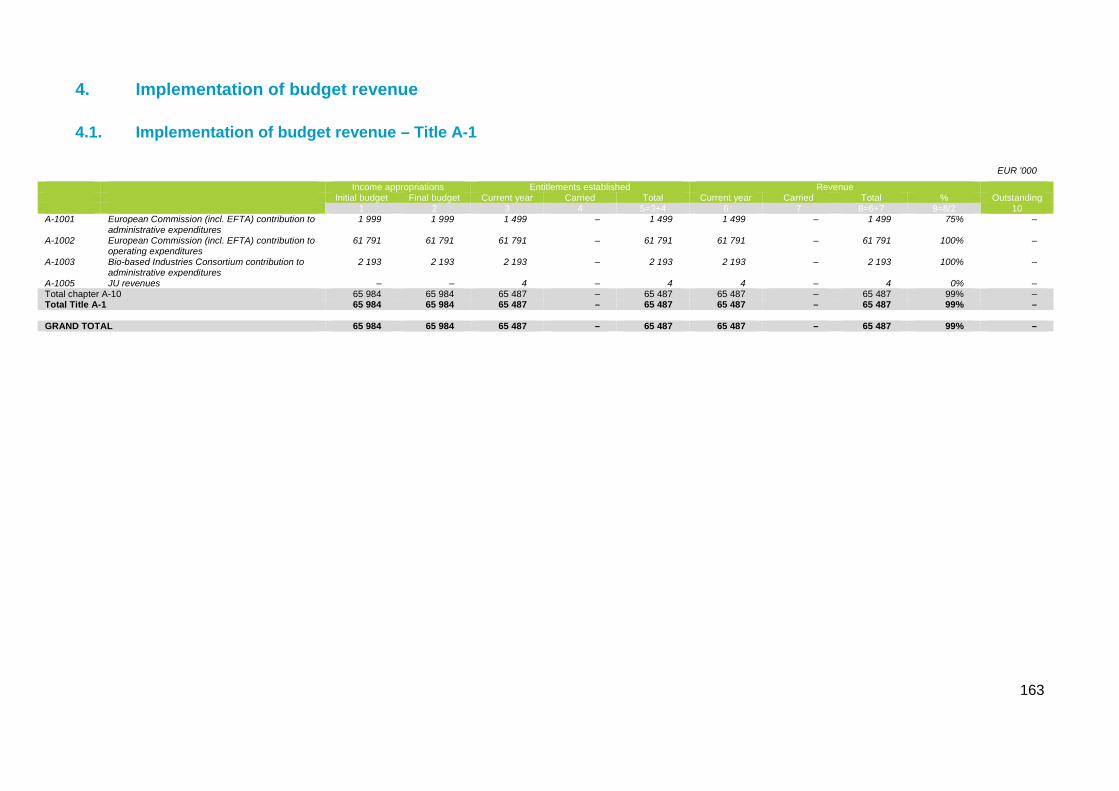
163
4. Implementation of budget revenue
4.1. Implementation of budget revenue – Title A-1
EUR '000
Income appropriations Entitlements established Revenue Initial budget Final budget Current year Carried Total Current year Carried Total % Outstanding 1 2 3 4 5=3+4 6 7 8=6+7 9=8/2 10
A-1001 European Commission (incl. EFTA) contribution to administrative expenditures
1 999 1 999 1 499 – 1 499 1 499 – 1 499 75% –
A-1002 European Commission (incl. EFTA) contribution to operating expenditures
61 791 61 791 61 791 – 61 791 61 791 – 61 791 100% –
A-1003 Bio-based Industries Consortium contribution to administrative expenditures
2 193 2 193 2 193 – 2 193 2 193 – 2 193 100% –
A-1005 JU revenues – – 4 – 4 4 – 4 0% – Total chapter A-10 65 984 65 984 65 487 – 65 487 65 487 – 65 487 99% – Total Title A-1 65 984 65 984 65 487 – 65 487 65 487 – 65 487 99% – GRAND TOTAL 65 984 65 984 65 487 – 65 487 65 487 – 65 487 99% –
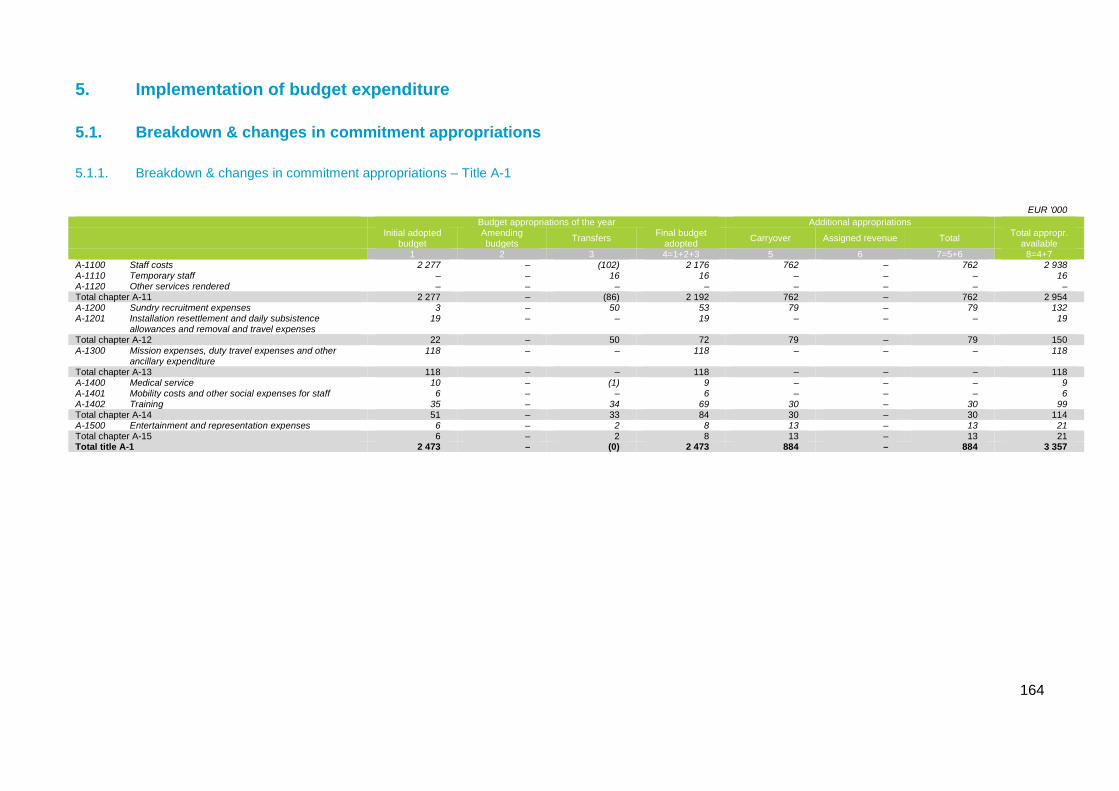
164
5. Implementation of budget expenditure
5.1. Breakdown & changes in commitment appropriations
5.1.1. Breakdown & changes in commitment appropriations – Title A-1
EUR '000 Budget appropriations of the year Additional appropriations
Initial adopted budget
Amending budgets Transfers Final budget
adopted Carryover Assigned revenue Total Total appropr. available
1 2 3 4=1+2+3 5 6 7=5+6 8=4+7 A-1100 Staff costs 2 277 – (102) 2 176 762 – 762 2 938 A-1110 Temporary staff – – 16 16 – – – 16 A-1120 Other services rendered – – – – – – – – Total chapter A-11 2 277 – (86) 2 192 762 – 762 2 954 A-1200 Sundry recruitment expenses 3 – 50 53 79 – 79 132 A-1201 Installation resettlement and daily subsistence
allowances and removal and travel expenses 19 – – 19 – – – 19
Total chapter A-12 22 – 50 72 79 – 79 150 A-1300 Mission expenses, duty travel expenses and other
ancillary expenditure 118 – – 118 – – – 118
Total chapter A-13 118 – – 118 – – – 118 A-1400 Medical service 10 – (1) 9 – – – 9 A-1401 Mobility costs and other social expenses for staff 6 – – 6 – – – 6 A-1402 Training 35 – 34 69 30 – 30 99 Total chapter A-14 51 – 33 84 30 – 30 114 A-1500 Entertainment and representation expenses 6 – 2 8 13 – 13 21 Total chapter A-15 6 – 2 8 13 – 13 21 Total title A-1 2 473 – (0) 2 473 884 – 884 3 357
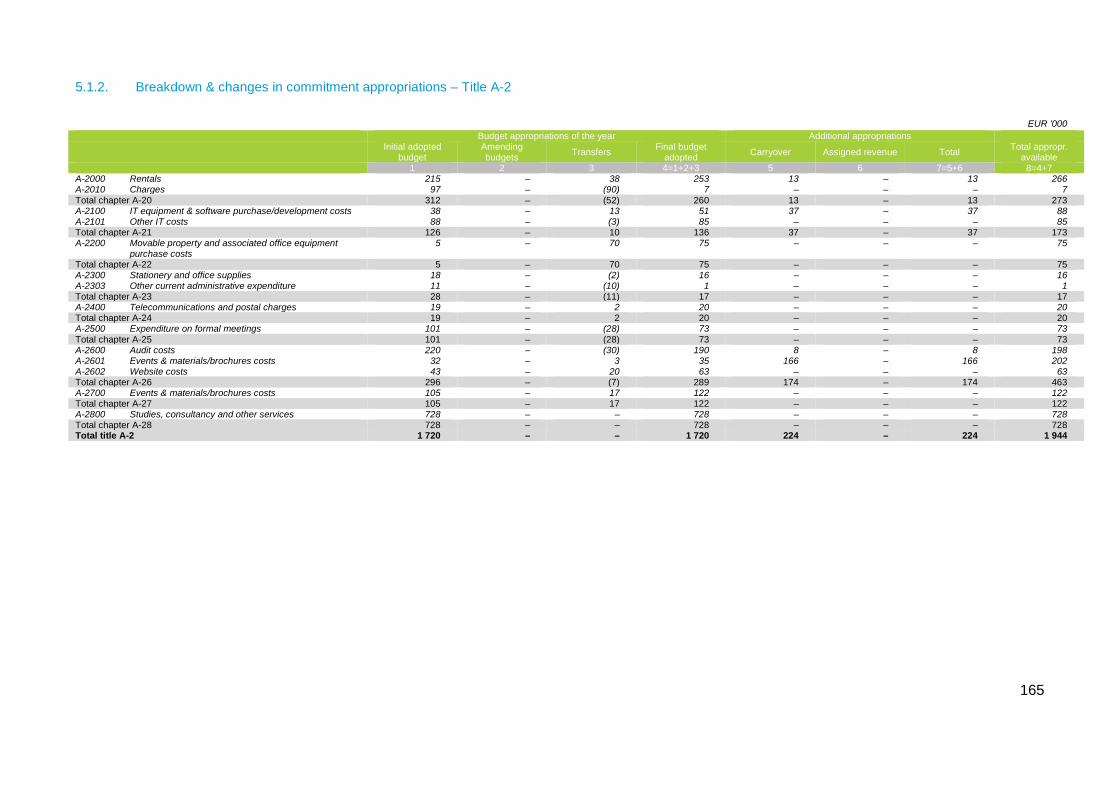
165
5.1.2. Breakdown & changes in commitment appropriations – Title A-2
EUR '000 Budget appropriations of the year Additional appropriations
Initial adopted budget
Amending budgets Transfers Final budget
adopted Carryover Assigned revenue Total Total appropr. available
1 2 3 4=1+2+3 5 6 7=5+6 8=4+7 A-2000 Rentals 215 – 38 253 13 – 13 266 A-2010 Charges 97 – (90) 7 – – – 7 Total chapter A-20 312 – (52) 260 13 – 13 273 A-2100 IT equipment & software purchase/development costs 38 – 13 51 37 – 37 88 A-2101 Other IT costs 88 – (3) 85 – – – 85 Total chapter A-21 126 – 10 136 37 – 37 173 A-2200 Movable property and associated office equipment
purchase costs 5 – 70 75 – – – 75
Total chapter A-22 5 – 70 75 – – – 75 A-2300 Stationery and office supplies 18 – (2) 16 – – – 16 A-2303 Other current administrative expenditure 11 – (10) 1 – – – 1 Total chapter A-23 28 – (11) 17 – – – 17 A-2400 Telecommunications and postal charges 19 – 2 20 – – – 20 Total chapter A-24 19 – 2 20 – – – 20 A-2500 Expenditure on formal meetings 101 – (28) 73 – – – 73 Total chapter A-25 101 – (28) 73 – – – 73 A-2600 Audit costs 220 – (30) 190 8 – 8 198 A-2601 Events & materials/brochures costs 32 – 3 35 166 – 166 202 A-2602 Website costs 43 – 20 63 – – – 63 Total chapter A-26 296 – (7) 289 174 – 174 463 A-2700 Events & materials/brochures costs 105 – 17 122 – – – 122 Total chapter A-27 105 – 17 122 – – – 122 A-2800 Studies, consultancy and other services 728 – – 728 – – – 728 Total chapter A-28 728 – – 728 – – – 728 Total title A-2 1 720 – – 1 720 224 – 224 1 944
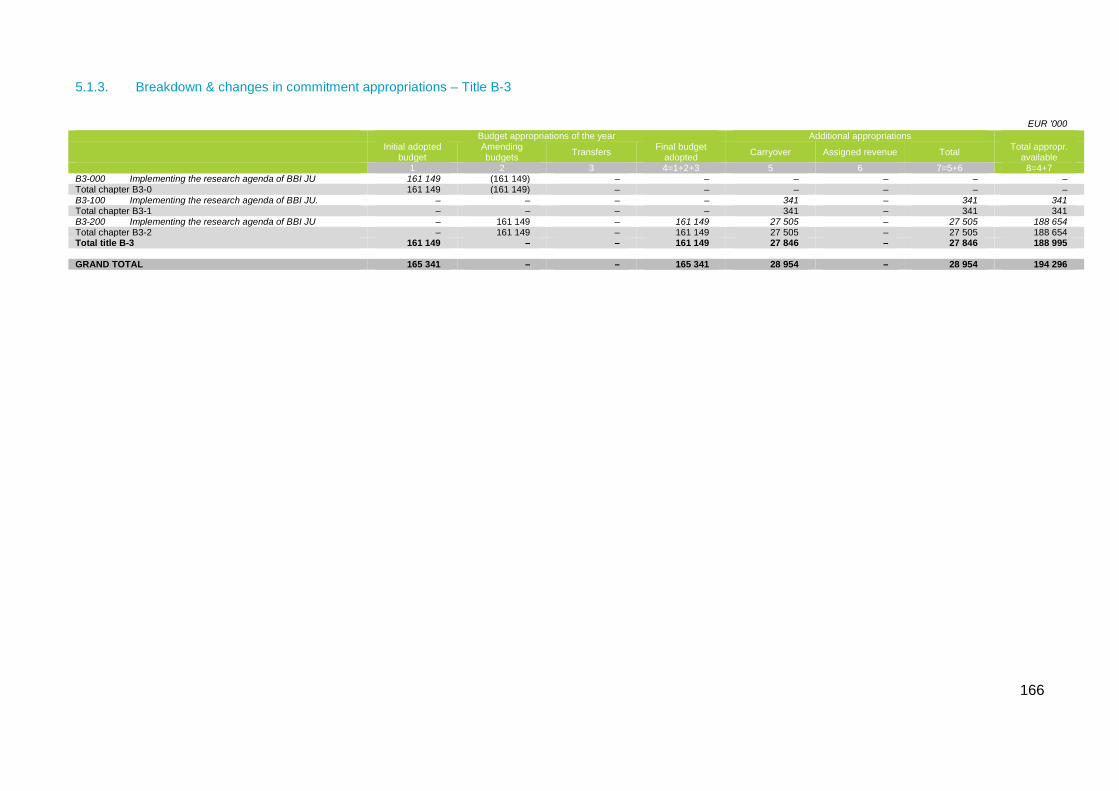
166
5.1.3. Breakdown & changes in commitment appropriations – Title B-3
EUR '000 Budget appropriations of the year Additional appropriations
Initial adopted budget
Amending budgets Transfers Final budget
adopted Carryover Assigned revenue Total Total appropr. available
1 2 3 4=1+2+3 5 6 7=5+6 8=4+7 B3-000 Implementing the research agenda of BBI JU 161 149 (161 149) – – – – – – Total chapter B3-0 161 149 (161 149) – – – – – – B3-100 Implementing the research agenda of BBI JU. – – – – 341 – 341 341 Total chapter B3-1 – – – – 341 – 341 341 B3-200 Implementing the research agenda of BBI JU – 161 149 – 161 149 27 505 – 27 505 188 654 Total chapter B3-2 – 161 149 – 161 149 27 505 – 27 505 188 654 Total title B-3 161 149 – – 161 149 27 846 – 27 846 188 995 GRAND TOTAL 165 341 – – 165 341 28 954 – 28 954 194 296
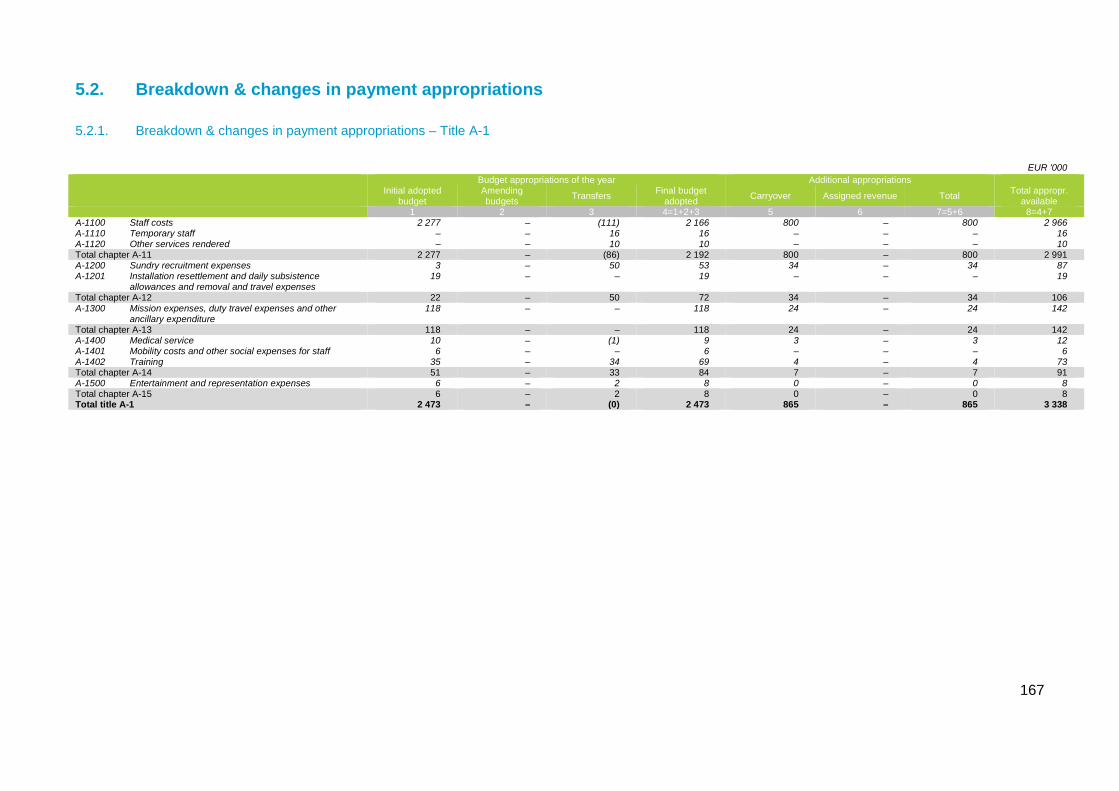
167
5.2. Breakdown & changes in payment appropriations
5.2.1. Breakdown & changes in payment appropriations – Title A-1
EUR '000 Budget appropriations of the year Additional appropriations
Initial adopted budget
Amending budgets Transfers Final budget
adopted Carryover Assigned revenue Total Total appropr. available
1 2 3 4=1+2+3 5 6 7=5+6 8=4+7 A-1100 Staff costs 2 277 – (111) 2 166 800 – 800 2 966 A-1110 Temporary staff – – 16 16 – – – 16 A-1120 Other services rendered – – 10 10 – – – 10 Total chapter A-11 2 277 – (86) 2 192 800 – 800 2 991 A-1200 Sundry recruitment expenses 3 – 50 53 34 – 34 87 A-1201 Installation resettlement and daily subsistence
allowances and removal and travel expenses 19 – – 19 – – – 19
Total chapter A-12 22 – 50 72 34 – 34 106 A-1300 Mission expenses, duty travel expenses and other
ancillary expenditure 118 – – 118 24 – 24 142
Total chapter A-13 118 – – 118 24 – 24 142 A-1400 Medical service 10 – (1) 9 3 – 3 12 A-1401 Mobility costs and other social expenses for staff 6 – – 6 – – – 6 A-1402 Training 35 – 34 69 4 – 4 73 Total chapter A-14 51 – 33 84 7 – 7 91 A-1500 Entertainment and representation expenses 6 – 2 8 0 – 0 8 Total chapter A-15 6 – 2 8 0 – 0 8 Total title A-1 2 473 – (0) 2 473 865 – 865 3 338
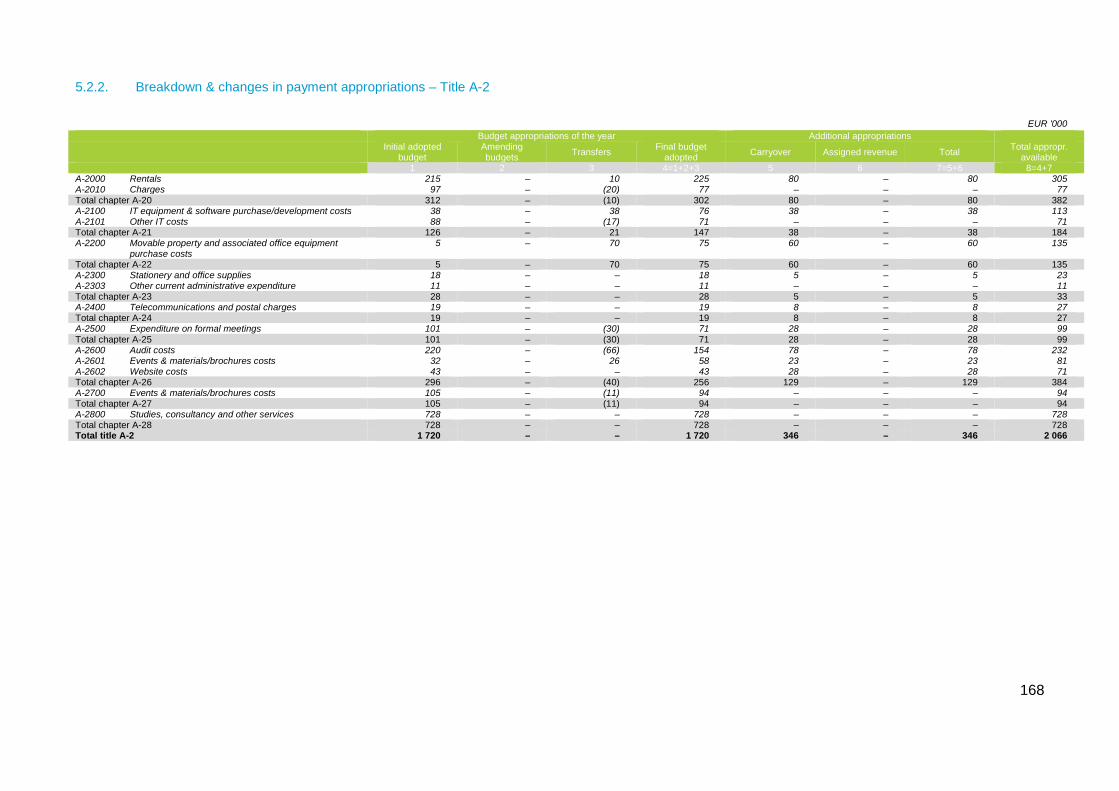
168
5.2.2. Breakdown & changes in payment appropriations – Title A-2
EUR '000 Budget appropriations of the year Additional appropriations
Initial adopted budget
Amending budgets Transfers Final budget
adopted Carryover Assigned revenue Total Total appropr. available
1 2 3 4=1+2+3 5 6 7=5+6 8=4+7 A-2000 Rentals 215 – 10 225 80 – 80 305 A-2010 Charges 97 – (20) 77 – – – 77 Total chapter A-20 312 – (10) 302 80 – 80 382 A-2100 IT equipment & software purchase/development costs 38 – 38 76 38 – 38 113 A-2101 Other IT costs 88 – (17) 71 – – – 71 Total chapter A-21 126 – 21 147 38 – 38 184 A-2200 Movable property and associated office equipment
purchase costs 5 – 70 75 60 – 60 135
Total chapter A-22 5 – 70 75 60 – 60 135 A-2300 Stationery and office supplies 18 – – 18 5 – 5 23 A-2303 Other current administrative expenditure 11 – – 11 – – – 11 Total chapter A-23 28 – – 28 5 – 5 33 A-2400 Telecommunications and postal charges 19 – – 19 8 – 8 27 Total chapter A-24 19 – – 19 8 – 8 27 A-2500 Expenditure on formal meetings 101 – (30) 71 28 – 28 99 Total chapter A-25 101 – (30) 71 28 – 28 99 A-2600 Audit costs 220 – (66) 154 78 – 78 232 A-2601 Events & materials/brochures costs 32 – 26 58 23 – 23 81 A-2602 Website costs 43 – – 43 28 – 28 71 Total chapter A-26 296 – (40) 256 129 – 129 384 A-2700 Events & materials/brochures costs 105 – (11) 94 – – – 94 Total chapter A-27 105 – (11) 94 – – – 94 A-2800 Studies, consultancy and other services 728 – – 728 – – – 728 Total chapter A-28 728 – – 728 – – – 728 Total title A-2 1 720 – – 1 720 346 – 346 2 066
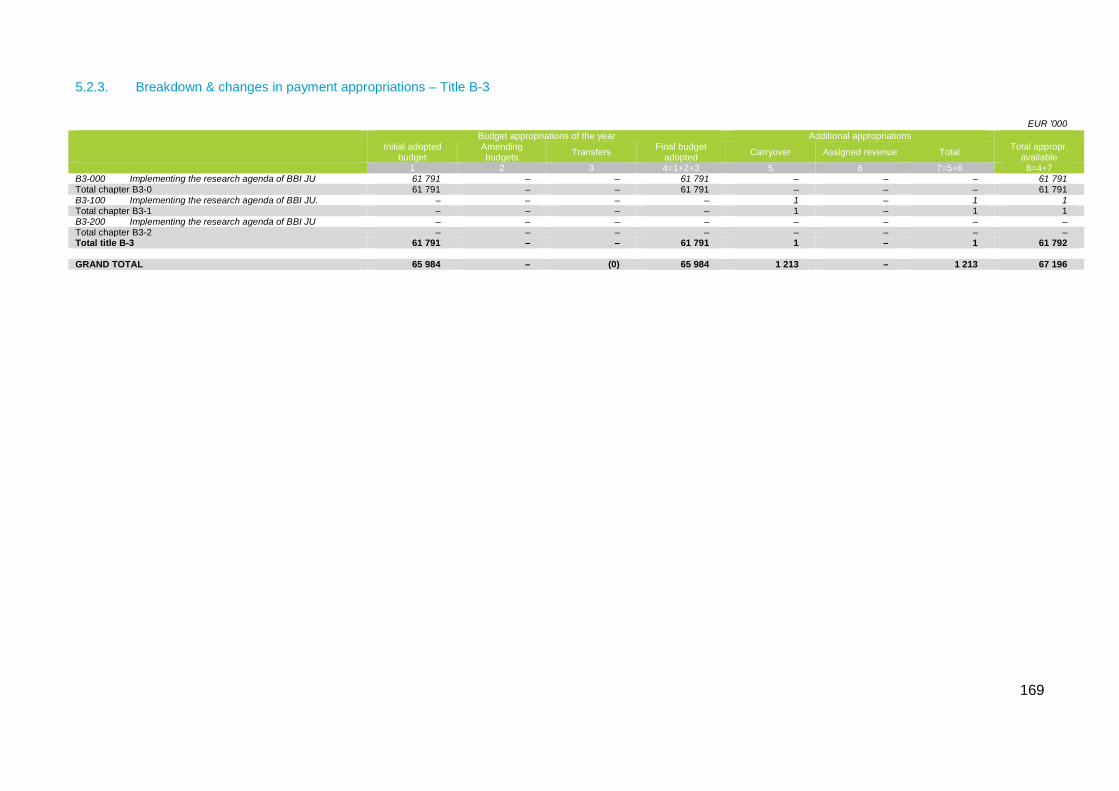
169
5.2.3. Breakdown & changes in payment appropriations – Title B-3
EUR '000 Budget appropriations of the year Additional appropriations
Initial adopted budget
Amending budgets Transfers Final budget
adopted Carryover Assigned revenue Total Total appropr. available
1 2 3 4=1+2+3 5 6 7=5+6 8=4+7 B3-000 Implementing the research agenda of BBI JU 61 791 – – 61 791 – – – 61 791 Total chapter B3-0 61 791 – – 61 791 – – – 61 791 B3-100 Implementing the research agenda of BBI JU. – – – – 1 – 1 1 Total chapter B3-1 – – – – 1 – 1 1 B3-200 Implementing the research agenda of BBI JU – – – – – – – – Total chapter B3-2 – – – – – – – – Total title B-3 61 791 – – 61 791 1 – 1 61 792 GRAND TOTAL 65 984 – (0) 65 984 1 213 – 1 213 67 196
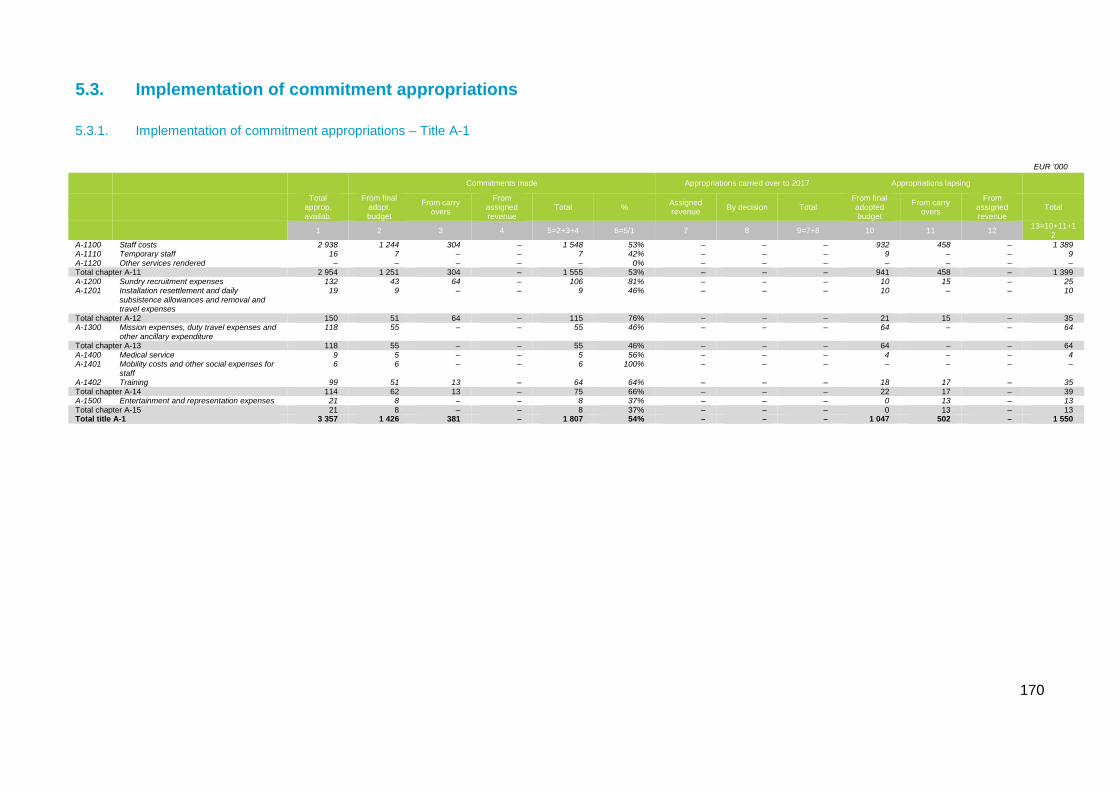
170
5.3. Implementation of commitment appropriations
5.3.1. Implementation of commitment appropriations – Title A-1
EUR '000
Commitments made Appropriations carried over to 2017 Appropriations lapsing
Total
approp. availab.
From final adopt. budget
From carry overs
From assigned revenue
Total % Assigned revenue By decision Total
From final adopted budget
From carry overs
From assigned revenue
Total
1 2 3 4 5=2+3+4 6=5/1 7 8 9=7+8 10 11 12 13=10+11+12
A-1100 Staff costs 2 938 1 244 304 – 1 548 53% – – – 932 458 – 1 389 A-1110 Temporary staff 16 7 – – 7 42% – – – 9 – – 9 A-1120 Other services rendered – – – – – 0% – – – – – – – Total chapter A-11 2 954 1 251 304 – 1 555 53% – – – 941 458 – 1 399 A-1200 Sundry recruitment expenses 132 43 64 – 106 81% – – – 10 15 – 25 A-1201 Installation resettlement and daily
subsistence allowances and removal and travel expenses
19 9 – – 9 46% – – – 10 – – 10
Total chapter A-12 150 51 64 – 115 76% – – – 21 15 – 35 A-1300 Mission expenses, duty travel expenses and
other ancillary expenditure 118 55 – – 55 46% – – – 64 – – 64
Total chapter A-13 118 55 – – 55 46% – – – 64 – – 64 A-1400 Medical service 9 5 – – 5 56% – – – 4 – – 4 A-1401 Mobility costs and other social expenses for
staff 6 6 – – 6 100% – – – – – – –
A-1402 Training 99 51 13 – 64 64% – – – 18 17 – 35 Total chapter A-14 114 62 13 – 75 66% – – – 22 17 – 39 A-1500 Entertainment and representation expenses 21 8 – – 8 37% – – – 0 13 – 13 Total chapter A-15 21 8 – – 8 37% – – – 0 13 – 13 Total title A-1 3 357 1 426 381 – 1 807 54% – – – 1 047 502 – 1 550
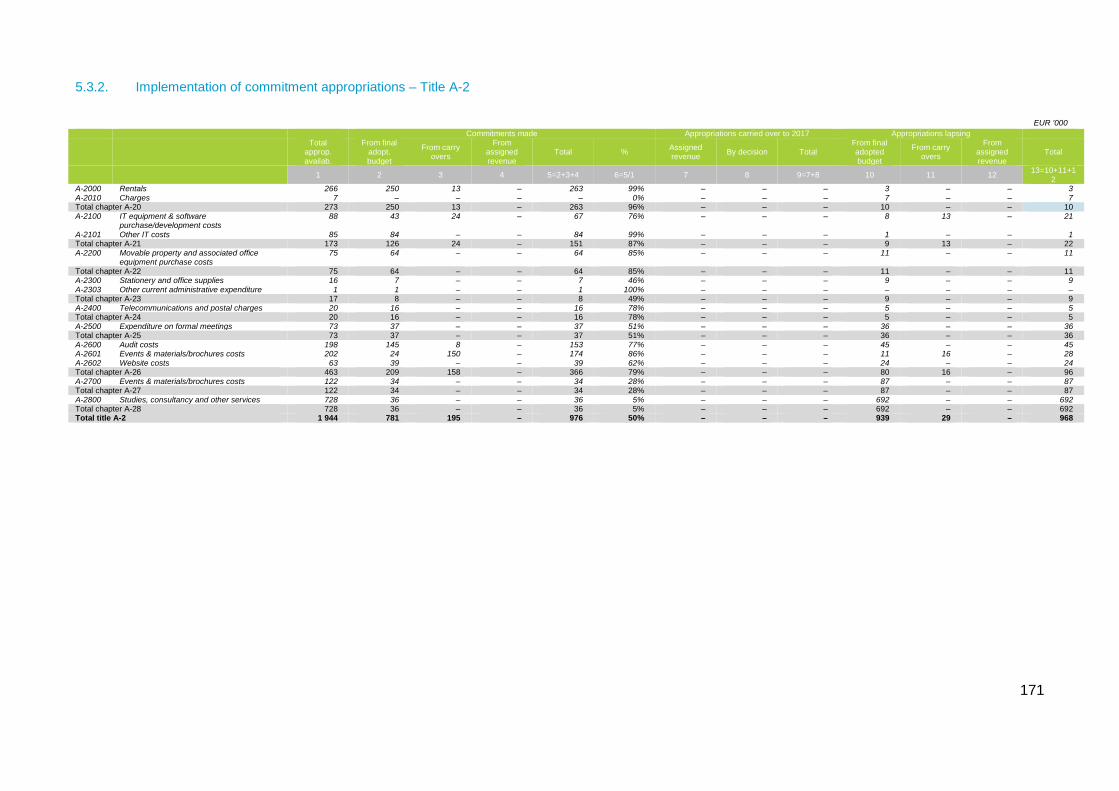
171
5.3.2. Implementation of commitment appropriations – Title A-2
EUR '000 Commitments made Appropriations carried over to 2017 Appropriations lapsing
Total
approp. availab.
From final adopt. budget
From carry overs
From assigned revenue
Total % Assigned revenue By decision Total
From final adopted budget
From carry overs
From assigned revenue
Total
1 2 3 4 5=2+3+4 6=5/1 7 8 9=7+8 10 11 12 13=10+11+12
A-2000 Rentals 266 250 13 – 263 99% – – – 3 – – 3 A-2010 Charges 7 – – – – 0% – – – 7 – – 7 Total chapter A-20 273 250 13 – 263 96% – – – 10 – – 10 A-2100 IT equipment & software
purchase/development costs 88 43 24 – 67 76% – – – 8 13 – 21
A-2101 Other IT costs 85 84 – – 84 99% – – – 1 – – 1 Total chapter A-21 173 126 24 – 151 87% – – – 9 13 – 22 A-2200 Movable property and associated office
equipment purchase costs 75 64 – – 64 85% – – – 11 – – 11
Total chapter A-22 75 64 – – 64 85% – – – 11 – – 11 A-2300 Stationery and office supplies 16 7 – – 7 46% – – – 9 – – 9 A-2303 Other current administrative expenditure 1 1 – – 1 100% – – – – – – – Total chapter A-23 17 8 – – 8 49% – – – 9 – – 9 A-2400 Telecommunications and postal charges 20 16 – – 16 78% – – – 5 – – 5 Total chapter A-24 20 16 – – 16 78% – – – 5 – – 5 A-2500 Expenditure on formal meetings 73 37 – – 37 51% – – – 36 – – 36 Total chapter A-25 73 37 – – 37 51% – – – 36 – – 36 A-2600 Audit costs 198 145 8 – 153 77% – – – 45 – – 45 A-2601 Events & materials/brochures costs 202 24 150 – 174 86% – – – 11 16 – 28 A-2602 Website costs 63 39 – – 39 62% – – – 24 – – 24 Total chapter A-26 463 209 158 – 366 79% – – – 80 16 – 96 A-2700 Events & materials/brochures costs 122 34 – – 34 28% – – – 87 – – 87 Total chapter A-27 122 34 – – 34 28% – – – 87 – – 87 A-2800 Studies, consultancy and other services 728 36 – – 36 5% – – – 692 – – 692 Total chapter A-28 728 36 – – 36 5% – – – 692 – – 692 Total title A-2 1 944 781 195 – 976 50% – – – 939 29 – 968
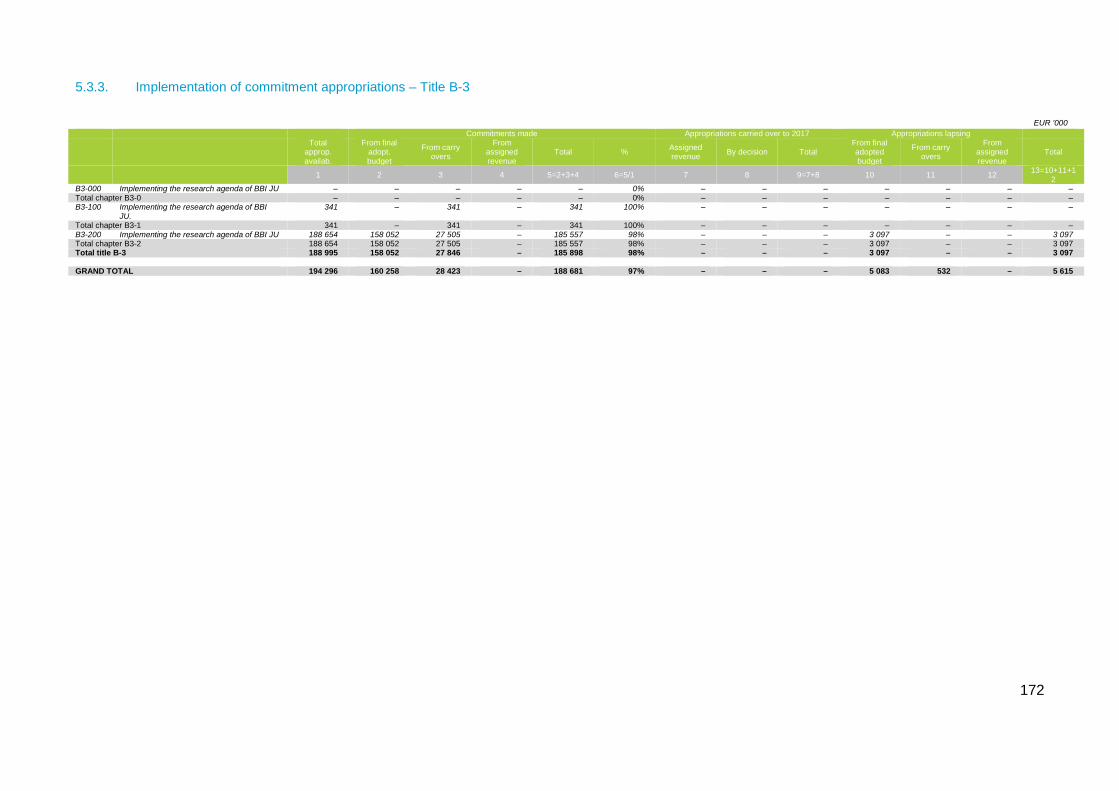
172
5.3.3. Implementation of commitment appropriations – Title B-3
EUR '000 Commitments made Appropriations carried over to 2017 Appropriations lapsing
Total
approp. availab.
From final adopt. budget
From carry overs
From assigned revenue
Total % Assigned revenue By decision Total
From final adopted budget
From carry overs
From assigned revenue
Total
1 2 3 4 5=2+3+4 6=5/1 7 8 9=7+8 10 11 12 13=10+11+12
B3-000 Implementing the research agenda of BBI JU – – – – – 0% – – – – – – – Total chapter B3-0 – – – – – 0% – – – – – – – B3-100 Implementing the research agenda of BBI
JU. 341 – 341 – 341 100% – – – – – – –
Total chapter B3-1 341 – 341 – 341 100% – – – – – – – B3-200 Implementing the research agenda of BBI JU 188 654 158 052 27 505 – 185 557 98% – – – 3 097 – – 3 097 Total chapter B3-2 188 654 158 052 27 505 – 185 557 98% – – – 3 097 – – 3 097 Total title B-3 188 995 158 052 27 846 – 185 898 98% – – – 3 097 – – 3 097 GRAND TOTAL 194 296 160 258 28 423 – 188 681 97% – – – 5 083 532 – 5 615
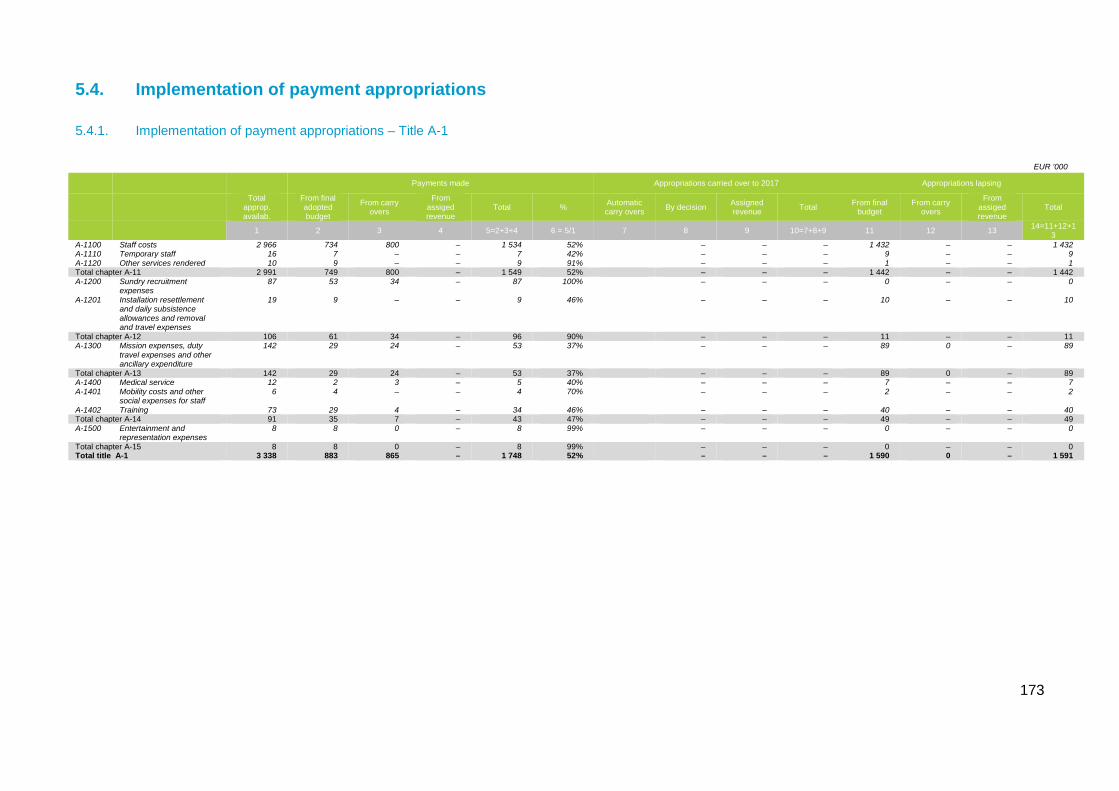
173
5.4. Implementation of payment appropriations
5.4.1. Implementation of payment appropriations – Title A-1
EUR '000
Payments made Appropriations carried over to 2017 Appropriations lapsing
Total
approp. availab.
From final adopted budget
From carry overs
From assiged revenue
Total % Automatic carry overs By decision Assigned
revenue Total From final budget
From carry overs
From assiged revenue
Total
1 2 3 4 5=2+3+4 6 = 5/1 7 8 9 10=7+8+9 11 12 13 14=11+12+13
A-1100 Staff costs 2 966 734 800 – 1 534 52% – – – 1 432 – – 1 432 A-1110 Temporary staff 16 7 – – 7 42% – – – 9 – – 9 A-1120 Other services rendered 10 9 – – 9 91% – – – 1 – – 1 Total chapter A-11 2 991 749 800 – 1 549 52% – – – 1 442 – – 1 442 A-1200 Sundry recruitment
expenses 87 53 34 – 87 100% – – – 0 – – 0
A-1201 Installation resettlement and daily subsistence allowances and removal and travel expenses
19 9 – – 9 46% – – – 10 – – 10
Total chapter A-12 106 61 34 – 96 90% – – – 11 – – 11 A-1300 Mission expenses, duty
travel expenses and other ancillary expenditure
142 29 24 – 53 37% – – – 89 0 – 89
Total chapter A-13 142 29 24 – 53 37% – – – 89 0 – 89 A-1400 Medical service 12 2 3 – 5 40% – – – 7 – – 7 A-1401 Mobility costs and other
social expenses for staff 6 4 – – 4 70% – – – 2 – – 2
A-1402 Training 73 29 4 – 34 46% – – – 40 – – 40 Total chapter A-14 91 35 7 – 43 47% – – – 49 – – 49 A-1500 Entertainment and
representation expenses 8 8 0 – 8 99% – – – 0 – – 0
Total chapter A-15 8 8 0 – 8 99% – – – 0 – – 0 Total title A-1 3 338 883 865 – 1 748 52% – – – 1 590 0 – 1 591
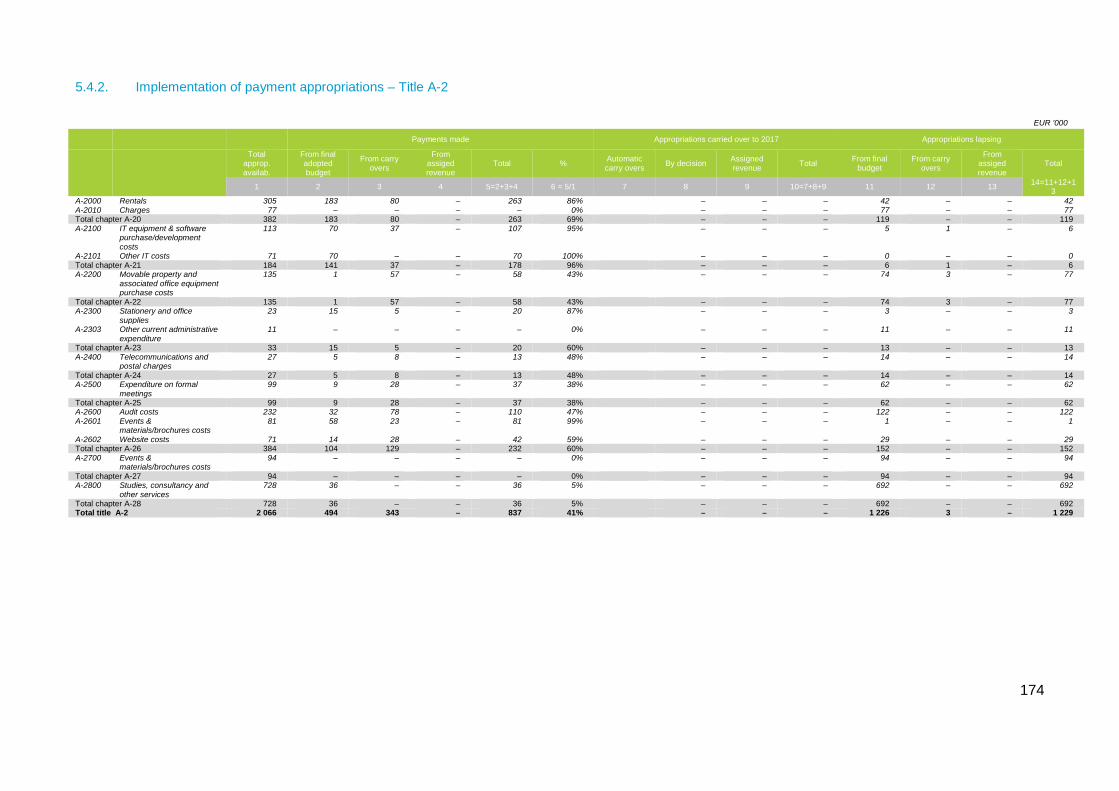
174
5.4.2. Implementation of payment appropriations – Title A-2
EUR '000
Payments made Appropriations carried over to 2017 Appropriations lapsing
Total
approp. availab.
From final adopted budget
From carry overs
From assiged revenue
Total % Automatic carry overs By decision Assigned
revenue Total From final budget
From carry overs
From assiged revenue
Total
1 2 3 4 5=2+3+4 6 = 5/1 7 8 9 10=7+8+9 11 12 13 14=11+12+13
A-2000 Rentals 305 183 80 – 263 86% – – – 42 – – 42 A-2010 Charges 77 – – – – 0% – – – 77 – – 77 Total chapter A-20 382 183 80 – 263 69% – – – 119 – – 119 A-2100 IT equipment & software
purchase/development costs
113 70 37 – 107 95% – – – 5 1 – 6
A-2101 Other IT costs 71 70 – – 70 100% – – – 0 – – 0 Total chapter A-21 184 141 37 – 178 96% – – – 6 1 – 6 A-2200 Movable property and
associated office equipment purchase costs
135 1 57 – 58 43% – – – 74 3 – 77
Total chapter A-22 135 1 57 – 58 43% – – – 74 3 – 77 A-2300 Stationery and office
supplies 23 15 5 – 20 87% – – – 3 – – 3
A-2303 Other current administrative expenditure
11 – – – – 0% – – – 11 – – 11
Total chapter A-23 33 15 5 – 20 60% – – – 13 – – 13 A-2400 Telecommunications and
postal charges 27 5 8 – 13 48% – – – 14 – – 14
Total chapter A-24 27 5 8 – 13 48% – – – 14 – – 14 A-2500 Expenditure on formal
meetings 99 9 28 – 37 38% – – – 62 – – 62
Total chapter A-25 99 9 28 – 37 38% – – – 62 – – 62 A-2600 Audit costs 232 32 78 – 110 47% – – – 122 – – 122 A-2601 Events &
materials/brochures costs 81 58 23 – 81 99% – – – 1 – – 1
A-2602 Website costs 71 14 28 – 42 59% – – – 29 – – 29 Total chapter A-26 384 104 129 – 232 60% – – – 152 – – 152 A-2700 Events &
materials/brochures costs 94 – – – – 0% – – – 94 – – 94
Total chapter A-27 94 – – – – 0% – – – 94 – – 94 A-2800 Studies, consultancy and
other services 728 36 – – 36 5% – – – 692 – – 692
Total chapter A-28 728 36 – – 36 5% – – – 692 – – 692 Total title A-2 2 066 494 343 – 837 41% – – – 1 226 3 – 1 229
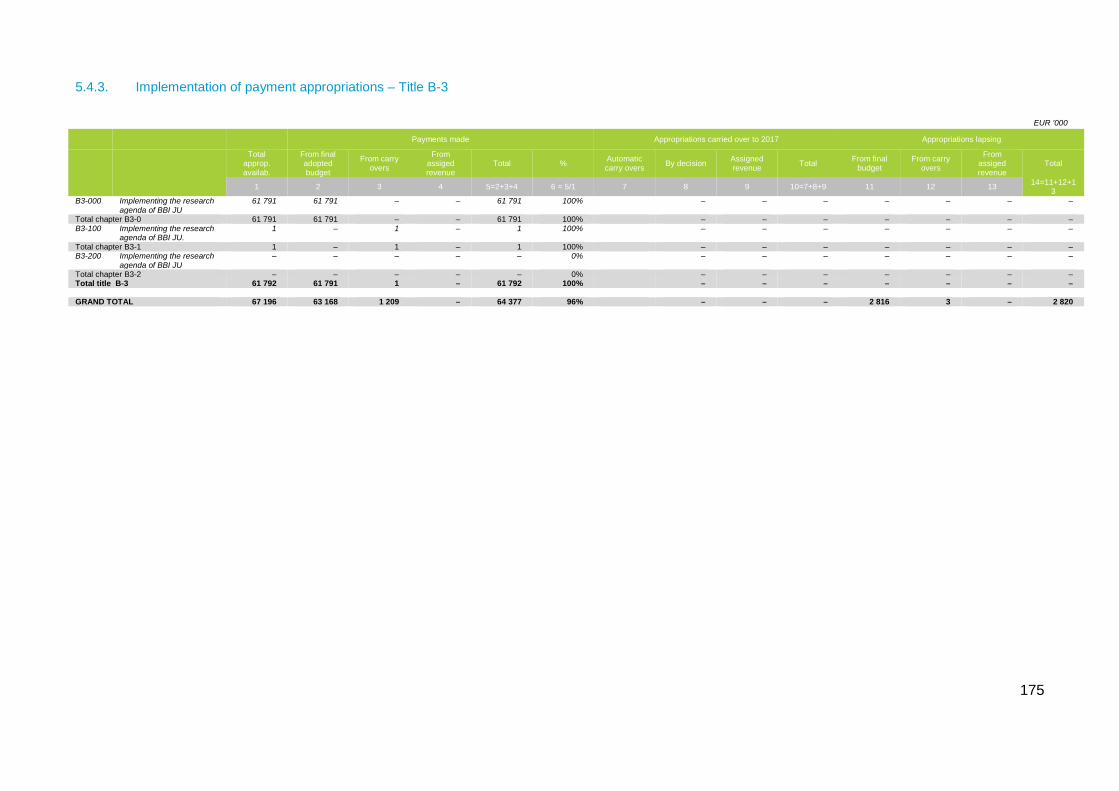
175
5.4.3. Implementation of payment appropriations – Title B-3
EUR '000
Payments made Appropriations carried over to 2017 Appropriations lapsing
Total
approp. availab.
From final adopted budget
From carry overs
From assiged revenue
Total % Automatic carry overs By decision Assigned
revenue Total From final budget
From carry overs
From assiged revenue
Total
1 2 3 4 5=2+3+4 6 = 5/1 7 8 9 10=7+8+9 11 12 13 14=11+12+13
B3-000 Implementing the research agenda of BBI JU
61 791 61 791 – – 61 791 100% – – – – – – –
Total chapter B3-0 61 791 61 791 – – 61 791 100% – – – – – – – B3-100 Implementing the research
agenda of BBI JU. 1 – 1 – 1 100% – – – – – – –
Total chapter B3-1 1 – 1 – 1 100% – – – – – – – B3-200 Implementing the research
agenda of BBI JU – – – – – 0% – – – – – – –
Total chapter B3-2 – – – – – 0% – – – – – – – Total title B-3 61 792 61 791 1 – 61 792 100% – – – – – – – GRAND TOTAL 67 196 63 168 1 209 – 64 377 96% – – – 2 816 3 – 2 820
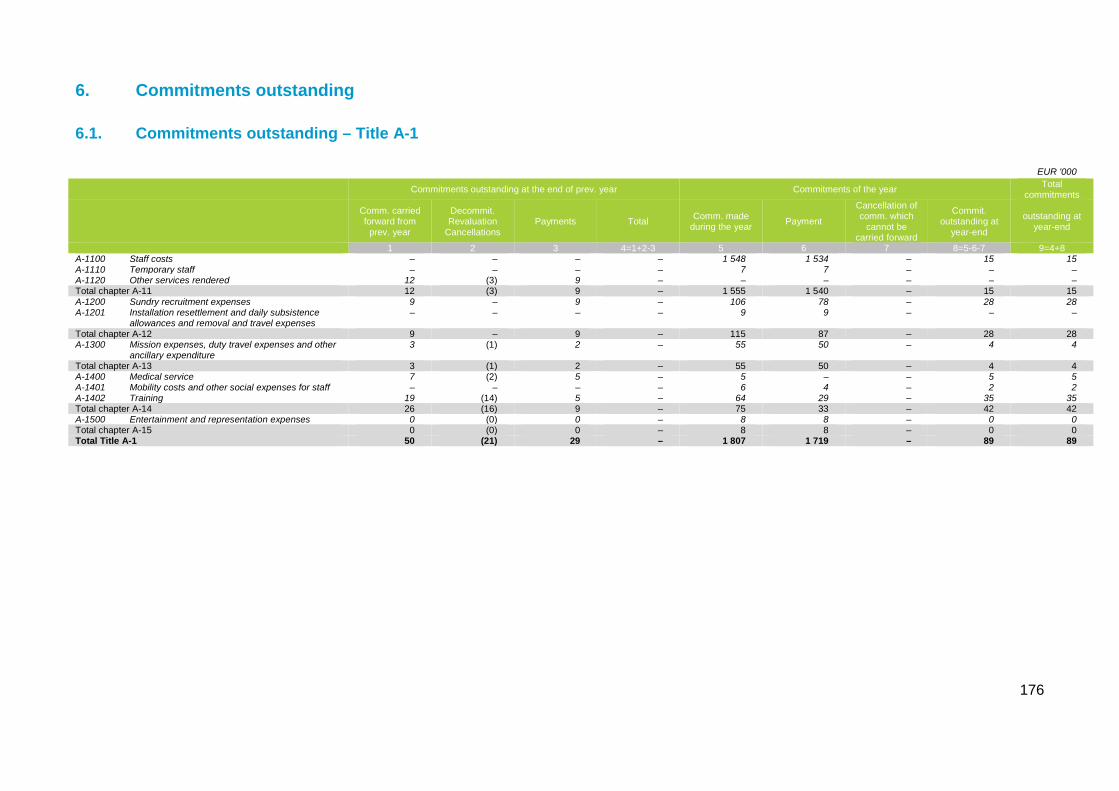
176
6. Commitments outstanding
6.1. Commitments outstanding – Title A-1
EUR '000
Commitments outstanding at the end of prev. year Commitments of the year Total commitments
Comm. carried forward from
prev. year
Decommit. Revaluation
Cancellations Payments Total Comm. made
during the year Payment
Cancellation of comm. which
cannot be carried forward
Commit. outstanding at
year-end
outstanding at year-end
1 2 3 4=1+2-3 5 6 7 8=5-6-7 9=4+8 A-1100 Staff costs – – – – 1 548 1 534 – 15 15 A-1110 Temporary staff – – – – 7 7 – – – A-1120 Other services rendered 12 (3) 9 – – – – – – Total chapter A-11 12 (3) 9 – 1 555 1 540 – 15 15 A-1200 Sundry recruitment expenses 9 – 9 – 106 78 – 28 28 A-1201 Installation resettlement and daily subsistence
allowances and removal and travel expenses – – – – 9 9 – – –
Total chapter A-12 9 – 9 – 115 87 – 28 28 A-1300 Mission expenses, duty travel expenses and other
ancillary expenditure 3 (1) 2 – 55 50 – 4 4
Total chapter A-13 3 (1) 2 – 55 50 – 4 4 A-1400 Medical service 7 (2) 5 – 5 – – 5 5 A-1401 Mobility costs and other social expenses for staff – – – – 6 4 – 2 2 A-1402 Training 19 (14) 5 – 64 29 – 35 35 Total chapter A-14 26 (16) 9 – 75 33 – 42 42 A-1500 Entertainment and representation expenses 0 (0) 0 – 8 8 – 0 0 Total chapter A-15 0 (0) 0 – 8 8 – 0 0 Total Title A-1 50 (21) 29 – 1 807 1 719 – 89 89
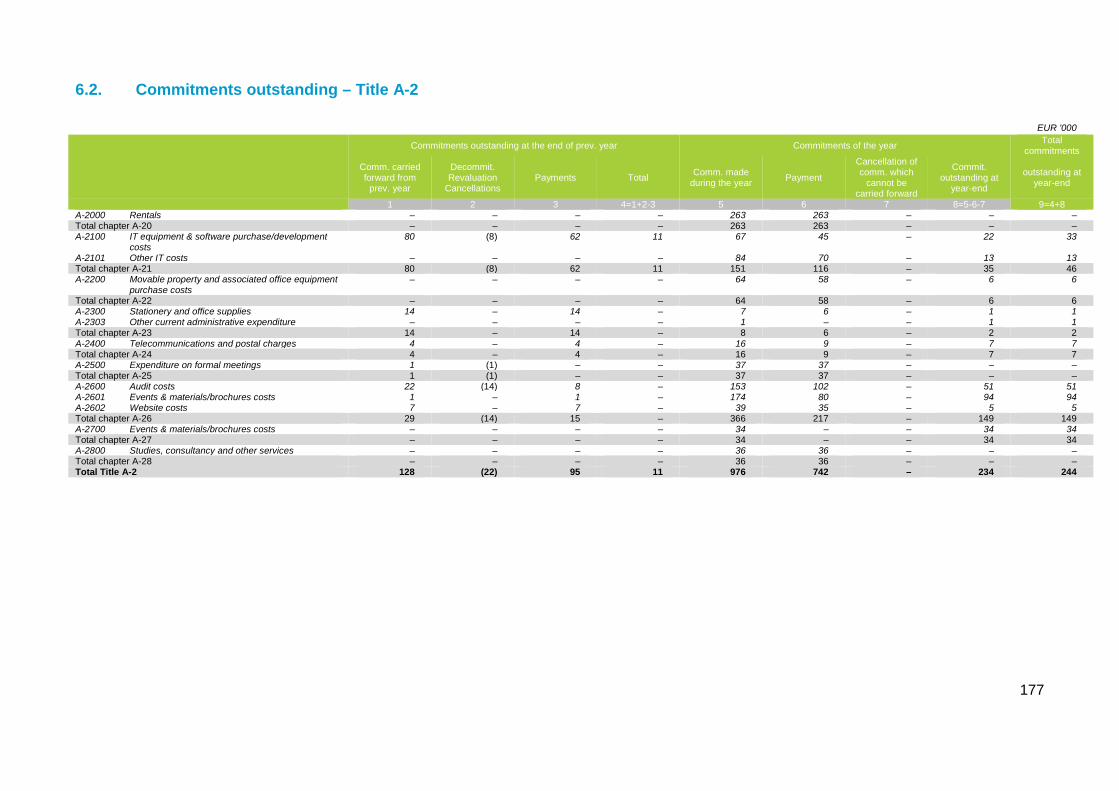
177
6.2. Commitments outstanding – Title A-2
EUR '000
Commitments outstanding at the end of prev. year Commitments of the year Total commitments
Comm. carried forward from
prev. year
Decommit. Revaluation
Cancellations Payments Total Comm. made
during the year Payment
Cancellation of comm. which
cannot be carried forward
Commit. outstanding at
year-end
outstanding at year-end
1 2 3 4=1+2-3 5 6 7 8=5-6-7 9=4+8 A-2000 Rentals – – – – 263 263 – – – Total chapter A-20 – – – – 263 263 – – – A-2100 IT equipment & software purchase/development
costs 80 (8) 62 11 67 45 – 22 33
A-2101 Other IT costs – – – – 84 70 – 13 13 Total chapter A-21 80 (8) 62 11 151 116 – 35 46 A-2200 Movable property and associated office equipment
purchase costs – – – – 64 58 – 6 6
Total chapter A-22 – – – – 64 58 – 6 6 A-2300 Stationery and office supplies 14 – 14 – 7 6 – 1 1 A-2303 Other current administrative expenditure – – – – 1 – – 1 1 Total chapter A-23 14 – 14 – 8 6 – 2 2 A-2400 Telecommunications and postal charges 4 – 4 – 16 9 – 7 7 Total chapter A-24 4 – 4 – 16 9 – 7 7 A-2500 Expenditure on formal meetings 1 (1) – – 37 37 – – – Total chapter A-25 1 (1) – – 37 37 – – – A-2600 Audit costs 22 (14) 8 – 153 102 – 51 51 A-2601 Events & materials/brochures costs 1 – 1 – 174 80 – 94 94 A-2602 Website costs 7 – 7 – 39 35 – 5 5 Total chapter A-26 29 (14) 15 – 366 217 – 149 149 A-2700 Events & materials/brochures costs – – – – 34 – – 34 34 Total chapter A-27 – – – – 34 – – 34 34 A-2800 Studies, consultancy and other services – – – – 36 36 – – – Total chapter A-28 – – – – 36 36 – – – Total Title A-2 128 (22) 95 11 976 742 – 234 244
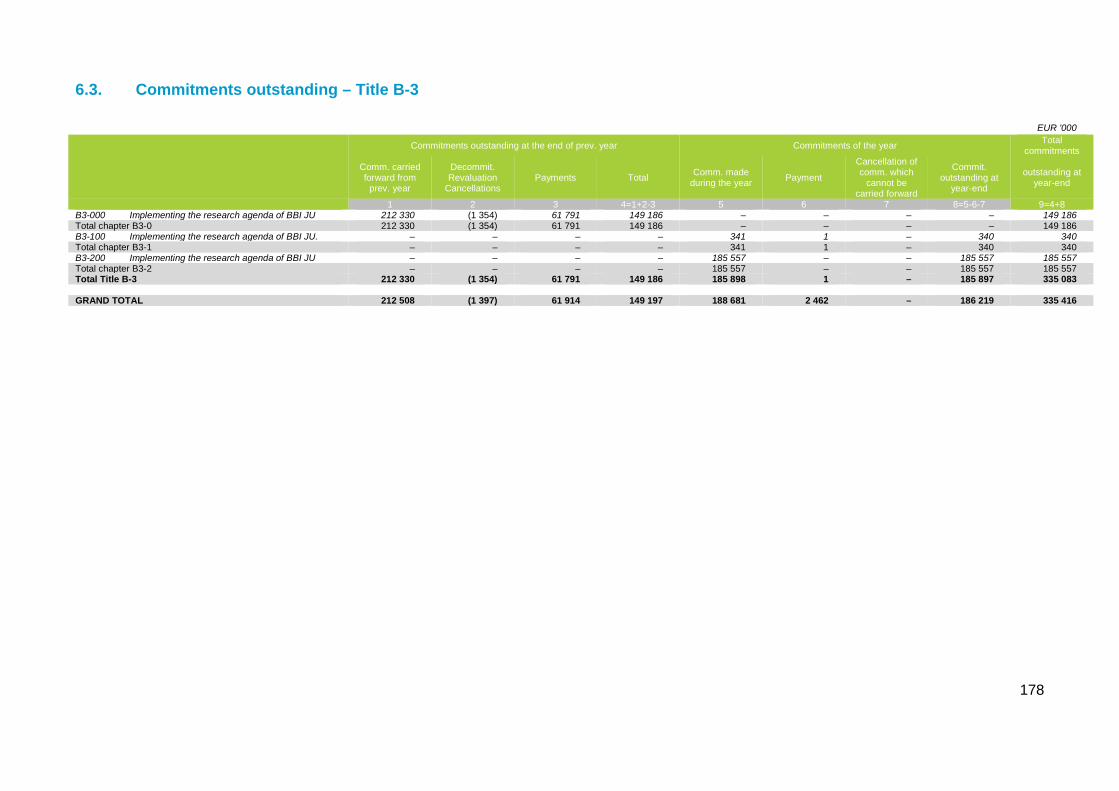
178
6.3. Commitments outstanding – Title B-3
EUR '000
Commitments outstanding at the end of prev. year Commitments of the year Total commitments
Comm. carried forward from
prev. year
Decommit. Revaluation
Cancellations Payments Total Comm. made
during the year Payment
Cancellation of comm. which
cannot be carried forward
Commit. outstanding at
year-end
outstanding at year-end
1 2 3 4=1+2-3 5 6 7 8=5-6-7 9=4+8 B3-000 Implementing the research agenda of BBI JU 212 330 (1 354) 61 791 149 186 – – – – 149 186 Total chapter B3-0 212 330 (1 354) 61 791 149 186 – – – – 149 186 B3-100 Implementing the research agenda of BBI JU. – – – – 341 1 – 340 340 Total chapter B3-1 – – – – 341 1 – 340 340 B3-200 Implementing the research agenda of BBI JU – – – – 185 557 – – 185 557 185 557 Total chapter B3-2 – – – – 185 557 – – 185 557 185 557 Total Title B-3 212 330 (1 354) 61 791 149 186 185 898 1 – 185 897 335 083 GRAND TOTAL 212 508 (1 397) 61 914 149 197 188 681 2 462 – 186 219 335 416
179
7. ANNUAL ACCOUNTS GLOSSARY
Termnitn
ABAC
This is the name given to the Commission’s accounting system, which since 2005 has been enriched by accrual accounting rules. Apart from the cash-based budget accounts, the Commission produces accrual-based accounts which recognise revenue when earned, rather than when collected. Expenses are recognised when incurred rather than when paid. This contrasts with cash basis budgetary accounting that recognises transactions and other events only when cash is received or paid.
Accounting
The act of recording and reporting financial transactions, including the creation of the transaction, its recognition, processing, and summarisation in the financial statements.
Administrative appropriations
Administrative appropriations cover the running costs of the Institutions and entities (staff, buildings, office equipment).
Adjustment
Amending budget or transfer of funds from one budget item to another
Adopted budget
Draft budget becomes the adopted budget as soon as it is approved by the Budgetary Authority.Cf. Budget.
Agencies
EU bodies having a distinct legal personality, and to whom budget implementing powers may be delegated under strict conditions. They are subject to a distinct discharge from the discharge authority.
Amending budget
Decision adopted during the budget year to amend (increase, decrease, transfer) aspects of the adopted budget of that year.
Annuality
The budgetary principle according to which expenditure and revenue is programmed and authorised for one year, starting on 1 January and ending on 31 December.
Appropriations
Budget funding. The budget forecasts both commitments (legal pledges to provide finance, provided that certain conditions are fulfilled) and payments (cash or bank transfers to the beneficiaries). Appropriations for commitments and payments often differ — differentiated appropriations — because multiannual programmes and projects are usually fully committed in the year they are decided and are paid over the years as the implementation of the programme and project progresses. Non-differentiated appropriations apply to administrative expenditure, for agricultural market support and direct payments and commitment appropriations equal payment appropriations.
Assigned revenue External/Internal
Dedicated revenue received to finance specific items of expenditure. Main sources of external assigned revenue are financial contributions from third countries to programmes financed by the Union. Main sources of internal assigned revenue is revenue from third parties in respect of goods, services or work supplied at their request; (c) revenue arising from the repayment of amounts wrongly paid and revenue from the sale of publications and films, including those on an electronic medium. The complete list of items constituting assigned revenue is given in the Financial Regulation Art.21.2.
Authorising Officer (AO)
The AO is responsible in each institution for authorising revenue and expenditure operations in accordance with the principles of sound financial management and for ensuring that the requirements of legality and regularity are complied with.
180
Budget
Annual financial plan, drawn up according to budgetary principles, that provides forecasts and authorises, for each financial year, an estimate of future costs and revenue and expenditures and their detailed description and justification, the latter included in budgetary remarks.
Budget result
The difference between income received and amounts paid, including adjustments for carry-overs, cancellations and exchange rate differences. The resulting amount will have to be reimbursed to the funding authority as provided in the Financial Regulation for Agencies.
Budget implementation
Consumption of the budget through expenditure and revenue operations.
Budget item / Budget line / Budget position
As far as the budget structure is concerned, revenue and expenditure are shown in the budget in accordance with a binding nomenclature which reflects the nature and purpose of each item, as imposed by the budgetary authority. The individual headings (title, chapter, article or item) provide a formal description of the nomenclature.
Budgetary authority
Institutions with decisional powers on budgetary matters: the European Parliament and the Council of Ministers
Budgetary commitment
A budgetary commitment is a reservation of appropriations to cover for subsequent expenses.
Cancellation of appropriations
Unused appropriations that may no longer be used.
Carryover of appropriations
Exception to the principle of annuality in so far as appropriations that could not be used in a given budget year may, under strict conditions, be exceptionally carried over for use during the following year.
Commitment appropriations
Commitment appropriations cover the total cost of legal obligations (contracts, grant agreements/decisions) that could be signed in the current financial year. Art. 7 FR: Commitment appropriations cover the total cost in the current financial year of legal obligations (contracts, grant agreements/decisions) entered into for operations extending over more than one year.
De-commitment
Cancellation of a reservation of appropriations
Differentiated appropriations
Differentiated appropriations are used to finance multiannual operations; they cover, for the current financial year, the total cost of the legal obligations entered into for operations whose implementation extends over more than one financial year. Art. 7 FR: Differentiated appropriations are entered for multiannual operations. They consist of commitment appropriations and payment appropriations.
Earmarked revenue
Revenue earmarked for a specific purpose, such as income from foundations, subsidies, gifts and bequests, including the earmarked revenue specific to each institution. (Cf. Assigned revenue)
Economic result
Impact on the balance sheet of expenditure and revenue based on accrual accounting rules.
Entitlements established
Entitlements are recovery orders that the European Union must establish for collecting income.
181
Exchange rate difference
The difference resulting from currency exchange rates applied to the transactions concerning countries outside the euro area, or from the revaluation of assets and liabilities in foreign currency at the closure.
Expenditure
Term used to describe spending the budget from all types of funds sources.
Financial regulation (FR)
Adopted through the ordinary legislative procedure after consulting the European Court of Auditors, this regulation lays down the rules for the establishment and implementation of the general budget of the European Union. (OJ L 298, 26.10.2012)
Funds Source
Type of appropriations (e.g.: C1, C2, etc.)
Grants
Direct financial contributions, by way of donation, from the budget in order to finance either an action intended to help achieve an objective part of an EU policy or the functioning of a body which pursues an aim of general European interest or has an objective forming part of an EU policy.
Implementation
Cf. Budget implementation
Income
Cf. Revenue
Joint Undertakings (JUs)
A legal EU-body established under the TFEU. The term can be used to describe any collaborative structure proposed for the "efficient execution of Union research, technological development and demonstration programmes".
Lapsing appropriations
Unused appropriations to be cancelled at the end of the financial year. Lapsing means the cancellation of all or part of the authorisation to make expenditures and/or incur liabilities which is represented by an appropriation.
Legal base (basic act)
The legal base or basis is, as a general rule, a law based on an article in the Treaty giving competence to the Community for a specific policy area and setting out the conditions for fulfilling that competence including budget implementation. Certain Treaty articles authorise the Commission to undertake certain actions, which imply spending, without there being a further legal act.
Legal commitment
A legal commitment establishes a legal obligation towards third parties.
Non-differentiated appropriations
Non-differentiated appropriations are for operations of an annual nature. (Art. 9 FR). In the EU-Budget non-differentiated appropriations apply to administrative expenditure, for agricultural market support and direct payments
Operational appropriations
Operational appropriations finance the different policies, mainly in the form of grants or procurement.
Outstanding commitment
Legal commitments having not fully given rise to liquidation by payments. Cf. RAL.
Outturn
Cf. Budget result
182
Payment
A payment is a cash disbursement to honour legal obligations.
Payment appropriations
Payment appropriations cover expenditure due in the current year, arising from legal commitments entered in the current year and/or earlier years (Art. 7 FR).
RAL Sum of outstanding commitments. Outstanding commitments (or RAL, from the French ‘reste à liquider’) are defined as the amount of appropriations committed that have not yet been paid. They stem directly from the existence of multiannual programmes and the dissociation between commitment and payment appropriations. (Cf. Outstanding commitments)
Recovery The recovery order is the procedure by which the Authorising officer (AO) registers an entitlement by the Commission in order to retrieve the amount which is due. The entitlement is the right that the Commission has to claim the sum which is due by a debtor, usually a beneficiary.
Result
Cf. Outturn
Revenue
Term used to describe income from all sources financing the budget.
Rules of application
Detailed rules for the implementation of the financial regulation. They are set out in a Commission regulation adopted after consulting all institutions and cannot alter the financial regulation upon which they depend.
Surplus
Positive difference between revenue and expenditure (see Budget result) which has to be returned to the funding authority as provided in the Financial Regulation.
Transfer
Transfers between budget lines imply the relocation of appropriations from one budget line to another, in the course of the financial year, and thereby they constitute an exception to the budgetary principle of specification. They are, however, expressly authorised by the Treaty on the Functioning of the European Union under the conditions laid down in the Financial Regulation. The FR identifies different types of transfers depending on whether they are between or within budget titles, chapters, articles or headings and require different levels of authorization.

183
7.9. Materiality criteria Not applicable yet.

184
7.10. Results of technical review Not applicable yet.
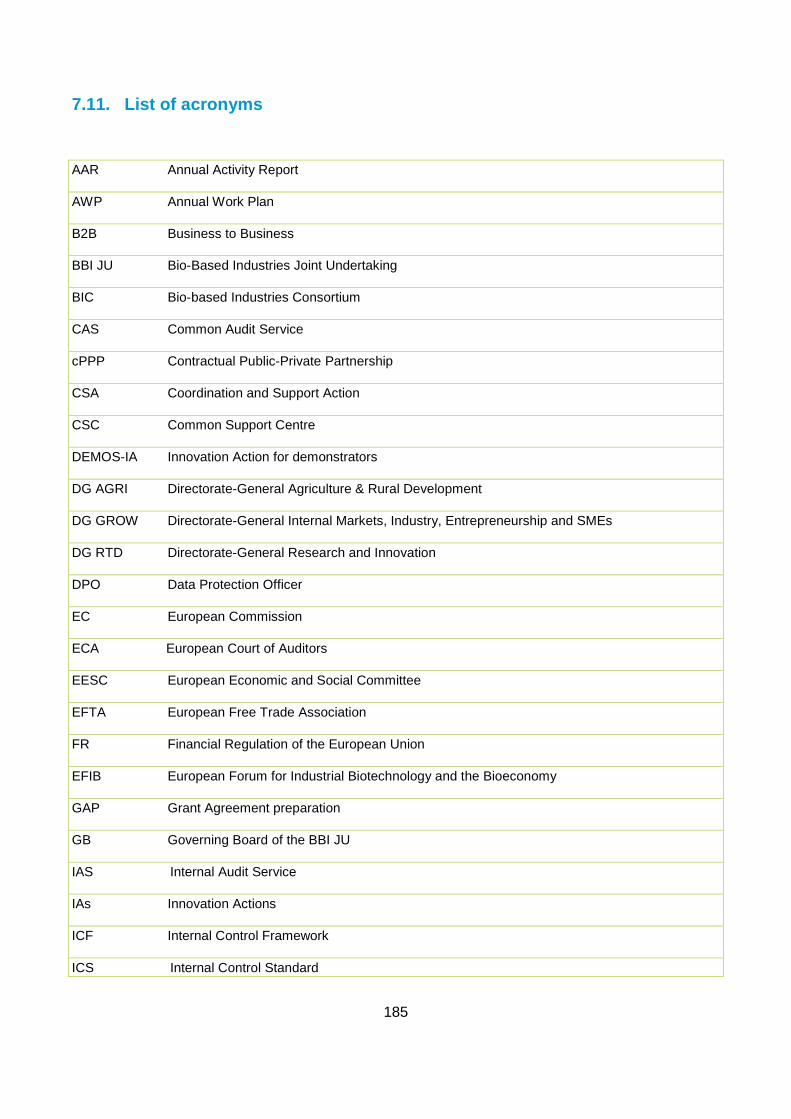
185
7.11. List of acronyms
AAR Annual Activity Report
AWP Annual Work Plan
B2B Business to Business
BBI JU Bio-Based Industries Joint Undertaking
BIC Bio-based Industries Consortium
CAS Common Audit Service
cPPP Contractual Public-Private Partnership
CSA Coordination and Support Action
CSC Common Support Centre
DEMOS-IA Innovation Action for demonstrators
DG AGRI Directorate-General Agriculture & Rural Development
DG GROW Directorate-General Internal Markets, Industry, Entrepreneurship and SMEs
DG RTD Directorate-General Research and Innovation
DPO Data Protection Officer
EC European Commission
ECA European Court of Auditors
EESC European Economic and Social Committee
EFTA European Free Trade Association
FR Financial Regulation of the European Union
EFIB European Forum for Industrial Biotechnology and the Bioeconomy
GAP Grant Agreement preparation
GB Governing Board of the BBI JU
IAS Internal Audit Service
IAs Innovation Actions
ICF Internal Control Framework
ICS Internal Control Standard
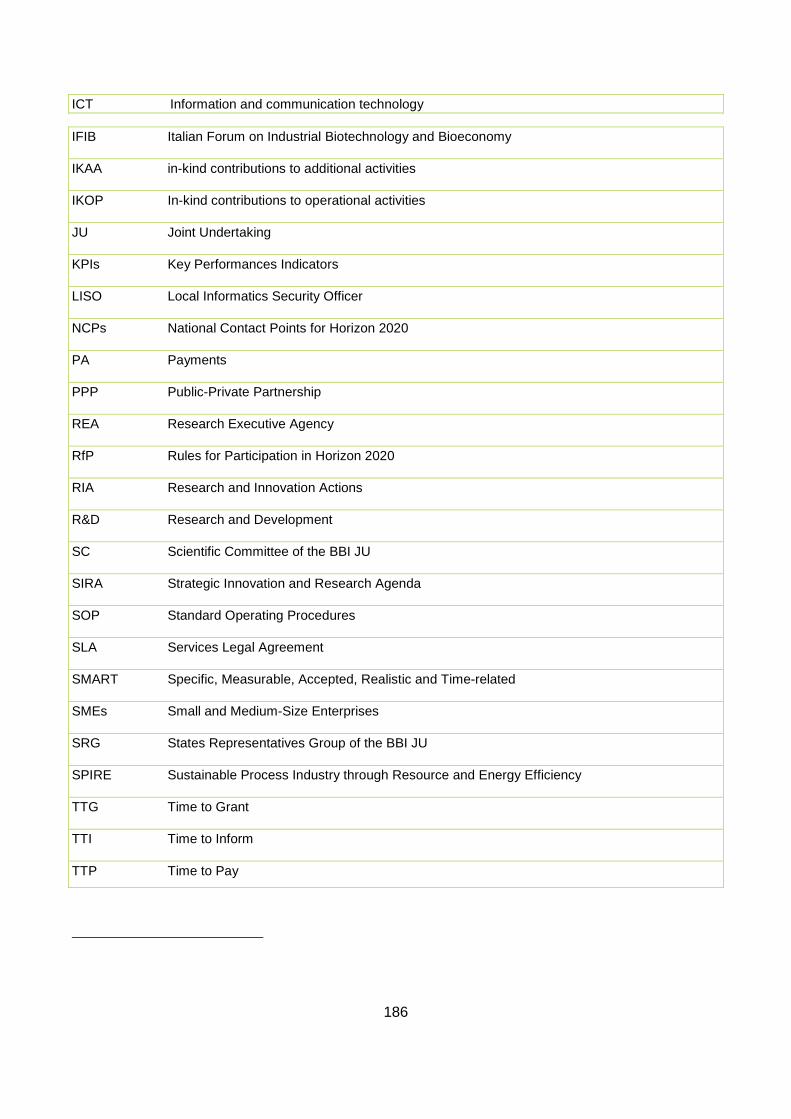
186
ICT Information and communication technology
IFIB Italian Forum on Industrial Biotechnology and Bioeconomy
IKAA in-kind contributions to additional activities
IKOP In-kind contributions to operational activities
JU Joint Undertaking
KPIs Key Performances Indicators
LISO Local Informatics Security Officer
NCPs National Contact Points for Horizon 2020
PA Payments
PPP Public-Private Partnership
REA Research Executive Agency
RfP Rules for Participation in Horizon 2020
RIA Research and Innovation Actions
R&D Research and Development
SC Scientific Committee of the BBI JU
SIRA Strategic Innovation and Research Agenda
SOP Standard Operating Procedures
SLA Services Legal Agreement
SMART Specific, Measurable, Accepted, Realistic and Time-related
SMEs Small and Medium-Size Enterprises
SRG States Representatives Group of the BBI JU
SPIRE Sustainable Process Industry through Resource and Energy Efficiency
TTG Time to Grant
TTI Time to Inform
TTP Time to Pay