Embed Size (px)
Citation preview
Bi l i b ildiBio-aerosols in building drainage and plumbing
tsystems: cross contamination, monitoring
and prevention.
Dr Michael GormleyDrainage Research GroupSchool of the Built Environment Heriot-Watt UniversityEdinburgh

ContentsContents
The building drainage system as The building drainage system as a bioaerosol transmission route
Transmission study of the drainage system of a hospitaldrainage system of a hospital
Monitoring method for minimising Monitoring method for minimisingbioaerosol transmission from the drainage systemdrainage system

IntroductionBio-aerosols- what are they?y
Bioaerosols are defined as airborne particles, largemolecules or volatile compounds that are living, containliving organisms or were released from livingliving organisms or were released from livingorganisms. The size of a bioaerosol particle may varyfrom 100 microns to 0.01 micron. The behaviour ofbioaerosols is governed by the principles of gravitation,electromagnetism, turbulence and diffusion.

IntroductionRelative size of particles
100 microns
10 microns1 micron
0.01 microns
This is a scale representation of the relative size of pollen, pollen spores, bacteria and viruses. The scale of this diagram is roughly 8000:1. Each of the dots on this screen version represent 15 viruses or virions In this diagramdots on this screen version represent 15 viruses, or virions. In this diagram, approximately 100,000 of these virions fit within the 100 micron circle representing the pollen. In actuality, many millions of virions could fit within the cross-section of a pollen.

Bio-aerosol generation and detection
Bioaerosols, particularly those containing viruses are particularly difficult to isolate and identify.
This task is made even more difficult due to the unsteady nature of flows in building d i tdrainage systems.

Building drainage system: mechanisms for air flow and pressure transient generation
direction of air entrainmentflow and pressure transient generation
DischargingIncreased entrainedDischarging
appliance increases entrained airflow and generates
ti t i t
entrainedairflow
negative transients.
Trap seal depletion
Negative transient
depletionIncreased water
flow.

Building drainage system: mechanisms for air flow and pressure transient generationflow and pressure transient generation
operating appliance
Positive transient affects Trap seal
all trapsTrap seal
deflections
Airflow reduced due to stack base
surchargesurcharge

Pressure transients in system can cause traps to blow out-
http://www.youtube.com/watch?feature=player detailpage&v=d vNL
ture player_detailpage&v d_vNLMCZ9jQ
video
The attached video is anThe attached video is an extreme example – but it is real – most common symptom of smallersymptom of smaller pressure transients is bubbling through a trap, you may have seen this in y ya toilet bowl.

Airflow and pressure transient modelling- AIRNET and current limitations
A method of characteristics based numerical model.
Finite difference scheme
Developed and validated over 30 years at Heriot- Watt University – initiated by, and
ti t b i i d b th k f J hcontinues to be inspired by, the work of John Swaffield.

Building Drainage System modelling in AIRNET (3)
When
P
Δt = Δx
Δx A′ B′
C‐C+
(u+c)max
A
R S BC
0||42
tuufccuu
For C+ - Line PR
02
||41
D
uufccuu RRRRPRP
dx u c
when
dtu c
02
||41
2
Dtuufccuu SSSSPSP
For C- - Line PS Building drainage system boundary conditions
cudtdx
when
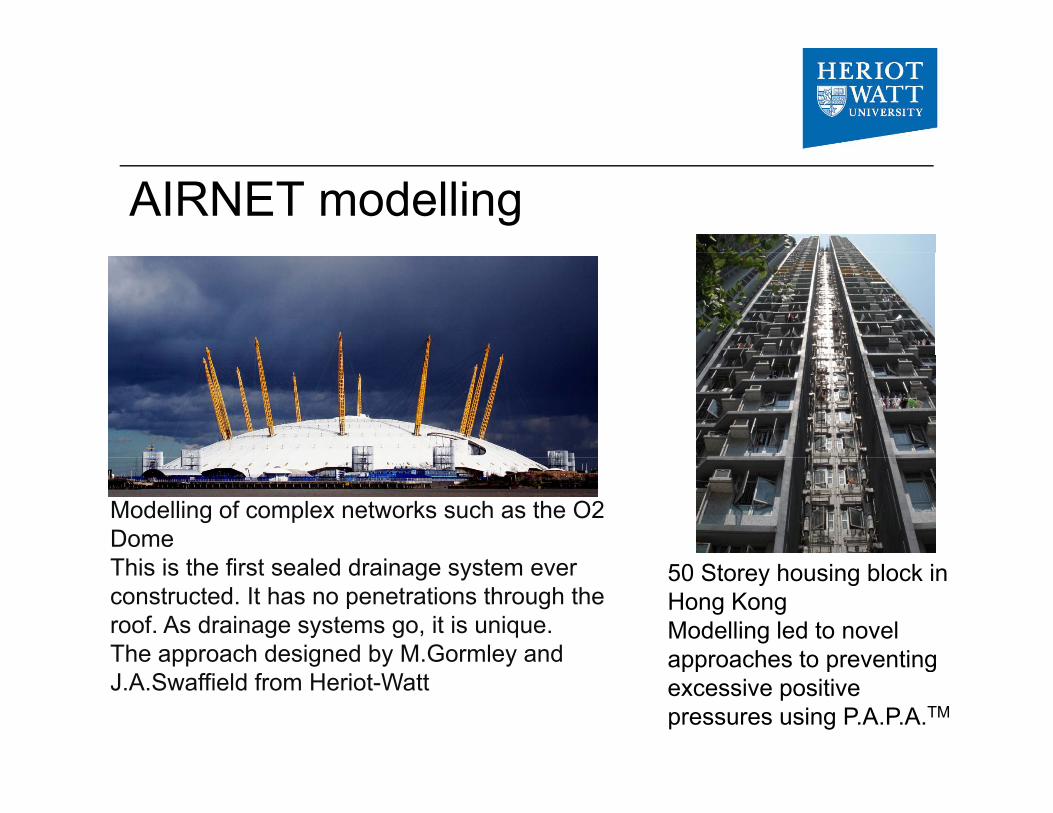
AIRNET modelling
Modelling of complex networks such as the O2 DomeThi i th fi t l d d i tThis is the first sealed drainage system ever constructed. It has no penetrations through the roof. As drainage systems go, it is unique.The approach designed by M.Gormley and
50 Storey housing block in Hong KongModelling led to novel approaches to preventingpp g y y
J.A.Swaffield from Heriot-Wattapproaches to preventing excessive positive pressures using P.A.P.A.TM

modelling air pressure and flow in large systems
St kSt k
W.c.
Roof lineStack termination
W.c.
Roof lineStack termination
Roof lineStack terminationRoof lineStack termination
Entrained air
W.c.
W.c.
‘Wet’ stackParallel vent
W.c.
W.c.
‘Wet’ stackParallel vent
W.c.
W.c.
W.c.
W.c.
W.c.
Roof lineStack termination
W.c.
Roof lineStack termination
air
Sewer connection
Wet stackParallel vent stack with cross connections Sewer
connection
Wet stackParallel vent stack with cross connections
W.c.
Sewer
‘Wet’ stackParallel vent stack with cross connections
W.c.
Sewer
‘Wet’ stackParallel vent stack with cross connectionsW c
W.c.
W c
W.c.W.c.
Roof lineStack termination
W.c.
Roof lineStack termination
connectionconnectionW.c.
Sewer connection
‘Wet’ stackParallel vent stack with cross connections
W.c.
Sewer connection
‘Wet’ stackParallel vent stack with cross connections
W.c.
W.c.
‘ ’
W.c.
W.c.
‘ ’
Combined waste fluids and waste in appliance
Sewer connection
‘Wet’ stackParallel vent stack with cross connections Sewer
connection
‘Wet’ stackParallel vent stack with cross connections
in appliance water flows

St kSt k
W.c.
Roof lineStack termination
W.c.
Roof lineStack termination
Roof lineStack terminationRoof lineStack termination
Potential contaminated air ingress if trap seal lost
W.c.
W.c.
‘Wet’ stackParallel vent
W.c.
W.c.
‘Wet’ stackParallel vent
W.c.
W.c.
W.c.
W.c.
W.c.
Roof lineStack termination
W.c.
Roof lineStack termination
p
Sewer connection
Wet stackParallel vent stack with cross connections Sewer
connection
Wet stackParallel vent stack with cross connections
W.c.
Sewer
‘Wet’ stackParallel vent stack with cross connections
W.c.
Sewer
‘Wet’ stackParallel vent stack with cross connectionsW c
W.c.
W c
W.c.W.c.
Roof lineStack termination
W.c.
Roof lineStack termination
connectionconnectionW.c.
Sewer connection
‘Wet’ stackParallel vent stack with cross connections
W.c.
Sewer connection
‘Wet’ stackParallel vent stack with cross connections
W.c.
W.c.
W.c.
W.c.
Airflow may be drawn from any of the connected sub – section drainage
Sewer connection
‘Wet’ stackParallel vent stack with cross connections Sewer
connection
‘Wet’ stackParallel vent stack with cross connections
sub section drainage systems – total interconnection.

Limitations
• Calculations do not include important pbioaerosol fluid dynamics such as;• Brownian Motion• Gravitation• Electrical Forces• Thermal Gradients & Electromagnetic Radiation• Turbulent Diffusion• Inertial Impaction• Inertial Impaction• Particle Shape
However• Flow direction and rate can be calculated –
approximations of likely bio-aerosol transport mechanisms can be made.

Modelling flow rate and direction
6
0
2
4
6om
, - d
own
stac
k,
nd
-8
-6
-4
-2
ned
airf
low
, + in
to r
oolit
res/
seco
n Modelling confirms the establishment of an air exchange between the bathroom and the vertical
-12
-10
0 5 10 15 20
Time, seconds.Entr
ain

The building drainage systemInterconnection- all parts of the building are interconnectedinterconnected
3F
4F
2F
3F
Waste water from other hospital
b ildi i GF
1F
buildings i.e. labs, morgue.
GF
To main sewer

The building drainage systemSARS OutbreakSARS Outbreak
Press Release WHO/70
“droplets originating from virus
26 September 2003:
droplets originating from virus-rich excreta…re-entered into
residents apartments via sewage and drainage systems where there were strong upwards air flows, inadequate ‘traps’ andflows, inadequate traps and non-functional water seals.”

SARS OutbreakTransmission routeTransmission route
Bioaerosols carried to adjacent buildings
by wind current
Bioaerosols transmittedBioaerosols transmitted to adjacent apartment
Infected person introduces virus to drainage system
Bioaerosols formed as waste is flushedas waste is flushed

The building drainage systemNew threatsNew threats
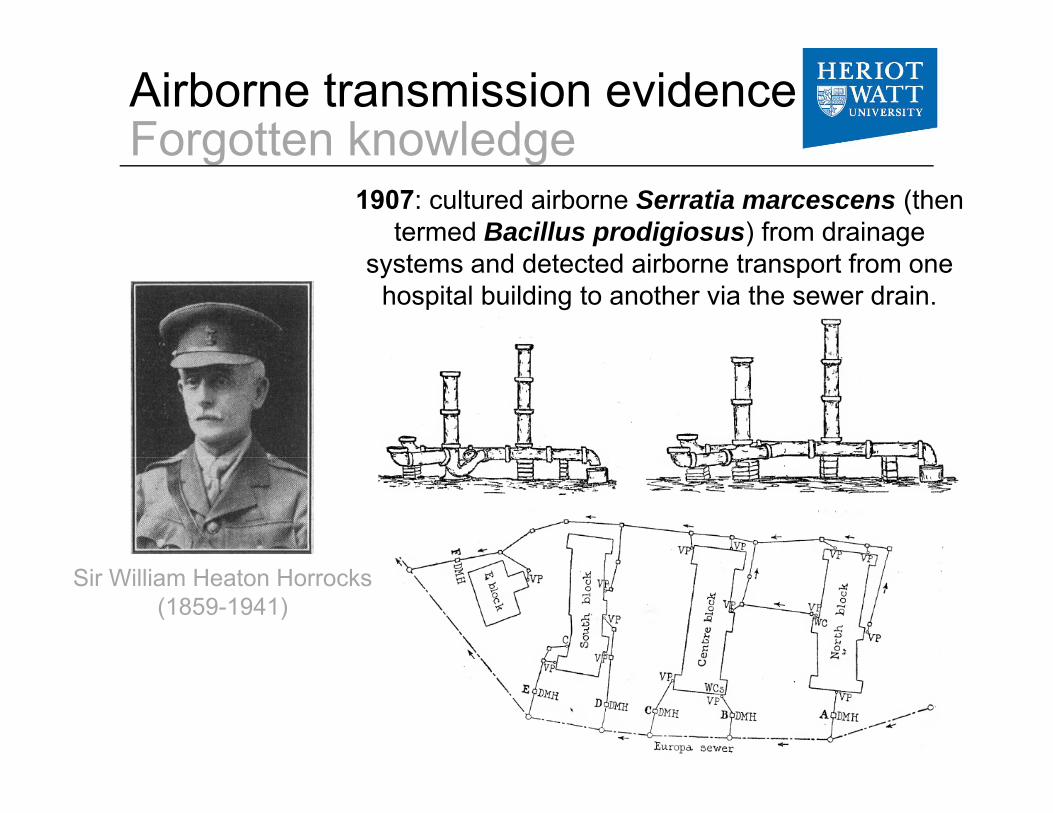
Airborne transmission evidenceForgotten knowledgeForgotten knowledge
1907: cultured airborne Serratia marcescens (then termed Bacillus prodigiosus) from drainage
systems and detected airborne transport from one hospital building to another via the sewer drain.
Sir William Heaton Horrocks(1859-1941)

Horrocks – In good companyThe Royal SocietyThe Royal Society
I N tIsaac Newton
Charles Babbage
James Watt

Horrocks – Other Successes
C fi d th t th f ‘M lt F ’• Confirmed that the cause of ‘Malta Fever’ was bacteria passed on through goats milk.
• Developed methods for testing and purifying drinking water
• Published book on bacteriology of water, one of the first of its kindof the first of its kind.
Horrocks, William Heaton (1901). An Introduction to the Bacteriological E amination of Waterto the Bacteriological Examination of Water. London: J. & A. Churchill.

Pathogen transmission studyHospital buildingHospital building
Environmental conditions
NorovirusOutbreak
3F
4F
2F
3F
Bioaerosoltransmission
Waste water from other hospital
b ildi i GF
1F
buildings i.e. labs, morgue.
GF
To main sewer Wastewater
contamination

Pathogen transmission studyHospital buildingHospital building
Air sampling
Pitot tube measuring downward airflow
Collection swab• Isolation of bioaerosols using collection swab (UTM-RT)
Static pressure tube • Temperature and humidity within
drainage stack (USB data logger)
• Air flow and direction (pitot tube)
Pitot tube measuring upward airflow
USB temperature & relative humidity data loggerWastewater sampling
• Collection of wastewater from main underground drain


Pathogen transmission studyReal Time Polymerase Chain ReactionReal Time Polymerase Chain Reaction
Samples extracted using NucliSens® easyMAG™ system
Ct ≤ 29 St iti tiCt ≤ 29 Strong positive reaction (abundant target nucleic acid)
Ct 30-37Positive reaction (moderate amount of target nucleic acid)
Amplification, detection and analysis performed in an ABI 7500 RT-PCR system
( g )Ct 38-40Weak reaction
(minimal amounts of target nucleic acid)

Pathogen transmission studyRT-PCR ResultsRT PCR Results
T t d tTest date Norovirus GI Norovirus GIISewer Stack 1 Stack 2 Stack 3 Sewer Stack 1 Stack 2 Stack 3
01/03/2011 U U U U U U U U10/03/2011 U U U U 2 U U U10/03/2011 U U U U 25 U U U16/03/2011 U U U U 25 U U U23/03/2011 U U U U 35 U U U30/03/2011 U U U U 40 U U U30/03/2011 U U U U 40 U U U05/04/2011* U U U U 37 U U U26/05/2011 N/A U U U N/A U U U
U UndetectedCt ≤ 29 Strong positive reaction (abundant target nucleic acid)Ct 30-37 Positive reaction (moderate amount of target nucleic acid)Ct 38 40 Weak reaction (minimal amounts of target nucleic acid)Ct 38-40 Weak reaction (minimal amounts of target nucleic acid)
*a swab of the inside surface of Stack 1 taken on this date also returned undetected for all tests

Pathogen transmission studyRT-PCR ResultsRT PCR Results
Samples were also tested for Clostridium deficile but was undetected.This was due to the fact that Cdiff produces spores which are not amenable to man of the PCR assa s a ailablemany of the PCR assays available.

CYCLE NUMBER AMOUNT OF DNA0 11 22 4
1400000000
1600000000
2 43 84 165 326 647 128
400000000
600000000
800000000
1000000000
1200000000
AM
OU
NT
OF
DN
A8 2569 512
10 1,02411 2,04812 4,09613 8 192
0
200000000
0 5 10 15 20 25 30 35
PCR CYCLE NUMBER
A13 8,19214 16,38415 32,76816 65,53617 131,07218 262,144
1000001000000
10000000100000000
100000000010000000000
T O
F D
NA
18 262,14419 524,28820 1,048,57621 2,097,15222 4,194,30423 8,388,608
110
1001000
10000
0 5 10 15 20 25 30 35
AM
OU
NT24 16,777,216
25 33,554,43226 67,108,86427 134,217,72828 268,435,45629 536 870 912
31
0 5 10 15 20 25 30 35
PCR CYCLE NUMBER29 536,870,91230 1,073,741,82431 1,400,000,00032 1,500,000,00033 1,550,000,00034 1,580,000,000

Pathogen transmission studyTemperature and Humidity
98
100
%)
Temperature and Humidity
94
96
Hum
idity
(% Average humidity = 96.6%
90
92
23/03/11 24/03/11 25/03/11 26/03/11 27/03/11 28/03/11 29/03/11 30/03/11 31/03/11D tDate
26
28
30
re (o
C ) Average temperature = 24.3%
22
24
26
Tem
pera
tu
2023/03/11 24/03/11 25/03/11 26/03/11 27/03/11 28/03/11 29/03/11 30/03/11 31/03/11
Date

Pathogen transmission studyAirflow results – this proves that the interconnection hypothesis is validvalid
30 Airflow Up
20Airflow Down
0
10
rate (l/s)
‐10
00 1 2 3 4 5 6
Airflow r
‐20
‐30Time (minutes)

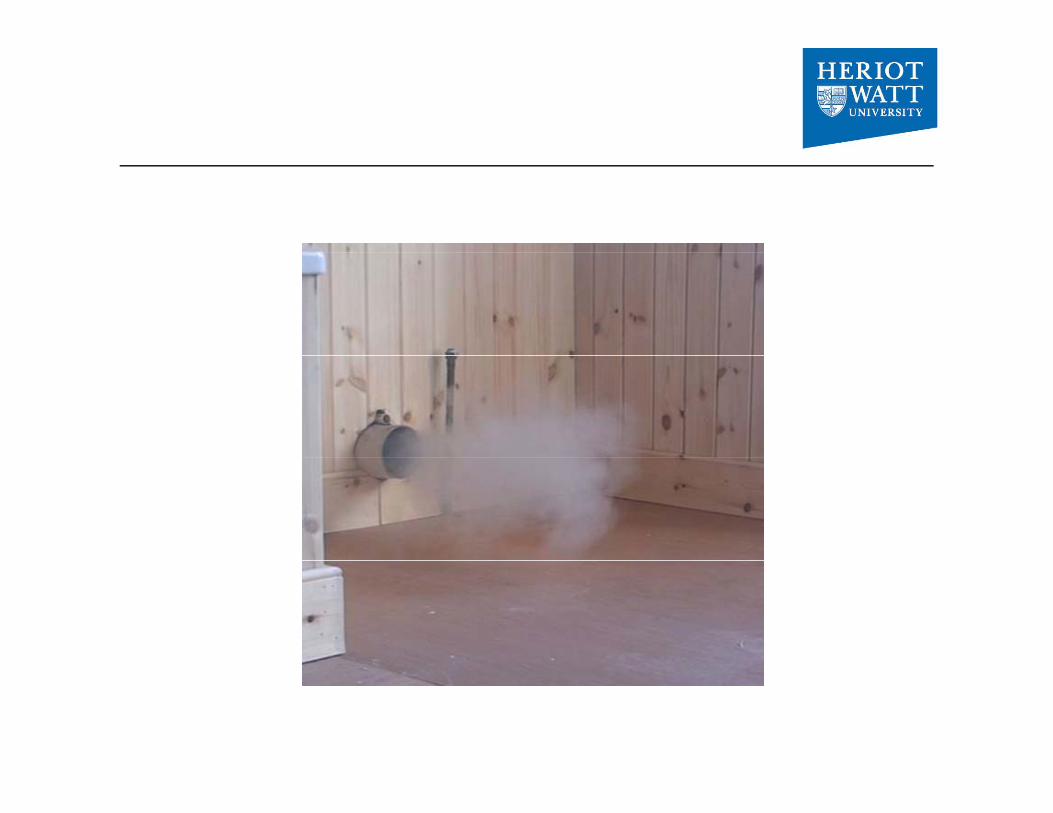
Additonal Domestic system testsDrainage System Schematic
Roof Level (height above collection drain = 10 m
Floor 3
Open pipe for testing (WC Removed) Simulates open trap Anemometer located here.
Bath & sink
Floor 2
Kitchen WC
To main sewer
Floor 1
2 x Bathrooms Utility room 2 x WCs
Smoke Pellets To main sewer inserted here
Collection drain


20
Air Flowrate
14
16
18
Note: Similar
10
12
ow ra
te (l/s)
AirFlow
Similar Airflows to those
4
6
8Airfl AirFlow
recorded in Amoy Gardens
0
2
4
0 500 1000 1500 2000 2500 3000 3500 40000 500 1000 1500 2000 2500 3000 3500 4000Time (secs)


The DYTEQTA SystemAutomated monitoring methodAutomated monitoring method
Defective fixture trap seals increase risk of bioaerosol transmission via the building drainage network
Dyteqta is a sonar-like method for establishing the status of each fixture trap seal in a building
Based on reflected wave theory
Using a sinusoidal air pressure a e ens res the test is nonwave ensures the test is non-
destructive
System validated by: modelling System validated by: modelling, laboratory investigations and extensive site testing

Case study BuildingsCase study Buildings

The DYTEQTA SystemCase studies
1
60
80
Case studiesTime change detection algorithm
0.5
20
40
r gau
ge)
0
-20
0
20
0.00 0.05 0.10 0.15 0.20 0.25 0.30 Dt >
h
re (m
m w
ater
-0.5
60
-40
-20
Pre
ssur
Defect free baseline
-1-80
-60
Time (seconds)
Test pressure responseDt > h
Is Dt > h over calibration period? NO, trace is reliable.Is Dt > h during test period? YES, at tD = 0.066 seconds.Depleted trap location? T12.

The DYTEQTA SystemCase studiesCase studies
60D d (AIRNET)
50
n (m
)
Dundee (AIRNET)Dundee (PROBE)Arrol (AIRNET)Arrol (PROBE)
30
40
ap lo
catio
n Arrol (PROBE)Glasgow (AIRNET)Glasgow (PROBE)
20
edic
ted
tra
0
10Pre
00 10 20 30 40 50 60
True trap location (m)

The building drainage systemTransmission of bioaerosolsTransmission of bioaerosols The building drainage system
interconnects all parts of a buildingg
Potential cross-transmission route for bio-aerosols.
Every building tested had empty water trap seals.
Healthcare building drains have a distinctly ‘hospital smell’ they do not y ynecessarily smell malodorous.
Norovirus GII isolated from t t l d f i d iwastewater sampled from main drain
of a hospital building, confirming contamination during an outbreak.

The building drainage systemTransmission of bioaerosolsTransmission of bioaerosols
Environmental conditions within theEnvironmental conditions within the drainage system are conducive to bio-aerosol circulation
Current work underway to replicate the Horrocks work reported in the Royal Society proceedings in 1907Royal Society proceedings in 1907 and extend the investigations on the identification of specific pathogens in airflows.
This work has confirmed that bacteria such as psuedomonas spp. Can be carried on airstreams inside a building drainage system.

Th k f li t iThank you for listening