Embed Size (px)
DESCRIPTION
Bio 12 - University of the Philippines Diliman Ecology and Evolution Post Lab from my Bio 12 prof
Citation preview
Biology 12 Laboratory
R.S. Gonzales, Ph.D.
Institute of Biology, UP Diliman
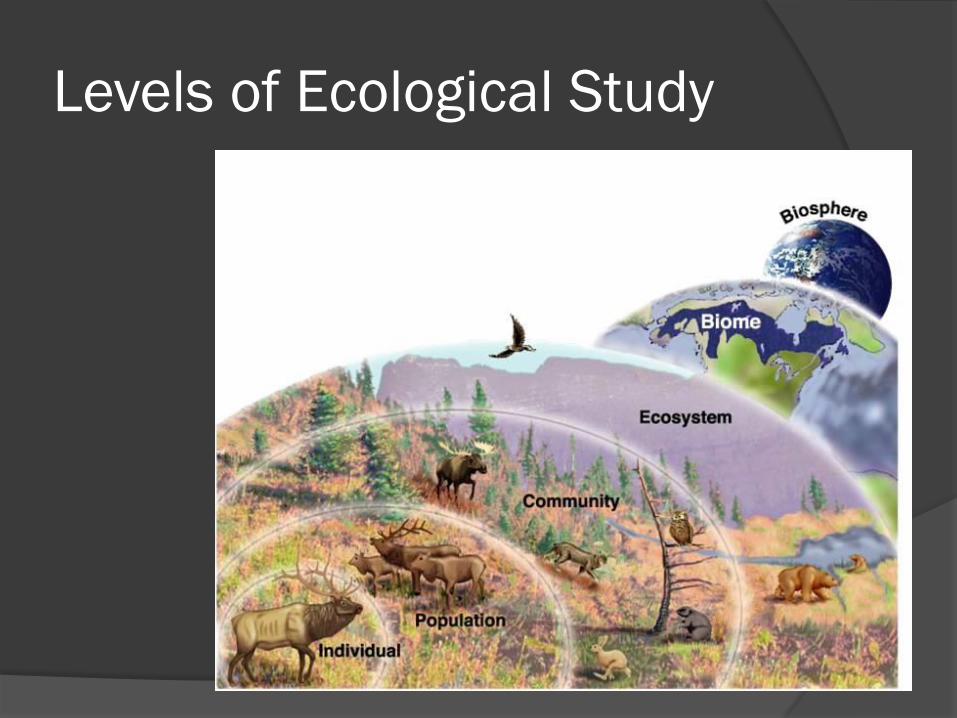
Levels of Ecological Study
Ecology of Individuals
Foraging involves decisions regarding the
allocation of time and energy
Principle of Allocation – If energy supply is limited, organism must compromise between competing demands for energy (growth and reproduction vs. defense)
Optimal foraging theory
Hypothesis: natural selection should favor efficient foragers, those individuals that maximize their energy or nutrient intake per unit of effort.
Foraging: what food to eat; where and how long to search; how to search.
Costs and benefits Cost: time and efforts on foraging
Benefit: survive and reproduce more, fitness
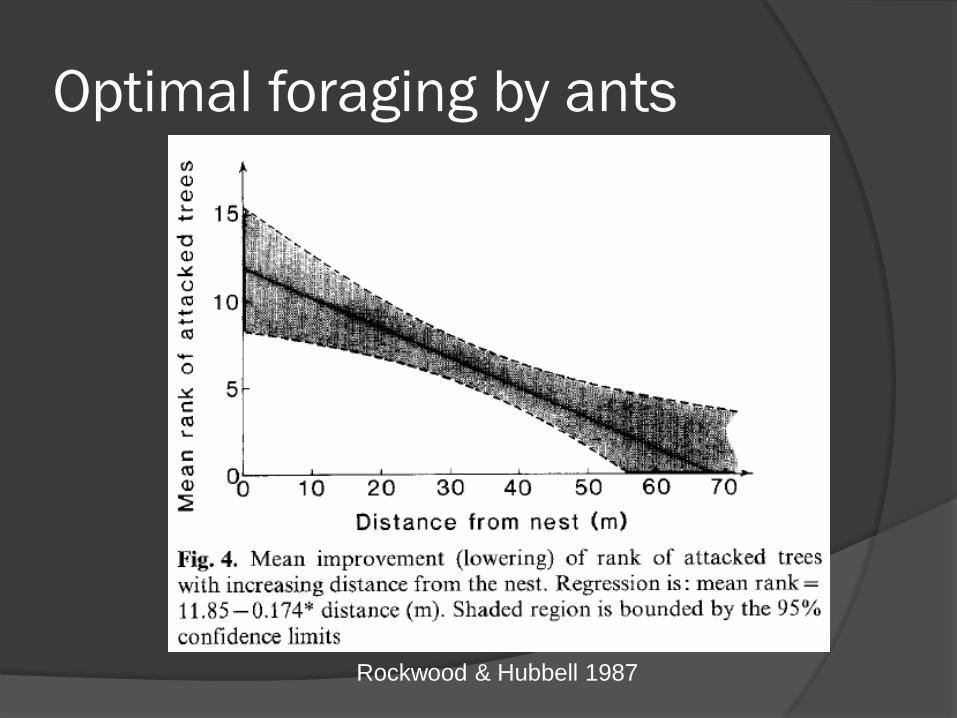
Optimal foraging by ants
Rockwood & Hubbell 1987
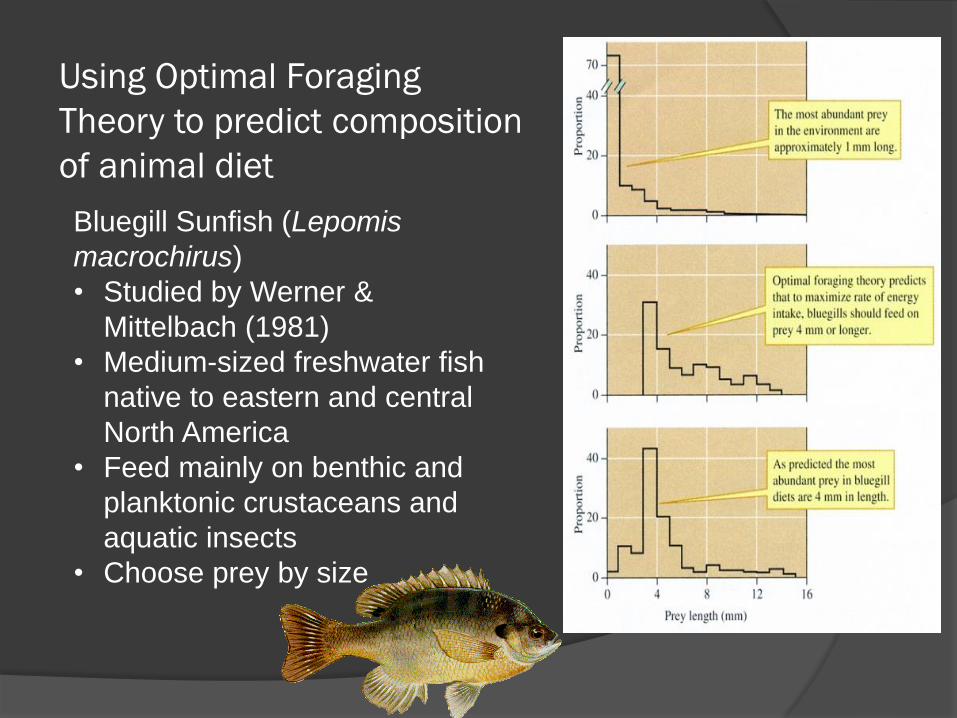
Using Optimal Foraging
Theory to predict composition
of animal diet
Bluegill Sunfish (Lepomis
macrochirus)
• Studied by Werner &
Mittelbach (1981)
• Medium-sized freshwater fish
native to eastern and central
North America
• Feed mainly on benthic and
planktonic crustaceans and
aquatic insects
• Choose prey by size
Population Ecology
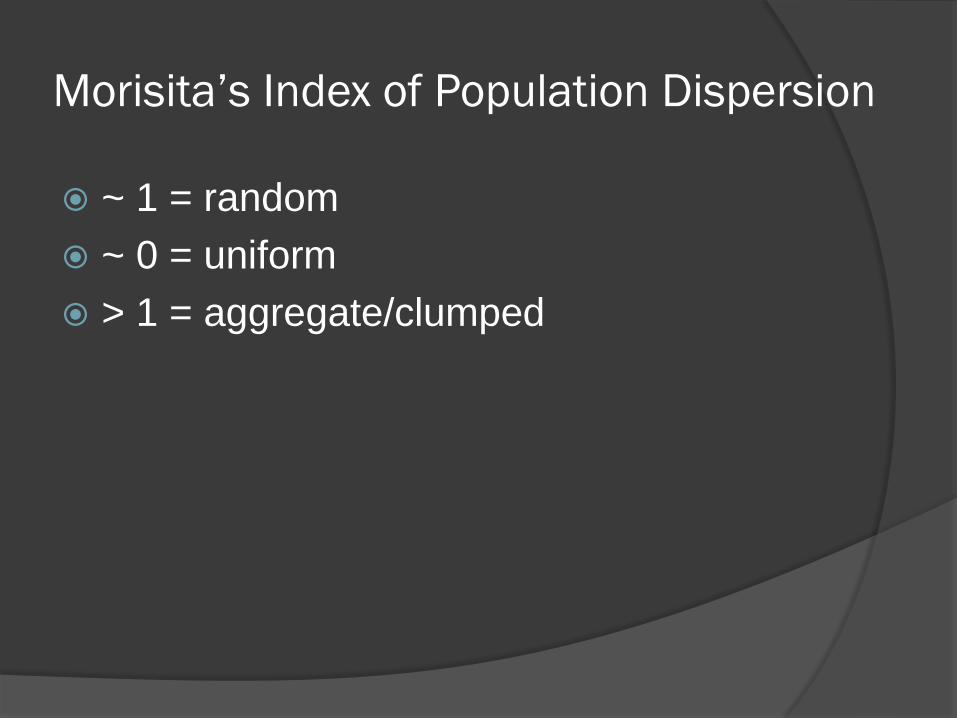
Morisita’s Index of Population Dispersion
~ 1 = random
~ 0 = uniform
> 1 = aggregate/clumped
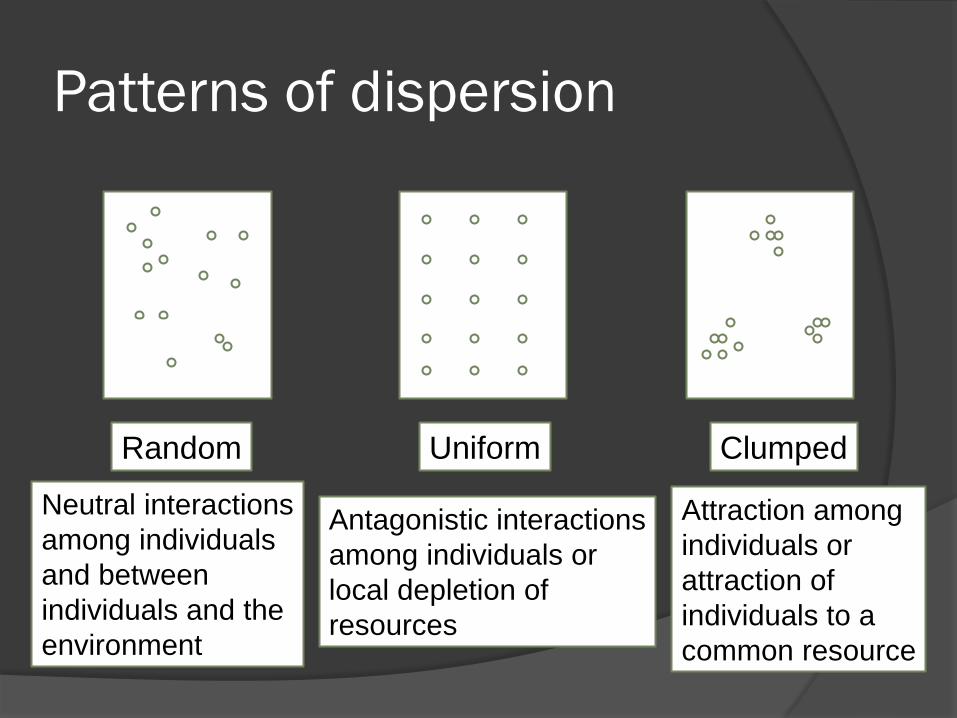
Patterns of dispersion
Random Uniform Clumped
Neutral interactions
among individuals
and between
individuals and the
environment
Antagonistic interactions
among individuals or
local depletion of
resources
Attraction among
individuals or
attraction of
individuals to a
common resource
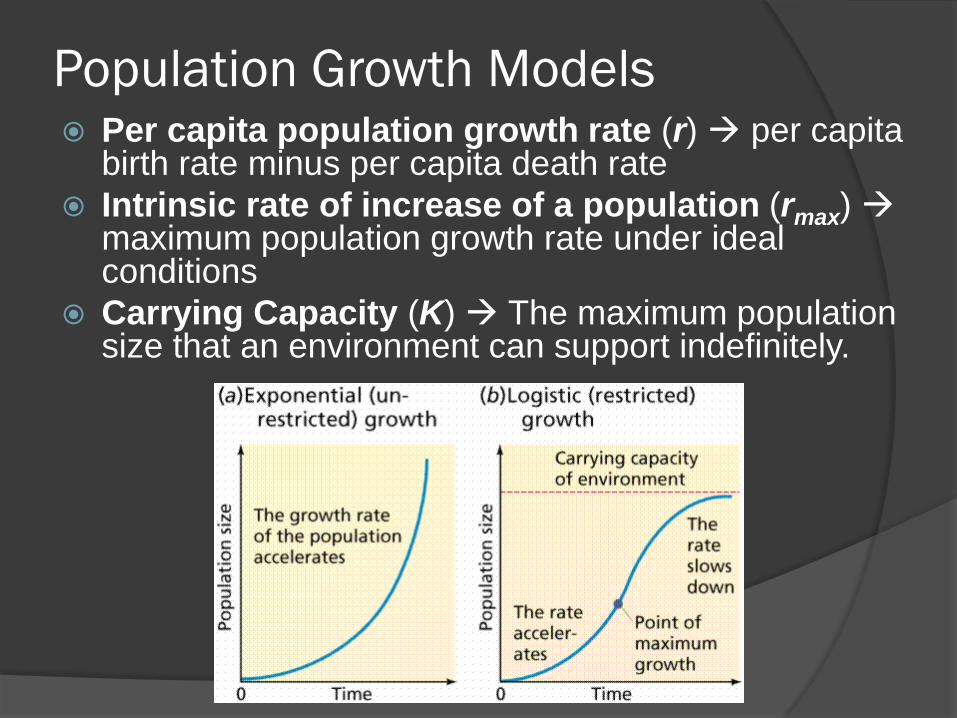
Population Growth Models Per capita population growth rate (r) per capita
birth rate minus per capita death rate
Intrinsic rate of increase of a population (rmax) maximum population growth rate under ideal conditions
Carrying Capacity (K) The maximum population size that an environment can support indefinitely.
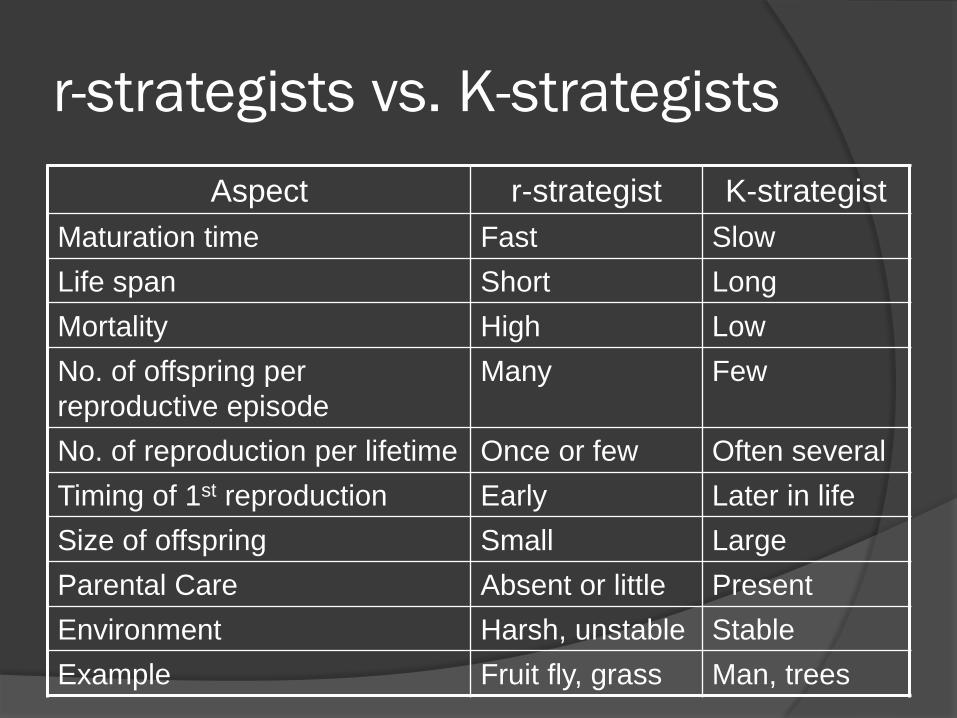
r-strategists vs. K-strategists
Aspect r-strategist K-strategist
Maturation time Fast Slow
Life span Short Long
Mortality High Low
No. of offspring per
reproductive episode
Many Few
No. of reproduction per lifetime Once or few Often several
Timing of 1st reproduction Early Later in life
Size of offspring Small Large
Parental Care Absent or little Present
Environment Harsh, unstable Stable
Example Fruit fly, grass Man, trees
Ecology of Interactions
Intraspecific and Interspecific
Competition
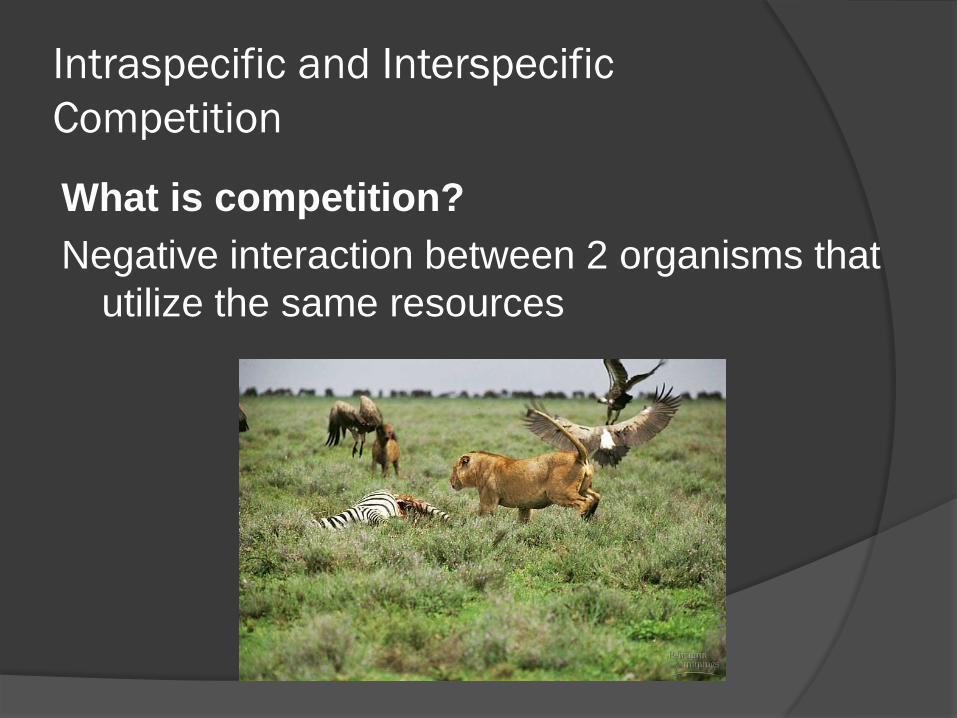
What is competition?
Negative interaction between 2 organisms that
utilize the same resources
Intraspecific vs. Interspecific
competition
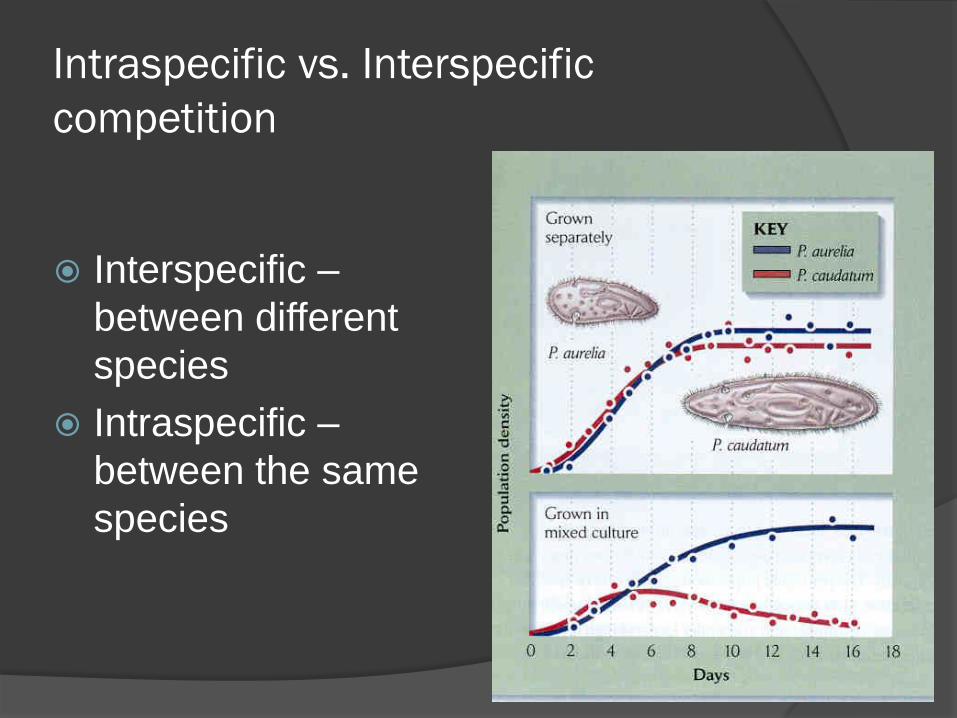
Interspecific –
between different
species
Intraspecific –
between the same
species
Ecological Niche
The ecological niche of a species
includes its habitat, role in the
community, and its position in
environmental gradients of temperature,
moisture, pH, soil and other conditions
of existence.
Competitive Exclusion Principle –
“complete competitors cannot co-exist”
Competition and the
Ecological Niche
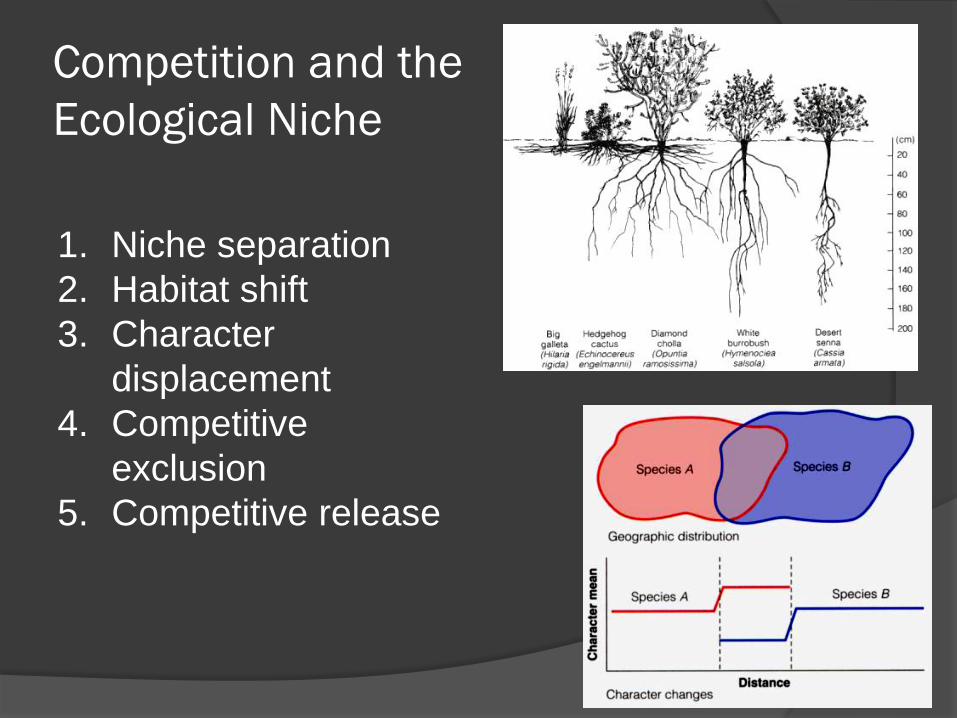
1. Niche separation
2. Habitat shift
3. Character
displacement
4. Competitive
exclusion
5. Competitive release
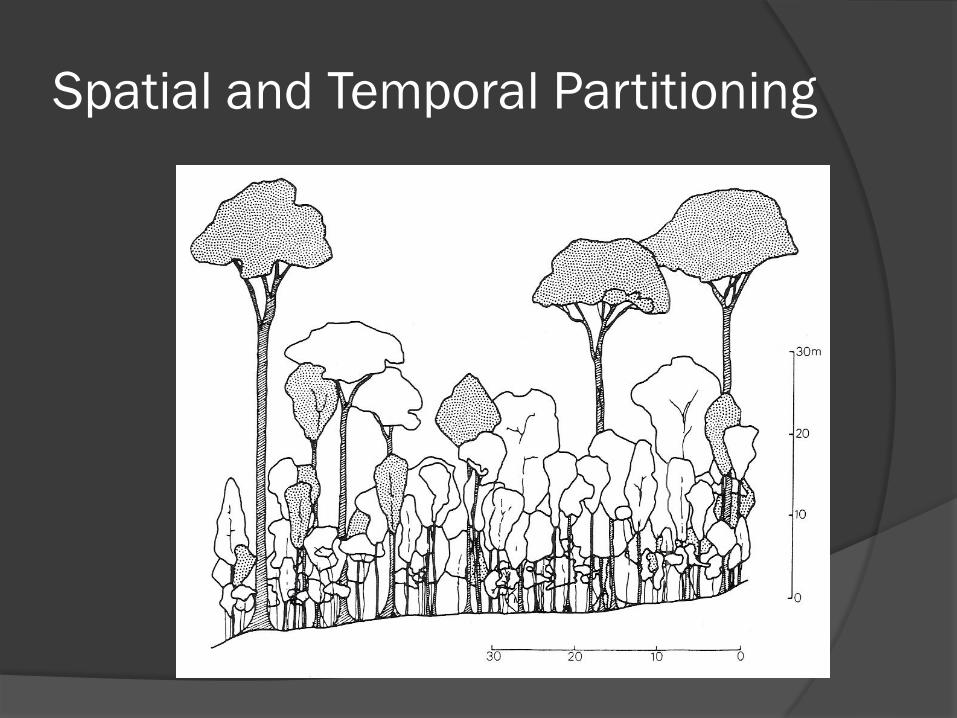
Spatial and Temporal Partitioning
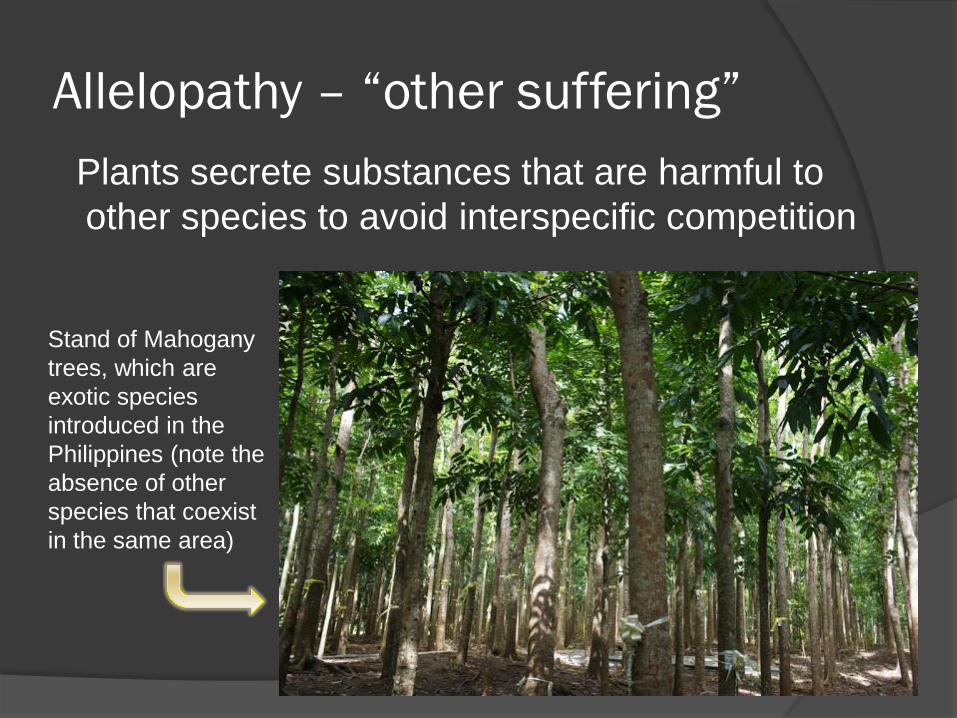
Allelopathy – “other suffering”
Plants secrete substances that are harmful to
other species to avoid interspecific competition
Stand of Mahogany
trees, which are
exotic species
introduced in the
Philippines (note the
absence of other
species that coexist
in the same area)
Community Ecology
Vegetation Analysis
What is species diversity?
The number and distribution of species in
a community
species richness – total number of species
per unit area or in a population
evenness – number of individuals of each
species per unit area or in a population
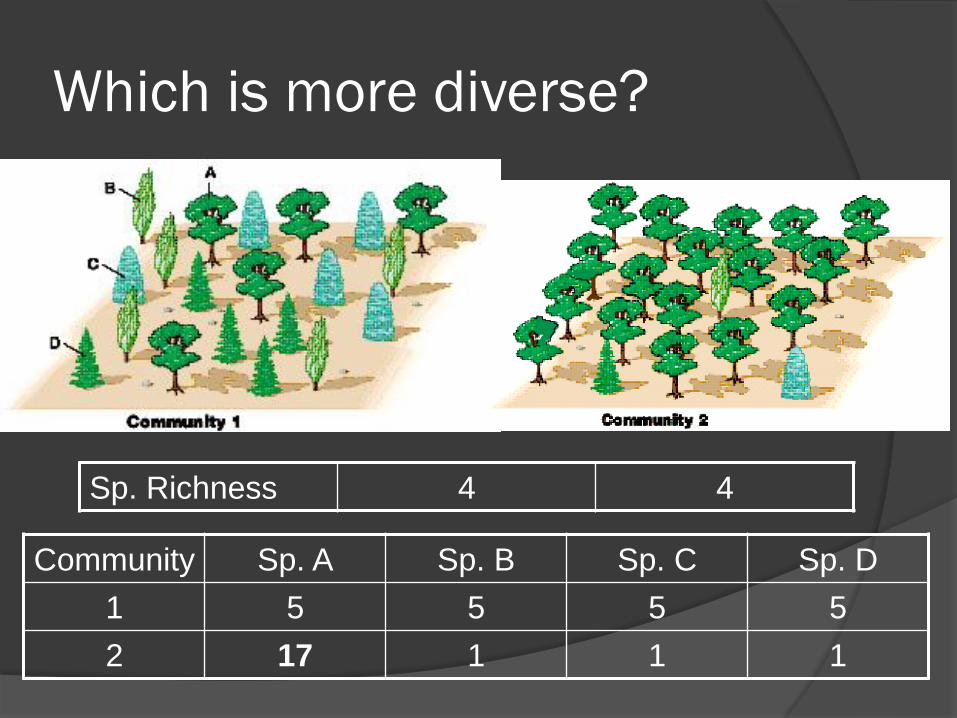
Which is more diverse?
Sp. Richness 4 4
Community Sp. A Sp. B Sp. C Sp. D
1 5 5 5 5
2 17 1 1 1
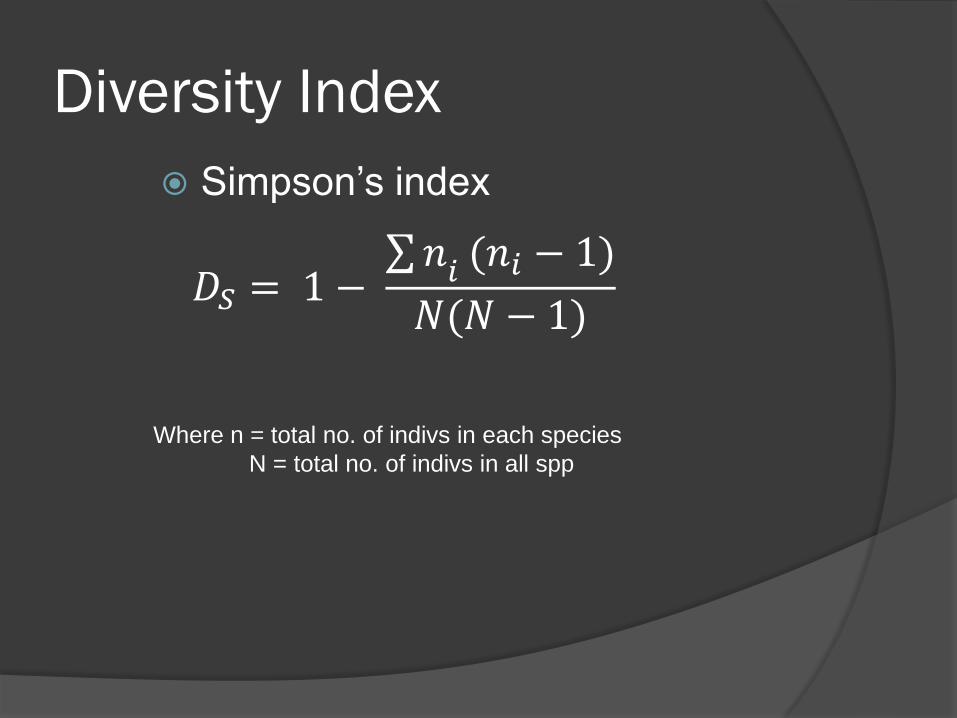
Diversity Index
Simpson’s index
Where n = total no. of indivs in each species
N = total no. of indivs in all spp
𝐷𝑆 = 1 − 𝑛𝑖 (𝑛𝑖 − 1)
𝑁(𝑁 − 1)
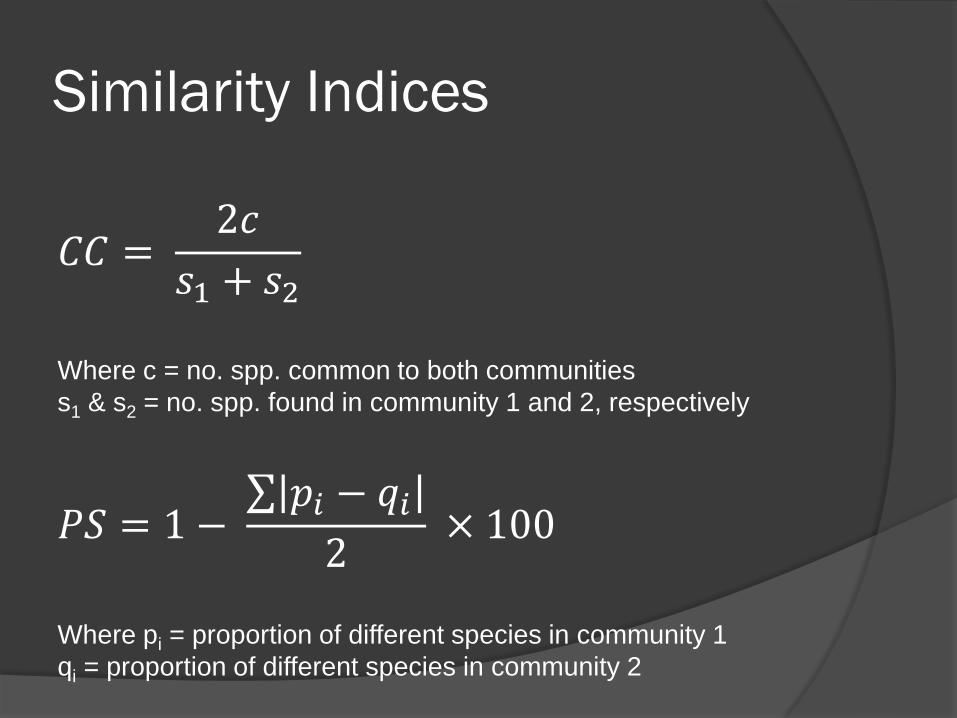
Similarity Indices
𝐶𝐶 = 2𝑐
𝑠1 + 𝑠2
Where c = no. spp. common to both communities
s1 & s2 = no. spp. found in community 1 and 2, respectively
𝑃𝑆 = 1 − 𝑝𝑖 − 𝑞𝑖
2 × 100
Where pi = proportion of different species in community 1
qi = proportion of different species in community 2

Ecosystem Ecology
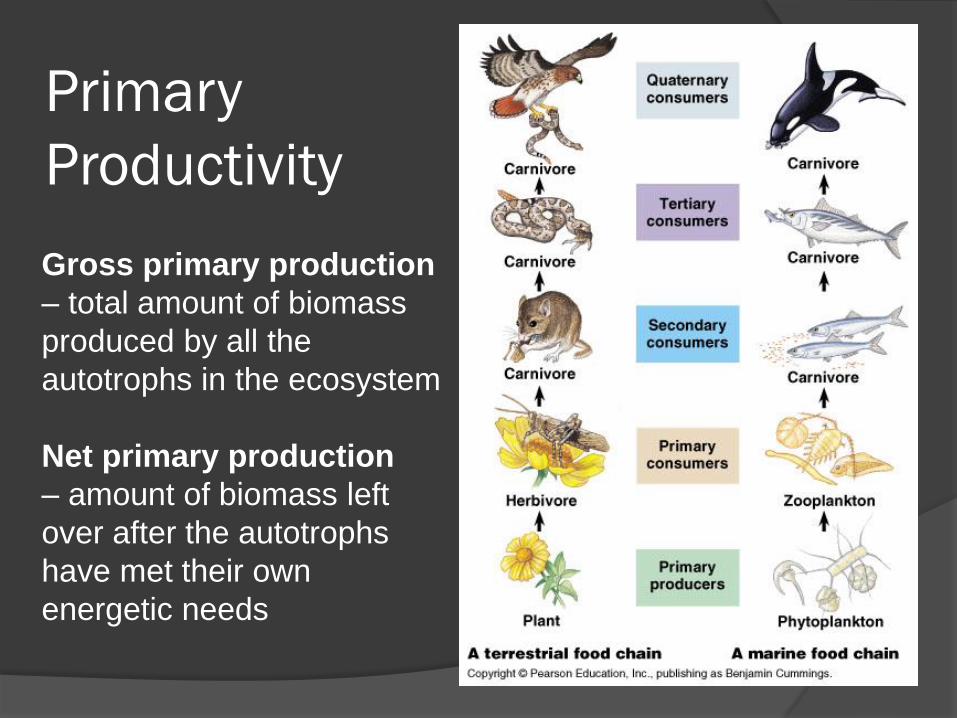
Primary
Productivity
Gross primary production
– total amount of biomass
produced by all the
autotrophs in the ecosystem
Net primary production
– amount of biomass left
over after the autotrophs
have met their own
energetic needs
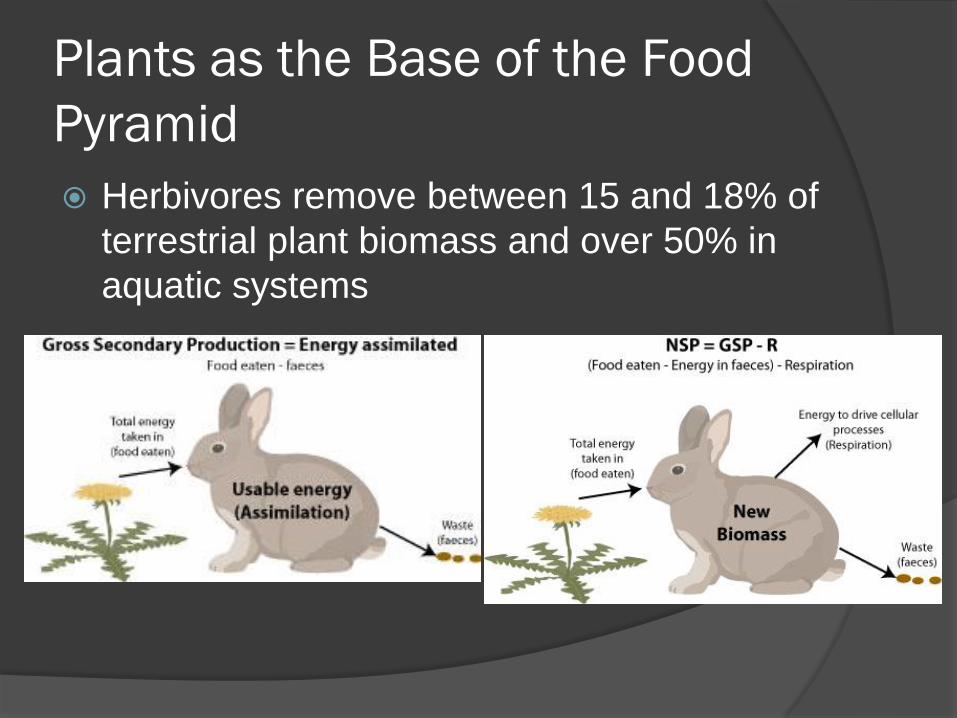
Plants as the Base of the Food
Pyramid
Herbivores remove between 15 and 18% of
terrestrial plant biomass and over 50% in
aquatic systems
Kinds of Food Pyramids
1. Pyramid of Numbers
2. Pyramid of Biomass
3. Pyramid of Energy
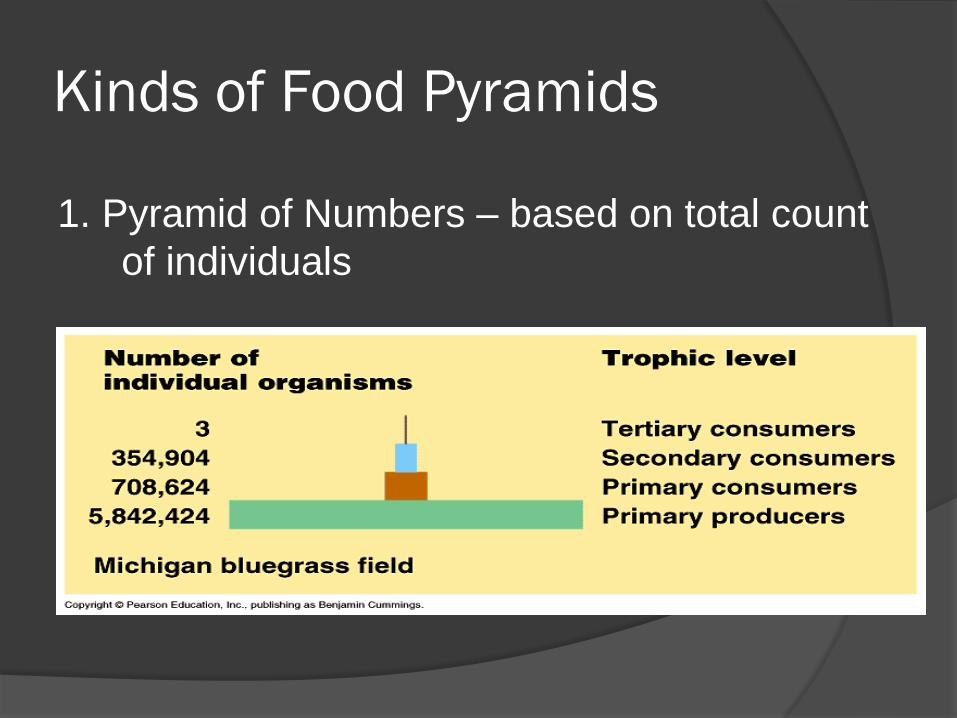
Kinds of Food Pyramids
1. Pyramid of Numbers – based on total count
of individuals
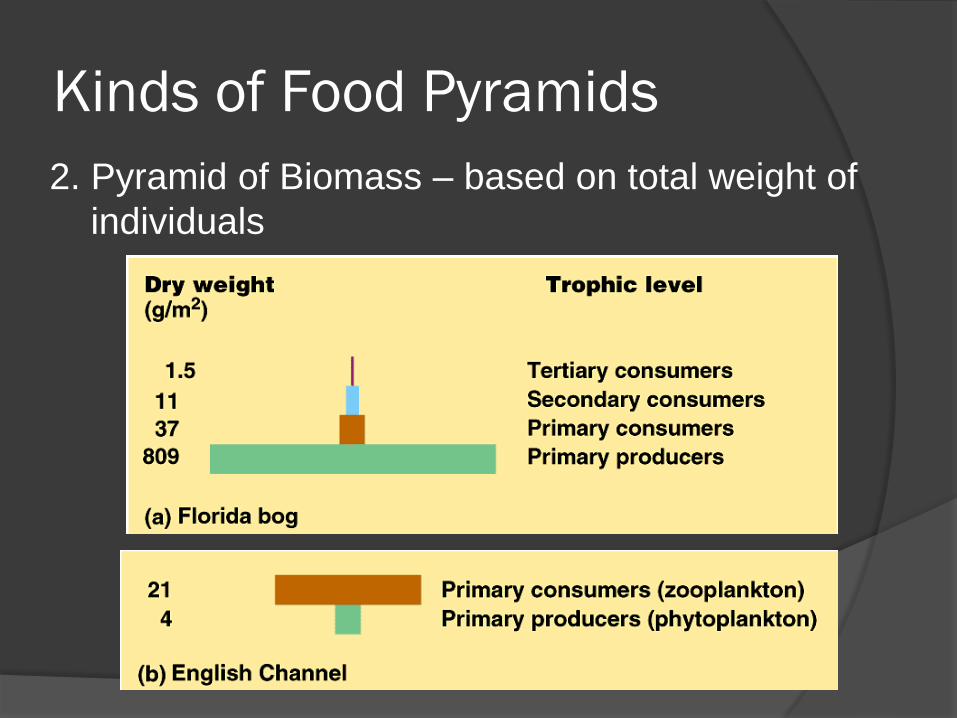
Kinds of Food Pyramids
2. Pyramid of Biomass – based on total weight of
individuals
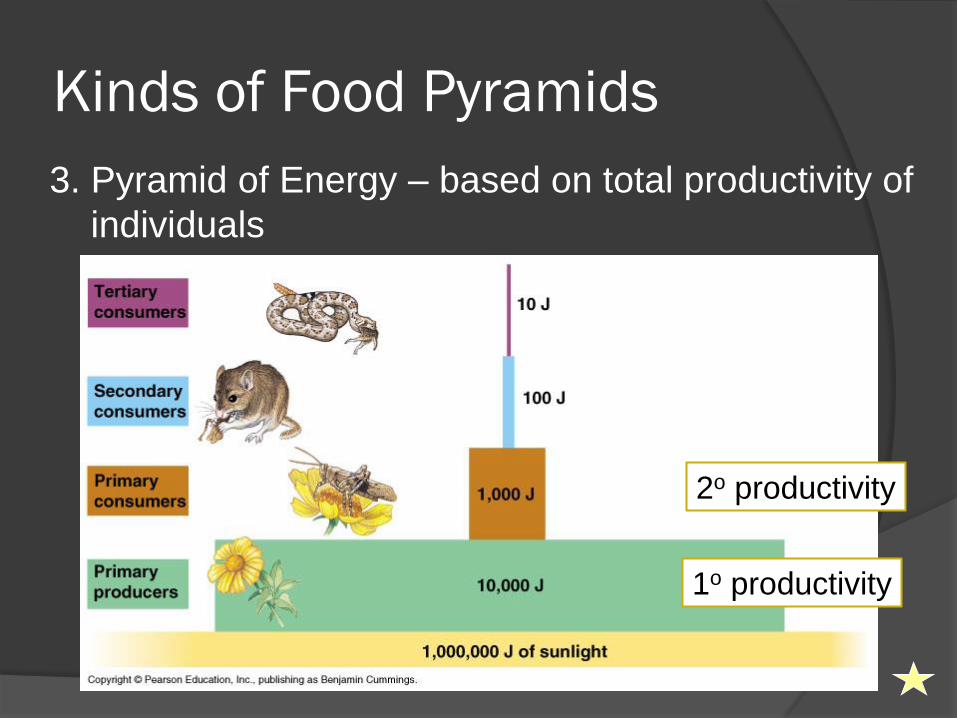
Kinds of Food Pyramids
3. Pyramid of Energy – based on total productivity of
individuals
1o productivity
2o productivity
Ecosystem Ecology
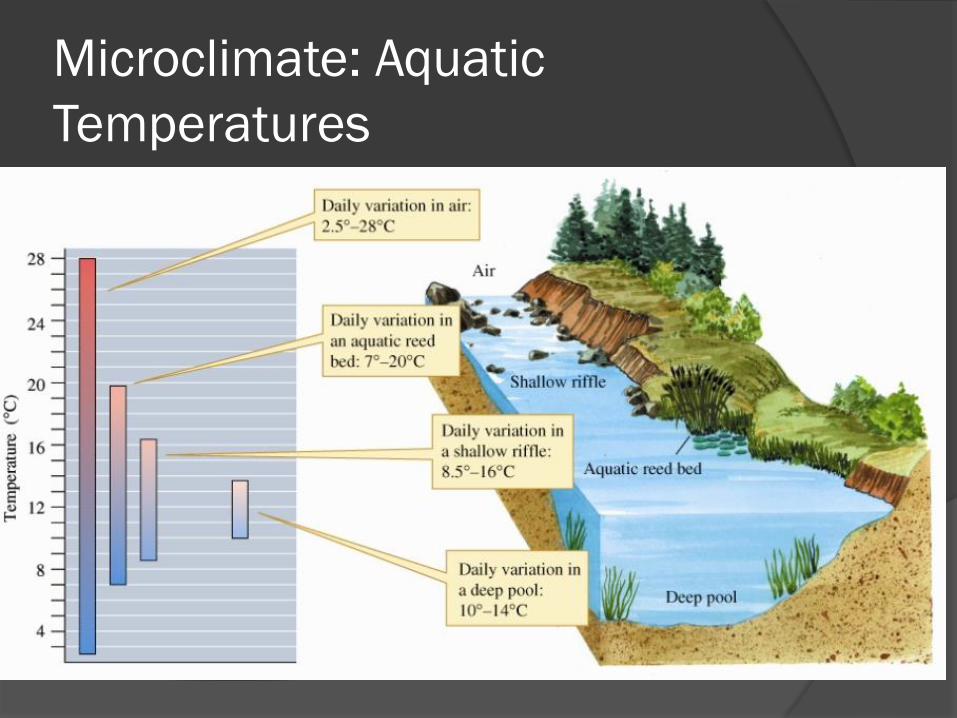
Microclimate: Aquatic
Temperatures
Relative Humidity (in %)
Absolute Humidity – water content of air
Relative Humidity = Actual vapor pressure
Saturation vapor pressure
AVP amount of water vapor in air
SVP maximum water vapor air can hold
inversely proportional to temperature
Indicator of the chance of rains. In hot summer weather, a rise in relative humidity increases the perceived temperature
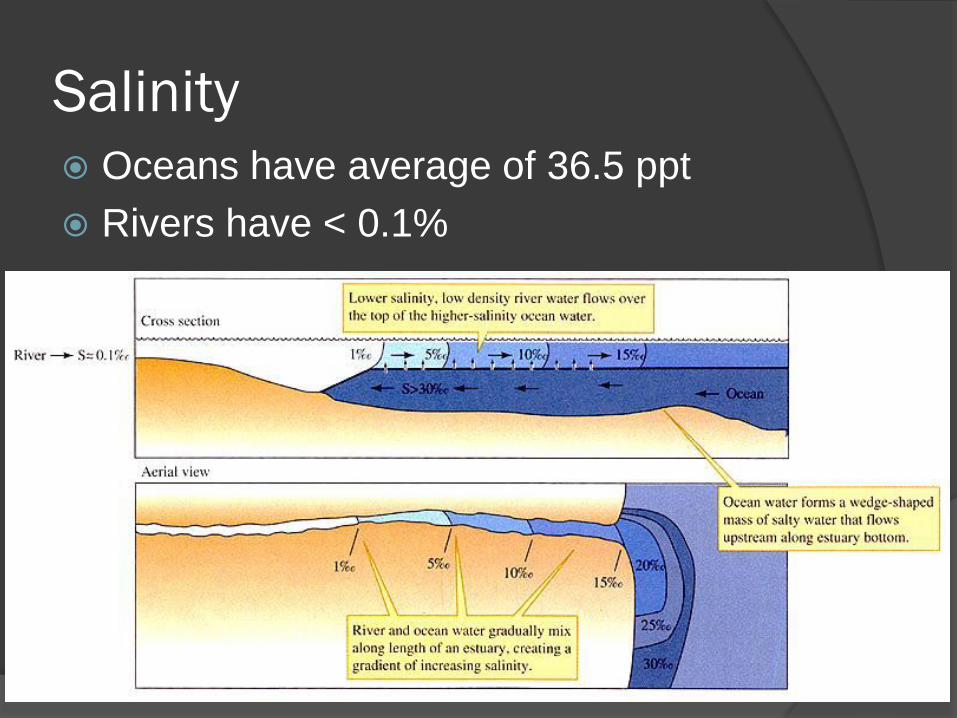
Salinity Oceans have average of 36.5 ppt
Rivers have < 0.1%
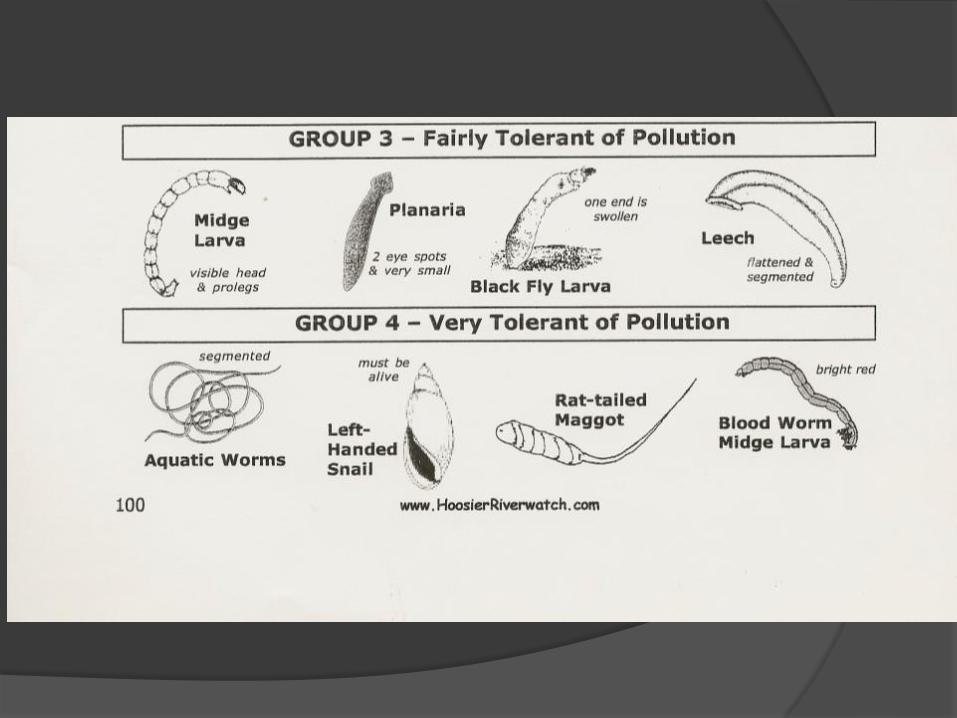
Dissolved Oxygen
> 9.0 ppm supports abundant fish
< 5 ppm is stressful for most fish
< 3 ppm is too low, even hardy fish die
Plants – produce oxygen during
daytime, but use it up during nighttime
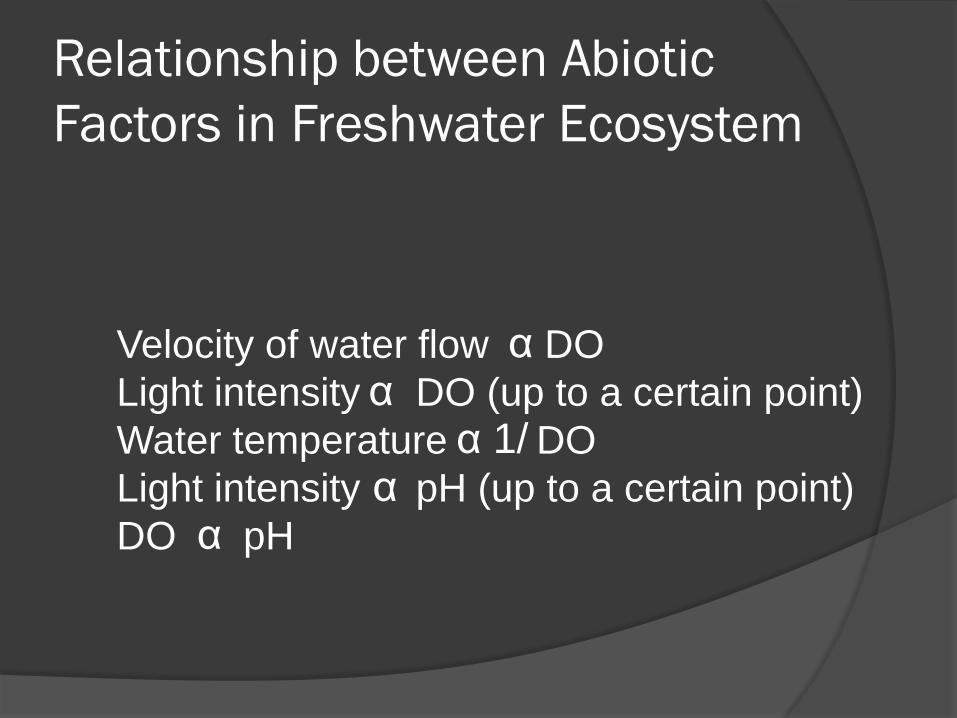
Relationship between Abiotic
Factors in Freshwater Ecosystem
Velocity of water flow DO
Light intensity DO (up to a certain point)
Water temperature DO
Light intensity pH (up to a certain point)
DO pH
α α
α 1/ α
α
Evolution
EVOLUTION
Evolution is the change in genetic composition of
all life forms over generations.
It is commonly described as “descent with
modification”.
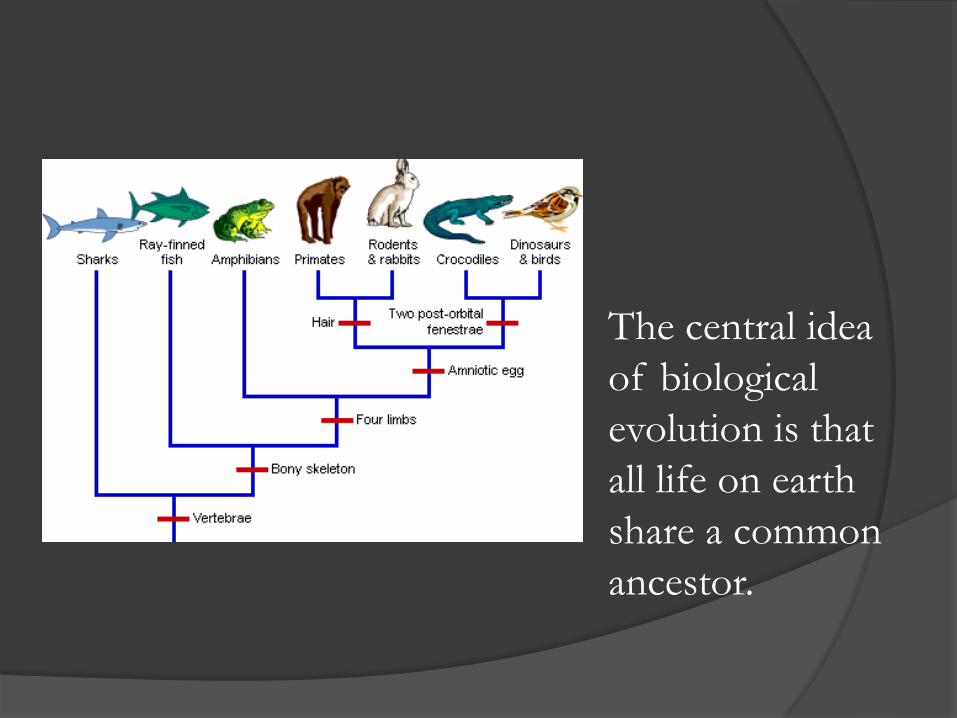
The central idea
of biological
evolution is that
all life on earth
share a common
ancestor.
Mechanisms of Evolution
Mutation
Migration
Genetic Drift
Natural Selection
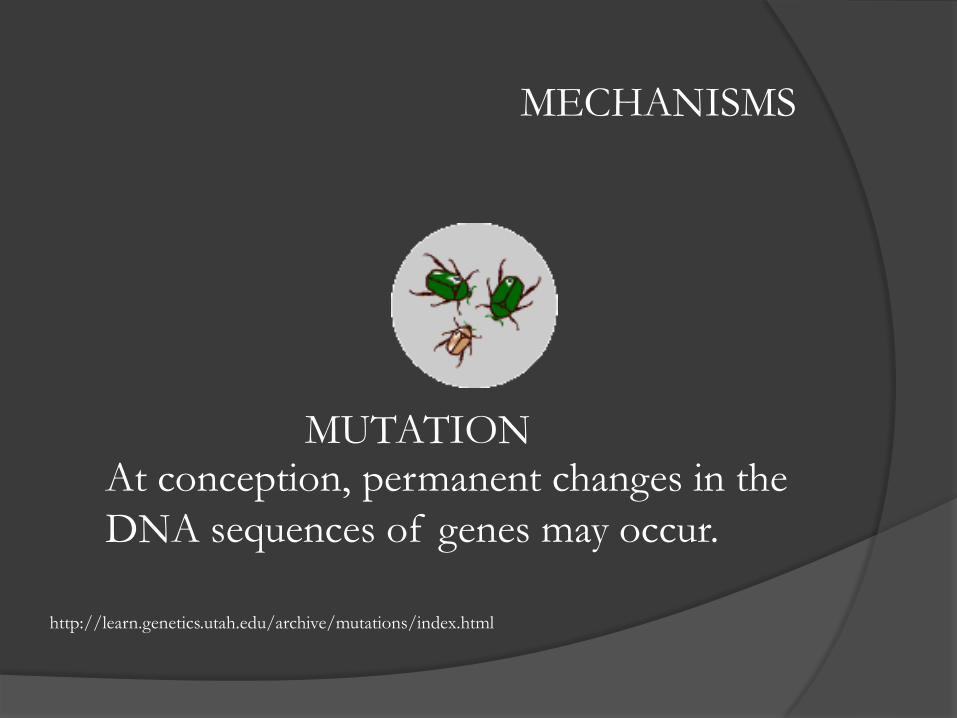
MECHANISMS
MUTATION
http://learn.genetics.utah.edu/archive/mutations/index.html
At conception, permanent changes in the
DNA sequences of genes may occur.
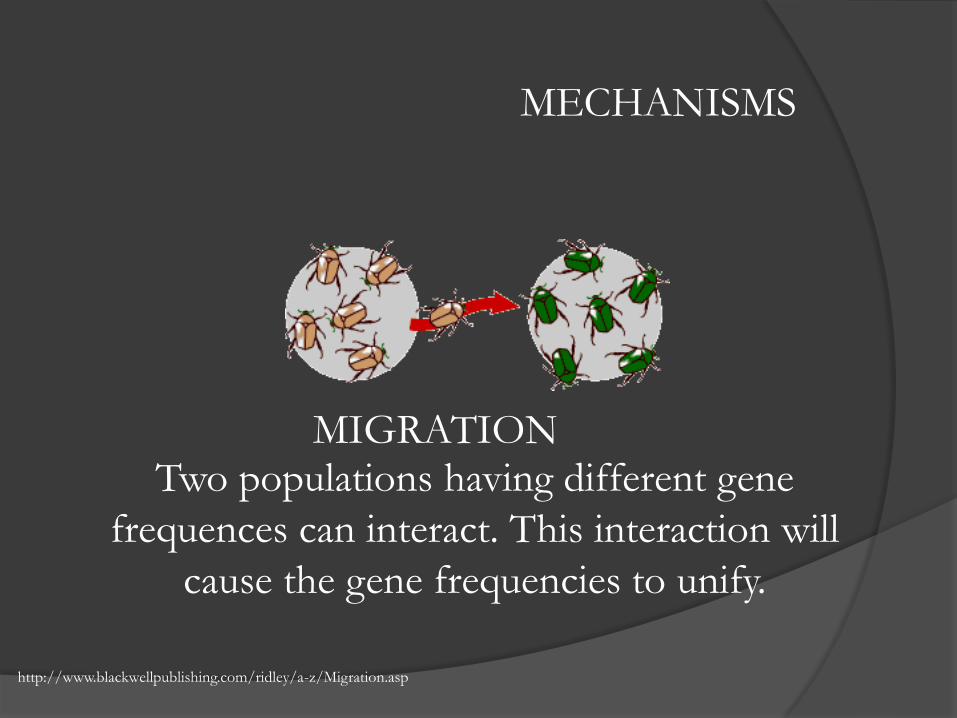
MECHANISMS
MIGRATION Two populations having different gene
frequences can interact. This interaction will
cause the gene frequencies to unify.
http://www.blackwellpublishing.com/ridley/a-z/Migration.asp
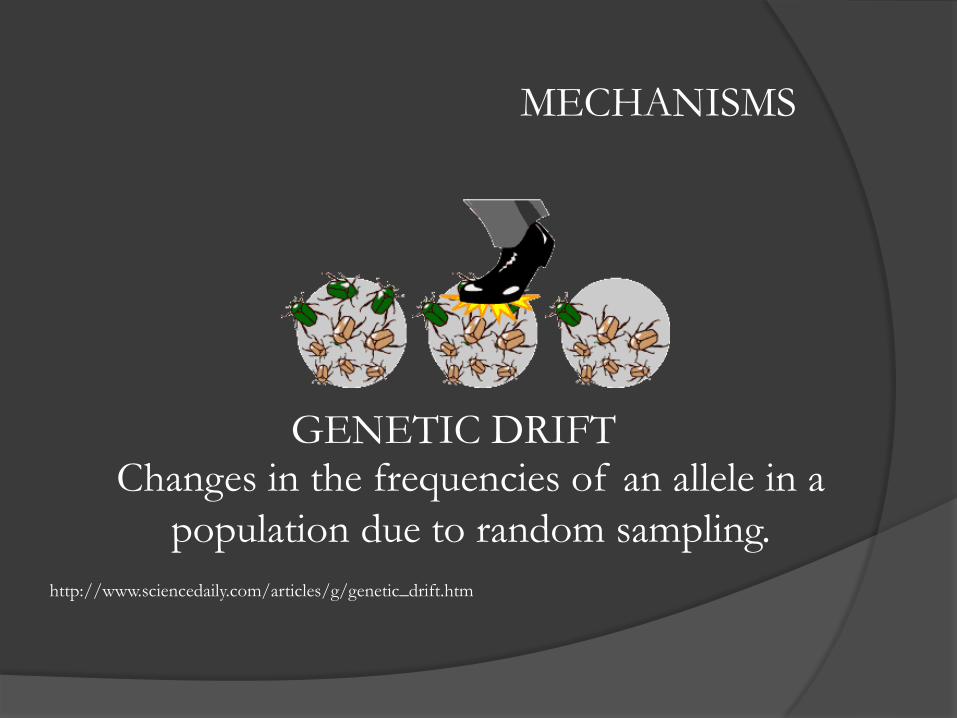
MECHANISMS
GENETIC DRIFT Changes in the frequencies of an allele in a
population due to random sampling.
http://www.sciencedaily.com/articles/g/genetic_drift.htm
MECHANISMS
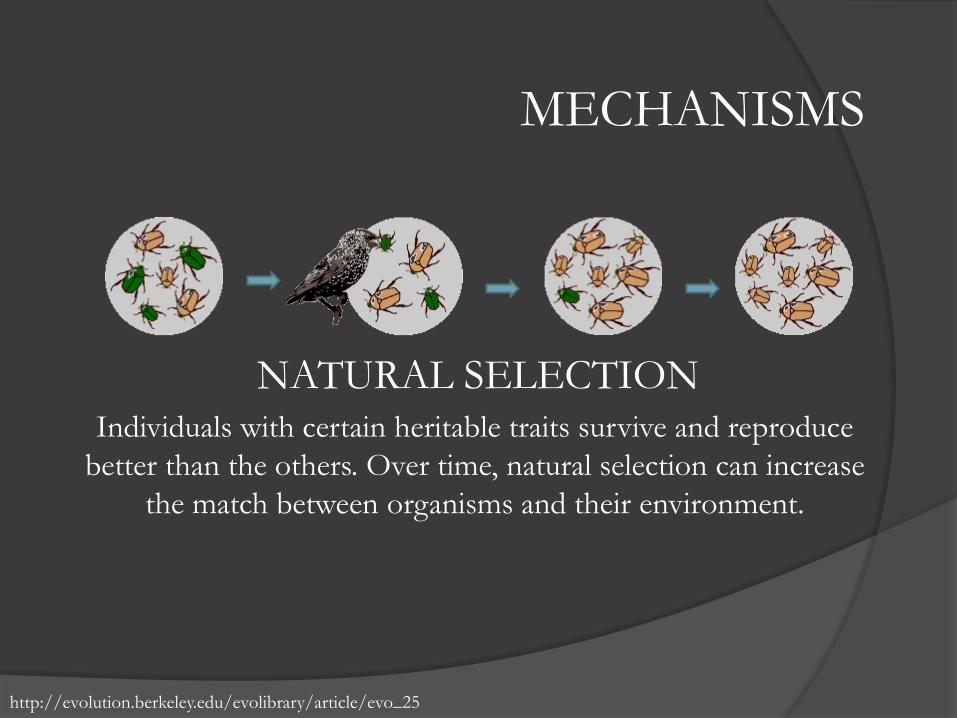
NATURAL SELECTION Individuals with certain heritable traits survive and reproduce
better than the others. Over time, natural selection can increase
the match between organisms and their environment.
http://evolution.berkeley.edu/evolibrary/article/evo_25
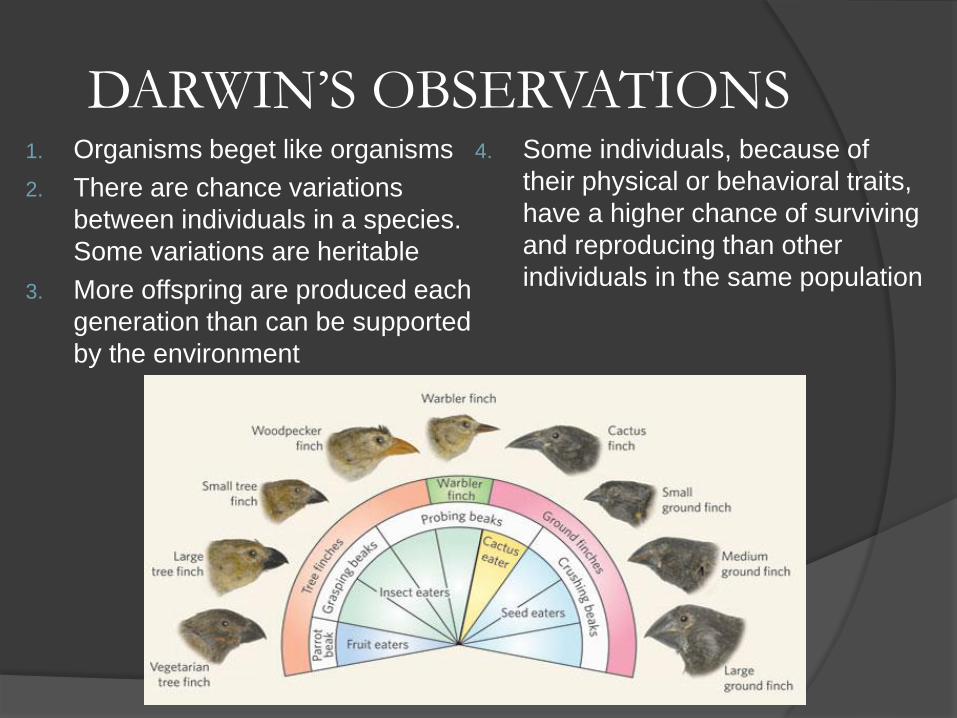
DARWIN’S OBSERVATIONS 1. Organisms beget like organisms
2. There are chance variations
between individuals in a species.
Some variations are heritable
3. More offspring are produced each
generation than can be supported
by the environment
4. Some individuals, because of
their physical or behavioral traits,
have a higher chance of surviving
and reproducing than other
individuals in the same population
TYPES OF
EVOLUTION
MACROEVOLUTION
Development of new species due to accumulation
of changes over a very long period of time.
MICROEVOLUTION
Changes obseved in every generation of organisms.
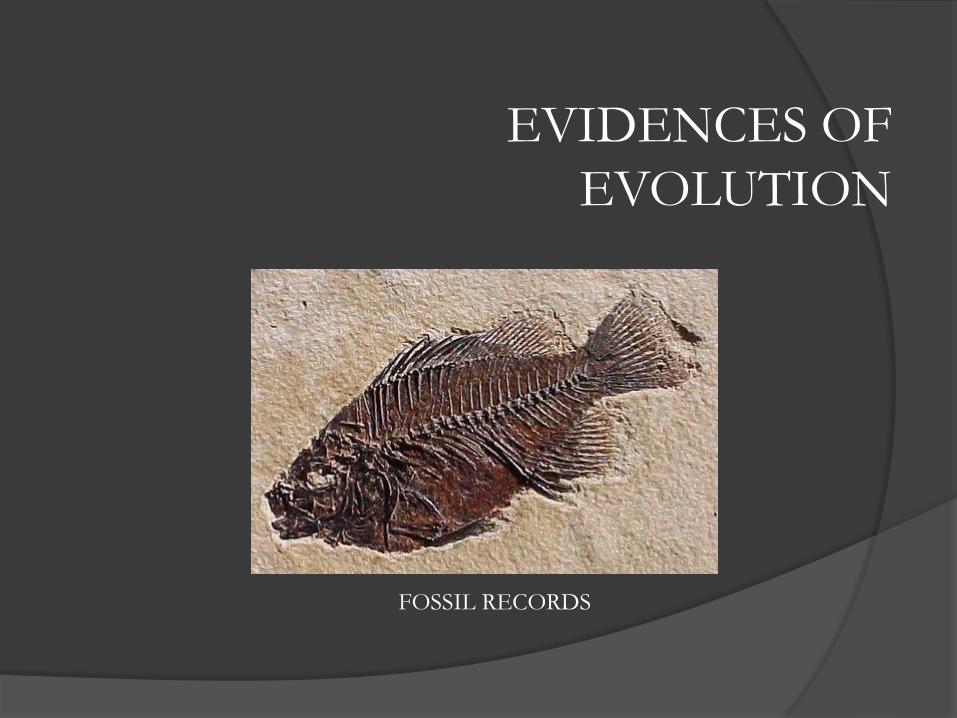
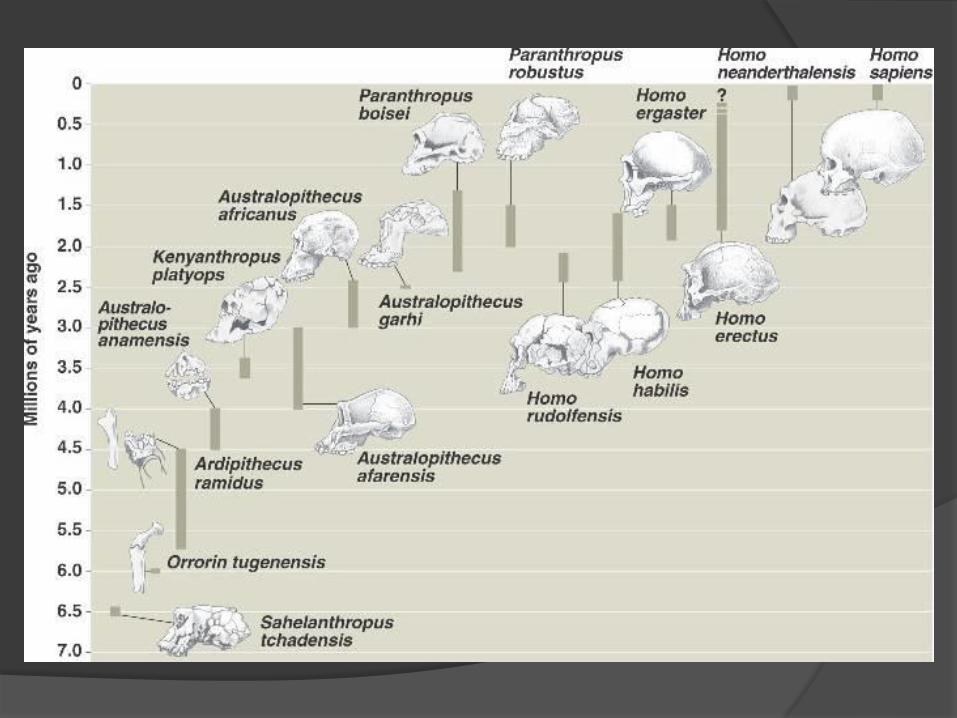
EVIDENCES OF
EVOLUTION
FOSSIL RECORDS
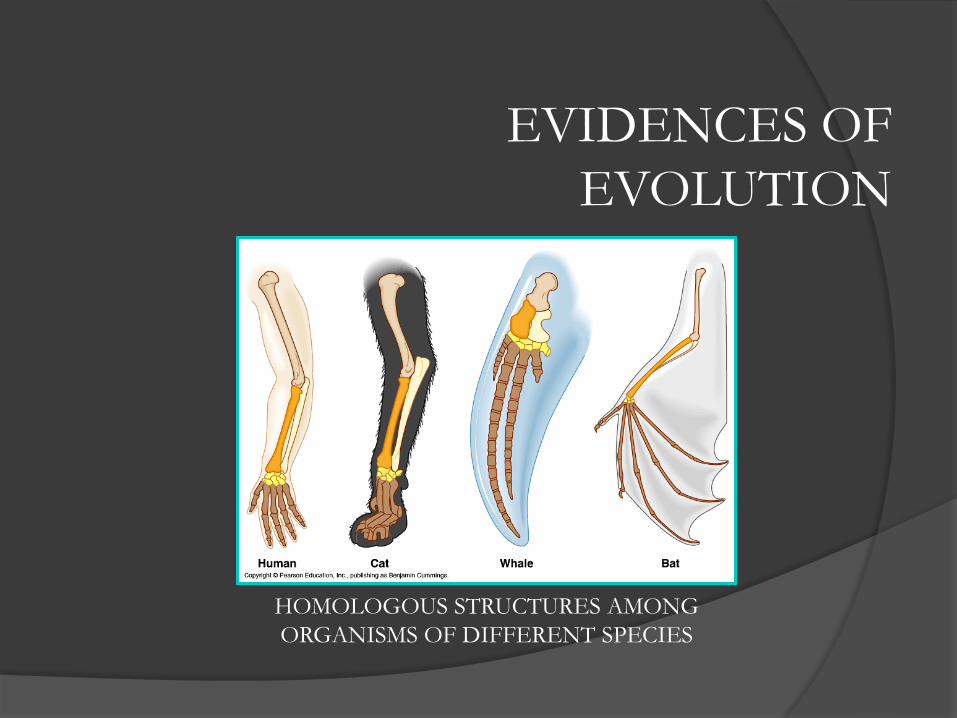
EVIDENCES OF
EVOLUTION
HOMOLOGOUS STRUCTURES AMONG
ORGANISMS OF DIFFERENT SPECIES
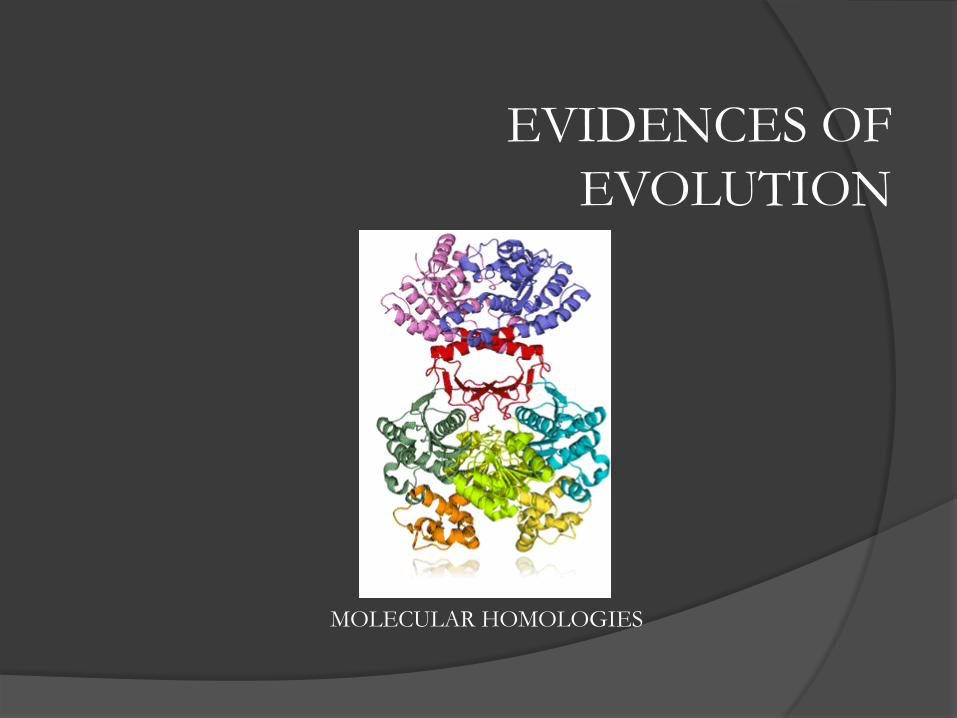
EVIDENCES OF
EVOLUTION
MOLECULAR HOMOLOGIES
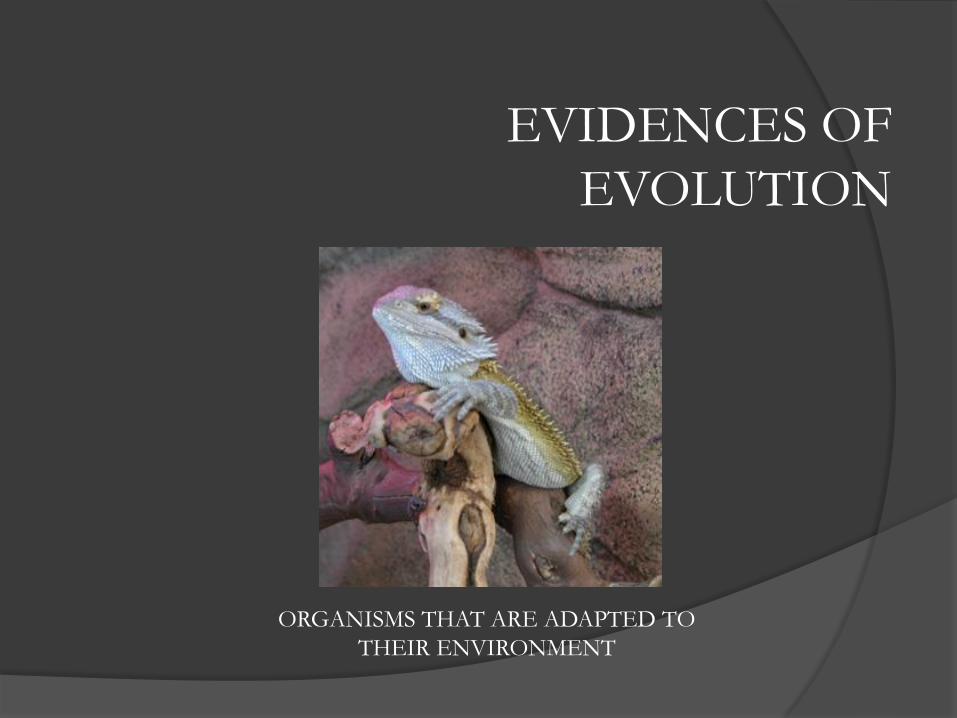
EVIDENCES OF
EVOLUTION
ORGANISMS THAT ARE ADAPTED TO
THEIR ENVIRONMENT
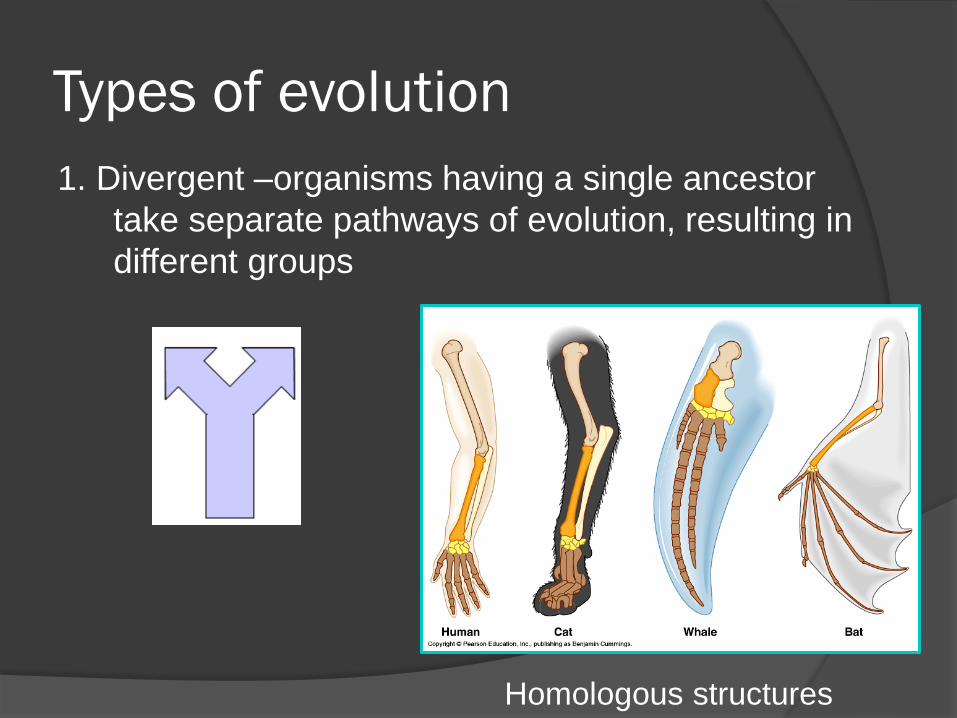
Types of evolution
1. Divergent –organisms having a single ancestor
take separate pathways of evolution, resulting in
different groups
Homologous structures
Types of evolution
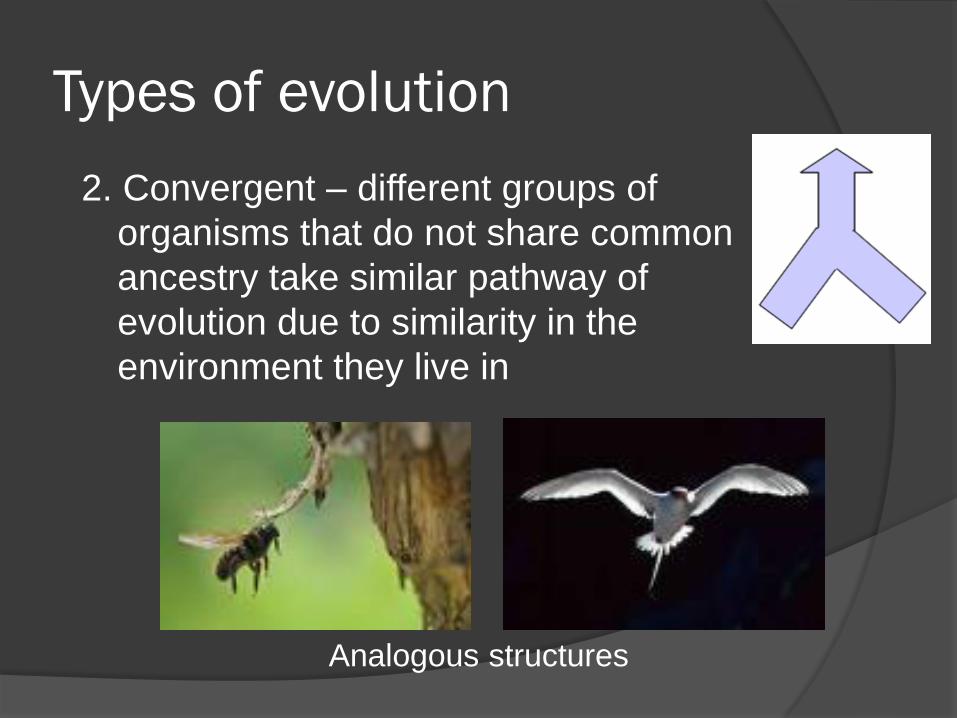
2. Convergent – different groups of
organisms that do not share common
ancestry take similar pathway of
evolution due to similarity in the
environment they live in
Analogous structures
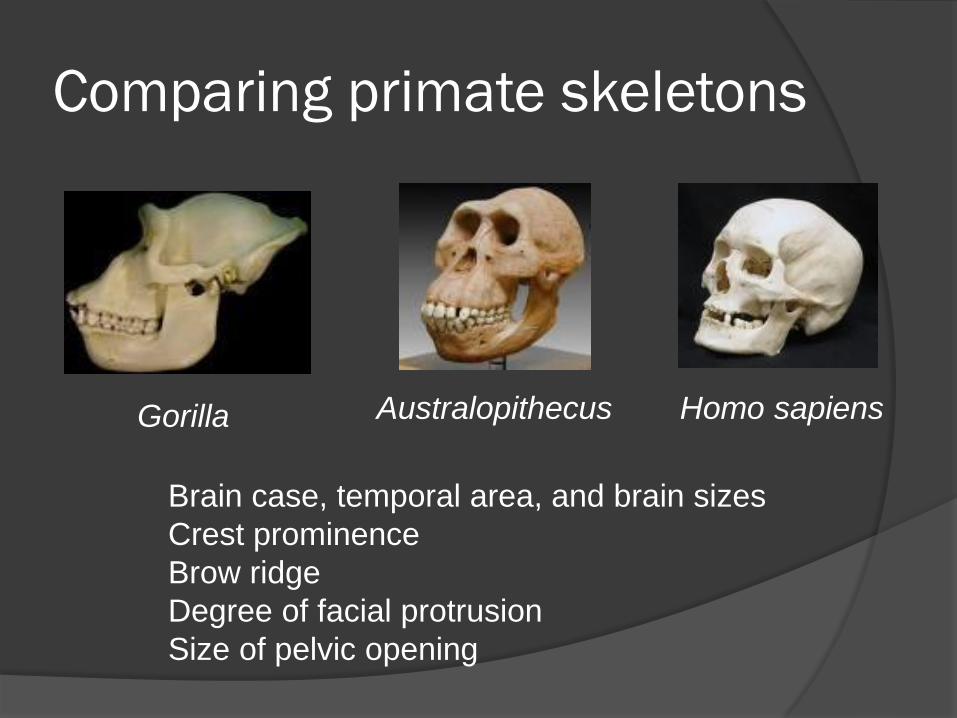
Comparing primate skeletons
Gorilla Australopithecus Homo sapiens
Brain case, temporal area, and brain sizes
Crest prominence
Brow ridge
Degree of facial protrusion
Size of pelvic opening
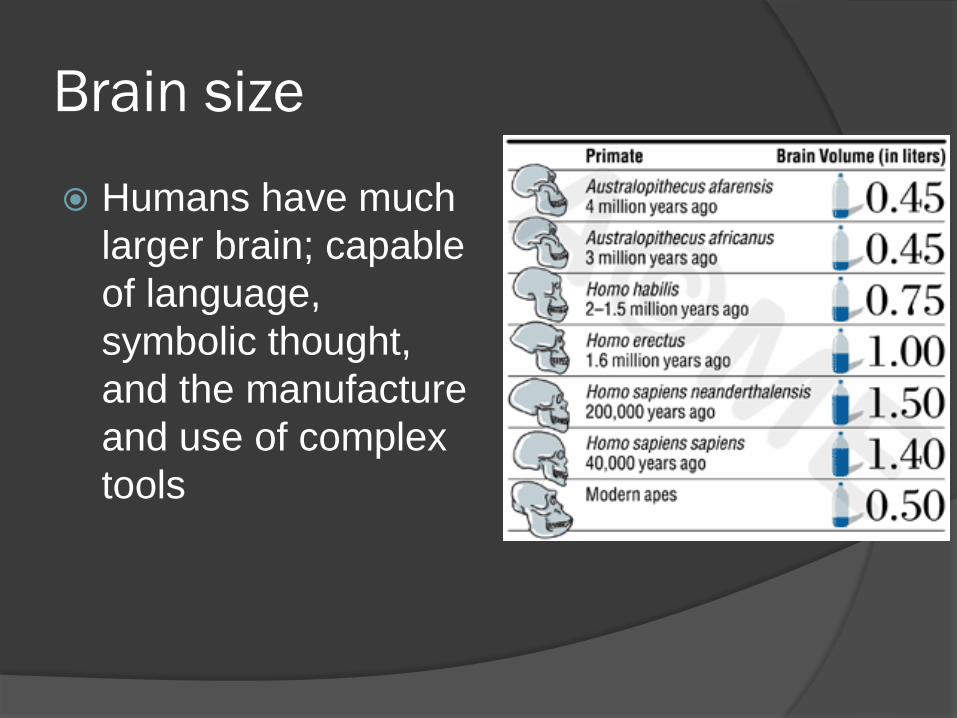
Brain size
Humans have much
larger brain; capable
of language,
symbolic thought,
and the manufacture
and use of complex
tools
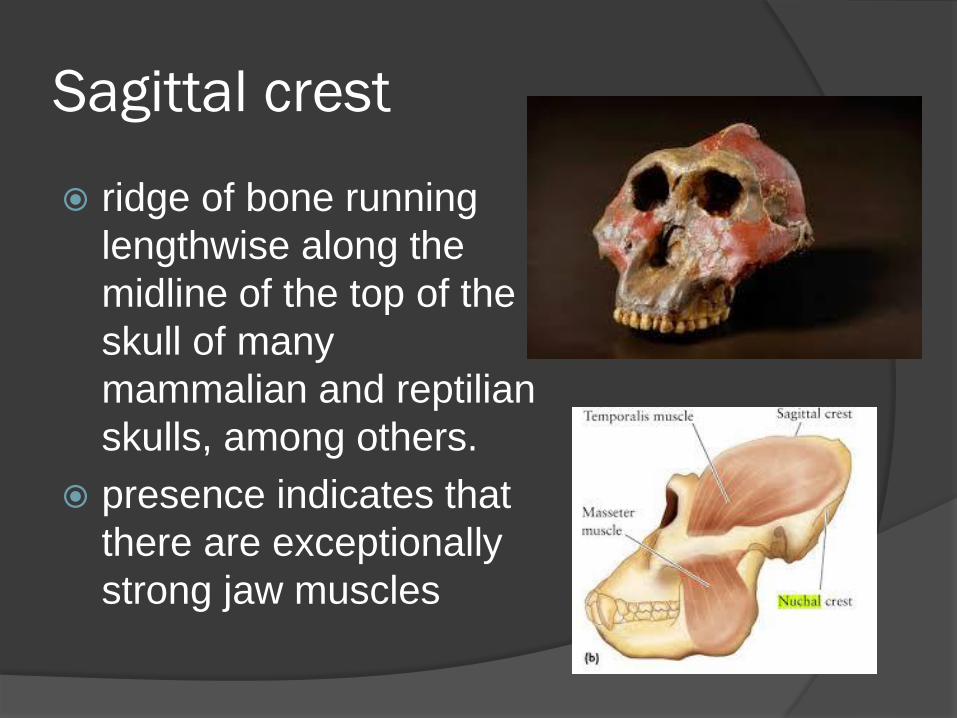
Sagittal crest
ridge of bone running
lengthwise along the
midline of the top of the
skull of many
mammalian and reptilian
skulls, among others.
presence indicates that
there are exceptionally
strong jaw muscles
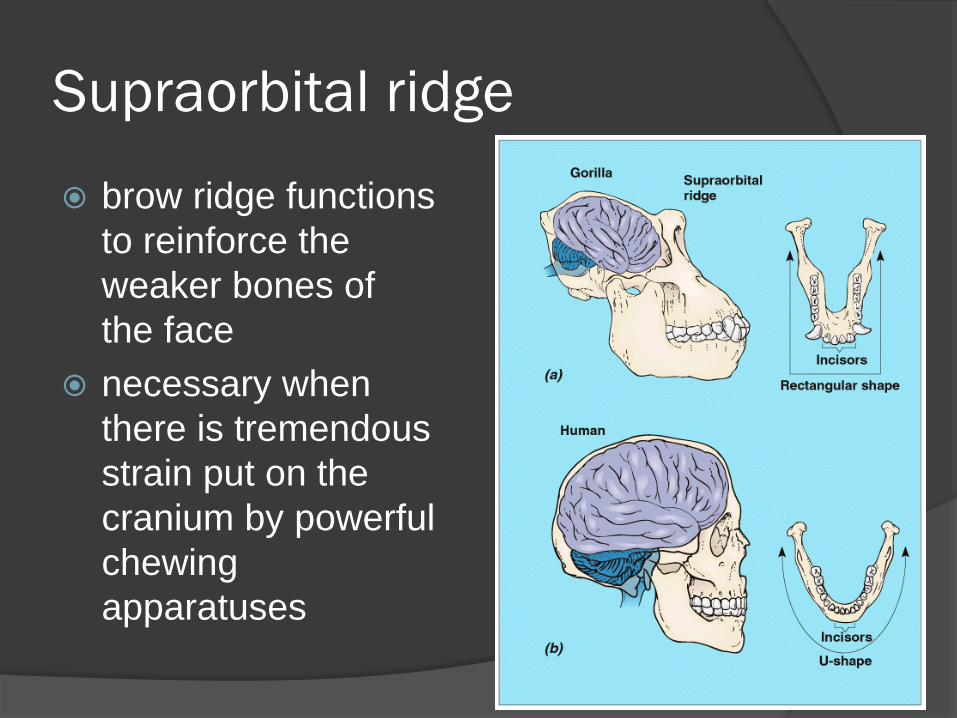
Supraorbital ridge
brow ridge functions
to reinforce the
weaker bones of
the face
necessary when
there is tremendous
strain put on the
cranium by powerful
chewing
apparatuses
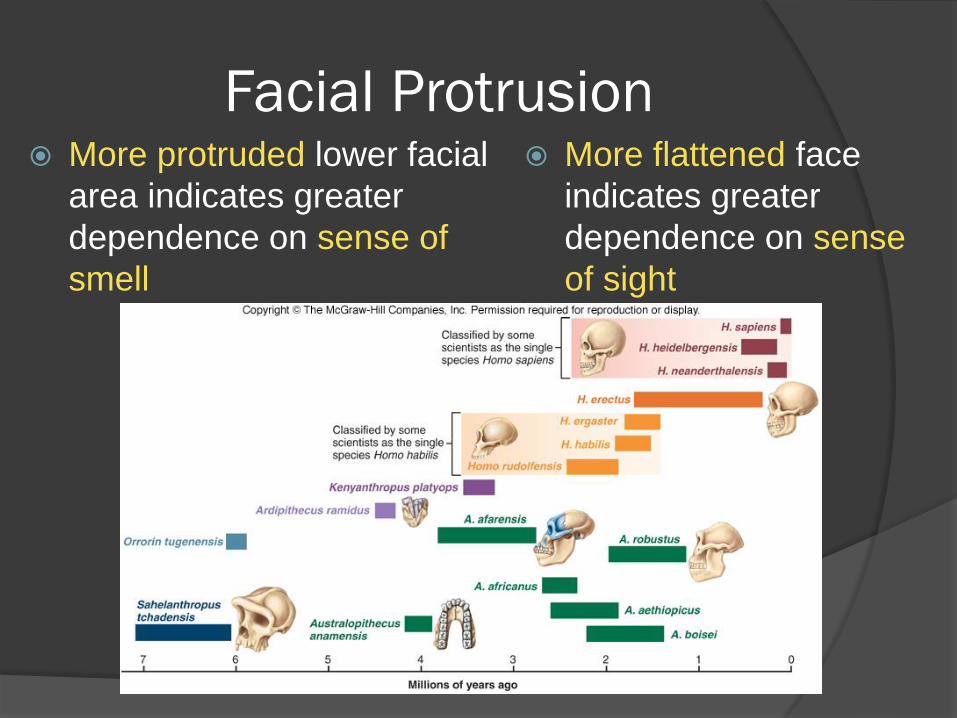
Facial Protrusion More protruded lower facial
area indicates greater
dependence on sense of
smell
More flattened face
indicates greater
dependence on sense
of sight
Pelvic opening and the
“Obstetrical dilemma”
Two conflicting trends:
1. Upright, bipedal locomotion required
decreased size of bony birth canal
2. Increased intelligence required larger cranium,
which needs a wider obstetrical pelvic area
Humans have more difficult time giving
birth
Shorter gestation length, babies with
malleable skull and underdeveloped brain
Our species Homo sapiens is only 200,000 years old
Derived Characters of Humans bipedal locomotion
much larger brain; capable of language, symbolic thought, and the manufacture and use of complex tools
reduced jawbones and jaw muscles
shorter digestive tract
*Humans & chimpanzees have genomes that are 99% identical (but they differ in the expression of 19 regulatory genes)
Humans: Mammals with a Large
Brain and Bipedal Locomotion