Embed Size (px)
Citation preview
SSI – RESEARCH INSTITUTIONAL RESEARCH & INVESTMENT ADVISORY
SSI.COM.VN Visit SSI Research on Bloomberg at SSIV <GO>
Page 1
Kien Trung Nguyen, CFA
+84 4 3936 6321 ext. 510
19 May 2016
INDUSTRIALS - VIETNAM
Key figures
Market cap (USD mn) 51
Market cap (VND bn) 1,144
Outstanding shares (mn) 23
52W high/low (VND 1,000) 51/24.3
Average 3M volume (share) 363,788
Average 3M value (USD mn) 0.72
Average 3M value (VND bn) 15.93
Foreign ownership (%) 11.50
State ownership (%) 50.05
Management ownership (%) N.a
Stock performance
Source: Bloomberg
Company Snapshot
Binh Duong Mineral & Construction Joint Stock Company (KSB: HOSE) is the largest construction stone exploiter in Binh Duong Province. KSB was initially founded in 1993 as a state-owned company and equitized in 2006 with 51% owned by the state. In 2007, KSB was listed on the Ho Chi Minh Stock Exchange (HOSE) and increased its charter capital to VND 107bn in 2010, then to VND 180bn in 2012 and finally to VND 234bn in 2015. In early 2016, the State Capital Investment Corporation (SCIC) completely divested from KSB at the market price of around VND 37,000/share.
Growth written in the stone
Business highlights: KSB involves in exploiting construction stone, producing
construction materials, operating an Industrial Zone and provide other services.
Business performance
Prior to 2014, revenue of the stone segment remained weak which resulted in low
revenue and profit growth. Since 2014, thanks to a thriving property market and
increase spending on infrastructure projects, output of construction stone heightened.
Gross profit margin remained stable in the last 4 years at 35-36%, which is similar to
that of NNC and DHA. However, SG&A/sales was around 14%, which is higher than
C32 (6.1%) and NCC (0.6%).
In 2015, revenue and net profit reached VND 738bn (+18.2% YoY) and VND 125bn
(+29.5% YoY).
Outlook
Construction stone segment:
We expect revenue of the segment will grow by 15% in 2016 thanks to both output
growth (8% YoY) and price hike (7% YoY) as new shareholders require more
transparent pricing. In 2017, output is likely to reach more than 4mn m3/year (7.5%
YoY) after KSB finishes investing in 2 stone crushers by the end of 2016.
The company holds abundant reservoirs of kaolin, but capacity remains low, thus
Kaolin revenue contribution remains low. However, in the next 3 years, we believe
that KSB will direct more attention to kaolin. We believe profit margin of Kaolin might
mimic construction stone (30-40%) or even higher as it is used for high value
production, including paper and paint.
IZ: stable cash flow: IZ is a cash flow generator with 1 payment and long term
revenue recording. In addition, service segment offers high margin than other
businesses.
We believe that in the next 5 years, KSB’s IZ will be fully occupied as most of
industrial zone in Dong Nai and Binh Duong now nearly full occupied and the
company can enjoy recording revenue and profit to the next 45 years. We expect
since 2020, IZ revenue might reach VND 60bn/year.
In addition, KSB might record earnings surprise (VND 37bn PBT) from transferring
Binh Duc Tien Villa in 2016.
In 2016, we expect that KSB will finish transferring its property project to gain VND
37bn in PBT. As a result, we expect PBT will reach VND 240bn (+47.3% YoY).In
2017, we believe that the stone business will expand even stronger when the
company finishes expanding capacity by adding 20% more. We expect revenue and
before tax profit might reach VND 987bn (+16.2% YoY) and VND 238bn (-0.6%
YoY).
Investment view: Based on the two methods, we arrive at a 1Y target price of VND
58,500/share (+20% upside) and recommend BUY for KSB.
Risks: Mining business is still dependent on license grating by the Ministry of
National Resources. Increase in environment tax is also risk.
BUY – 1Y Price Target: VND 58,500 Current price: VND 48,900
Binh Duong Mineral and Construction JSC (KSB: HOSE)
SSI – RESEARCH INSTITUTIONAL RESEARCH & INVESTMENT ADVISORY
SSI.COM.VN Visit SSI Research on Bloomberg at SSIV <GO>
Page 2
Table of Contents
1. Background ........................................................................................................................................................................ 3
2. Business highlights .......................................................................................................................................................... 4
2.1. Construction stone....................................................................................................................................................... 4
2.2. Construction materials ................................................................................................................................................. 5
2.3. Industrial Zone ............................................................................................................................................................. 6
2.4. Others .......................................................................................................................................................................... 6
3. Historical review ................................................................................................................................................................ 7
4. Outlook ............................................................................................................................................................................... 8
5. Investment view ................................................................................................................................................................. 9
APPENDIX: ANNUAL FINANCIAL STATEMENTS ................................................................................................................. 11
ANALYST CERTIFICATION ..................................................................................................................................................... 12
RATING ..................................................................................................................................................................................... 12
DISCLAIMER ............................................................................................................................................................................ 12
CONTACT INFORMATION ...................................................................................................................................................... 13
SSI – RESEARCH INSTITUTIONAL RESEARCH & INVESTMENT ADVISORY
SSI.COM.VN Visit SSI Research on Bloomberg at SSIV <GO>
Page 3
1. Background
Binh Duong Mineral & Construction Joint Stock Company (KSB: HOSE) is the largest
construction stone exploiter in Binh Duong Province. KSB was initially founded in 1993 as a
state-owned company and equitized in 2006 with 51% owned by the state. In 2007, KSB was
listed on the Ho Chi Minh Stock Exchange (HOSE) and increased its charter capital to VND
107bn in 2010, then to VND 180bn in 2012 and finally to VND 234bn in 2015. In early 2016, the
State Capital Investment Corporation (SCIC) completely divested from KSB at the market price
of around VND 37,000/share.
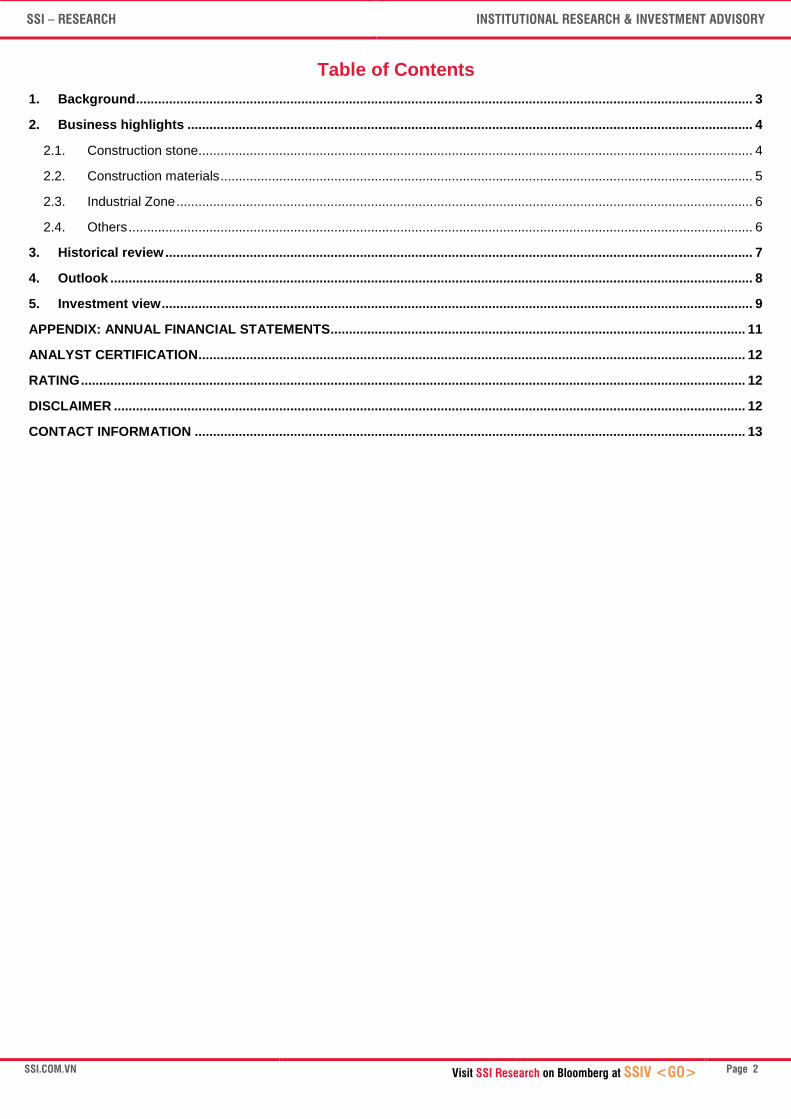
Shareholder structure
Ownership structure
Source: KSB
After SCIC divestment, DRH was the only significant shareholder left with 9.98% ownership.
DRH currently is a property and construction company. The company also is investing in
construction materials business.
However, at the recent AGM, DRH appointed two representatives (one is chairman of TTF- Mr
Thanh and one is CEO of DRH- Mr Dat) to the BOM and one to the Board of Supervisors and
replaced the existing chairman, Mr Hai (which is also the CEO of KSB). Mr Hai now only holds
CEO position. Therefore, we believe that DRH and its related parties now control the company.
9.98%
18%
72.02%
DRH
Forein Investors
other shareholders
SSI – RESEARCH INSTITUTIONAL RESEARCH & INVESTMENT ADVISORY
SSI.COM.VN Visit SSI Research on Bloomberg at SSIV <GO>
Page 4
2. Business highlights
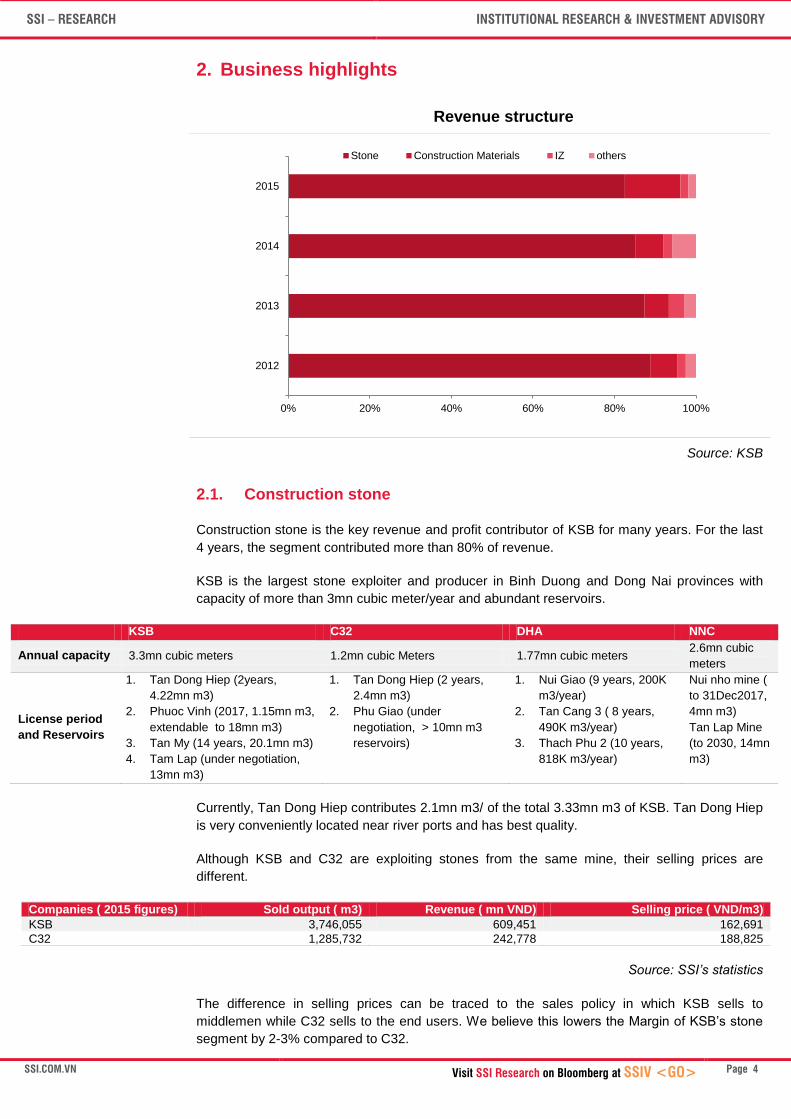
Revenue structure
Source: KSB
2.1. Construction stone
Construction stone is the key revenue and profit contributor of KSB for many years. For the last
4 years, the segment contributed more than 80% of revenue.
KSB is the largest stone exploiter and producer in Binh Duong and Dong Nai provinces with
capacity of more than 3mn cubic meter/year and abundant reservoirs.
KSB C32 DHA NNC
Annual capacity 3.3mn cubic meters 1.2mn cubic Meters 1.77mn cubic meters 2.6mn cubic
meters
License period
and Reservoirs
1. Tan Dong Hiep (2years,
4.22mn m3)
2. Phuoc Vinh (2017, 1.15mn m3,
extendable to 18mn m3)
3. Tan My (14 years, 20.1mn m3)
4. Tam Lap (under negotiation,
13mn m3)
1. Tan Dong Hiep (2 years,
2.4mn m3)
2. Phu Giao (under
negotiation, > 10mn m3
reservoirs)
1. Nui Giao (9 years, 200K
m3/year)
2. Tan Cang 3 ( 8 years,
490K m3/year)
3. Thach Phu 2 (10 years,
818K m3/year)
Nui nho mine (
to 31Dec2017,
4mn m3)
Tan Lap Mine
(to 2030, 14mn
m3)
Currently, Tan Dong Hiep contributes 2.1mn m3/ of the total 3.33mn m3 of KSB. Tan Dong Hiep
is very conveniently located near river ports and has best quality.
Although KSB and C32 are exploiting stones from the same mine, their selling prices are
different.
Companies ( 2015 figures) Sold output ( m3) Revenue ( mn VND) Selling price ( VND/m3)
KSB 3,746,055 609,451 162,691
C32 1,285,732 242,778 188,825
Source: SSI’s statistics
The difference in selling prices can be traced to the sales policy in which KSB sells to
middlemen while C32 sells to the end users. We believe this lowers the Margin of KSB’s stone
segment by 2-3% compared to C32.
0% 20% 40% 60% 80% 100%
2012
2013
2014
2015
Stone Construction Materials IZ others
SSI – RESEARCH INSTITUTIONAL RESEARCH & INVESTMENT ADVISORY
SSI.COM.VN Visit SSI Research on Bloomberg at SSIV <GO>
Page 5
Abundant Reservoirs:
Based on the existing mines, we estimate that the outstanding reservoirs of KSB are 56mn m3.
Accordingly, at the current capacity of 3.3mn m3/year, it will take more than 10 years to exploit
the existing mines.
At 2016 AGM, shareholders approved for capacity expansion by investing in 2 stone crushers
with capacity of 350tons/each for Phuoc Vinh and Tan My mines. We expect the two crushers
might help increase capacity by 20% starting in early 2017.
A broad market:
According to Decision No.1469/QD-TTg issued on 22 Aug 2014, total demand for stone in
Vietnam will increase by 50% in the next 5 years or 9% annually, reaching 181mn m3/year in
which demand from Southeastern Vietnam is expected to increase from 31mn m3/year to 45mn
m3/year in 2020. Demand for stone will come from (1) infrastructure projects including highway
and metro line, and (2) residential buildings in Ho Chi Minh City like Thu Thiem Urban Township
where the soil is weak and need stone to support big buildings.
Although every provinces and cities need stone for construction, in the South, most of the mines
are located in Binh Duong, Dong Nai, Binh Phuoc and Tay Ninh provinces. Binh Duong and
Dong Nai provinces are the closest to Ho Chi Minh City.
2.2. Construction materials
Besides construction stones, KSB also produces and exploit other construction materials
including kaolin, bricks, sand and concrete.
Kaolin: KSB owns several kaolin mines with abundant reservoirs. However, this is not a strong
focus of the firm:
Mines Reservoirs Capacity Annual Revenue
Minh Long 22 years, 7.77mn m3 16.7K m3/year VND 22.9bn
Tan Lap 6 years, 121K m3 14K m3/year
Others materials
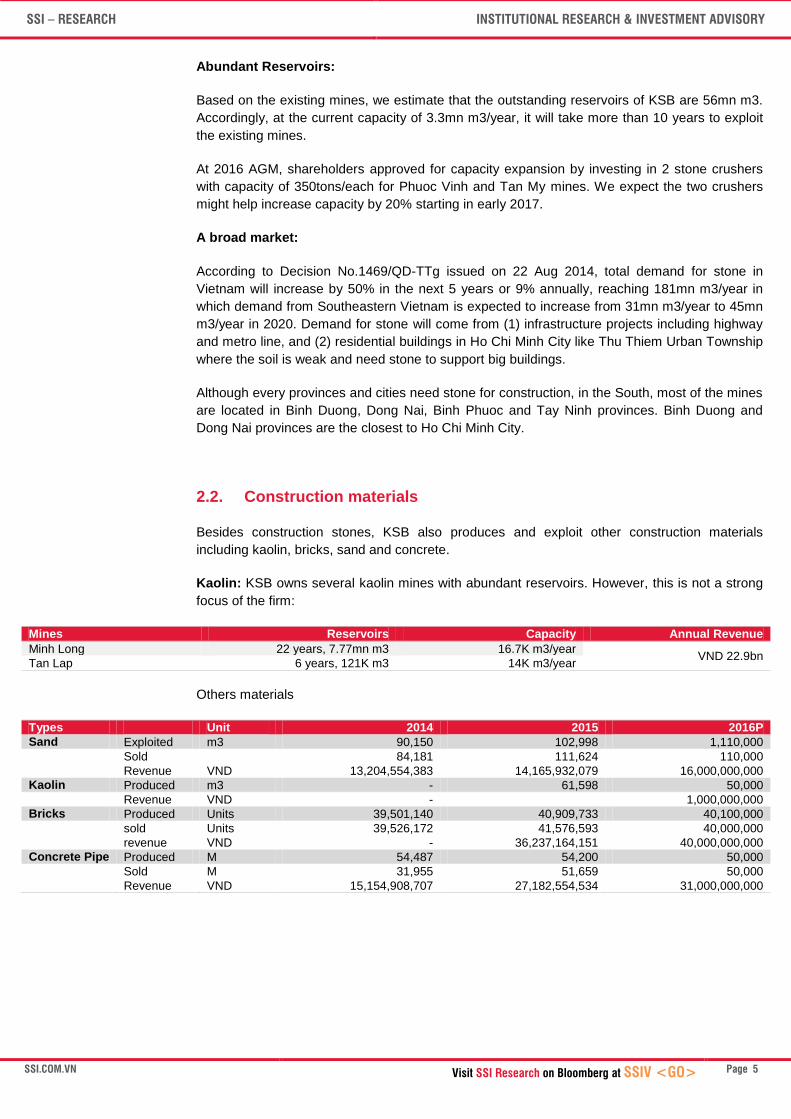
Types Unit 2014 2015 2016P
Sand Exploited m3 90,150 102,998 1,110,000
Sold
84,181 111,624 110,000
Revenue VND 13,204,554,383 14,165,932,079 16,000,000,000
Kaolin Produced m3 - 61,598 50,000
Revenue VND -
1,000,000,000
Bricks Produced Units 39,501,140 40,909,733 40,100,000
sold Units 39,526,172 41,576,593 40,000,000
revenue VND - 36,237,164,151 40,000,000,000
Concrete Pipe Produced M 54,487 54,200 50,000
Sold M 31,955 51,659 50,000
Revenue VND 15,154,908,707 27,182,554,534 31,000,000,000
SSI – RESEARCH INSTITUTIONAL RESEARCH & INVESTMENT ADVISORY
SSI.COM.VN Visit SSI Research on Bloomberg at SSIV <GO>
Page 6
2.3. Industrial Zone
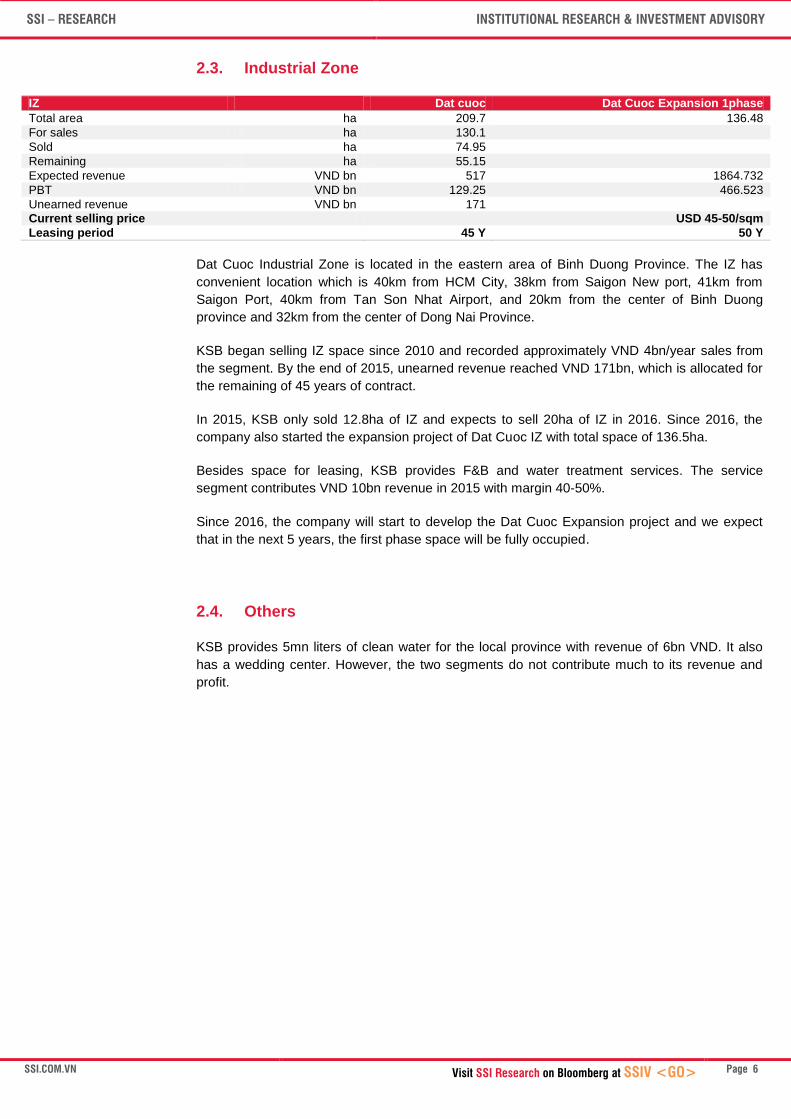
IZ
Dat cuoc Dat Cuoc Expansion 1phase
Total area ha 209.7 136.48
For sales ha 130.1
Sold ha 74.95
Remaining ha 55.15
Expected revenue VND bn 517 1864.732
PBT VND bn 129.25 466.523
Unearned revenue VND bn 171
Current selling price USD 45-50/sqm
Leasing period 45 Y 50 Y
Dat Cuoc Industrial Zone is located in the eastern area of Binh Duong Province. The IZ has
convenient location which is 40km from HCM City, 38km from Saigon New port, 41km from
Saigon Port, 40km from Tan Son Nhat Airport, and 20km from the center of Binh Duong
province and 32km from the center of Dong Nai Province.
KSB began selling IZ space since 2010 and recorded approximately VND 4bn/year sales from
the segment. By the end of 2015, unearned revenue reached VND 171bn, which is allocated for
the remaining of 45 years of contract.
In 2015, KSB only sold 12.8ha of IZ and expects to sell 20ha of IZ in 2016. Since 2016, the
company also started the expansion project of Dat Cuoc IZ with total space of 136.5ha.
Besides space for leasing, KSB provides F&B and water treatment services. The service
segment contributes VND 10bn revenue in 2015 with margin 40-50%.
Since 2016, the company will start to develop the Dat Cuoc Expansion project and we expect
that in the next 5 years, the first phase space will be fully occupied.
2.4. Others
KSB provides 5mn liters of clean water for the local province with revenue of 6bn VND. It also
has a wedding center. However, the two segments do not contribute much to its revenue and
profit.
SSI – RESEARCH INSTITUTIONAL RESEARCH & INVESTMENT ADVISORY
SSI.COM.VN Visit SSI Research on Bloomberg at SSIV <GO>
Page 7
3. Historical review
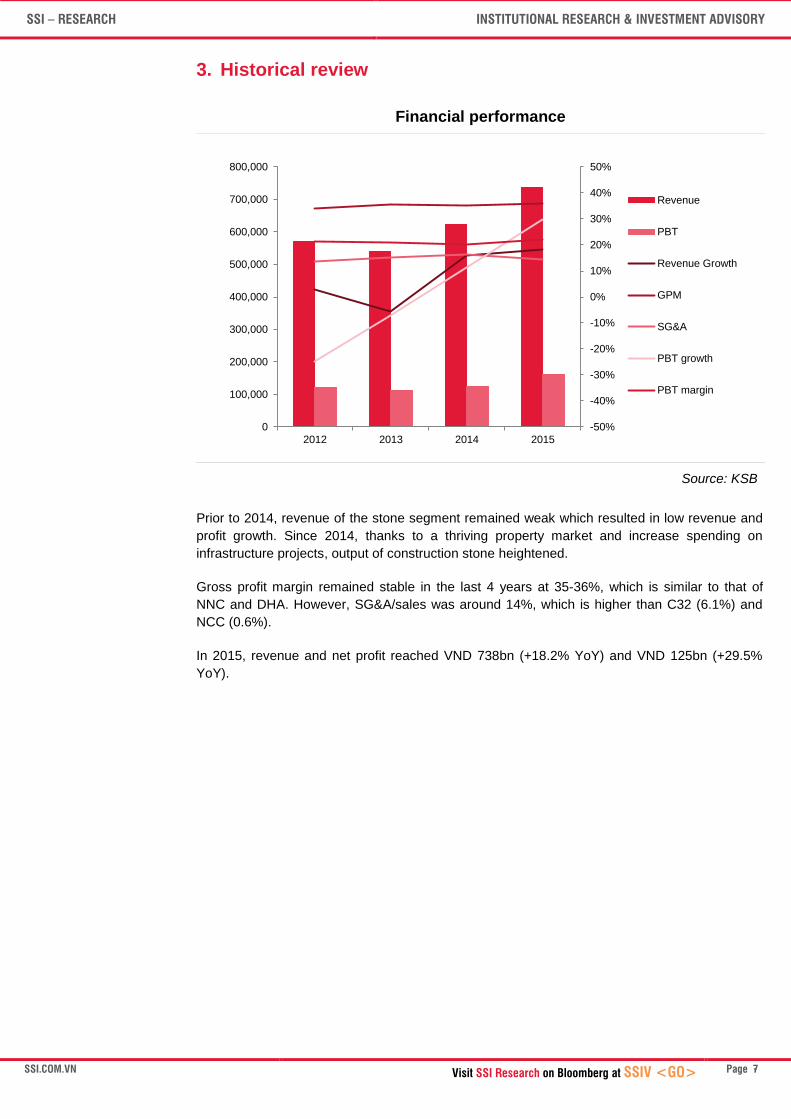
Financial performance
Source: KSB
Prior to 2014, revenue of the stone segment remained weak which resulted in low revenue and
profit growth. Since 2014, thanks to a thriving property market and increase spending on
infrastructure projects, output of construction stone heightened.
Gross profit margin remained stable in the last 4 years at 35-36%, which is similar to that of
NNC and DHA. However, SG&A/sales was around 14%, which is higher than C32 (6.1%) and
NCC (0.6%).
In 2015, revenue and net profit reached VND 738bn (+18.2% YoY) and VND 125bn (+29.5%
YoY).
-50%
-40%
-30%
-20%
-10%
0%
10%
20%
30%
40%
50%
0
100,000
200,000
300,000
400,000
500,000
600,000
700,000
800,000
2012 2013 2014 2015
Revenue
PBT
Revenue Growth
GPM
SG&A
PBT growth
PBT margin
SSI – RESEARCH INSTITUTIONAL RESEARCH & INVESTMENT ADVISORY
SSI.COM.VN Visit SSI Research on Bloomberg at SSIV <GO>
Page 8
4. Outlook
Construction stone segment:
We expect revenue of the segment will grow by 15% in 2016 thanks to both output growth (8%
YOY) and price hike (7% YoY) as new shareholders require more transparent pricing. In 2017,
output is likely to reach more than 4mn m3/year (7.5% YoY) after KSB finishes investing in 2
stone crushers by the end of 2016.
Although gross profit margin is not likely to improve much as the most convenient mine will
expire after 2017, we believe selling expense will decline as it is much higher than NCC (0.6%)
and C32 (6.1%). The Phuoc Vinh , Tan My and Tam Lap mines , although has abundant
reservoirs, their location is approximately 10km far from the river port and it offer the lower
quality than Tan Dong Hiep Mine. As the stone resource now become scare, buyers must
accept the higher price for stone.
Because the government has limited license for exploiting stone, and demand for infrastructure
and property projects remain high, and based on the forecast of the Ministry of Construction, we
expect that the stone market will continue to grow by more than 10% to 2020.
The company holds abundant reservoirs of kaolin, but capacity remains low, thus Kaolin
revenue contribution remains low. However, in the next 3 years, we believe that KSB will direct
more attention to kaolin. We believe profit margin of Kaolin might mimic construction stone (30-
40%) or even higher as it is used for high value production, including paper and paint.
IZ: stable cash flow:
IZ is a cash flow generator with 1 payment and long term revenue recording. In addition, service
segment offers high margin than other businesses.
We believe that in the next 5 years, KSB’s IZ will be fully occupied as most of industrial zone in
Dong Nai and Binh Duong now nearly full occupied and the company can enjoy recording
revenue and profit to the next 45 years. We expect since 2020, IZ revenue might reach VND
60bn/year.
Earnings surprise from property transfer
At the AGM, shareholders approved to transfer the Binh Duc Tien villa to record immediate
profit. According to management’s calculation, it will generate VND 120bn in revenue and VND
37bn in PBT. We believe the transaction will be implemented in mid-2016.
In 2016, we believe that key drivers are still stone and industrial zone. We expect that revenue
will reach VND 849bn (+15.1% YoY), consistent with the company’s target.
However, we believe that GPM will improve by 1% and SG&A will decline by 1% since 2016.
Core profit before tax might reach VND 202bn (+24% YoY) which is higher than the company
target as expect the new owner will help improve profit margin of KSB
Actually, in 1Q16, sales and PBT grew by 9% and 16.1% YoY. In 1Q16, stone business was
affected as KSB extended the Tan Dong Hiep license.
In 2016, we expect that KSB will finish transferring its property project to gain VND 37bn in PBT.
As a result, we expect PBT will reach VND 240bn (+47.3% YoY).
In 2017, we believe that the stone business will expand even stronger when the company
finishes expanding capacity by adding 20% more. We expect revenue and before tax profit
might reach VND 987bn (+16.2% YoY) and VND 238bn (-0.6% YoY).
SSI – RESEARCH INSTITUTIONAL RESEARCH & INVESTMENT ADVISORY
SSI.COM.VN Visit SSI Research on Bloomberg at SSIV <GO>
Page 9
5. Investment view
KSB is a diversified company with valuable mines including construction stone and kaolin
mines. The existing mines are enough for the company to exploit for the next 15 years. In
addition, the industrial zone segment is a long term and stable cash generator for the next 45
years. KSB has high cash balance (20% of total assets and 75% of charter capital) and no
debt.
We apply two methods to valuate KSB:
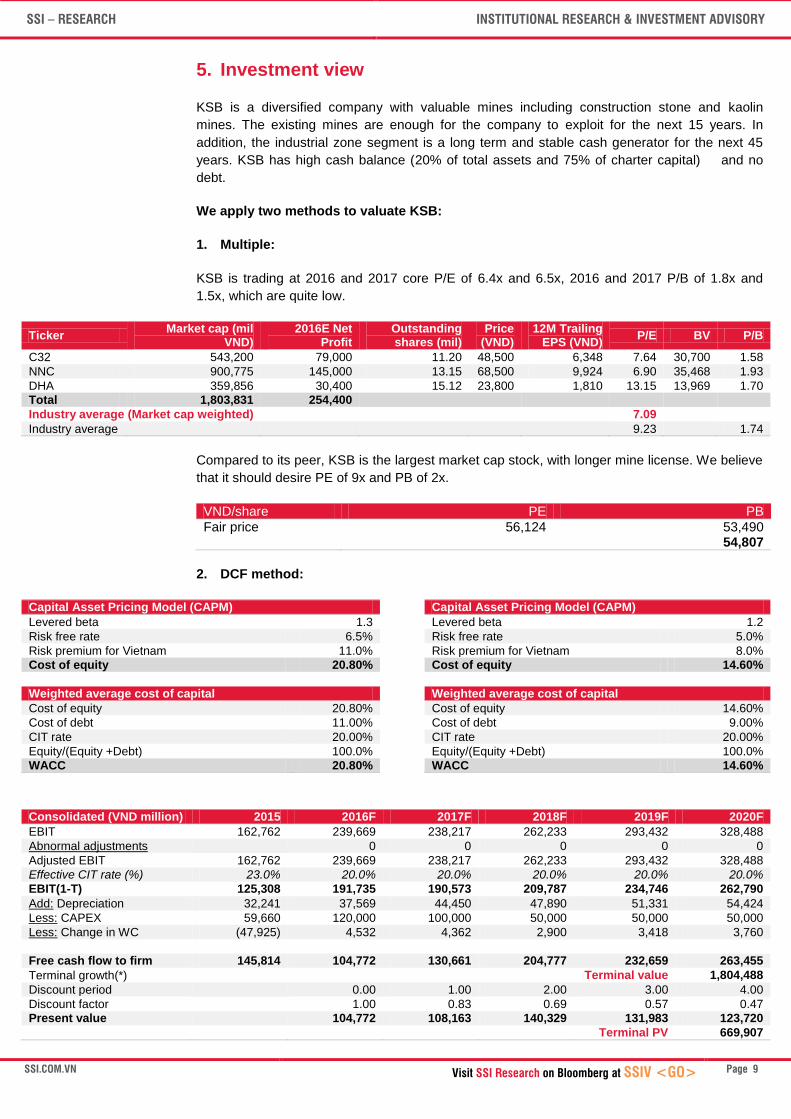
1. Multiple:
KSB is trading at 2016 and 2017 core P/E of 6.4x and 6.5x, 2016 and 2017 P/B of 1.8x and
1.5x, which are quite low.
Ticker Market cap (mil
VND) 2016E Net
Profit Outstanding shares (mil)
Price (VND)
12M Trailing EPS (VND)
P/E BV P/B
C32 543,200 79,000 11.20 48,500 6,348 7.64 30,700 1.58
NNC 900,775 145,000 13.15 68,500 9,924 6.90 35,468 1.93
DHA 359,856 30,400 15.12 23,800 1,810 13.15 13,969 1.70
Total 1,803,831 254,400
Industry average (Market cap weighted)
7.09
Industry average
9.23
1.74
Compared to its peer, KSB is the largest market cap stock, with longer mine license. We believe
that it should desire PE of 9x and PB of 2x.
VND/share PE PB
Fair price 56,124 53,490 54,807
2. DCF method:
Capital Asset Pricing Model (CAPM)
Capital Asset Pricing Model (CAPM)
Levered beta 1.3
Levered beta 1.2
Risk free rate 6.5%
Risk free rate 5.0%
Risk premium for Vietnam 11.0%
Risk premium for Vietnam 8.0%
Cost of equity 20.80%
Cost of equity 14.60%
Weighted average cost of capital
Weighted average cost of capital
Cost of equity 20.80%
Cost of equity 14.60%
Cost of debt 11.00%
Cost of debt 9.00%
CIT rate 20.00%
CIT rate 20.00%
Equity/(Equity +Debt) 100.0%
Equity/(Equity +Debt) 100.0%
WACC 20.80%
WACC 14.60%
Consolidated (VND million) 2015 2016F 2017F 2018F 2019F 2020F
EBIT 162,762 239,669 238,217 262,233 293,432 328,488
Abnormal adjustments
0 0 0 0 0
Adjusted EBIT 162,762 239,669 238,217 262,233 293,432 328,488
Effective CIT rate (%) 23.0% 20.0% 20.0% 20.0% 20.0% 20.0%
EBIT(1-T) 125,308 191,735 190,573 209,787 234,746 262,790
Add: Depreciation 32,241 37,569 44,450 47,890 51,331 54,424
Less: CAPEX 59,660 120,000 100,000 50,000 50,000 50,000
Less: Change in WC (47,925) 4,532 4,362 2,900 3,418 3,760
Free cash flow to firm 145,814 104,772 130,661 204,777 232,659 263,455
Terminal growth(*)
Terminal value 1,804,488
Discount period
0.00 1.00 2.00 3.00 4.00
Discount factor
1.00 0.83 0.69 0.57 0.47
Present value
104,772 108,163 140,329 131,983 123,720
Terminal PV 669,907
SSI – RESEARCH INSTITUTIONAL RESEARCH & INVESTMENT ADVISORY
SSI.COM.VN Visit SSI Research on Bloomberg at SSIV <GO>
Page 10
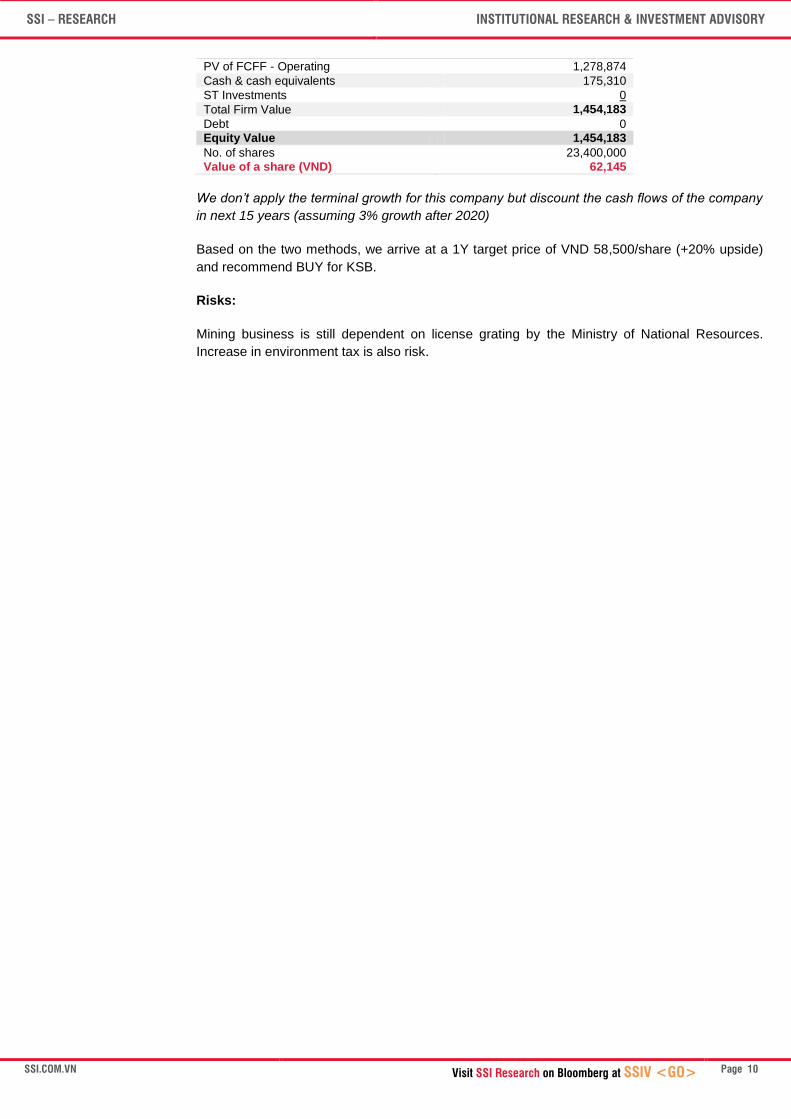
PV of FCFF - Operating 1,278,874
Cash & cash equivalents 175,310
ST Investments 0
Total Firm Value 1,454,183
Debt 0
Equity Value 1,454,183
No. of shares 23,400,000
Value of a share (VND) 62,145
We don’t apply the terminal growth for this company but discount the cash flows of the company
in next 15 years (assuming 3% growth after 2020)
Based on the two methods, we arrive at a 1Y target price of VND 58,500/share (+20% upside)
and recommend BUY for KSB.
Risks:
Mining business is still dependent on license grating by the Ministry of National Resources.
Increase in environment tax is also risk.
SSI – RESEARCH INSTITUTIONAL RESEARCH & INVESTMENT ADVISORY
SSI.COM.VN Visit SSI Research on Bloomberg at SSIV <GO>
Page 11
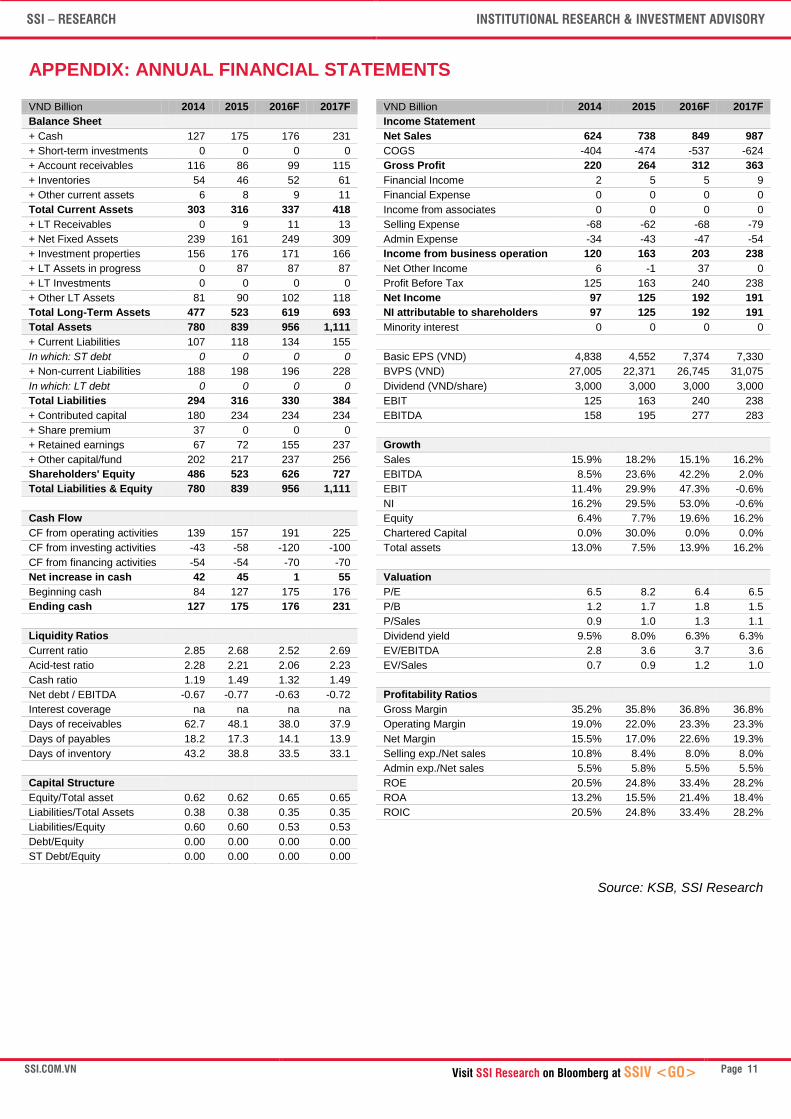
APPENDIX: ANNUAL FINANCIAL STATEMENTS
VND Billion 2014 2015 2016F 2017F
VND Billion 2014 2015 2016F 2017F
Balance Sheet
Income Statement
+ Cash 127 175 176 231
Net Sales 624 738 849 987
+ Short-term investments 0 0 0 0
COGS -404 -474 -537 -624
+ Account receivables 116 86 99 115
Gross Profit 220 264 312 363
+ Inventories 54 46 52 61
Financial Income 2 5 5 9
+ Other current assets 6 8 9 11
Financial Expense 0 0 0 0
Total Current Assets 303 316 337 418
Income from associates 0 0 0 0
+ LT Receivables 0 9 11 13
Selling Expense -68 -62 -68 -79
+ Net Fixed Assets 239 161 249 309
Admin Expense -34 -43 -47 -54
+ Investment properties 156 176 171 166
Income from business operation 120 163 203 238
+ LT Assets in progress 0 87 87 87
Net Other Income 6 -1 37 0
+ LT Investments 0 0 0 0
Profit Before Tax 125 163 240 238
+ Other LT Assets 81 90 102 118
Net Income 97 125 192 191
Total Long-Term Assets 477 523 619 693
NI attributable to shareholders 97 125 192 191
Total Assets 780 839 956 1,111
Minority interest 0 0 0 0
+ Current Liabilities 107 118 134 155
In which: ST debt 0 0 0 0
Basic EPS (VND) 4,838 4,552 7,374 7,330
+ Non-current Liabilities 188 198 196 228
BVPS (VND) 27,005 22,371 26,745 31,075
In which: LT debt 0 0 0 0
Dividend (VND/share) 3,000 3,000 3,000 3,000
Total Liabilities 294 316 330 384
EBIT 125 163 240 238
+ Contributed capital 180 234 234 234
EBITDA 158 195 277 283
+ Share premium 37 0 0 0
+ Retained earnings 67 72 155 237
Growth
+ Other capital/fund 202 217 237 256
Sales 15.9% 18.2% 15.1% 16.2%
Shareholders' Equity 486 523 626 727
EBITDA 8.5% 23.6% 42.2% 2.0%
Total Liabilities & Equity 780 839 956 1,111
EBIT 11.4% 29.9% 47.3% -0.6%
NI 16.2% 29.5% 53.0% -0.6%
Cash Flow
Equity 6.4% 7.7% 19.6% 16.2%
CF from operating activities 139 157 191 225
Chartered Capital 0.0% 30.0% 0.0% 0.0%
CF from investing activities -43 -58 -120 -100
Total assets 13.0% 7.5% 13.9% 16.2%
CF from financing activities -54 -54 -70 -70
Net increase in cash 42 45 1 55
Valuation
Beginning cash 84 127 175 176
P/E 6.5 8.2 6.4 6.5
Ending cash 127 175 176 231
P/B 1.2 1.7 1.8 1.5
P/Sales 0.9 1.0 1.3 1.1
Liquidity Ratios
Dividend yield 9.5% 8.0% 6.3% 6.3%
Current ratio 2.85 2.68 2.52 2.69
EV/EBITDA 2.8 3.6 3.7 3.6
Acid-test ratio 2.28 2.21 2.06 2.23
EV/Sales 0.7 0.9 1.2 1.0
Cash ratio 1.19 1.49 1.32 1.49
Net debt / EBITDA -0.67 -0.77 -0.63 -0.72
Profitability Ratios
Interest coverage na na na na
Gross Margin 35.2% 35.8% 36.8% 36.8%
Days of receivables 62.7 48.1 38.0 37.9
Operating Margin 19.0% 22.0% 23.3% 23.3%
Days of payables 18.2 17.3 14.1 13.9
Net Margin 15.5% 17.0% 22.6% 19.3%
Days of inventory 43.2 38.8 33.5 33.1
Selling exp./Net sales 10.8% 8.4% 8.0% 8.0%
Admin exp./Net sales 5.5% 5.8% 5.5% 5.5%
Capital Structure
ROE 20.5% 24.8% 33.4% 28.2%
Equity/Total asset 0.62 0.62 0.65 0.65
ROA 13.2% 15.5% 21.4% 18.4%
Liabilities/Total Assets 0.38 0.38 0.35 0.35
ROIC 20.5% 24.8% 33.4% 28.2%
Liabilities/Equity 0.60 0.60 0.53 0.53
Debt/Equity 0.00 0.00 0.00 0.00
ST Debt/Equity 0.00 0.00 0.00 0.00
Source: KSB, SSI Research
SSI – RESEARCH INSTITUTIONAL RESEARCH & INVESTMENT ADVISORY
SSI.COM.VN Visit SSI Research on Bloomberg at SSIV <GO>
Page 12
1. ANALYST CERTIFICATION
The research analyst(s) on this report certifies that (1) the views expressed in this research report accurately reflect
his/her/our own personal views about the securities and/or the issuers and (2) no part of the research analyst(s)’
compensation was, is, or will be directly or indirectly related to the specific recommendation or views contained in this
research report.
2. RATING
Within 12-month horizon, SSIResearch rates stocks as either BUY, HOLD or SELL determined by the stock’s expected
return relative to the market required rate of return, which is 18% (*). A BUY rating is given when the security is expected to
deliver absolute returns of 18% or greater. A SELL rating is given when the security is expected to deliver returns below or
equal to -9%, while a HOLD rating implies returns between -9% and 18%.
Besides, SSIResearch also provides Short-term rating where stock price is expected to rise/reduce within three months
because of a stock catalyst or event. Short-term rating may be different from 12-month rating.
Industry Rating: We provide the analyst’ industry rating as follows:
Overweight: The analyst expects the performance of the industry over the next 6-12 months to be attractive vs. the
relevant broad market
Neutral: The analyst expects the performance of the industry over the next 6-12 months to be in line with the relevant
broad market
Underweight: The analyst expects the performance of the industry over the next 6-12 months with caution vs. the
relevant broad market.
*The market required rate of return is calculated based on 5-year Vietnam government bond yield and market risk premium derived from using
Relative Equity Market Standard Deviations method. Our rating bands are subject to changes at the time of any significant changes in the above
two constituents.
3. DISCLAIMER
The information, statements, forecasts and projections contained herein, including any expression of opinion, are based
upon sources believed to be reliable but their accuracy completeness or correctness are not guaranteed. Expressions of
opinion herein were arrived at after due and careful consideration and they were based upon the best information then
known to us, and in our opinion are fair and reasonable in the circumstances prevailing at the time, and no unpublished price
sensitive information would be included in the report. Expressions of opinion contained herein are subject to change without
notice. This document is not, and should not be construed as, an offer or the solicitation of an offer to buy or sell any
securities. SSI and other companies in the SSI and/or their officers, directors and employees may have positions and may
affect transactions in securities of companies mentioned herein and may also perform or seek to perform investment banking
services for these companies.
This document is for private circulation only and is not for publication in the press or elsewhere. SSI accepts no liability
whatsoever for any direct or consequential loss arising from any use of this document or its content. The use of any
information, statements forecasts and projections contained herein shall be at the sole discretion and risk of the user.
SSI – RESEARCH INSTITUTIONAL RESEARCH & INVESTMENT ADVISORY
WWW.SSI.COM.VN SAIGON SECURITIES INC. Member of the Ho Chi Minh Stock Exchange, Regulated by the State Securities Commission
HO CHI MINH CITY 72 Nguyen Hue Street, District 1 Ho Chi Minh City Tel: (848) 3824 2897 Fax: (848) 3824 2997 Email: [email protected]
HANOI 1C Ngo Quyen Street, Ha Noi City Tel: (844) 3936 6321 Fax: (844) 3936 6311 Email: [email protected]
Page 13
4. CONTACT INFORMATION
Institutional Research & Investment Advisory
Kien Trung Nguyen, CFA
Research Manager
Tel: (844) 3936 6321 ext. 510
Phuong Hoang Hung Pham Giang Nguyen
Deputy Managing Director, Associate Director Associate Director
Head of Institutional Research & Investment Advisory [email protected] [email protected]


 - MÚc luong tói thiéu 2750.000 VND (tuong duong 130 USD/nguòi/tháng) Cong nhån: luong trung binh tuong duong 180 - 250 USD/nguòi/tháng) (2) - KY su/ KY thuat](https://img.pdfslide.us/doc/110x75/60d039c5dd55d815ac441eab/untitled-1-1-mc-luong-ti-thiu-2750000-vnd-tuong-duong-130-usdnguithng.jpg)