Embed Size (px)
Citation preview

BINDURI DISTRICT

ii
Copyright© 2014 Ghana Statistical Service

iii
PREFACE AND ACKNOWLEDGEMENT
No meaningful developmental activity can be undertaken without taking into account the
characteristics of the population for whom the activity is targeted. The size of the population
and its spatial distribution, growth and change over time, in addition to its socio-economic
characteristics are all important in development planning.
A population census is the most important source of data on the size, composition, growth
and distribution of a country’s population at the national and sub-national levels. Data from
the 2010 Population and Housing Census (PHC) will serve as reference for equitable
distribution of national resources and government services, including the allocation of
government funds among various regions, districts and other sub-national populations to
education, health and other social services.
The Ghana Statistical Service (GSS) is delighted to provide data users, especially the
Metropolitan, Municipal and District Assemblies, with district-level analytical reports based
on the 2010 PHC data to facilitate their planning and decision-making.
The District Analytical Report for the Binduri District is one of the 216 district census reports
aimed at making data available to planners and decision makers at the district level. In
addition to presenting the district profile, the report discusses the social and economic
dimensions of demographic variables and their implications for policy formulation, planning
and interventions. The conclusions and recommendations drawn from the district report are
expected to serve as a basis for improving the quality of life of Ghanaians through evidence-
based decision-making, monitoring and evaluation of developmental goals and intervention
programmes.
For ease of accessibility to the census data, the district report and other census reports
produced by the GSS will be disseminated widely in both print and electronic formats. The
report will also be posted on the GSS website: www.statsghana.gov.gh.
The GSS wishes to express its profound gratitude to the Government of Ghana for providing
the required resources for the conduct of the 2010 PHC. While appreciating the contribution
of our Development Partners (DPs) towards the successful implementation of the Census, we
wish to specifically acknowledge the Department for Foreign Affairs, Trade and
Development (DFATD) formerly the Canadian International Development Agency (CIDA)
and the Danish International Development Agency (DANIDA) for providing resources for
the preparation of all the 216 district reports. Our gratitude also goes to the Metropolitan,
Municipal and District Assemblies, the Ministry of Local Government, Consultant Guides,
Consultant Editors, Project Steering Committee members and their respective institutions for
their invaluable support during the report writing exercise. Finally, we wish to thank all the
report writers, including the GSS staff who contributed to the preparation of the reports, for
their dedication and diligence in ensuring the timely and successful completion of the district
census reports.
Dr. Philomena Nyarko
Government Statistician

iv
TABLE OF CONTENTS
PREFACE AND ACKNOWLEDGEMENT .................................................................. iii
LIST OF TABLES ......................................................................................................... vi
LIST OF FIGURES ...................................................................................................... vii
ACRONYMS AND ABBREVIATIONS....................................................................... viii
EXECUTIVE SUMMARY ............................................................................................. xi
CHAPTER ONE: INTRODUCTION ................................................................................... 1
1.1 Background ................................................................................................................ 1
1.2 Physical Features ....................................................................................................... 1
1.3 Political Administration ............................................................................................. 3
1.4 Social and Cultural Structure ..................................................................................... 3
1.5 Economy .................................................................................................................... 4
1.6 Census Methodology, Concepts and Definitions ....................................................... 4
1.7 Organization of the Report....................................................................................... 14
CHAPTER TWO: DEMOGRAPHIC CHARACTERISTICS ..................................... 15 2.1 Introduction .............................................................................................................. 15
2.2 Population Size and Distribution ............................................................................. 15
2.3 Population Pyramid .................................................................................................. 16
2.4 Fertility, Mortality and Migration ............................................................................ 17
CHAPTER THREE: SOCIAL CHARACTERISTICS ................................................. 23 3.1 Introduction .............................................................................................................. 23
3.2 Household Size, Composition and Headship ........................................................... 23
3.3 Marital Status ........................................................................................................... 24
3.4 Nationality................................................................................................................ 28
3.5 Religious Affiliation ................................................................................................ 29
3.6 Literacy and Education ............................................................................................ 29
CHAPTER FOUR: ECONOMIC CHARACTERISTICS............................................ 34 4.1 Introduction .............................................................................................................. 34
4.2 Economic Activity Status ........................................................................................ 34
4.3 Occupation ............................................................................................................... 36
4.4 Industry .................................................................................................................... 37
4.5 Employment Status .................................................................................................. 38
4.6 Employment Sector .................................................................................................. 39
CHAPTER FIVE: INFORMATION COMMUNICATION TECHNOLOGY ............. 41 5.1 Introduction .............................................................................................................. 41
5.2 Ownership of Mobile Phones................................................................................... 41
5.3 Use of Internet.......................................................................................................... 41
5.5 Household Ownership of Desktop or Laptop Computer ......................................... 42
CHAPTER SIX: DISABILITY ........................................................................................... 44
6.1 Introduction .............................................................................................................. 44
6.2 Population with Disability ....................................................................................... 44
6.3 Type of Disability .................................................................................................... 44
6.4 Disability and Activity ............................................................................................. 45

v
6.5 Disability, Education and Literacy .......................................................................... 46
CHAPTER SEVEN: AGRICULTURAL ACTIVITIES ............................................... 48 7.1 Introduction .............................................................................................................. 48
7.2 Households in Agriculture ....................................................................................... 48
7.3 Types of Farming Activities .................................................................................... 48
CHAPTER EIGHT: HOUSING CONDITIONS .......................................................... 50 8.1 Introduction .............................................................................................................. 50
8.2 Housing Stock .......................................................................................................... 50
8.3 Construction Materials ............................................................................................. 50
8.4 Type of Dwelling, Holding and Tenancy Arrangement .......................................... 51
8.5 Room Occupancy ..................................................................................................... 53
8.6 Access to Utilities and Household Facilities ........................................................... 53
8.7 Main Source of Water for Drinking and for other Domestic Use............................ 55
8.8 Bathing and Toilet Facilities .................................................................................... 56
8.9 Methods of waste disposal ....................................................................................... 57
CHAPTER NINE: SUMMARY OF FINDINGS, CONCLUSION AND POLICY
IMPLICATIONS ........................................................................... 58 9.1 Introduction .............................................................................................................. 58
9.2 Summary of findings................................................................................................ 58
9.3 Conclusion ............................................................................................................... 60
9.4 Policy Implications .................................................................................................. 61
REFERENCES ............................................................................................................. 63
APPENDICES ............................................................................................................... 64
LIST OF CONTRIBUTORS ......................................................................................... 70

vi
LIST OF TABLES
Table 2.1: Population by age, sex and type of locality ........................................................... 15
Table 2.2: Age dependency ratio by sex ................................................................................. 16
Table 2.4: Reported total fertility rate, general fertility rate and crude birth rate by district .. 18
Table 2.5: Female population 12 years and older by age, children ever born, children
surviving and sex of child ...................................................................................... 18
Table 2.6: Total population, deaths in households and crude death rate by districts .............. 19
Table 2.7: Death in Households .............................................................................................. 20
Table 2.3: Birthplace by duration of residence ....................................................................... 22
Table 3.2: Household population by composition and sex ..................................................... 23
Table 3.3: Household population by structure and sex ........................................................... 24
Table 3.4: Persons 12 years and older by age-group, sex, and marital status ......................... 26
Table 3.5: Persons 12 years and older by marital status, sex and level of education ............. 27
Table 3.6: Persons 12 years and older by marital status, sex and economic activity status ... 28
Table 3.8: Population by religion and sex .............................................................................. 29
Table 3.9: Population 11 years and older by sex, age and literacy status ............................... 30
Table 3.10:Population 3 years and older by level of education, school attendance and sex ... 33
Table 4.1: Population 15 years and older by activity status and sex ...................................... 34
Table 4.2: Economic activity status of population 15 years and older by age and sex .......... 35
Table 4.3: Employed population 15 years and older by occupation and sex .......................... 37
Table 4.4: Employed population 15 years and older by industry and sex .............................. 38
Table 4.5: Employed population 15 years and older by employment status and sex ............. 39
Table 4.6: Employed population 15 years and older by employment sector and sex ............. 39
Table 6.1: Population by type of locality, disability type and sex .......................................... 45
Table 6.2: Persons 15 years and older with disability by economic activity status and ......... 45
Table 6.3: Population 3 years and older by sex, disability type and level of education ......... 47
Table 7.1: Households by agricultural activities and locality ................................................. 48
Table 7.2: Distribution of livestock and keepers .................................................................... 49
Table 8.1: Stock of houses and households by type of locality .............................................. 50
Table 8.2: Main construction material for outer wall of dwelling unit by type of locality .... 51
Table 8.3: Ownership status of dwelling by sex of household head ....................................... 51
Table 8.4: Type of occupied dwelling unit by sex of household head and type of locality ... 52
Table 8.5: Main construction materials for the floor of dwelling unit by type of locality ..... 52
Table 8.6: Main material for roofing of dwelling unit by type of locality .............................. 53
Table 8.7: Household size and number of sleeping rooms occupied in dwelling unit ........... 53
Table 8.8: Main source of lighting of dwelling unit by type of locality ................................. 54
Table 8.9: Main source of cooking fuel, and cooking space used by households .................. 54
Table 8.10:Main source of drinking water for household........................................................ 55
Table 8.11:Main source of water for other domestic use of household ................................... 56
Table 8.12:Bathing facility and toilet facilities used by household ......................................... 56
Table 8.13:Method of rubbish and liquid waste disposal by households ................................ 57
Table A1: Household Composition by type of locality .......................................................... 64

vii
Table A2: Population 3 years and older by sex, disability type and level of education ......... 65
Table A3: Distribution of households engaged in tree growing or crop farming by type of
crop and population engaged ................................................................................. 66
Table A4: Population by sex, number of household and houses in the 20 largest
communities ........................................................................................................... 68
Table A5: Population by age group in the 20 largest communities ........................................ 69
LIST OF FIGURES
Figure 1.1: District map .......................................................................................................... 15
Figure 3.1: Persons 12 years and older by marital status ........................................................ 25
Figure 3.2: Literacy by language of persons 11 years and older ............................................ 30
Figure 3.3: School attendance ................................................................................................. 32
Figure 4.3: Employed population 15 years and older by employment sector ........................ 40
Figure 5.1: Population 12 years and older by mobile phone ownership internet usage
and sex ................................................................................................................. 42
Figure 5.2: Households having desktop/laptop computers and sex of head ........................... 43

viii
ACRONYMS AND ABBREVIATIONS
AIDS: Acquired Immune Deficiency Syndrome
ASFR Age Specific Fertility Rate
0C Degree Celsius
CBR Crude Birth Rate
CEB: Children Ever Born
CEDAW: Convention on Elimination of All forms of Discrimination
CHIPS: Community Health Planning Services
CIDA: Canadian International Development Agency
CS: Children Surviving
CWIQ: Core Welfare Indicator Questionnaire
DANIDA: Danish International Development Agency
DCD District Coordinating Director
DCE District Chief Executive
DPO: District Planning Officer
DFID: Department for International Development
DP Development Partner
EA: Enumeration Area
ECOWAS: Economic Community of West African States
EMIS: Education Management Information System
0F Degree Fahrenheit
EU: European Union
fCUBE: Free Compulsory Universal Basic Education
GDHS: Ghana Demographic Health Survey
GDP: Gross Domestic product
GES: Ghana Education Service
GETFund: Ghana Education Trust Fund
GFR Gross Fertility Rate
GoG: Government of Ghana
GPRTU: Ghana Private Road Transport Union
GPS: Global Positioning System
GSDP: Ghana Statistics Development Plan
GSOP Ghana Social Opportunities Project
GSS: Ghana Statistical Service

ix
HIV: Human Immune Virus
ICT: Information and Communication Technology
ICT4AD: ICT for Accelerated Development
ICU: International Communication Union
ISCO: International Standard Classification of Occupation
ISIC: International Standard Classification of Industry
ISSER: Institute of Statistical Social and Economic Research
JHS: Junior High School
JSS: Junior Secondary School
Km Kilometre
Km2 Kilometre square or square kilometer
KVIP Kumasi Ventilated Improved Pit
L.I. Legislative Instrument
LEAP: Livelihood Empowerment Against Poverty
LESDEP: Local Enterprise and Skills Development Programme
MDGs: Millennium Development Goals
MER: Migration Effectiveness Ratio
MICS: Multiple Indicator Cluster Survey
MMDAs: Metropolitan, Municipal and District Assemblies
MOE: Ministry of Education
MOFA: Ministry of Food and Agriculture
MOTI: Ministry of Trade and Industry
NCA: National Communication Authority
NCPEC: The National Census Publicity and Evaluation Committee
NCTAC: National Census Technical Advisory Committee
NDA: Nabdam District Assembly
NDPC: National Development Planning Commission
NGOs: Non-Governmental Organisations
NHIS: National Health Insurance Scheme
OIC: Opportunities Industrialisation Centre
PAS: Population Analysis Spreadsheet
PASEX: Population Analysis System
PES: Post Enumeration Survey
PHC: Population and Housing Census
PM Presiding Member

x
PNDC: Provisional National Defense Council
PPP: Public-Private Partnerships
PWDs: Persons with disabilities
SADA: Savanna Accelerated Development Authority
SAP: Structural Adjustment Programme
SHS: Senior High School
SMAM: Singulate Mean Age at Marriage
SSS: Senior Secondary School
TFR Total Fertility Rate
UN: United Nations
UNDP: United Nations Development Programme
UNFPA: United Nations Population Fund
UNICEF: United Nations International Children’s Education Fund
W.C: Water Closet
WHO: World Health Organization

xi
EXECUTIVE SUMMARY
Introduction
The district census report is the first of its kind since the first post-independence census was
conducted in 1960. The report provides basic information about the district. It gives a brief
background of the district, describing its physical features, political and administrative
structure, socio-cultural structure and economy. Using data from the 2010 Population and
Housing Census (2010 PHC), the report discusses the population characteristics of the district,
fertility, mortality, migration, marital status, literacy and education, economic activity status,
occupation, employment; Information Communication Technology (ICT), disability,
agricultural activities and housing conditions of the district. The key findings of the analysis are
as follows (references are to the relevant sections of the report):
Population size, structure and composition
The population of Binduri District, according to the 2010 Population and Housing Census, is
61,576 representing 5.9 percent of the region’s total population. Males constitute 48.1 percent
and females represent 51.9 percent. The population is entirely rural. The district has a sex
ratio of 92.6. The population of the district is youthful (0-14years) (43.9%) depicting a broad
base population pyramid which tapers off with a small number of elderly persons (60 years
and older) constituting 10.8 percent. The total age dependency ratio for the District is 108.8,
the age dependency ratio for males is higher (122.9) than that of females (97.3).
Fertility, mortality and migration
The Total Fertility Rate for the district is 3.6. The General Fertility Rate is 97.5 births per
1000 women aged 15-49 years which is the third highest for the region. The Crude Birth Rate
(CBR) is 21.2 per 1000 population. The crude death rate for the district is 8.3 per 1000.
Accident/violence/homicide/suicide accounted for 8.4 percent of all deaths while other causes
constitute 91.6 percent of deaths in the district. The district has a migrant population of 3,155.
Majority of migrants (83.1%) living in the district were born in another region while 14.8
percent were born elsewhere in Upper East Region. For migrants born in another region,
those born in Ashanti Region constitute 48.5 percent followed by Brong Ahafo and Northern
Region accounting for 7.0 percent each.
Household Size, composition and structure
The district has a household population of 60,878 with a total number of 9,199 households.
The average household size in the district is 6.6 persons per household. Children constitute
the largest proportion of the household members accounting for 50.5 percent. Spouses form
about 10.7 percent. Majority of households (54.4%) are composed of Extended (Head,
spouse, children and Heads relatives) household structure. Nuclear households (head,
spouse(s) and children) constitute 21.9 percent of the total number of households in the
district.
Marital status
About five in ten (51.4%) of the population aged 12 years and older are married, 38.1 percent
have never married,1.1 percent are in consensual unions, 7.6 percent are widowed, 1.1
percent are divorced and 0.7 percent are separated. By age 25-29 years, more than half of
females (79.5%) are married compared to about 49.0 percent of males. At age 65 and above,

xii
widowed females account for as high as 54.5 percent while widowed males account for only
6.5 percent. . Among the married, 81.3 percent have no education while about 23 percent of
the never married have never been to school. More than three quarters of the married
population (92.0%) are employed, 0.6 percent is unemployed and 7.4 percent are
economically not active. A high proportion of those who have never married (42.8%) are
economically not active with 0.7 percent unemployed.
Nationality
The proportion of Ghanaians by birth in the district is 93.6 percent. Those who have
naturalised constitute 1.1 percent and the non-Ghanaian population in the district is 2.8
percent.
Literacy and education
Of the population 11 years and above, 42.2 percent are literate and 57.8 percent are non-
literate. The proportion of literate males is higher (57.2 %) than that of females (42.8%).
Three out of ten people (31.1%) indicated they could speak and write both English and
Ghanaian languages. Of the population aged 3 years and above (22,730) in the district, 50.1
percent has never attended school, 39.8 percent are currently attending and 10.1 percent have
attended in the past.
Economic Activity Status
About 80.9 percent of the population aged 15 years and older are economically active while
19.1 per cent are economically not active. Of the economically active population, 99.1
percent are employed while 0.9 percent is unemployed. For those who are economically not
active, a larger percentage of them are students (51.6%), 14.8% perform household duties and
6.1 percent are disabled or too sick to work. four out of ten unemployed are seeking work for
the first time.
Occupation
Of the employed population, about 84.3 percent are engaged as skilled agricultural, forestry
and fishery workers, 5.9 percent in service and sales, 5.2 percent in craft and related trade,
and 2.5 percent are engaged as managers, professionals, and technicians.
Employment status and sector
Of the population 15 years and older 65.6 percent are self-employed without employees, 25.5
percent are contributing family workers, 0.7 percent are casual workers and 0.8 percent are
domestic employees (house helps). Overall, men constitute the highest proportion in each
employment category except the contributing family workers. The private informal sector is
the largest employer in the district, employing 96.5 percent of the population followed by the
public sector with 2.2 percent.
Information Communication Technology
Of the population 12 years and above, 17.5 percent have mobile phones. Males who own
mobile phones constitute 25.0 percent as compared to 10.7 percent of females. A little over
one percent of the population 12 years and older uses internet facilities in the district. Only1.4
percent of the total households in the district have desktop/laptop computers.

xiii
Disability
About 2.8 percent of the district’s total population has one form of disability or the other. The
proportion of the male population with disability is slightly higher (2.9%) than females
(2.7%). The types of disability in the district include sight, hearing, speech, physical,
intellect, and emotion. Persons with sight disability recorded the highest of 41.9 percent
followed by physical disability (26.3%). There are more females with sight and physical
disability but more males with emotional disability in the district.
Agriculture
As high as 93.9 percent of households in the district are engage in agriculture. All
agricultural households are rural households as the district is entirely rural. Most households
in the district (99.3 %) are involved in crop farming. Poultry (chicken) is the dominant
animal reared in the district.
Housing
The housing stock of Binduri District is 6,391 representing 5.6 percent of the total number of
houses in the Ashanti Region. The average number of persons per house is 9.2.
Type, tenancy arrangement and ownership of dwelling units
Over half (70.4%) of all dwelling units in the district are compound houses; 19.2 percent are
separate houses and 2.0 percent are semi-detached houses. More than half (92.5%) of the
dwelling units in the district are owned by members of the household; 2.6 percent are owned
by private individuals; 3.2 percent are owned by a relative who is not a member of the
household and only 0.6 percent are owned by public or government. Less than one percent
(0.2%) of the dwelling units is owned through mortgage schemes.
Material for construction of outer wall, floor and roof
The main construction material for outer walls of dwelling units in the district is mud/mud
bricks or earth accounting for 88.1 percent with cement/concrete constituting 27.1 percent of
outer walls of dwelling units in the district. Cement (72.2%) and mud/earth (23.3%) are the
two main materials used in the construction of floors of dwelling units in the district. Metal
sheets are the main roofing material (80.5 %) for dwelling units in the district.
Room occupancy
One room constitutes the highest percentage (85.2%) of sleeping rooms occupied by
households in housing units in the district. About 0.6 percent of households with 10 or more
members occupy single rooms.
Utilities and household facilities
The three main sources of lighting in dwelling units in the district are flashlight/torch
(44.0%), kerosene lamp (41.0%) and electricity (13.0%)). The main source of fuel for
cooking for most households in the district is wood (62.8%). The four main sources of water
in the district are borehole, protected well, unprotected well and pipe-borne water outside
dwelling. About half of households (50.6%) drink water from boreholes.
The most common toilet facility used in the district is public toilet (WC, KVIP, Pit, Pan)
representing 6.4 percent followed by pit latrine (5.3%). About 83.7 percent of the population
in the district have no toilet facility. Close to a third of households (28.8%) in the district

xiv
have own bathrooms for exclusive use while 26.6 percent share separate bathrooms in the
same house.
Waste disposal
The most widely used method of solid waste disposal is by public dump in the open space
accounting for 31.5 percent. About one in ten households (15.8%) dump their solid waste
indiscriminately. House to house waste collection accounts for 11.1 percent. For liquid waste
disposal, throwing waste onto the street/outside (44.4%) and onto the compound (35.3%) are
the two most common methods used by households in the district.

1
CHAPTER ONE
INTRODUCTION
1.1 Background
The Binduri District is one of the three (3) new districts in the Upper East Region of Ghana
created in 2012. It was carved out of the Bawku Municipality and established by Legislative
Instrument (L.I. 2146) making it one of the 13 districts in the Upper East Region.
Binduri District is located approximately between latitudes 110
111
and 100
401 N and
longitudes 00
181
W and 00
61
E in the north-eastern corner of the Upper East Region. It shares
boundaries with Burkina Faso to the north, Garu-Tempane District to the south, Bawku
Municipality to the east and Bawku West District to the west. The district covers a total land
area of 391.91 square kilometres. With a total population of 61,576, the district has a
population density of 157.1 persons per square kilometres.
1.2 Physical Features
Climatic Conditions
The climate of the district is characterised by two main seasons; dry and wet, which are
influenced by the North-East Trade Winds and the South-West Monsoon Winds respectively.
The dry season (late November to early March), is influenced by the cold, dry and
dusty harmattan air mass from the Sahara Desert, and is characterised by little rainfall due to low relative humidity, which rarely exceeds 20 percent and low vapour pressure less
than 10 mb. Day temperatures can reach as high as 42° Celsius (especially during February
and March) while night temperatures can be as low as 18° Celsius. The period from May to
October is the wet season. During this period, the entire district comes under the influence of
the Tropical Maritime Air Mass. This air mass, together with rising convectional currents
provides the district with rains. The average amount of rainfall recorded in the district is 800
mm per annum.
Relief and Drainage
The relief is generally low and undulating with heights of about 120 to 150 metres above sea
level. However, a few parts of the district consist of series of plateaus with an average height
of 400 metres. The district has its highest point located on the Zawse Hills peaking beyond
430 metres. This also marks the highest point in the Upper East Region.
The district is mainly drained by the White Volta River. A few streams, dams and dug-outs
can also be found in low surface land areas. Most parts of the district are not well drained
especially during the wet season. The district becomes inaccessible from the regional capital
and other settlements almost on an annual basis due to flooding. The opening of the Bagri
Dam in neighbouring Burkina Faso and the consequent overflow of the banks of the White
Volta River and some of its tributaries aggravates the flooding situation in the district.

2
Figure 1.1: Map of Binduri District
Source: Ghana Statistical Service, GIS

3
Vegetation
The vegetation of the district is mainly the Sahel Savannah type with scattered shrubs, short
grasses and trees. Pockets of the savannah woodland vegetation can also be found in the
district. The most common tree species include shea nut, dawadawa, baobab, mango and
neem. The forested areas in the district can only be found along the White Volta River where
the trees are protected.
Soils
Soils in the district are generally of the Savannah Ochrosol type. Detailed soil classification
by the Savanna Agricultural Research Institute (SARI), Manga reveals four different soil
series. The Varempare Series are mainly sandy loams associated with hornblende and
granites. They are quite permeable with some good level of water retention and are suitable
for the cultivation of cereals and legumes. This type of soil series is found in the eastern part
of the district. The Tafali Series, which have similar characteristics as the Varempare Series,
are found around Binduri and its environs. The Gule and Brenyasi Series, located mostly in
the valleys, are clay loams and suitable for the cultivation of rice, sorghum (naga red) and dry
season vegetable cultivation (Onions and Tomatoes).
1.3 Political Administration
The District Assembly is the highest administrative and legislative body in the district with a
membership of seventeen (17) comprising twelve (12) elected members and five (5)
appointed members. The Executive Committee has seven (7) members (i.e. a third of the
District Assembly) chaired by the District Chief Executive. The Executive Committee has
five (5) statutory sub-committees. The district has four (4) Area Councils.
1.4 Social and Cultural Structure
1.4.1 Traditional Authority
Traditional authority is vested in Divisional Chiefs: Binduri and Kaadi with sub-chiefs from
other communities. All these chiefs are under the Bawku-Naba (President of the Bawku
Traditional Council). The Council handles matters of traditional importance: chieftaincy,
culture and tradition among others. The Traditional Council is represented in the District
Assembly.
1.4.2 Ethnic Groupings
The dominant ethnic group in the district is Kussasi. The main minority groups are
Mamprusi, Bissa and Moshi. There are a few other minority ethnic groups in the district.
1.4.3 Marriage
The traditional marriage entails the distinctive practice or payment of a bride price; the
system where the family of the bridegroom pays some marriage expenses including the
donation of two (2) to four (4) cows to the family of the bride. Many bridegrooms are not
able to pay the dowry.
1.4.4 Inheritance
The inheritance system practised in the district is patrilineal. Under this system, the eldest son
inherits the property of his father in trust for the family. There is no form of ownership of
family assets by daughters in the family.

4
1.4.5 Funerals
Funerals are another major customary practice of the people. Funerals are mostly organized
after the harvest (and especially during the long dry season). Funerals are performed to mark
the end of the transition from earth to the spirit world.
1.4.6 Social Organization
There are various religious groupings in the district. The major ones are Christianity (41.8%),
Islam (35%) and various Traditional Religions (20%). There are other social groupings that
are involved with economic activities. These are mostly into agro processing such as shea
butter extraction, dawadawa processing, pito brewing and onion farming.
1.5 Economy
There are three main active sectors of the district economy namely; agriculture, forestry and
fishing; wholesale and retail, and manufacturing.
1.5.1 Agriculture
Agriculture, forestry and fishing are the main-stay of the local economy accounting for about
83.9% of the economically active population. The major food crops grown are millet,
sorghum, maize, rice, sweet potato, groundnuts, leafy vegetables, pepper, water melon and
onion. Livestock such as cattle, sheep, goats, donkeys are also kept. Some food crops serve as
cash crops and these include onions, tomatoes, and water melon. These are largely cultivated
in the dry season.
1.5.2 Tourism and Hospitality Industry
The tourism and hospitality industries are underdeveloped. The district does not abound in
many tourism potentials. The few unharnessed tourism potentials however include the
Yarigungu Crocodile Pond in Zawse, the Zawse Hills, the Old Slave Market Centre at Bindur
and the Samapid Festival. There are however a few decent private guest houses in the district.
1.6 Census Methodology, Concepts and Definitions
1.6.1 Introduction
Ghana Statistical Service (GSS) was guided by the principle of international comparability
and the need to obtain accurate information in the 2010 Population and Housing Census
(2010 PHC). The Census was, therefore, conducted using all the essential features of a
modern census as contained in the United Nations Principles and Recommendations for
countries taking part in the 2010 Round of Population and Housing Censuses.
Experience from previous post independence censuses of Ghana (1960, 1970, 1984 and 2000)
was taken into consideration in developing the methodologies for conducting the 2010 PHC.
The primary objective of the 2010 PHC was to provide information on the number,
distribution and social, economic and demographic characteristics of the population of Ghana
necessary to facilitate the socio-economic development of the country.
1.6.2 Pre-enumeration activities
Development of census project document and work plans
A large scale statistical operation, such as the 2010 Population and Housing Census required
meticulous planning for its successful implementation. A working group of the Ghana
5
Statistical Service prepared the census project document with the assistance of two
consultants. The document contains the rationale and objectives of the census, census
organization, a work plan as well as a budget. The project document was launched in
November 2008 as part of the Ghana Statistics Development Plan (GSDP) and reviewed in
November 2009.
Census secretariat and committees
A well-structured management and supervisory framework that outlines the responsibilities
of the various stakeholders is essential for the effective implementation of a population and
housing census. To implement the 2010 PHC, a National Census Secretariat was set up in
January 2008 and comprised professional and technical staff of GSS as well as staff of other
Ministries, Departments and Agencies (MDAs) seconded to GSS. The Census Secretariat was
primarily responsible for the day-to-day planning and implementation of the census activities.
The Secretariat had seven units, namely; census administration, cartography, recruitment and
training, publicity and education, field operations and logistics management, data processing,
and data analysis and dissemination.
The Census Secretariat was initially headed by an acting Census Coordinator engaged by the
United Nations Population Fund (UNFPA) in 2008 to support GSS in the planning of the
Census. In 2009, the Census Secretariat was re-organised with the Government Statistician
as the National Chief Census Officer and overall Coordinator, assisted by a Census
Management Team and a Census Coordinating Team. The Census Management Team had
oversight responsibility for the implementation of the Census. It also had the responsibility of
taking critical decisions on the census in consultation with other national committees. The
Census Coordinating Team, on the other hand, was responsible for the day-to-day
implementation of the Census programme.
A number of census committees were also set up at both national and sub-national levels to
provide guidance and assistance with respect to resource mobilization and technical advice.
At the national level, the committees were the National Census Steering Committee (NCSC),
the National Census Technical Advisory Committee (NCTAC) and the National Census
Publicity and Education Committee (NCPEC). At the regional and district levels, the
committees were the Regional Census Implementation Committee and the District Census
Implementation Committee, respectively.
The Regional and District Census Implementation Committees were inter-sectoral in their
composition. Members of the Committees were mainly from decentralized departments with
the Regional and District Coordinating Directors chairing the Regional Census
Implementation Committee and District Census Implementation Committee, respectively.
The Committees contributed to the planning of district, community and locality level
activities in areas of publicity and field operations. They supported the Regional and District
Census Officers in the recruitment and training of field personnel (enumerators and
supervisors), as well as mobilizing logistical support for the census.
Selection of Census topics
The topics selected for the 2010 Population and Housing Census were based on
recommendations contained in the UN Principles and Recommendations for 2010 Round of
Population and Housing Censuses and the African Addendum to that document as well as the
needs of data users. All the core topics recommended at the global level, i.e., geographical
and internal migration characteristics, international migration, household characteristics,
demographic and social characteristics such as age, date of birth, sex, and marital status,

6
fertility and mortality, educational and economic characteristics, issues relating to disability
and housing conditions and amenities were included in the census.
Some topics that were not considered core by the UN recommendations but which were
found to be of great interest and importance to Ghana and were, therefore, included in the
2010 PHC are religion, ethnicity, employment sector and place of work, agricultural activity,
as well as housing topics, such as, type of dwelling, materials for outer wall, floor and roof,
tenure/holding arrangement, number of sleeping rooms, cooking fuel, cooking space and
Information Communication Technology (ICT).
Census mapping
A timely and well implemented census mapping is pivotal to the success of any population
and housing census. Mapping delineates the country into enumeration areas to facilitate
smooth enumeration of the population. The updating of the 2000 Census Enumeration Area
(EA) maps started in the last quarter of 2007 with the acquisition of topographic sheets of all
indices from the Survey and Mapping Division of the Lands Commission. In addition, digital
sheets were also procured for the Geographical Information System Unit.
The Cartography Unit of the Census Secretariat collaborated with the Survey and Mapping
Division of the Lands Commission and the Centre for Remote Sensing and Geographic
Information Services (CERSGIS) of the Department of Geography and Resource
Development, University of Ghana, to determine the viability of migrating from analog to
digital mapping for the 2010 PHC, as recommended in the 2000 PHC Administrative Report.
Field cartographic work started in March 2008 and was completed in February 2010.
Development of questionnaire and manuals
For effective data collection, there is the need to design appropriate documents to solicit the
required information from respondents. GSS consulted widely with main data users in the
process of the questionnaire development. Data users including MDAs, research institutions,
civil society organizations and development partners were given the opportunity to indicate
the type of questions they wanted to be included in the census questionnaire.
Documents developed for the census included the questionnaire and manuals, and field
operation documents. The field operation documents included Enumerator’s Visitation
Record Book, Supervisor’s Record Book, and other operational control forms. These record
books served as operational and quality control tools to assist enumerators and supervisors to
control and monitor their field duties respectively.
Pre-tests and trial census
It is internationally recognized that an essential element in census planning is the pre-testing
of the questionnaire and related instructions. The objective of the pre-test is to test the
questionnaire, the definition of its concepts and the instructions for filling out the
questionnaire.
The census questionnaire was pre-tested twice in the course of its development. The first pre-
test was carried out in March 2009 to find out the suitability of the questions and the
instructions provided. It also tested the adequacy and completeness of the responses and how
respondents understood the questions. The second pre-test was done in 10 selected
enumeration areas in August, 2009. The objective of the second pre-test was to examine the
sequence of the questions, test the new questions, such as, date of birth and migration, and
assess how the introduction of ‘date of birth’ could help to reduce ‘age heaping’. With regard

7
to questions on fertility, the pre-tests sought to find out the difference, if any, between proxy
responses and responses by the respondents themselves. Both pre-tests were carried in the
Greater Accra Region. Experience from the pre-tests was used to improve the final census
questionnaire.
A trial census which is a dress rehearsal of all the activities and procedures that are planned
for the main census was carried out in October/November 2009. These included recruitment
and training, distribution of census materials, administration of the questionnaire and other
census forms, enumeration of the various categories of the population (household,
institutional and floating population), and data processing. The trial census was held in six
selected districts across the country namely; Saboba (Northern Region), Chereponi (Northern
Region), Sene (Brong Ahafo Region), Bia (Western Region), Awutu Senya (Central Region),
and Osu Klottey Sub-Metro (Greater Accra Region). A number of factors were considered in
selecting the trial census districts. These included: administrative boundary issues, ecological
zone, and accessibility, enumeration of floating population/outdoor-sleepers, fast growing
areas, institutional population, and enumeration areas with scattered settlements.
The trial census provided GSS with an opportunity to assess its plans and procedures as well
as the state of preparedness for the conduct of the 2010 PHC. The common errors found
during editing of the completed questionnaires resulted in modifications to the census
questionnaire, enumerator manuals and other documents. The results of the trial census
assisted GSS to arrive at technically sound decisions on the ideal number of persons per
questionnaire, number of persons in the household roster, migration questions, placement of
the mortality question, serial numbering of houses/housing structures and method of
collection of information on community facilities. Lessons learnt from the trial census also
guided the planning of the recruitment process, the procedures for training of census field
staff and the publicity and education interventions.
1.6.3 Census Enumeration
Method of enumeration and field work
All post- independence censuses (1960, 1970, 1984, and 2000) conducted in Ghana used the
de facto method of enumeration where people are enumerated at where they were on census
night and not where they usually reside. The same method was adopted for the 2010 PHC.
The de facto count is preferred because it provides a simple and straight forward way of
counting the population since it is based on a physical fact of presence and can hardly be
misinterpreted. It is thought that the method also minimizes the risks of under-enumeration
and over enumeration. The canvasser method, which involves trained field personnel visiting
houses and households identified in their respective enumeration areas, was adopted for the
2010 PHC.
The main census enumeration involved the canvassing of all categories of the population by
trained enumerators, using questionnaires prepared and tested during the pre-enumeration
phase. Specific arrangements were made for the coverage of special population groups, such
as the homeless and the floating population. The fieldwork began on 21st September 2010
with the identification of EA boundaries, listing of structures, enumeration of institutional
population and floating population.
The week preceding the Census Night was used by field personnel to list houses and other
structures in their enumeration areas. Enumerators were also mobilized to enumerate
residents/inmates of institutions, such as, schools and prisons. They returned to the
institutions during the enumeration period to reconcile the information they obtained from

8
individuals and also to cross out names of those who were absent from the institutions on
Census Night. Out-door sleepers (floating population) were also enumerated on the Census
Night.
Enumeration of the household population started on Monday, 27th
September, 2010.
Enumerators visited houses, compounds and structures in their enumeration areas and started
enumerating all households including visitors who spent the Census Night in the households.
Enumeration was carried out in the order in which houses/structures were listed and where
the members of the household were absent, the enumerator left a call-back-card indicating
when he/she would come back to enumerate the household. The enumeration process took off
smoothly with enumerators poised on completing their assignments on schedule since many
of them were teachers and had to return to school. However, many enumerators ran short of
questionnaires after a few days’ work.
Enumeration resumed in all districts when the questionnaire shortage was resolved and by
17th
October, 2010, enumeration was completed in most districts. Enumerators who had
finished their work were mobilized to assist in the enumeration of localities that were yet to
be enumerated in some regional capitals and other fast growing areas. Flooded areas and
other inaccessible localities were also enumerated after the end of the official enumeration
period. Because some enumeration areas in fast growing cities and towns, such as, Accra
Metropolitan Area, Kumasi, Kasoa and Techiman were not properly demarcated and some
were characterized by large EAs, some enumerators were unable to complete their assigned
tasks within the stipulated time.
1.6.4 Post Enumeration Survey
In line with United Nations recommendations, GSS conducted a Post Enumeration Survey
(PES) in April, 2011 to check content and coverage error. The PES was also to serve as an
important tool in providing feedback regarding operational matters such as concepts and
procedures in order to help improve future census operations. The PES field work was
carried out for 21 days in April 2011 and was closely monitored and supervised to ensure
quality output. The main findings of the PES were that:
97.0 percent of all household residents who were in the country on Census Night (26th
September, 2010) were enumerated.
1.3 percent of the population was erroneously included in the census.
Regional differentials are observed. Upper East region recorded the highest coverage
rate of 98.2 percent while the Volta region had the lowest coverage rate of 95.7
percent.
Males (3.3%) were more likely than females (2.8%) to be omitted in the census. The
coverage rate for males was 96.7 percent and the coverage rate for females was 97.2
percent. Also, the coverage rates (94.1%) for those within the 20-29 and 30-39 age
groups are relatively lower compared to the coverage rates of the other age groups.
There was a high rate of agreement between the 2010 PHC data and the PES data for
sex (98.8%), marital status (94.6%), relationship to head of household (90.5%) and
age (83.0%).

9
1.6.5 Release and dissemination of results
The provisional results of the census were released in February 2011 and the final results in
May 2012. A National Analytical report, six thematic reports, a Census Atlas, 10 Regional
Reports and a report on Demographic, Social, Economic and Housing were prepared and
disseminated in 2013.
1.6.6 Concepts and Definitions
Introduction
The 2010 Population and Housing Census of Ghana followed the essential concepts and
definitions of a modern Population and Housing Census as recommended by the United
Nations (UN). It is important that the concepts, definitions and recommendations are adhered
to since they form the basis upon which Ghana could compare her data with that of other
countries.
The concepts and definitions in this report cover all sections of the 2010 Population and
Housing Census questionnaires (PHC1A and PHC1B). The sections were: geographical
location of the population, Household and Non-household population, Literacy and
Education, Emigration, Demographic and Economic Characteristics, Disability, Information
Communication Technology (ICT), Fertility, Mortality, Agricultural Activity and Housing
Conditions.
The concepts and definitions are provided to facilitate understanding and use of the data
presented in this report. Users are therefore advised to use the results of the census within the
context of these concepts and definitions.
Region
There were ten (10) administrative regions in Ghana during the 2010 Population and Housing
Census as they were in 1984 and 2000.
District
In 1988, Ghana changed from the local authority system of administration to the district
assembly system. In that year, the then existing 140 local authorities were demarcated into
110 districts. In 2004, 28 new districts were created; this increased the number of districts in
the country to 138. In 2008, 32 additional districts were created bringing the total number of
districts to 170. The 2010 Population and Housing Census was conducted in these 170
administrative districts (these are made-up of 164 districts/municipals and 6 metropolitan
areas). In 2012, 46 new districts were created to bring the total number of districts to 216.
There was urgent need for data for the 46 newly created districts for planning and decision-
making. To meet this demand, the 2010 Census data was re-programmed into 216 districts
after carrying out additional fieldwork and consultations with stakeholders in the districts
affected by the creation of the new districts.
Locality
A locality was defined as a distinct population cluster (also designated as inhabited place,
populated centre, settlement) which has a Name or Locally Recognised Status. It included
fishing hamlets, mining camps, ranches, farms, market towns, villages, towns, cities and
many other types of population clusters, which meet the above criteria. There were two
main types of localities, rural and urban. As in previous censuses, the classification of
localities into ‘urban’ and ‘rural’ was based on population size. Localities with 5,000 or more

10
persons were classified as urban while localities with less than 5,000 persons were classified
as rural.
Population
The 2010 Census was a “de facto” count and each person present in Ghana, irrespective of
nationality, was enumerated at the place where he/she spent the midnight of 26th September
2010.
Household
A household was defined as a person or a group of persons, who lived together in the same
house or compound and shared the same house-keeping arrangements. In general, a
household consisted of a man, his wife, children and some other relatives or a house help who
may be living with them. However, it is important to remember that members of a household
are not necessarily related (by blood or marriage) because non-relatives (e.g. house helps)
may form part of a household.
Head of Household
The household head was defined as a male or female member of the household recognised as
such by the other household members. The head of household is generally the person who has
economic and social responsibility for the household. All relationships are defined with
reference to the head.
Household and Non-household population
Household population comprised of all persons who spent the census night in a household
setting. All persons who did not spend the census night in a household setting (except
otherwise stated) were classified as non-household population. Persons who spent census
night in any of the under listed institutions and locations were classified as non-household
population:
(a) Educational Institutions
(b) Children's and Old People’s Homes
(c) Hospitals and Healing Centres
(d) Hotels
(e) Prisons
(f) Service Barracks
(g) Soldiers on field exercise
(h) Floating Population: The following are examples of persons in this category:
i. All persons who slept in lorry parks, markets, in front of stores and offices, public
bathrooms, petrol filling stations, railway stations, verandas, pavements, and all
such places which are not houses or compounds.
ii. Hunting and fishing camps.
iii. Beggars and vagrants (mentally sick or otherwise).

11
Age
The age of every person was recorded in completed years disregarding fractions of days and
months. For those persons who did not know their birthdays, the enumerator estimated their
ages using a list of district, regional and national historical events.
Nationality
Nationality is defined as the country to which a person belongs. A distinction is made
between Ghanaians and other nationals. Ghanaian nationals are grouped into Ghanaian by
birth, Ghanaian with dual nationality and Ghanaian by naturalization. Other nationals are
grouped into ECOWAS nationals, Africans other than ECOWAS nationals, and non-
Africans.
Ethnicity
Ethnicity refers to the ethnic group that a person belonged to. This information is collected
only from Ghanaians by birth and Ghanaians with dual nationality. The classification of
ethnic groups in Ghana is that officially provided by the Bureau of Ghana Languages and
which has been in use since the 1960 census.
Birthplace
The birthplace of a person refers to the locality of usual residence of the mother at the time of
birth. If after delivery a mother stayed outside her locality of usual residence for six months
or more or had the intention of staying in the new place for six or more months, then the
actual town/village of physical birth becomes the birthplace of the child.
Duration of Residence
Duration of residence refers to the number of years a person has lived in a particular place.
This question is only asked of persons not born in the place where enumeration took place.
Breaks in duration of residence lasting less than 12 months are disregarded. The duration of
residence of persons who made multiple movements of one (1) year or more is assumed to be
the number of years lived in the locality (town or village) since the last movement.
Religion
Religion refers to the individual’s religious affiliation as reported by the respondent,
irrespective of the religion of the household head or the head’s spouse or the name of the
person. No attempt was made to find out if respondents actually practiced the faith they
professed.
Marital Status
Marital status refers to the respondent’s marital status as at Census Night. The question on
marital status was asked only of persons 12 years and older. The selection of the age limit of
12 years was based on the average age at menarche and also on the practice in some parts of
the country where girls as young as 12 years old could be given in marriage.
Literacy
The question on literacy referred to the respondent's ability to read and write in any language.
A person was considered literate if he/she could read and write a simple statement with
understanding. The question on literacy was asked only of persons 11 years and older.

12
Education
School Attendance
Data was collected on school attendance for all persons three (3) years and older. School
attendance refers to whether a person has ever attended, was currently attending or has never
attended school. In the census, school meant an educational institution where a person
received at least four hours of formal education.
Although the lower age limit of formal education is six years for primary one, eligibility for
the school attendance question was lowered to three years because pre-school education has
become an important phenomenon in the country.
Level of Education
Level of education refers to the highest level of formal school that a person ever attended or
was attending. This information was obtained for persons 3 years and older.
Activity Status
Activity status refers to economic or non-economic activity of respondents during the 7 days
preceding census night. Information on type of activity was collected on persons 5 years and
older. A person was regarded as economically active if he/she:
i. Worked for pay or profit or family gain for at least 1 hour within the 7 days preceding
Census Night. This included persons who were in paid employment or self-
employment or contributing family workers.
ii. Did not work, but had jobs to return to.
iii. Were unemployed.
The economically not active were persons who did not work and were not seeking for work.
They were classified by reasons for not being economically active. Economically not active
persons included homemakers, students, retired persons, the disabled and persons who were
unable to work due to their age or ill-health.
Occupation
This referred to the type of work the person was engaged in at the establishment where he/she
worked. This was asked only of persons 5 years and older who worked 7 days before the
census night, and those who did not work but had a job to return to as well as those
unemployed who had worked before. All persons who worked during the 7 days before the
census night were classified by the kind of work they were engaged in.
The emphasis was on the work the person did during the reference period and not what he/she
was trained to do. For those who did not work but had a job to return to, their occupation was
the job they would go back to after the period of absence. Also, for persons who had worked
before and were seeking for work and available for work, their occupation was on the last
work they did before becoming unemployed. If a person was engaged in more than one
occupation, only the main one was considered.

13
Industry
Industry referred to the type of product produced or service rendered at the respondent’s work
place. Information was collected only on the main product produced or service rendered in
the establishment during the reference period.
Employment Status
Employment status refers to the status of a person in the establishment where he/she currently
works or previously worked. Eight employment status categories were provided: employee,
self-employed without employees, self-employed with employees, casual worker,
contributing family worker, apprentice, domestic employee (house help). Persons who could
not be classified under any of the above categories were classified as “other”.
Employment Sector
This refers to the sector in which a person worked. The employment sectors covered in the
census were public, private formal, private informal, semi-public/parastatal, NGOs and
international organizations.
Disability
Persons with disability were defined as those who were unable to or were restricted in the
performance of specific tasks/activities due to loss of function of some part of the body as a
result of impairment or malformation. Information was collected on persons with visual/sight
impairment, hearing impairment, mental retardation, emotional or behavioural disorders and
other physical challenges.
Information Communication Technology (ICT)
ICT questions were asked for both individuals and households. Persons having mobile
phones refer to respondents 12 years and older who owned mobile phones (irrespective of the
number of mobile phones owned by each person). Persons using internet facility refers to
those who had access to internet facility at home, internet cafe, on mobile phone or other
mobile device. Internet access is assumed to be not only via computer, but also by mobile
phones, PDA, game machine and digital television.
Households having Personal Computers/Laptops refer to households who own
desktops/laptop computers. The fixed telephone line refers to a telephone line connecting a
customer’s terminal equipment (e.g. telephone set, facsimile machine) to the public switch
telephone network.
Fertility
Two types of fertility data were collected: lifetime fertility and current fertility. Lifetime
fertility refers to the total number of live births that females 12 years and older had ever had
during their life time. Current fertility refers to the number of live births that females 12-54
years old had in the 12 months preceding the Census Night.
Mortality
Mortality refers to all deaths that occurred in the household during the 12 months preceding
the Census Night. The report presents information on deaths due to accidents, violence,
homicide and suicide. In addition, data were collected on pregnancy-related deaths of
females 12-54 years.

14
Agriculture
The census sought information on household members who are engaged in agricultural
activities, including the cultivation of crops or tree planting, rearing of livestock or breeding
of fish for sale or family consumption. Information was also collected on their farms, types of
crops and number and type of livestock.
Housing Conditions and Facilities
The UN recommended definition of a house as “a structurally separate and independent place
of abode such that a person or group of persons can isolate themselves from the hazards of
climate such as storms and the sun’’ was adopted. The definition, therefore, covered any type
of shelter used as living quarters, such as separate houses, semi-detached houses,
flats/apartments, compound houses, huts, tents, kiosks and containers.
Living quarters or dwelling units refer to a specific area or space occupied by a particular
household and therefore need not necessarily be the same as the house of which the dwelling
unit may be a part.
Information collected on housing conditions included the type of dwelling unit, main
construction materials for walls, floor and roof, holding/tenure arrangement, ownership type,
type of lighting, source of water supply and toilet facilities. Data was also collected on
method of disposal of solid and liquid waste.
1.7 Organization of the Report
The report consists of nine chapters. Chapter one provides basic information about the
district. It gives a brief background of the district, describing its physical features, political
and administrative structure, social and cultural structure, economy and the methodology and
concepts used in the report. Chapter two discusses the population size, composition and age
structure. It further discusses the migratory pattern in the district as well as fertility and
mortality.
In chapter three, the focus is on household size, composition and headship as well as the
marital characteristics and nationality of the inhabitants of the district. The chapter also
discusses the religious affiliations and the educational statuses of the members of the district.
Chapter four focuses on economic characteristics such as economic activity status,
occupation, industries and the employment status and sectors that the people are employed.
Information Communication Technology (ICT) is discussed in chapter five. It analyses
mobile phone ownership, internet use and ownership of desktop/laptop computers while
chapter six is devoted to Persons living with disabilities (PWDs) and their socio-demographic
characteristics. Chapter seven concentrates on the agricultural activities of the households,
describing the types of farming activities, livestock rearing and numbers of livestock reared.
In chapter eight, housing conditions such as housing stock, type of dwelling and construction
materials, room occupancy, holding and tenancy, lighting and cooking facilities, bathing and
toilet facilities, waste disposal and source of water for drinking or for other domestic use in
the district are discussed and analyzed in detail. The final chapter, Chapter nine presents the
summary of findings and conclusions. It also discusses the policy implications of the findings
for the district.

15
CHAPTER TWO
DEMOGRAPHIC CHARACTERISTICS
2.1 Introduction
The composition of the population of any nation greatly influences the policies and strategies
that are formulated at the national level to better the lives of the people in a sustainable way.
Knowing the population characteristics of the district is vital as it informs the kind of
developmental goals, objectives, strategies, programmes and projects that are arrived at in
order to bring about development to the district.
This chapter looks at some important population characteristics of the Binduri District. These
characteristics are the size and distribution of the population, age and sex structure, age
dependency ratios, migration, fertility, and mortality.
2.2 Population Size and Distribution
Table 2.1 shows that the district has a total population of 61,576. More than half of the
population (51.9%) are females with 48.1 percent being males. The age cohort with the
highest proportion of the population is 5-9 with 16.0 percent of the population. The least
populated age cohort is 5-9 with 0.1 percent of the population. It is also worth noting that the
district has a youthful population constituting 43.9 percent of the entire population.
Table 2.1: Population by age, sex and type of locality
Age Group
Both
Sexes
Sex Sex
ratio
Type of locality
Male Female Urban Rural Percent
All Ages 61,576 29,612 31,964
92.6
- 61,576 100.0
0 - 04 8,707 4,435 4,272
104
- 8,707 100.0
05 - 09 9,849 5,171 4,678
111
- 9,849 100.0
10 - 14 8,502 4,488 4,014
112
- 8,502 100.0
15 - 19 6,653 3,608 3,045
119
- 6,653 100.0
20 - 24 4,061 2,014 2,047
98.4
- 4,061 100.0
25 - 29 3,360 1,430 1,930
74.1
- 3,360 100.0
30 - 34 2,991 1,201 1,790
67.1
- 2,991 100.0
35 - 39 2,832 1,103 1,729
63.8
- 2,832 100.0
40 - 44 2,487 987 1,500
65.8
- 2,487 100.0
45 - 49 2,184 858 1,326
64.7
- 2,184 100.0
50 - 54 2,090 893 1,197
74.6
- 2,090 100.0
55 - 59 1,219 547 672
81.4
- 1,219 100.0
60 - 64 1,607 645 962
67
- 1,607 100.0
65 - 69 1,131 452 679
66.6
- 1,131 100.0
70 - 74 1,544 629 915
68.7
- 1,544 100.0
75 - 79 964 456 508
89.8
- 964 100.0
80 - 84 704 353 351
101
- 704 100.0
85 - 89 332 170 162
105
- 332 100.0
90 - 94 272 132 140
94.3
- 272 100.0
95 - 99 87 40 47 85.1 - 87 100.0 Source: Ghana Statistical Service, 2010 Population and Housing Census
16
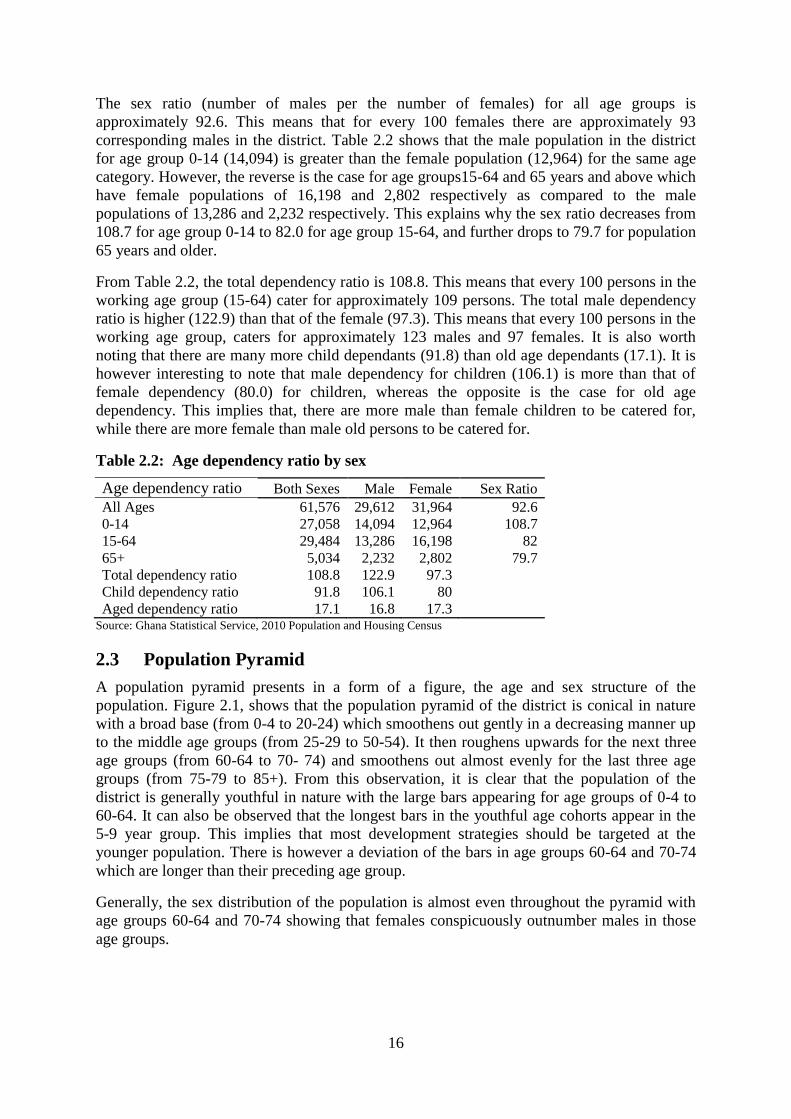
The sex ratio (number of males per the number of females) for all age groups is
approximately 92.6. This means that for every 100 females there are approximately 93
corresponding males in the district. Table 2.2 shows that the male population in the district
for age group 0-14 (14,094) is greater than the female population (12,964) for the same age
category. However, the reverse is the case for age groups15-64 and 65 years and above which
have female populations of 16,198 and 2,802 respectively as compared to the male
populations of 13,286 and 2,232 respectively. This explains why the sex ratio decreases from
108.7 for age group 0-14 to 82.0 for age group 15-64, and further drops to 79.7 for population
65 years and older.
From Table 2.2, the total dependency ratio is 108.8. This means that every 100 persons in the
working age group (15-64) cater for approximately 109 persons. The total male dependency
ratio is higher (122.9) than that of the female (97.3). This means that every 100 persons in the
working age group, caters for approximately 123 males and 97 females. It is also worth
noting that there are many more child dependants (91.8) than old age dependants (17.1). It is
however interesting to note that male dependency for children (106.1) is more than that of
female dependency (80.0) for children, whereas the opposite is the case for old age
dependency. This implies that, there are more male than female children to be catered for,
while there are more female than male old persons to be catered for.
Table 2.2: Age dependency ratio by sex
Age dependency ratio Both Sexes Male Female Sex Ratio
All Ages 61,576 29,612 31,964 92.6
0-14 27,058 14,094 12,964 108.7
15-64 29,484 13,286 16,198 82
65+ 5,034 2,232 2,802 79.7
Total dependency ratio 108.8 122.9 97.3
Child dependency ratio 91.8 106.1 80
Aged dependency ratio 17.1 16.8 17.3 Source: Ghana Statistical Service, 2010 Population and Housing Census
2.3 Population Pyramid
A population pyramid presents in a form of a figure, the age and sex structure of the
population. Figure 2.1, shows that the population pyramid of the district is conical in nature
with a broad base (from 0-4 to 20-24) which smoothens out gently in a decreasing manner up
to the middle age groups (from 25-29 to 50-54). It then roughens upwards for the next three
age groups (from 60-64 to 70- 74) and smoothens out almost evenly for the last three age
groups (from 75-79 to 85+). From this observation, it is clear that the population of the
district is generally youthful in nature with the large bars appearing for age groups of 0-4 to
60-64. It can also be observed that the longest bars in the youthful age cohorts appear in the
5-9 year group. This implies that most development strategies should be targeted at the
younger population. There is however a deviation of the bars in age groups 60-64 and 70-74
which are longer than their preceding age group.
Generally, the sex distribution of the population is almost even throughout the pyramid with
age groups 60-64 and 70-74 showing that females conspicuously outnumber males in those
age groups.

17
Figure 2.1: Population pyramid
Source: Ghana Statistical Service, 2010 Population and Housing Census
2.4 Fertility, Mortality and Migration
2.4.1 Fertility
Fertility rate measures the number of live births of women. The fertility rate of any district is
an important index for projecting the population of the district. Table 2.4 further shows that
Binduri District has 13,367 women in the reproductive age group of 15-49 years. Out of this
number, only 9.7 percent are reported to have given birth in the last twelve months. The total
fertility rate (3.6) and the general fertility rate (105.1) are higher than the regional average of
3.4 and 97.5 respectively. The district has one of the highest fertility rates in the region.
However, the crude birth rate of the district (21.2) is lower than the regional average of 22.7
indicating that there are more live births per every 1,000 women in the region than there are
in the district.
6,000 4,000 2,000 0 2,000 4,000 6,000
0-4
5-9
10-14
15-19
20-24
25-29
30-34
35-39
40-44
45-49
50-54
55-59
60-64
65-69
70-74
75-79
80-84
85+
Population
Age
Female Male

18
Table 2.4: Reported total fertility rate, general fertility rate and crude birth rate
by district
District Population
Number of
women 15-
49 years
Number of
births in last
12 months
Total
Fertility
Rate
General
Fertility
Rate
Crude
Birth
Rate
All Districts 1,046,545 243,377 23,728 3.4 97.5 22.7
Builsa North 56,477 13,133 1,344 3.6 102.3 23.8
Kasena Nankana West 70,667 16,820 1,309 2.8 77.8 18.5
Kasena Nankana East 109,944 25,941 2,539 3.4 97.9 23.1
Bolgatanga Municipal 131,550 34,909 3,089 3.0 88.5 23.5
Talensi 81,194 17,431 1,820 3.6 104.4 22.4
Bongo 84,545 19,593 1,982 3.6 101.2 23.4
Bawku West 94,034 20,951 2,226 3.7 106.2 23.7
Garu Tempane 130,003 27,784 2,951 3.9 106.2 22.7
Bawku Municipal 98,538 24,496 2,004 2.9 81.8 20.3
Builsa South 36,514 8,438 1,011 4.3 119.8 27.7
Nabdam 33,826 7,355 773 3.6 105.1 22.9
Binduri 61,576 13,367 1,303 3.6 97.5 21.2
Pusiga 57,677 13,159 1,377 3.7 104.6 23.9 Source: Ghana Statistical Service, 2010 Population and Housing Census
Table 2.5 shows the number of children ever born to females twelve years and older and the
number of them that are surviving in the Binduri District. The total number of females twelve
years and older is 21,279. The number of children ever born is 70,951. Out of the total
number of children ever born, 60,289 are surviving with the number of male children
surviving (30,395) higher than the number of female children surviving (29,894). Women 60
years and older (3,764) are more than women in each of the other age groups. This explains
perhaps why there are many more number of children ever born as well as the number of
them surviving by this age group. The age group with the least number of women (672) in the
district is 55-59 years. Generally, the number of children ever born for both sexes increases
sharply from the 12-14 year group (6) up to age group 35-39 years (8,267). Thereafter, it
decreases marginally until age group 50-54 years (7,240) and drops more sharply to 4,111 at
age group 55-59 years. It then increases sharply again to 22,447 at age group 60 years and
older. A similar trend can be observed with children surviving for all the age groups
beginning from the 12-14 year group.
Table 2.5: Female population 12 years and older by age, children ever born,
children surviving and sex of child
Age
Number of
Females
Children Ever Born
Children Surviving
Both Sexes Male Female Both Sexes Male Female
All ages 21,279 70,951 36,025 34,926
60,289 30,395 29,894
12 - 14 2,279 6 3 3
4 3 1
15 - 19 3,045 236 119 117
219 111 108
20 - 24 2,047 1,820 970 850
1,662 871 791
25 - 29 1,930 4,341 2,217 2,124
4,061 2,055 2,006
30 - 34 1,790 6,647 3,391 3,256
6,107 3,084 3,023
35 - 39 1,729 8,267 4,147 4,120
7,444 3,736 3,708
40 - 44 1,500 8,153 4,170 3,983
7,199 3,666 3,533
45 - 49 1,326 7,681 3,856 3,825
6,701 3,340 3,361
50 - 54 1,197 7,242 3,697 3,545
6,110 3,061 3,049
55 - 59 672 4,111 2,071 2,040
3,391 1,718 1,673
60 + 3,764 22,447 11,384 11,063 17,391 8,750 8,641 Source: Ghana Statistical Service, 2010 Population and Housing Census

19
2.4.2 Mortality
Mortality is the total number of deaths in a geographical area in a particular period of time.
This section looks at mortality in terms of total deaths in households and crude death rate,
causes of death and age specific death rate. Table 2.6 shows the Total population, deaths in
households and the crude death rate in the Upper East Region. Binduri District with a
population of 61, 573, recorded a total of 510 household deaths with a Crude Death Rate of
8.3. The Crude Death Rate of the district is the lowest in the Region apart from that of Bawku
Municipality (7.0) and Kasena Nankana West (8.0). The Crude Death Rate of the region is
10.8 percent.
Binduri District has one of the lowest number of household deaths (510) as well as a lower
crude death rate of 8.3. This means that the mortality situation in the district is better
considering the numbers of the other districts in the region.
Table 2.6: Total population, deaths in households and
crude death rate by districts
District
Total
Population
Deaths in
households
Crude
death rate
All Districts 1,046,545 11,339 10.8
Builsa North 56,477 478 8.5
Kasena Nankana West 70,667 566 8.0
Kasena Nankana East 109,944 1,217 11.1
Bolgatanga Municipal 131,550 2,269 17.2
Talensi 81,194 1,218 15.0
Bongo 84,545 1,093 12.9
Bawku West 94,034 838 8.9
Garu Tempane 130,003 1,287 9.9
Bawku Municipal 98,538 691 7.0
Builsa South 36,514 337 9.2
Nabdam 33,826 473 14.0
Binduri 61,576 510 8.3
Pusiga 57,677 362 6.3 Source: Ghana Statistical Service, 2010 Population and Housing Census
Causes of Death
Table 2.7 shows the number of deaths recorded in households as well as the causes of the
deaths at three levels; national, regional and district. The causes of death are categorised into
two namely: (1) deaths due to accident/violence/homicide/suicide and all other causes on one
hand and (2) pregnancy-related death of females 15-54 years and not pregnancy-related death
on the other hand. Of the total number of 510 deaths in the Binduri District, Accident/
violence/ homicide /suicide accounted for 8.4 percent compared with 15.2 percent in the
region while all other causes constitute 91.6 percent. Pregnancy related deaths in the district
stands at only 1.0 percent compared with the regional proportion of 1.7 percent.

20
Table 2.7: Death in Households
District
Death due to
Total deaths
Accident/
violence/
homicide /suicide
All other causes
Total deaths
Pregnancy related
death (female 15-
54 years)
Not pregnancy
related
Number Percent Number Percent Number Percent Number Percent Number Percent Number Percent
Ghana 163,534 100.0
18,938 11.6
144,596 88.4
163,534 100.0
3,026 1.9
160,508 98.1
All Districts 11,339 100.0
1,720 15.2
9,619 84.8
11,339 100.0
193 1.7
11,146 98.3
Builsa North 478 100.0
30 6.3
448 93.7
478 100.0
4 0.8
474 99.2
Kasena Nankana West 566 100.0
47 8.3
519 91.7
566 100.0
4 0.7
562 99.3
Kasena Nankana East 1,217 100.0
86 7.1
1,131 92.9
1,217 100.0
11 0.9
1,206 99.1
Bolgatanga Municipal 2,269 100.0
940 41.4
1,329 58.6
2,269 100.0
89 3.9
2,180 96.1
Talensi 1,218 100.0
165 13.5
1,053 86.5
1,218 100.0
6 0.5
1,212 99.5
Bongo 1,093 100.0
61 5.6
1,032 94.4
1,093 100.0
16 1.5
1,077 98.5
Bawku West 838 100.0
43 5.1
795 94.9
838 100.0
15 1.8
823 98.2
Garu Tempane 1,287 100.0
97 7.5
1,190 92.5
1,287 100.0
19 1.5
1,268 98.5
Bawku Municipal 691 100.0
65 9.4
626 90.6
691 100.0
14 2.0
677 98.0
Builsa South 337 100.0
14 4.2
323 95.8
337 100.0
4 1.2
333 98.8
Nabdam 473 100.0
79 16.7
394 83.3
473 100.0
4 0.8
469 99.2
Binduri 510 100.0
43 8.4
467 91.6
510 100.0
5 1.0
505 99.0
Pusiga 362 100.0 50 13.8 312 86.2 362 100.0 2 0.6 360 99.4 Source: Ghana Statistical Service, 2010 Population and Housing Census

21
Age specific Death Rate
The figure shows age specific death rate (ASDR) of the people in the Bunduri district. From
the figure the males’ age group (0-4) has a higher death rate than their female counterpart, for
both sexes death rate reduces up to age group (5-9). At age group (10-14) the male death rate
reduces further than their female counterpart in the same age category until age group (15-19)
where the male death rate begins to rise again. From age group (20-24), the death rate for
both sexes rises but that of the males rises faster than that of the females. At age group (40-
44) the female death rate declines and rises again from age group (45-49) till age group (50-
54) and begins to fall again till age group (55-59). From this age group the death rate of the
females’ rises again till age group (60-64) and falls at age group (65-69) after which it rises
and never falls because they have reached old age.
However, from age group (20-24), the male death rate rises till age group (50-54) and falls
slightly till age group (55-59) and rises again until age group (60-64) where it stabilizes till
age group (65-69) from which it rises and never falls due to old age. The only age group
where both sexes mortality rate reduces is (0-4) and (55-59).
Figure 2.2: Age specific death rates by sex
Source: Ghana Statistical Service, 2010 Population and Housing Census
4.2.3 Migration
Table 2.3 shows the birthplace of resident migrants as well as their duration in the district.
The total number of migrants in the district is 3,155. This represents only 5.1 percent of the
total population of the district. Out of the total number of migrants in the district, as high as
31.3 percent of them have lived in the district for between one and four years, while the least
percentage (14.1%) of migrants have lived in the district for at least twenty years.
0
0.01
0.02
0.03
0.04
0.05
0.06
De
ath
Male
Female

22
Again, the number of migrants in the district who were born elsewhere in the Upper East
Region is 467, representing 14.8 percent of the total number of migrants. Majority (2,621) of
resident migrants were born elsewhere in another region. It is worth noting that out of the
number of migrants born elsewhere in another region; most of them (1,531) were born in the
Ashanti Region. Volta Region has the least number of migrants (55) in the district.
Interestingly, the number of migrants in the district who were born in Brong Ahafo Region
(222) is the same as those born in the Northern Region (222). A relatively low number (67) of
the total number of migrants in the Binduri District were born outside Ghana. The migrants
who have stayed in the district for 20 years and over are those born elsewhere in the region
(27.0%) and those born outside Ghana constitute 25.4 percent.
Table 2.3: Birthplace by duration of residence
Birthplace Number
Duration of residence (%)
Less than 1
year
1-4
years
5-9
years
10-19
years
20+
years
Total 3,155 22.4 31.3 17.2 15.0 14.1
Born elsewhere in the region 467 19.7 16.1 19.5 17.8 27.0
Born elsewhere in another region: 2621 Western 195 32.3 39.5 17.9 4.6 5.6
Central 62 11.3 51.6 9.7 8.1 19.4
Greater Accra 64 26.6 31.3 18.8 9.4 14.1
Volta 55 32.7 18.2 7.3 16.4 25.5
Eastern 79 15.2 45.6 16.5 7.6 15.2
Ashanti 1,531 24.4 32.5 17.0 14.4 11.7
Brong Ahafo 222 18.9 37.4 17.6 16.7 9.5
Northern 222 20.3 40.5 7.2 18.5 13.5
Upper East - - - - - -
Upper west 191 16.2 22.0 28.8 26.2 6.8
Outside Ghana 67 11.9 35.8 16.4 10.4 25.4 Source: Ghana Statistical Service, 2010 Population and Housing Census
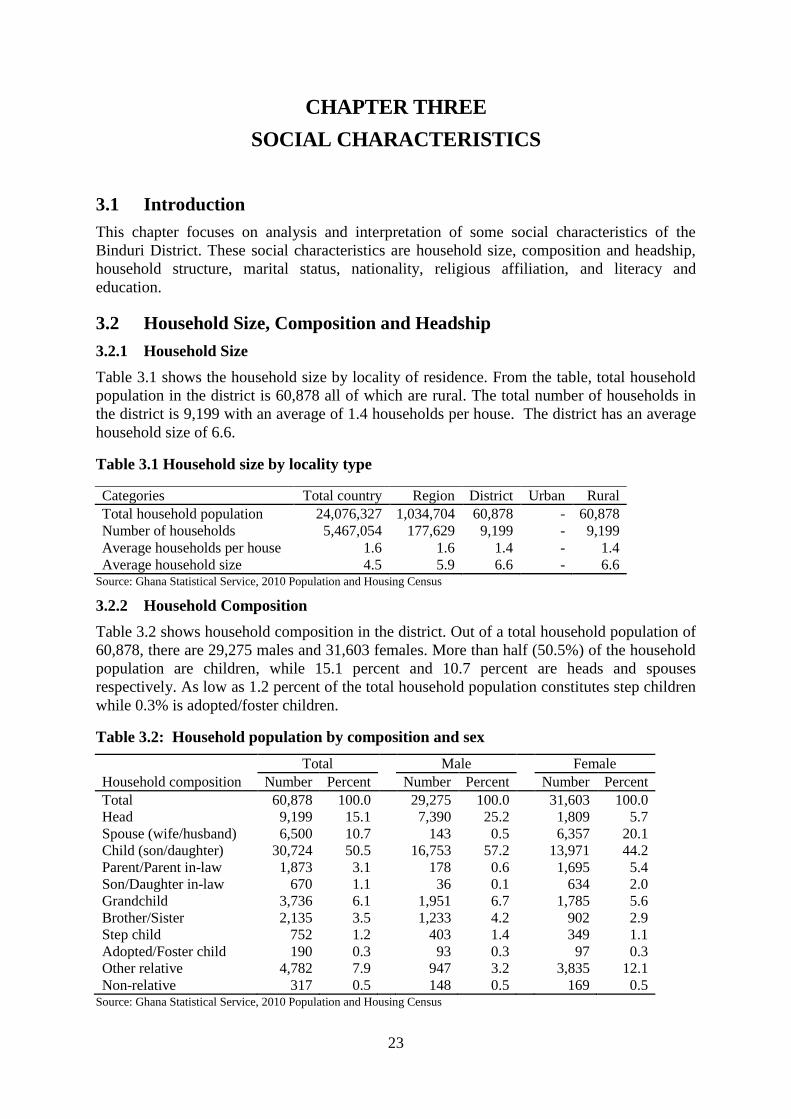
23
CHAPTER THREE
SOCIAL CHARACTERISTICS
3.1 Introduction
This chapter focuses on analysis and interpretation of some social characteristics of the
Binduri District. These social characteristics are household size, composition and headship,
household structure, marital status, nationality, religious affiliation, and literacy and
education.
3.2 Household Size, Composition and Headship
3.2.1 Household Size
Table 3.1 shows the household size by locality of residence. From the table, total household
population in the district is 60,878 all of which are rural. The total number of households in
the district is 9,199 with an average of 1.4 households per house. The district has an average
household size of 6.6.
Table 3.1 Household size by locality type
Categories Total country Region District Urban Rural
Total household population 24,076,327 1,034,704 60,878 - 60,878
Number of households 5,467,054 177,629 9,199 - 9,199
Average households per house 1.6 1.6 1.4 - 1.4
Average household size 4.5 5.9 6.6 - 6.6 Source: Ghana Statistical Service, 2010 Population and Housing Census
3.2.2 Household Composition
Table 3.2 shows household composition in the district. Out of a total household population of
60,878, there are 29,275 males and 31,603 females. More than half (50.5%) of the household
population are children, while 15.1 percent and 10.7 percent are heads and spouses
respectively. As low as 1.2 percent of the total household population constitutes step children
while 0.3% is adopted/foster children.
Table 3.2: Household population by composition and sex
Household composition
Total
Male
Female
Number Percent Number Percent Number Percent
Total 60,878 100.0
29,275 100.0
31,603 100.0
Head 9,199 15.1
7,390 25.2
1,809 5.7
Spouse (wife/husband) 6,500 10.7
143 0.5
6,357 20.1
Child (son/daughter) 30,724 50.5
16,753 57.2
13,971 44.2
Parent/Parent in-law 1,873 3.1
178 0.6
1,695 5.4
Son/Daughter in-law 670 1.1
36 0.1
634 2.0
Grandchild 3,736 6.1
1,951 6.7
1,785 5.6
Brother/Sister 2,135 3.5
1,233 4.2
902 2.9
Step child 752 1.2
403 1.4
349 1.1
Adopted/Foster child 190 0.3
93 0.3
97 0.3
Other relative 4,782 7.9
947 3.2
3,835 12.1
Non-relative 317 0.5 148 0.5 169 0.5 Source: Ghana Statistical Service, 2010 Population and Housing Census

24
Of the 29,275 males that constitute a part of the total household population, 25.2 percent are
household heads, 57.2 percent are children, 1.4 percent is step-children while 0.3 percent are
adopted/foster children. Again, out of the 31,603 females that are a part of the household
population, 5.7 percent are household heads, 44.2 percent are children while 1.1 percent and
0.3 percent are step-children and adopted/foster children.
There is more than double the percentage of female spouses as male spouses (20.1% and 0.5
%). respectively. This is probably the case because polygamy is practised in the district like
many other districts in northern Ghana. The least populated category of household members
in the district is non-relatives (0.5%).
The extended family system is practised in all Ghanaian communities and Binduri is not an
exception. This is evident from Table 3.3 where 54.4 percent of the total household
population constitutes extended families. This is above the percentage (21.9%) of household
population that make up nuclear families in the district. The household structures with the
least proportions (0.5) of persons are head and spouse only and single parent extended and
non-relative families. The family structure with the highest proportions of males (53.9%) and
females (54.8%) is the extended family system.
Table 3.3: Household population by structure and sex
Household structure
Total Male Female
Number Percent Number Percent Number Percent
Total 60,878 100
29,275 100
31,603 100
Head only 351 0.6
231 0.8
120 0.4
Head and a spouse only 304 0.5
153 0.5
151 0.5
Nuclear (Head spouse(s) children) 13,361 21.9
6,951 23.7
6,410 20.3
Extended (Head spouse(s) children
Head's relatives) 33,099 54.4
15,789 53.9
17,310 54.8
Extended + non relatives 885 1.5
447 1.5
438 1.4
Head spouse(s) and other composition 1,281 2.1
598 2
683 2.2
Single parent Nuclear 3,677 6
1,591 5.4
2,086 6.6
Single parent Extended 5,260 8.6
2,307 7.9
2,953 9.3
Single parent Extended + non relative 318 0.5
157 0.5
161 0.5
Head and other composition but no
spouse 2,342 3.8 1,051 3.6 1,291 4.1
Source: Ghana Statistical Service, 2010 Population and Housing Census
3.3 Marital Status
Figure 3.1 shows that out of the population aged 12 years and older in the district, 51.0
percent are married, 38.1 percent have never married, while the remaining 13.5 percent of the
population is made up of those who are separated, divorced, widowed or are in
informal/consensual union/living together.

25
Figure 3.1: Persons 12 years and older by marital status
Source: Ghana Statistical Service, 2010 Population and Housing Census
From Table 3.4, persons in the age groups 40-44 years have the highest percentage of married
persons (87.1%) while age groups 35-39 and 45-49 have the majority of those who are
divorced (2.2%). It is however interesting to note that there are more (2.7%) of persons 65
years and older who have never married compared to persons within the age groups 45-49
(2.2%) and for age group 60-64, it is 2.6%.
It is also clear from Table 3.4 that for persons 12 years and older, there are fewer males
(47.0%) than females (55.0 %) who are married. There are also many more females who are
widowed (12.9%) than males (1.3%). This can be explained partly due to the high practice of
polygamy as a result of which many married women become widows with the death of just
one husband. There is however an insignificant difference in the rates of divorce for both
males (1.1%) and females (1.0%).
The age group for males with the highest proportion of those married is 55-59 (92.3%) while
that of females is 35-39 (89.4%). Also, the age groups with the highest proportion of those
divorced are 35-39 (3.4%) for males and 45-49 (2.2%) for females. It is also evident from
table 3.3.1 that females 65 years and older constitute the highest proportion of the widowed
(54.5%) than the other age groups for males the proportion is significantly lower (6.5
percent).
Never married 38%
Informal/ Consensual union/Living
together 1%
Married 51%
Separated 1%
Divorced 1%
Widowed 8%

26
Table 3.4: Persons 12 years and older by age-group, sex, and marital status
Sex/Age-
group Number Total
Never
married
Informal/
Consensual
union/Living
together Married Separated Divorced Widowed
Both Sexes Total 39,352 100.0 38.1 1.1 51.4 0.7 1.1 7.6
12 – 14 4,834 100.0 95.6 0.1 4.2 0.0 0.0 0.0
15 - 19 6,653 100.0 91.3 1.0 7.3 0.2 0.1 0.2
20 - 24 4,061 100.0 60.8 2.7 34.8 0.7 0.6 0.4
25 - 29 3,360 100.0 28.5 2.0 66.4 1.3 1.1 0.7
30 - 34 2,991 100.0 10.9 2.2 82.4 1.2 1.5 1.8
35 - 39 2,832 100.0 5.5 1.4 86.9 1.4 2.2 2.6
40 - 44 2,487 100.0 3.5 1.0 87.1 1.4 1.6 5.3
45 - 49 2,184 100.0 2.2 0.9 85.4 1.2 2.2 8.1
50 - 54 2,090 100.0 1.7 0.5 81.9 1.3 1.9 12.7
55 - 59 1,219 100.0 1.8 0.2 79.4 0.9 1.7 16.0
60 - 64 1,607 100.0 2.6 0.4 71.6 0.7 2.0 22.7
65+ 5,034 100.0 2.7 0.3 61.9 0.4 1.4 33.2
Male
Total 18,073 100.0 48.6 1.0 47.3 0.6 1.1 1.3
12 – 14 2,555 100.0 96.4 0.1 3.5 0.0 0.0 0.0
15 - 19 3,608 100.0 94.9 0.5 4.5 0.0 0.1 0.0
20 - 24 2,014 100.0 81.1 2.4 16.0 0.1 0.2 0.1
25 - 29 1,430 100.0 47.2 1.6 48.7 1.2 0.8 0.5
30 - 34 1,201 100.0 20.2 2.8 73.6 0.8 2.2 0.3
35 - 39 1,103 100.0 10.5 1.6 83.1 1.1 3.4 0.3
40 - 44 987 100.0 6.3 1.9 88.0 1.2 1.5 1.0
45 - 49 858 100.0 3.6 0.8 91.1 1.2 2.1 1.2
50 - 54 893 100.0 2.6 0.6 90.4 1.8 1.8 2.9
55 - 59 547 100.0 2.2 0.2 92.3 1.3 2.0 2.0
60 - 64 645 100.0 3.9 0.2 88.4 1.2 2.9 3.4
65+ 2,232 100.0 3.6 0.4 87.1 0.5 2.0 6.5
Female Total 21,279 100.0 29.1 1.2 55.0 0.9 1.0 12.9
12 – 14 2,279 100.0 94.8 0.1 5.0 0.0 0.0 0.0
15 - 19 3,045 100.0 87.0 1.6 10.6 0.3 0.2 0.3
20 - 24 2,047 100.0 40.8 2.9 53.3 1.3 0.9 0.7
25 - 29 1,930 100.0 14.6 2.3 79.5 1.5 1.2 0.9
30 - 34 1,790 100.0 4.6 1.8 88.3 1.4 1.1 2.7
35 - 39 1,729 100.0 2.3 1.2 89.4 1.6 1.4 4.0
40 - 44 1,500 100.0 1.6 0.5 86.5 1.5 1.7 8.2
45 - 49 1,326 100.0 1.2 1.0 81.7 1.3 2.2 12.6
50 - 54 1,197 100.0 1.1 0.5 75.5 1.0 1.9 20.0
55 - 59 672 100.0 1.5 0.1 68.9 0.6 1.5 27.4
60 - 64 962 100.0 1.8 0.5 60.3 0.4 1.4 35.7
65+ 2,802 100.0 2.1 0.3 41.9 0.2 1.0 54.5 Source: Ghana Statistical Service, 2010 Population and Housing Census
Table 3.5 shows that 59.3 percent of persons 12 years and older in the district have never had
formal education; while 33.2 percent have attained basic education. Furthermore, 5.3 percent
have attained secondary education and only 0.3 percent tertiary education. Widows have the
highest population (93.8%) with no education, while those who have never married have the

27
least proportion (22.8%) of persons with no education. On the other hand, the divorced
population has the highest proportion (0.5%) of those who have attained tertiary education.
Close to half (48.9%) of males have no formal education as compared to 68.1 percent of
females. On the contrary, males have higher percentages (7.5%) than females (3.5%) in terms
of attaining secondary education. This means that a lot of female students either do not
qualify to enter the Senior High School or drop out in the Senior High School level. Table 3.5
also shows that males that are separated have the highest percentage (0.9%) of those who
have attained tertiary education. In the case of females, the proportion of those who have
never married and those who are married and have attained tertiary level of education add up
to 0.2 percent.
Table 3.5: Persons 12 years and older by marital status, sex and level of education
Sex/Marital status Number
All
levels
No
Education Basic
Secon-
dary
Voc/
Tech/
Comm
Post
middle/
secondary
certificate/
diploma Tertiary
Both Sexes
Total 39,352
100.0 59.3 33.2 5.3 0.5 1.4 0.3
Never married 14,974
100.0 22.8 64.7 10.1 0.6 1.5 0.3
Informal/Consensual
union/Living together 434
100.0 34.8 53.2 9.0 0.5 2.3 0.2
Married 20,243
100.0 81.3 13.9 2.5 0.5 1.5 0.3
Separated 290
100.0 67.9 25.9 3.4 0.7 1.7 0.3
Divorced 426
100.0 67.1 23.5 4.7 1.6 2.6 0.5
Widowed 2,985
100.0 93.8 5.7 0.3 0.0 0.2 0.0
Male
Total 18,073
100.0 48.9 40.2 7.5 0.7 2.2 0.5
Never married 8,786
100.0 22.5 63.7 10.9 0.6 1.8 0.4
Informal/Consensual
union/Living together 185
100.0 29.7 56.8 10.8 0.0 2.2 0.5
Married 8,549
100.0 74.6 17.2 4.2 0.7 2.7 0.6
Separated 107
100.0 72.0 22.4 2.8 0.0 1.9 0.9
Divorced 205
100.0 68.8 21.0 4.9 0.5 3.9 1.0
Widowed 241
100.0 86.7 11.6 1.2 0.0 0.4 0.0
Female
Total 21,279
100.0 68.1 27.3 3.5 0.4 0.7 0.1
Never married 6,188
100.0 23.3 66.1 8.9 0.6 1.1 0.1
Informal/Consensual
union/Living together 249
100.0 38.6 50.6 7.6 0.8 2.4 0.0
Married 11,694
100.0 86.3 11.5 1.3 0.2 0.6 0.1
Separated 183
100.0 65.6 27.9 3.8 1.1 1.6 0.0
Divorced 221
100.0 65.6 25.8 4.5 2.7 1.4 0.0
Widowed 2,744 100.0 94.4 5.1 0.2 0.0 0.2 0.0
Source: Ghana Statistical Service, 2010 Population and Housing Census
Table 3.6 displays the information on persons 12 years and older by sex, marital status and
economic activity status in the district. In all, 76.2 percent of persons 12 years and older are
employed, 0.7 percent is unemployed, and 23.2 percent are economically not active. The
percentage of married persons who are economically not active is 7.4 percent. The proportion
of the never married who is economically not active is 42.8 percent while that of the divorced
and widowed is 17.6 percent and 34.8 percent respectively.

28
Table 3.6: Persons 12 years and older by Marital status, Sex and economic activity
status
Sex/Marital status
Total Employed Unemployed
Economically
not active
Number Percent Number Percent Number Percent Number Percent
Both Sexes
Total 39,352 100.0
29,980 76.2
256 0.7
9,116 23.2
Never married 14,974 100.0
8,451 56.4
109 0.7
6,414 42.8
Informal/Consensual
union/Living together 434 100.0
373 85.9
4 0.9
57 13.1
Married 20,243 100.0
18,622 92.0
124 0.6
1,497 7.4
Separated 290 100.0
253 87.2
2 0.7
35 12.1
Divorced 426 100.0
348 81.7
3 0.7
75 17.6
Widowed 2,985 100.0
1,933 64.8
14 0.5
1,038 34.8
Male
Total 18,073 100.0
13,609 75.3
118 0.7
4,346 24.0
Never married 8,786 100.0
5,148 58.6
62 0.7
3,576 40.7
Informal/Consensual
union/Living together 185 100.0
170 91.9
0 0.0
15 8.1
Married 8,549 100.0
7,876 92.1
53 0.6
620 7.3
Separated 107 100.0
92 86.0
1 0.9
14 13.1
Divorced 205 100.0
172 83.9
2 1
31 15.1
Widowed 241 100.0
151 62.7
0 0
90 37.3
Female
Total 21,279 100.0
16,371 76.9
138 0.6
4,770 22.4
Never married 6,188 100.0
3,303 53.4
47 0.8
2,838 45.9
Informal/Consensual
union/Living together 249 100.0
203 81.5
4 1.6
42 16.9
Married 11,694 100.0
10,746 91.9
71 0.6
877 7.5
Separated 183 100.0
161 88.0
1 0.5
21 11.5
Divorced 221 100.0
176 79.6
1 0.5
44 19.9
Widowed 2,744 100.0 1,782 64.9 14 0.5 948 34.5
Source: Ghana Statistical Service, 2010 Population and Housing Census
3.4 Nationality
Table 3.7 presents population by nationality and sex. The results show that 93.6 percent are
Ghanaians by birth, 2.5 percent, Ghanaians by dual nationality and 1.9 percent of the
Economic Community of West African States (ECOWAS) nationals.
Of the male population 93.7 percent are Ghanaians by birth, 2.4 percent are of dual
nationality and 2.0 percent of ECOWAS nationals. Africans other than ECOWAS and other
nationals constituted less than one percent for the male population
Again, of the female population of 31,964, Ghanaians by birth constituted 93.5 percent while
population with dual nationality constituted 2.6 percent. Only 1.8 percent of the female
population are ECOWAS nationals and less than one percent of Africans other than
ECOWAS and other nationals.

29
Table 3.7: Population by nationality and sex
Nationality
Both sexes Male Female
Number Percent Number Percent Number Percent
Total 61,576 100.0
29,612 100.0
31,964 100.0
Ghanaian by birth 57,634 93.6
27,751 93.7
29,883 93.5
Dual nationality (Ghanaian
& Other) 1,560 2.5
722 2.4
838 2.6
Ghanaian by naturalization 655 1.1
295 1.0
360 1.1
ECOWAS 1,182 1.9
594 2.0
588 1.8
African other than
ECOWAS 326 0.5
152 0.5
174 0.5
Other 219 0.4 98 0.3 121 0.4 Source: Ghana Statistical Service, 2010 Population and Housing Census
3.5 Religious Affiliation
Table 3.8 shows that Christianity (Catholic, Protestants, Pentecostal/Charismatic, and Other
Christian) is the dominant religion in the district with a total of 41.7 percent followers. Out of
this, Catholics constitute 51.2 percent. Islam is the second dominant religion with a following
of 35 percent. Traditional African religions have a following of 20.0 percent of the
population. The number of those without religious affiliation is 2.1 percent, while the
undefined (other) constitutes 0.2 percent.
It is also clear from Table 3.8 that 45.7 percent of Christians are males while 54.3 percent are
females. Almost 50.0 percent (49.1%) of practitioners of Islam are males with 50.9 percent
being females. The percentage of traditionalist who are males is 50.7 percent with 49.3
percent being females. Of those with no religion, 53.2 percent are males while 46.8 percent
females.
Table 3.8: Population by religion and sex
Religion
Both sexes
Male
Female
Number Percent Number Percent Number Percent
Total 61,576 100.0
29,612 48.1
31,964 51.9
No religion 1,299 100.0
691 53.2
608 46.8
Catholic 13,149 100.0
6,199 47.1
6,950 52.9
Protestants (Anglican
Lutheran etc.) 5,311 100.0
2,437 45.9
2,874 54.1
Pentecostal/Charismatic 4,658 100.0
1,998 42.9
2,660 57.1
Other Christian 2,579 100.0
1,118 43.4
1,461 56.6
Islam 22,092 100.0
10,841 49.1
11,251 50.9
Traditionalist 12,335 100.0
6,258 50.7
6,077 49.3
Other 153 100.0 70 45.8 83 54.2 Source: Ghana Statistical Service, 2010 Population and Housing Census
3.6 Literacy and Education
Figure 3.2 shows that the majority of the people in the district are not able to read and write
in any language. Of a literate population of 17,228 persons who are 11 years and older, 65.8
percent can read and write English language only, 31.1 percent are literate in English and
Ghanaian language, while 2.9 percent are literate in Ghanaian language only. It is however
clear from Figure 3.6 that only 0.2 percent of persons 11 years and older in the district can
read and write in any other languages apart from English and Ghanaian language.

30
Figure 3.2: Literacy by language of persons 11 years and older
Source: Ghana Statistical Service, 2010 Population and Housing Census
From Table 3.9, the percentage of persons who can read and write only English is 74.9 for
persons in the 11-14 age groups. Persons in the 40-44 age group have the less than 1 percent
(0.7%) of those who can read and write both English and French. Again it is clear that out of
the number of non-literate males, the percentage that can read and write English only is 65.6
while the percentage of those who can read and write English and French is 0.1. Similarly, as
high as 66.1 percent of females read and write only English while only 0.6 percent read and
write both English and French.
3.6.1 School Attendance
Information on school attendance provides an indication of formal schooling in society. In a
society where few people have had formal education, there will be few people with requisite
knowledge and skills needed for social and economic development.
Table 3.9: Population 11 years and older by sex, age and literacy status
Literacy
status
None
(not
literate) Literate Total
English
only
Ghanaian
language
only
English and
Ghanaian
language
English
and
French
English,
French and
Ghanaian
language
Both sexes -
Total 23,591 17,228 100.0 65.8 2.9 31.1 0.1 0.1
11-14 1,049 5,252 100.0 74.9 1.9 23.1 0.0 0.0
15-19 1,436 5,217 100.0 72.0 1.8 26.1 0.0 0.0
20-24 1,718 2,343 100.0 62.3 2.5 35.0 0.0 0.1
25-29 2,137 1,223 100.0 54.6 3.9 41.2 0.2 0.1
30-34 2,188 803 100.0 51.7 3.9 44.1 0.1 0.2
35-39 2,274 558 100.0 47.0 6.3 46.1 0.4 0.4
40-44 2,051 436 100.0 47.7 9.9 41.3 0.7 0.5
45-49 1,828 356 100.0 45.5 7.9 46.6 0.0 0.0
50-54 1,767 323 100.0 41.5 7.4 50.5 0.3 0.3
55-59 1,007 212 100.0 35.4 6.1 58.5 0.0 0.0
60-64 1,428 179 100.0 45.3 5.6 49.2 0.0 0.0
65+ 4,708 326 100.0 56.4 4.3 39.0 0.0 0.3
65.8
2.9
31.1
0.2
English only
Ghanaian language only
English and Ghanaianlanguage
Others (English, French,Ghanaian Language etc)

31
Table 3.9: Population 11 years and older by sex, age and literacy status (cont’d)
Literacy
status
None
(not
literate) Literate Total
English
only
Ghanaian
language
only
English and
Ghanaian
language
English
and
French
English,
French and
Ghanaian
language
Male
-
Total 8,982 9,855 100.0 65.6 2.4 31.9 0.1 0.1
11-14 543 2,776 100.0 75.3 1.4 23.3 0.0 0.0
15-19 643 2,965 100.0 72.0 2.0 26.0 0.1 0.0
20-24 584 1,430 100.0 63.1 2.1 34.6 0.1 0.1
25-29 731 699 100.0 55.8 2.7 41.2 0.3 0.0
30-34 707 494 100.0 50.2 2.4 47.0 0.2 0.2
35-39 763 340 100.0 50.3 3.5 45.3 0.6 0.3
40-44 711 276 100.0 51.4 6.2 42.0 0.0 0.4
45-49 661 197 100.0 43.7 6.6 49.7 0.0 0.0
50-54 681 212 100.0 44.3 6.1 48.6 0.5 0.5
55-59 407 140 100.0 35.7 2.1 62.1 0.0 0.0
60-64 523 122 100.0 42.6 6.6 50.8 0.0 0.0
65+ 2,028 204 100.0 50.0 3.9 45.6 0.0 0.5
Female
-
Total 14,609 7,373 100.0 66.1 3.7 30.1 0.0 0.1
11-14 506 2,476 100.0 74.6 2.5 22.9 0.0 0.0
15-19 793 2,252 100.0 71.9 1.7 26.4 0.0 0.0
20-24 1,134 913 100.0 60.9 3.2 35.7 0.0 0.2
25-29 1,406 524 100.0 53.1 5.5 41.2 0.0 0.2
30-34 1,481 309 100.0 54.0 6.1 39.5 0.0 0.3
35-39 1,511 218 100.0 41.7 10.6 47.2 0.0 0.5
40-44 1,340 160 100.0 41.3 16.3 40.0 1.9 0.6
45-49 1,167 159 100.0 47.8 9.4 42.8 0.0 0.0
50-54 1,086 111 100.0 36.0 9.9 54.1 0.0 0.0
55-59 600 72 100.0 34.7 13.9 51.4 0.0 0.0
60-64 905 57 100.0 50.9 3.5 45.6 0.0 0.0
65+ 2,680 122 100.0 67.2 4.9 27.9 0.0 0.0 Source: Ghana Statistical Service, 2010 Population and Housing Census
Figure 3.3 presents information on school attendance in the Binduri District. From the figure
50.1 percent of the population has never attended school. 39.8 percent are currently
attending school while 10.1 percent have attended school in the past. There are more males
currently in school, (45.4%) than (females 34.6%).

32
Figure 3.3: School attendance
Source: Ghana Statistical Service, 2010 Population and Housing Census
Table 3.10 shows that 58.8 percent of persons 3 years and older in the district are currently
attending primary school, 16.7 percent are in JSS/JHS, 5.6 percent are in SSS/SHS, while 0.5
percent are in tertiary institutions. This table also shows that there are 12,417 males and
10,313 females who are currently attending school. There are a relatively higher proportion
of females (59.6%) in primary school compared to their male counterparts (58.1%). Almost
the same proportion of males (16.9) and females (16.5) are in JSS/JHS while more males
(6.4%) than females (4.7%) are in SSS/SHS. The proportion that is in the tertiary institutions
is low for both males (0.6%) and females (0.3%).
There are 5,770 persons 3 years and older in the district who have attended school in the past.
Out of this number, 38.6 percent have attended Primary School while 21.9 percent have
attended JSS/JHS in the past. It is also clear that 15.4 percent have attended Middle School,
and 2.1 percent have attended Vocational/Technical/Commercial School in the past. As high
as 4.4 percent have attended tertiary institutions in the past compared to 0.5 percent of those
who are currently attending tertiary institutions.
50.1
42.5
57.2
39.8
45.4
34.6
10.1 12.2 8.2
0.0
10.0
20.0
30.0
40.0
50.0
60.0
70.0
Total Male Female
Pe
rce
nt
Never attended Now attending Attended in the past

33
Table 3.10: Population 3 years and older by level of education, school attendance and sex
Level of education
Currently attending
Attended in the past
Both sexes
Male
Female
Both sexes
Male
Female
Number Percent Number Percent Number Percent Number Percent Number Percent Number Percent
Total 22,730 100.0
12,417 100.0
10,313 100.0
5,770 100.0
3,323 100.0
2,447 100.0
Nursery 1,944 8.6
1,034 8.3
910 8.8
- 0.0
- 0.0
- 0.0
Kindergarten 2,059 9.1
1,076 8.7
983 9.5
- 0.0
- 0.0
- 0.0
Primary 13,354 58.8
7,209 58.1
6,145 59.6
2,228 38.6
1,181 35.5
1,047 42.8
JSS/JHS 3,800 16.7
2,098 16.9
1,702 16.5
1,266 21.9
612 18.4
654 26.7
Middle - 0.00
- 0.0
- 0.0
886 15.4
560 16.9
326 13.3
SSS/SHS 1,279 5.6
795 6.4
484 4.7
650 11.3
437 13.2
213 8.7
Secondary - 0
- 0.0
- 0.0
173 3.0
125 3.8
48 2.0
Vocational/Technical/
Commercial 74 0.30
49 0.4
25 0.2
120 2.1
70 2.1
50 2.0
Post middle/
secondary certificate 112 0.5
76 0.6
36 0.3
196 3.4
150 4.5
46 1.9
Tertiary 108 0.5 80 0.6 28 0.3 251 4.4 188 5.7 63 2.6
Source: Ghana Statistical Service, 2010 Population and Housing Census

34
CHAPTER FOUR
ECONOMIC CHARACTERISTICS
4.1 Introduction
This chapter deals with the characteristics of the economy of the Binduri District. The
analysis and interpretations thereof focus on the following areas: type of activity, occupation,
industry, employment status, and employment sector. The analysis and interpretation
contained in this chapter relate to data on the population 15 years and older in the district.
4.2 Economic Activity Status
Table 4.1 shows that there are 34,518 persons who are 15 years and older in the district. Out
of the employed population, 98.5 percent worked during the reference period (the 7 days
preceding the census night), 1.1 percent do not work but have a job to go back to while 0.4
percent do voluntary work without pay. The table further shows that 41.5 percent of the
unemployed are seeking work for the first time. This could be attributed to the high number
of graduates who have just completed school. This means that job creation and/or creating the
environment for self- employment should be a priority for the district assembly. This is more
so because with 51.6 percent of the economically not active currently in full time education,
they would in the near future add up to the unemployed population upon completing school.
The high percentage (58.5%) of the unemployed who have worked before, seeking work and
available, is due to the seasonality of most economic activities especially farming.
Table 4.1: Population 15 years and older by activity status and sex
Activity status
Total
Male
Female
Number Percent Number Percent Number Percent
Total 34,518 100.0
15,518 100.0
19,000 100.0
Economically active 27,936 80.9
12,463 80.3
15,473 81.4
Employed 27,683 99.1
12,347 99.1
15,336 99.1
Worked 27,279 98.5
12,163 98.5
15,116 98.6
Did not work but had job to go back to 294 1.1
141 1.1
153 1.0
Did voluntary work without pay 110 0.4
43 0.3
67 0.4
Unemployed 253 0.9
116 0.9
137 0.9
Worked before, seeking work and
available 148 58.5
60 51.7
88 64.2
Seeking work for the first time and
available 105 41.5
56 48.3
49 35.8
Economically not active 6,582 19.1
3,055 19.7
3,527 18.6
Did home duties (household chore) 973 14.8
342 11.2
631 17.9
Full time education 3,394 51.6
1,985 65.0
1,409 39.9
Pensioner/Retired 72 1.1
51 1.7
21 0.6
Disabled/Sick 338 5.1
144 4.7
194 5.5
Too old/young 1,567 23.8
435 14.2
1,132 32.1
Other 238 3.6 98 3.2 140 4.0
Source: Ghana Statistical Service, 2010 Population and Housing Census

35
There is no much difference in economic activity status based on sex except that, among the
economically not active population, the proportion of males who do home duties (household
chores) is 11.2 percent, while that of females is 17.9 percent. This indicates that in the district
females are still seen as housekeepers.
The age structure of a population is relevant to the development of every economy because
differences in the age structure have varied implications for the employment situation in the
economy. Table 4.2 indicates that 80.2 percent of the population 15 years and older are
employed, 0.7 percent are unemployed, while 19.1 percent are economically not active. The
age group 40-44 has the majority (96.4%) of its population employed, and at the same time
has the least percent (3.2%) of its population being economically not active. Interestingly,
Over two-thirds of the population (68.4%) 65 years and older are employed with less than
one percent of them (0.1%) being unemployed. This is possibly because the main source of
employment in the district is agriculture which doubles as the traditional source of lively of
the people in the district. The 31.4 percent of persons 65 years and older who are
economically not active are probably too old and physically incapacitated to continue with
this traditional economic activity. There is thus the need for social intervention programmes
to cater for these people.
Table 4.2 also shows that the female population (19,000) 15 years and older is greater than
the male population (15,518). The female population that is employed is 80.7 percent
compared to that of their male counterparts (79.6%). There is however no difference between
males and females who are unemployed (0.7%). Even though there are more females than
males, only 18.6 percent of them are economically not active as compared to 19.7 percent of
males who are economically not active. This means that women are contributing more to the
local economy than men in terms of numbers.
Table 4.2: Economic activity status of population 15 years and older by age and sex
Age group
All Status
Employed
Unemployed
Economically not
active
Number Percent
Number Percent
Number Percent
Number Percent
Both sexes
Total 34,518 100.0
27,683 80.2
253 0.7
6,582 19.1
15-19 6,653 100.0
3,795 57.0
31 0.5
2,827 42.5
20-24 4,061 100.0
2,934 72.2
66 1.6
1,061 26.1
25-29 3,360 100.0
2,999 89.3
48 1.4
313 9.3
30-34 2,991 100.0
2,816 94.1
23 0.8
152 5.1
35-39 2,832 100.0
2,693 95.1
17 0.6
122 4.3
40-44 2,487 100.0
2,397 96.4
10 0.4
80 3.2
45-49 2,184 100.0
2,098 96.1
12 0.5
74 3.4
50-54 2,090 100.0
1,982 94.8
5 0.2
103 4.9
55-59 1,219 100.0
1,136 93.2
4 0.3
79 6.5
60-64 1,607 100.0
1,391 86.6
24 1.5
192 11.9
65+ 5,034 100.0
3,442 68.4
13 0.3
1,579 31.4

36
Table 4.2: Economic activity status of population 15 years and older by age and sex
(cont’d)
Age group
All Status
Employed
Unemployed
Economically not
active
Number Percent
Number Percent
Number Percent
Number Percent
Male
Total 15,518 100.0
12,347 79.6
116 0.7
3,055 19.7
15-19 3,608 100.0
2,046 56.7
13 0.4
1,549 42.9
20-24 2,014 100.0
1,369 68.0
30 1.5
615 30.5
25-29 1,430 100.0
1,243 86.9
23 1.6
164 11.5
30-34 1,201 100.0
1,122 93.4
16 1.3
63 5.2
35-39 1,103 100.0
1,057 95.8
7 0.6
39 3.5
40-44 987 100.0
958 97.1
4 0.4
25 2.5
45-49 858 100.0
832 97.0
7 0.8
19 2.2
50-54 893 100.0
857 96.0
1 0.1
35 3.9
55-59 547 100.0
529 96.7
1 0.2
17 3.1
60-64 645 100.0
588 91.2
11 1.7
46 7.1
65+ 2,232 100.0
1,746 78.2
3 0.1
483 21.6
Female
Total 19,000 100.0
15,336 80.7
137 0.7
3,527 18.6
15-19 3,045 100.0
1,749 57.4
18 0.6
1,278 42
20-24 2,047 100.0
1,565 76.5
36 1.8
446 21.8
25-29 1,930 100.0
1,756 91.0
25 1.3
149 7.7
30-34 1,790 100.0
1,694 94.6
7 0.4
89 5
35-39 1,729 100.0
1,636 94.6
10 0.6
83 4.8
40-44 1,500 100.0
1,439 95.9
6 0.4
55 3.7
45-49 1,326 100.0
1,266 95.5
5 0.4
55 4.1
50-54 1,197 100.0
1,125 94.0
4 0.3
68 5.7
55-59 672 100.0
607 90.3
3 0.4
62 9.2
60-64 962 100.0
803 83.5
13 1.4
146 15.2
65+ 2,802 100.0 1,696 60.5 10 0.4 1,096 39.1 Source: Ghana Statistical Service, 2010 Population and Housing Census
This means that economic programmes and interventions must take into consideration the
fact that more women than men would need more resources in terms of financial assistance as
well as subsidies and inputs in the local economy.
4.3 Occupation
In the Binduri District, 84.3 percent of the employed are skilled agricultural, forestry and
fishery workers while 5.9 percent are service and sales workers. Another 5.2 percent are craft
and related trade workers while only 1.5 percent are professionals. This means that much
attention must be given to the agricultural sector in the short to medium term while long term
strategies should be proffered for the other promising occupations.
Gender analysis of occupational distribution in the district have a higher proportion of
females (8.6%) as service and sales workers as compared to the proportion of males (2.5%) in
that occupation.

37
Table 4.3: Employed population 15 years and older by occupation and sex
Occupation
Both sexes Male Female
Number Percent Number Percent Number Percent
Total 27,683 100.0
12,347 100.0
15,336 100.0
Managers 206 0.7
87 0.7
119 0.8
Professionals 414 1.5
273 2.2
141 0.9
Technicians and associate
professionals 73 0.3
58 0.5
15 0.1
Clerical support workers 61 0.2
40 0.3
21 0.1
Service and sales workers 1,631 5.9
313 2.5
1,318 8.6
Skilled agricultural forestry and
fishery workers 23,323 84.3
10,735 86.9
12,588 82.1
Craft and related trades workers 1,450 5.2
517 4.2
933 6.1
Plant and machine operators and
assemblers 202 0.7
154 1.2
48 0.3
Elementary occupations 308 1.1
156 1.3
152 1.0
Other occupations 15 0.1 14 0.1 1 0.0 Source: Ghana Statistical Service, 2010 Population and Housing Census
The percentage of males who are skilled agricultural, forestry and fishery workers is 86.9
percent, while the proportion of female agricultural workers is 82.1 percent. However, there
is greater female proportion (6.1%) in the craft and related trades workers as compared to the
percentage of males (4.2%).
4.4 Industry
Eighty four (83.9%) percent are in the Agriculture, forestry and fishing industry serves as the
industry for most of the employed, 3.9 percent are into manufacturing, 0.1 percent are into
financial and insurance activities industry with information and communication industry
employing virtually none of the employed population. This shows the extent to which the
economy is rural. Agriculture forestry and fishing industry employs the majority of both male
and female populations (86.9% and 81.5% respectively). However, more females (6.6%) than
males (3.1%) are in the wholesale and retail industry.

38
Table 4.4: Employed population 15 years and older by industry and sex
Industry
Both sexes Male Female
Number Percent Number Percent Number Percent
Total 27,683 100.0
12,347 100.0
15,336 100.0
Agriculture forestry and fishing 23,235 83.9
10,733 86.9
12,502 81.5
Mining and quarrying 40 0.1
6 0.0
34 0.2
Manufacturing 1,069 3.9
243 2.0
826 5.4
Electricity gas stream and air
conditioning supply 5 0.0
5 0.0
- 0.0
Water supply; sewerage waste
management and remediation activities 14 0.1
8 0.1
6 0.0
Construction 215 0.8
190 1.5
25 0.2
Wholesale and retail; repair of motor
vehicles and motorcycles 1,391 5.0
379 3.1
1,012 6.6
Transportation and storage 124 0.4
120 1.0
4 0.0
Accommodation and food service
activities 398 1.4
48 0.4
350 2.3
Information and communication 10 0.0
8 0.1
2 0.0
Financial and insurance activities 14 0.1
8 0.1
6 0.0
Real estate activities - 0.0
- 0.0
- 0.0
Professional scientific and technical
activities 73 0.3
27 0.2
46 0.3
Administrative and support service
activities 56 0.2
47 0.4
9 0.1
Public administration and defence;
compulsory social security 102 0.4
80 0.6
22 0.1
Education 380 1.4
250 2.0
130 0.8
Human health and social work activities 76 0.3
45 0.4
31 0.2
Arts entertainment and recreation 23 0.1
20 0.2
3 0.0
Other service activities 420 1.5
114 0.9
306 2.0
Activities of households as employers;
undifferentiated goods - and services -
producing activities of households for
own use
38 0.1
16 0.1
22 0.1
Activities of extraterritorial
organizations and bodies - 0.0 - 0.0 - 0.0
Source: Ghana Statistical Service, 2010 Population and Housing Census
4.5 Employment Status
From table 4.5, out of the employed population 15 years and older, those who are self-
employed without employees constitute 65.6 percent; those who are contributing family
workers are 25.5 percent while those who are employees constitute 3.9 percent. Having a lot
of self- employed without employees in the district means that the economy is not growing in
terms of job creation. This could also mean that self- employment in the district does not
require a huge start- up capital.
The table also shows that 66.5 percent of males are self-employed without employees as
against 64.9 percent of females who are self-employed without employees. There are more
male employees (6.0%) as compared to female employees (2.1%). Also, there are 27.6

39
percent of females who are contributing family workers compared with 22.9 percent of
males.
Table 4.5: Employed population 15 years and older by employment status and sex
Employment Sector
Both Sexes
Male
Female
Number Percent Number Percent Number Percent
Total 27,683 100.0
12,347 100.0
15,336 100.0
Employee 1,070 3.9
743 6.0
327 2.1
Self- employed without employee(s) 18,168 65.6
8,210 66.5
9,958 64.9
Self- employed with employee(s) 620 2.2
278 2.3
342 2.2
Casual worker 184 0.7
103 0.8
81 0.5
Contributing family worker 7,060 25.5
2,824 22.9
4,236 27.6
Apprentice 329 1.2
96 0.8
233 1.5
Domestic employee (Househelp) 224 0.8
84 0.7
140 0.9
Other 28 0.1 9 0.1 19 0.1 Source: Ghana Statistical Service, 2010 Population and Housing census
From Table 4.6, the public sector employment favours males as a relatively high percentage
of them (3.5%) are employed in the public sector compared with the 1.1 percent of females. It
is however worth noting that the NGOs and Other International Organisations operating in
the district employ more females (0.4%) than males (0.3%).
Table 4.6: Employed population 15 years and older by employment sector and sex
Employment Sector
Both sexes
Male
Female
Number Percent Number Percent Number Percent
Total 27,892 100.0
12,433 100.0
15,459 100.0
Public (Government) 601 2.2
433 3.5
168 1.1
Private Formal 269 1.0
154 1.2
115 0.7
Private Informal 26,905 96.5
11,794 94.9
15,111 97.7
Semi-Public/Parastatal 14 0.1
9 0.1
5 0.0
NGOs (Local and International) 102 0.4
43 0.3
59 0.4
Other International Organisations 1 0.0 0 0.0 1 0.0 Source: Ghana Statistical Service, 2010 Population and Housing Census
4.6 Employment Sector
The distribution of employment sector in the Binduri District is skewed towards the private
sector. Figure 4.3, shows that the private informal sector employs 97.0 percent of the
employed population while the public/government sector employs 2.0 percent of the
employed. Others (Private Formal, Semi/Parastatal, Local and International NGOs etc.)
employ the remaining one percent.

40
Figure 4.3: Employed population 15 years and older by employment sector
Source: Ghana Statistical Service, 2010 Population and Housing Census
2.0%
97%
1.0%
Public (Government)
Private Informal
Others ( Private Formal,Semi-Public/Parastatal,Local and InternationalNGOs etc)

41
CHAPTER FIVE
INFORMATION COMMUNICATION TECHNOLOGY
5.1 Introduction
There is widespread research interest in Information and Communication Technologies
(ICTs) all over the world. ICTs are crucially important for sustainable development in
developing countries. Thioune (2003) notes that for the past two decades most developed
countries have witnessed significant changes that can be traced to ICTs. These multi-
dimensional changes have been observed in almost all aspects of life: economics, education,
communication, and travel. In a technology driven society, getting information quickly is
important for both the sender and receiver. ICTs have made it possible to quickly find and
distribute information. Thoiune (2003) indicates that many initiatives have been taken at the
international level to support Africa's efforts to develop a communication infrastructure and
these efforts are designed to enable African countries, including Ghana, find faster ways to
achieve durable and sustainable development.
Chapter five of this report discusses ICT usage in the Binduri District in relation to the
ownership of mobile phones, desktop/laptop computers and the use of the internet.
5.2 Ownership of Mobile Phones
Bittner (1989) defines mobile phone as a telephone system that can move or be moved easily
and quickly from place to place. Mobile phones were once the tool of rich and busy
executives who could afford. Mobile phones are now the ICT that is reshaping and
revolutionizing communications globally. Its impact on the economic activities of nations,
businesses, and small entrepreneurs is impressive.
According to the 2010 PHC, 6,797 persons representing 17.3 percent of persons 12 years and
older in the Binduri District own mobile phones. This proportion is very low compared to the
national average of 47.7 percent and still lower than the Upper East regional average of
24.2percent. Figure 1 further shows that the proportion of males (12 years and older) owning
mobile phones is higher (25.0%) than the proportion of females (10.7%) in the district.
5.3 Use of Internet
The Internet is a global collection of many types of computers and computer networks that
are linked together. It is increasingly becoming the solution to many information problems,
information exchange, and marketing (Adesanya, 2002). Where, (2000) states that ‘with
internet connectivity, one can do business all over the world without physical contact with the
buyer or the need for a business intermediary’. The importance of ICTs in the development
process was long recognized and access to ICTs was even made one of the targets of the
Millennium Development Goal (MDG 8). This emphasises the benefits of new technologies,
especially ICTs in the fight against poverty.
According to the International Communication Union (2012), the percentage of individuals
using the Internet continues to grow worldwide and by the end of 2011, about 2.3 billion
people were using the Internet. However, there is a wide gap in the access to internet between
the developed and developing countries. By the end of 2011, 70.0 percent of households in

42
developed countries used the Internet compared to only 20.0 percent of households in
developing countries, (GSS, 2010).
The 2010 Population and Housing Census as shown in Figure 1, recorded 435 users of
internet facilities out of 39,352 population (12 years and older) in the Binduri District. This
indicates that only 1.1 percent of persons 12 years and older has access to the internet which
is almost equal to the regional average of 1.2 percent but way below the national average of
7.8 percent. In terms of sex, just as at the national and regional levels, usage of the Internet
services among males is higher (1.6%) than their female counterpart (0.6%). Thus
approximately, three males against one female use internet services in the District.
Figure 5.1: Population 12 years and older by mobile phone ownership, internet facility usage
and sex.
Figure 5.1: Population 12 years and older by mobile phone ownership internet
usage and sex
Source: Ghana Statistical Service, 2010 Population and Housing Census
5.5 Household Ownership of Desktop or Laptop Computer
Computers (Desktop/laptop) are useful for accessing and processing information. Computers
are now commonly used for writing letters and reports, printing books, newspapers, and
magazines, drawing pictures and diagrams, doing statistics, mathematics and handling
financial records, controlling traffic lights, flying aeroplanes, making and playing music and
video, sending messages anywhere in the world and other services.
The 2010 PHC recorded 128 households (1.4%) of all households (9,199) in the Binduri
District who own laptop or desktop computers. This figure is higher than the regional figure
of 1.3 percent but lower than the national figures of 7.9 percent. Ownership of desktop/laptop
computers is low because of the high cost or that people have access to them in their offices.
17.3
1.1
25.0
1.6
10.7
0.6
Mobile Phone Ownership Internet usage
Total male female

43
With respect to heads of household ownership of desktop or laptop computers by gender,
female headed households recorded 1.5 percent of households with laptop/desktop computers
whiles male headed households recorded 1.4 percent.
Figure 5.2: Households having desktop/laptop computers and sex of head
Source: Ghana Statistical Service, 2010 Population and Housing Census
1.4 1.4
1.5
1.34
1.36
1.38
1.4
1.42
1.44
1.46
1.48
1.5
1.52
Computers
Pe
rce
nt
Households having desktop/laptop computers
total male headed female headed

44
CHAPTER SIX
DISABILITY
6.1 Introduction
Disability as defined by the World Health Organisation is a "restriction or lack (resulting
from an impairment) of ability to perform an activity in the manner or within the range
considered normal for a human being". It describes a functional limitation or activity
restriction caused by impairment. Disabilities are descriptions of disturbances in function at
the level of the person. Examples of disabilities include difficulty in seeing, speaking or
hearing, difficulty moving or climbing stairs; difficulty grasping, reaching height, bathing,
eating and using toilet facilities.
Over the past few decades (since 1945) the United Nations through its General Assembly
established the foundation for the promotion and protection of the rights of persons with
disability, when it proclaimed the Universal Declaration of Human Rights. Article 25 of the
Declaration states that” each person has the right to security in the event of unemployment,
sickness, disability, widowhood, old age or other lack of livelihood in circumstances beyond
his control”. There has been an international consent on the recognition of the rights of
persons with disabilities which promote dignity, and inclusive development.
In planning evidence is needed to make informed decisions on policies and programmes.
Understanding the numbers and knowing the characteristics of people with disabilities can
help in addressing barriers and provide services that allow people with disabilities to
participate more effectively in national development.
The 2010 PHC was the first census in Ghana to include questions on disabilities. This chapter
therefore presents data on the population with disability, type of Disability, distribution of
persons with disabilities (PWDs) by type of locality etc. in the Binduri District.
6.2 Population with Disability
As shown in Table 6.1, there are 1,732 persons with some form of disability in the Binduri
District which constitutes 2.8 percent of the total population of the District. This proportion is
both lower than the Upper East Regional proportion and the national proportion of (3.8%)
and (3.0%) respectively. The proportion of persons with disability in the District is higher
among males (2.9%) than females (2.7%) which is opposite for the national and regional
average where females are dominating.
6.3 Type of Disability
The proportion of persons with disability by type of disability is shown in Table 6.1. The
most common types of disability in the Binduri District are sight or visual impairment and
physical disability follows by hearing. Visual impairment constitute 41.9 percent of persons
followed by physical disability (26.3%) and hearing (21.2%) and the least (7.3%) being
persons with other forms of disability. The distribution of the various types of disability in the
District is also quite similar to the national and regional figures with sight and physical
disability dominating. For instance, at the national level, sight and physical disability
constitute 40.1 percent and 25.4 percent respectively, whereas at the regional level, sight and
physical disability are 40.0 percent and 21.9 percent respectively. The district is
predominantly rural hence disability by type of locality is not disaggregated.

45
Table 6.1: Population by type of locality, disability type and sex
Population by
disability type
Both sexes
Male
Female
Number percent
Number percent
Number percent
Total 61,576 100.0
29,612 100.0
31,964 100.0
No disability 59,844 97.2
28,742 97.1
31,102 97.3
With a disability 1,732 2.8
870 2.9
862 2.7
Sight 725 41.9
326 37.5
399 46.3
Hearing 367 21.2
181 20.8
186 21.6
Speech 224 12.9
124 14.3
100 11.6
Physical 456 26.3
228 26.2
228 26.5
Intellectual 232 13.4
122 14.0
110 12.8
Emotional 168 9.7
91 10.5
77 8.9
Other 126 7.3
80 9.2
46 5.3 Source: Ghana Statistical Service, 2010 Population and Housing Census
6.4 Disability and Activity
Persons with disability 15 years and older and their activity status is shown in Table 6.2
From the Table, 61.4 percent of PWDs in the district are economically active whiles 38.6
percent are economically not active.
Table 6.2: Persons 15 years and older with disability by economic activity status and
Both Sexes/
Disability type
All Status
Employed
Unemployed
Economically Not
Active
Number Percent Number Percent Number Percent Number Percent
Both Sexes
Total 34,518 100.0
27,683 80.2
253 0.7
6,582 19.1
No disability 33,174 100.0
26,873 81.0
238 0.7
6,063 18.3
With a disability 1,344 100.0
810 60.3
15 1.1
519 38.6
Sight 600 100.0
331 55.2
6 1.0
263 43.8
Hearing 279 100.0
174 62.4
1 0.4
104 37.3
Speech 144 100.0
99 68.8
2 1.4
43 29.9
Physical 366 100.0
212 57.9
4 1.1
150 41.0
Intellectual 168 100.0
94 56.0
2 1.2
72 42.9
Emotional 117 100.0
77 65.8
2 1.7
38 32.5
Other 86 100.0
50 58.1
0 0.0
36 41.9
Male
Total 15,518 100.0
12,347 79.6
116 0.7
3,055 19.7
No disability 14,867 100.0
11,917 80.2
111 0.7
2,839 19.1
With a disability 651 100.0
430 66.1
5 0.8
216 33.2
Sight 259 100.0
167 64.5
3 1.2
89 34.4
Hearing 133 100.0
88 66.2
0 0
45 33.8
Speech 78 100.0
55 70.5
1 1.3
22 28.2
Physical 180 100.0
114 63.3
1 0.6
65 36.1
Intellectual 84 100.0
46 54.8
0 0.0
38 45.2
Emotional 61 100.0
39 63.9
1 1.6
21 34.4
Other 52 100.0
29 55.8
0 0.0
23 44.2

46
Table 6.2: Persons 15 years and older with disability by economic activity status and
(Cont’d)
Both Sexes/
Disability type
All Status
Employed
Unemployed
Economically Not
Active
Number Percent Number Percent Number Percent Number Percent
Female
Total 19,000 100.0
15,336 80.7
137 0.7
3,527 18.6
No disability 18,307 100.0
14,956 81.7
127 0.7
3,224 17.6
With a disability 693 100.0
380 54.8
10 1.4
303 43.7
Sight 341 100.0
164 48.1
3 0.9
174 51.0
Hearing 146 100.0
86 58.9
1 0.7
59 40.4
Speech 66 100.0
44 66.7
1 1.5
21 31.8
Physical 186 100.0
98 52.7
3 1.6
85 45.7
Intellectual 84 100.0
48 57.1
2 2.4
34 40.5
Emotional 56 100.0
38 67.9
1 1.8
17 30.4
Other 34 100.0 21 61.8 0 0.0 13 38.2 Source: Ghana Statistical Service, 2010 Population and Housing Census
Out of the economically active PWDs, 60.3 percent are employed while 1.1 percent is
unemployed.
Among the disability types with employment, persons with speech disability are mostly
employed (68.8%) followed by emotional disability (65.8%) and the least is sight disability
(55.2%). With respect to disability by gender and employment, 66.1 percent of males 15
years and older who are PWDs are employed as compared to 54.8percent for females. There
are more unemployed females (1.4%) than their male counterpart (0.8%).
6.5 Disability, Education and Literacy
Education generally enhances the employment opportunities of all persons in Ghana,
including persons with disability. Government and other social welfare agencies have been
implementing policies to improve access of persons with disability to education at all levels.
From Table 6.3, it shows that, out of 1,671 representing 2.9 percent of PWDs in the Binduri
District 3years and older of school going age, (66.1%) have never attended school and
majority of those who have attended school, (24.7%) are in basic school whiles (6.2%) have
attended SHS or Higher education. The data further indicates that more males (75.5%) than
females (42.8%) have attained some level of education.

47
Table 6.3: Population 3 years and older by sex, disability type and level of education
Sex/Disability
type
Number Percent
Total Never Pre-
Prim Basic
Sec/
SHS &
higher
Total Never Pre-
Prim Basic
Sec/
SHS &
higher
Both Sexes
Total 56,888 28,515 3,993 21,420 2,960
100.0 50.1 7.0 37.7 5.2
No disability 55,217 27,411 3,942 21,007 2,857
100.0 49.6 7.1 38.0 5.2
With a disability 1,671 1,104 51 413 103
100.0 66.1 3.1 24.7 6.2
Sight 697 478 15 137 67
100.0 68.6 2.2 19.7 9.6
Hearing 358 244 13 94 7
100.0 68.2 3.6 26.3 2.0
Speech 212 135 11 57 9
100.0 63.7 5.2 26.9 4.2
Physical 442 312 11 104 15
100.0 70.6 2.5 23.5 3.4
Intellectual 223 159 4 52 8
100.0 71.3 1.8 23.3 3.6
Emotional 159 88 6 57 8
100.0 55.3 3.8 35.8 5.0
Other 115 71 6 33 5
100.0 61.7 5.2 28.7 4.3
Male
Total 27,247 11,571 2,106 11,603 1,967
100.0 42.5 7.7 42.6 7.2
No disability 26,413 11,078 2,075 11,358 1,902
100.0 41.9 7.9 43.0 7.2
With a disability 834 493 31 245 65
100.0 59.1 3.7 29.4 7.8
Sight 308 192 6 71 39
100.0 62.3 1.9 23.1 12.7
Hearing 175 106 6 60 3
100.0 60.6 3.4 34.3 1.7
Speech 116 64 7 38 7
100.0 55.2 6.0 32.8 6.0
Physical 220 131 7 69 13
100.0 59.5 3.2 31.4 5.9
Intellectual 119 77 3 34 5
100.0 64.7 2.5 28.6 4.2
Emotional 85 39 4 37 5
100.0 45.9 4.7 43.5 5.9
Other 71 44 6 19 2
100.0 62.0 8.5 26.8 2.8
Female
Total 29,641 16,944 1,887 9,817 993
100.0 57.2 6.4 33.1 3.4
No disability 28,804 16,333 1,867 9,649 955
100.0 56.7 6.5 33.5 3.3
With a disability 837 611 20 168 38
100.0 73.0 2.4 20.1 4.5
Sight 389 286 9 66 28
100.0 73.5 2.3 17.0 7.2
Hearing 183 138 7 34 4
100.0 75.4 3.8 18.6 2.2
Speech 96 71 4 19 2
100.0 74.0 4.2 19.8 2.1
Physical 222 181 4 35 2
100.0 81.5 1.8 15.8 0.9
Intellectual 104 82 1 18 3
100.0 78.8 1.0 17.3 2.9
Emotional 74 49 2 20 3
100.0 66.2 2.7 27.0 4.1
Other 44 27 0 14 3 100.0 61.4 0.0 31.8 6.8 Source: Ghana Statistical Service, 2010 Population and Housing Census

48
CHAPTER SEVEN
AGRICULTURAL ACTIVITIES
7.1 Introduction
An agricultural household according to the 2010 PHC is one that engages generally in
agricultural activities or at least one of its members engages in agricultural production even if
not earning from agricultural activity alone.
This chapter provides a description of household members and heads of households engaged
in agricultural activities. These activities include crop farming, tree growing, livestock
rearing and fish farming. Excluded from this discussion are those engaged in hunting and
other, non- farm agricultural activities.
7.2 Households in Agriculture
Table 7.1 shows the distribution of agricultural households in the Binduri District by type of
locality. Since it is a rural district, all the households lived in rural localities. Out of 9,199
households enumerated, 8,641 are engaged in agricultural activities in the district
representing 93.9 percent. This is higher than the regional and national averages of 83.7
percent and 45.8 percent respectively.
7.3 Types of Farming Activities
From table 7.1 the main type of agricultural activities that many of the agriculture households
in the district engage in are crop farming and livestock rearing. About 99.3 percent and 82.1
are into crop farming and livestock rearing respectively whiles only 0.4 percent is into three
planting. Approximately no household is into fish farming in the district.
Table 7.1: Households by agricultural activities and locality
Agricultural activity
Urban
Rural
Number Percent Number Percent
Total Households 9,199 100.0
9,199 100.0
Households engages in Agriculture 8,641 93.9
8,641 93.9
Crop Farming 8,578 99.3
8,578 99.3
Tree Planting 37 0.4
37 0.4
Livestock Rearing 7,090 82.1
7,090 82.1
Fish Farming 3 0.0 3 0.0 Source: Ghana Statistical Service, 2010 Population and Housing Census
Table7.2 shows that the total number of livestock reared in the district is 286,671. There are
19,946 keepers in the district with an average of 14 animals per keeper. The most common
livestock raised in the district is chicken (90,797) with 4,267 keepers and an average of 21
birds per keeper followed by guinea fowl (74,039) with 3,261 keepers and an average of 23
animals per keeper. The livestock with the least number is snail (4) with 1 keeper and an
average of 4 snails per keeper.
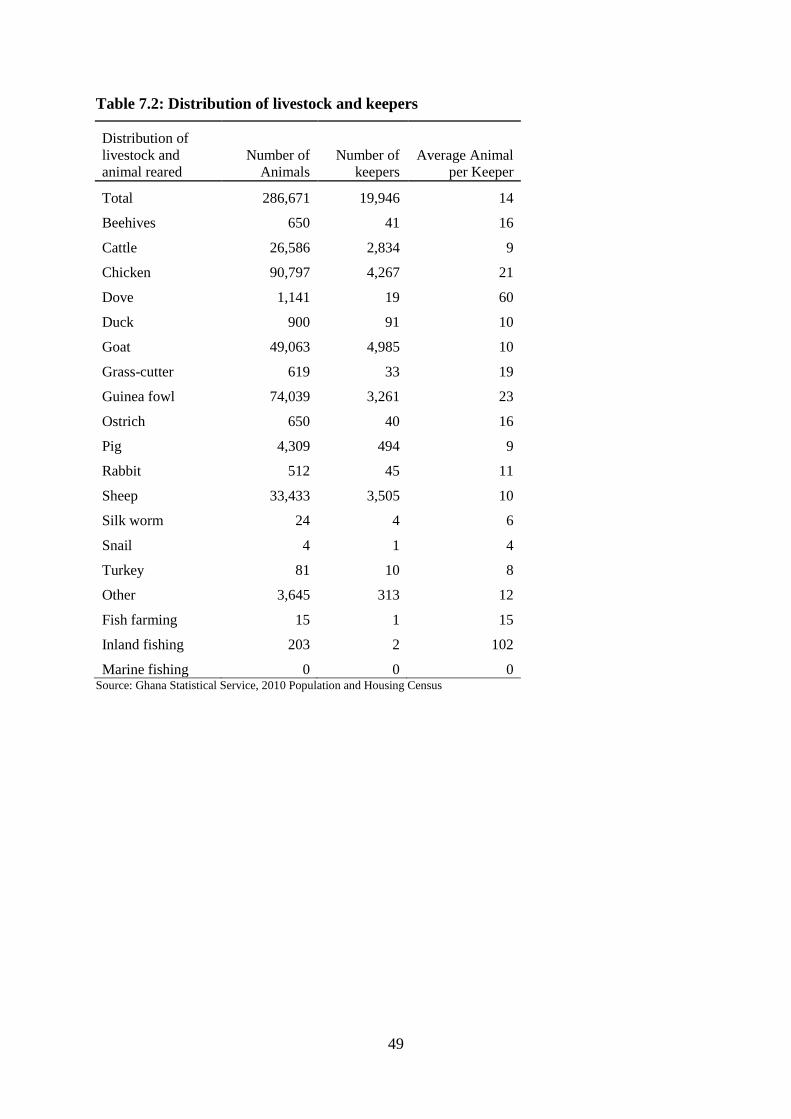
49
Table 7.2: Distribution of livestock and keepers
Distribution of
livestock and
animal reared
Number of
Animals
Number of
keepers
Average Animal
per Keeper
Total 286,671 19,946 14
Beehives 650 41 16
Cattle 26,586 2,834 9
Chicken 90,797 4,267 21
Dove 1,141 19 60
Duck 900 91 10
Goat 49,063 4,985 10
Grass-cutter 619 33 19
Guinea fowl 74,039 3,261 23
Ostrich 650 40 16
Pig 4,309 494 9
Rabbit 512 45 11
Sheep 33,433 3,505 10
Silk worm 24 4 6
Snail 4 1 4
Turkey 81 10 8
Other 3,645 313 12
Fish farming 15 1 15
Inland fishing 203 2 102
Marine fishing 0 0 0 Source: Ghana Statistical Service, 2010 Population and Housing Census

50
CHAPTER EIGHT
HOUSING CONDITIONS
8.1 Introduction
Housing is an integral element of a district’s economy. Its backward and forward linkages
with other parts of the economy closely bond people’s needs, demands and social processes
with the supply of land, infrastructure, building materials, technology, labour, and housing
finance. These linkages allow housing to act as an important engine for sustainable
development and poverty reduction in both society and the economy. (UN-Habitat, 2010).
Housing data helps in understanding key aspects of housing and housing conditions. They
assist policy makers and planners to make evidence based decisions on housing policies and
interventions. This chapter provides an overview of housing and housing conditions in the
Binduri District. Data presented include housing stock and types of houses, ownership,
household room occupancy and housing conditions with particularly reference to the main
source of water for drinking and for other domestic use, bathing and toilet facilities and
methods of waste disposal.
8.2 Housing Stock
The distribution of housing stock and households by type of locality in the district is
presented in Table 8.1. The table indicates that the total stock of houses in the district is 6,391
and situated in rural localities. The table further shows that there are 9,199 households in the
district. The district average household per house is 1.4, which is lower than the regional
average (1.6) and the national average (1.6). The average population per house and household
size in the district are 9.6 and 6.6 respectively.
Table 8.1: Stock of houses and households by type of locality
Categories
Total
country Region District Urban Rural
Total population 24,658,823 1,046,545 61,576 - 61,576
Total household
population 24,076,327 1,034,704 60,878 - 60,878
Number of houses 3,392,745 114,034 6,391 - 6,391
Number of households 5,467,054 177,629 9,199 - 9,199
Average households per
house 1.6 1.6 1.4 - 1.4
Population per house 7.3 9.2 9.6 - 9.6
Average household size 4.5 5.9 6.6 - 6.6 Source: Ghana Statistical Service, 2010 Population and Housing Census
8.3 Construction Materials
Table 8.2 shows the main construction materials used for outer walls of dwelling (occupied
and vacant) in the district. The main materials for construction of outer walls in the district
are mud brick/Earth (88.1%) and cement block/concrete (8.3%) with the other materials such
as wood, metal sheet/slate/asbestos, landcrete, and bamboo etc. constituting 3.6 percent. The

51
building material hardly used for the construction of the outer walls of buildings in the
district is bamboo.
Table 8.2: Main construction material for outer wall of dwelling unit by type of locality
Material for Outer wall
Total
country Region
District
Urban Rural Number Percent
Total 5,817,607 182,845 9,366 100.0 - 100.0
Mud brick/Earth 1,991,540 147,624 8,250 88.1 - 88.1
Wood 200,594 1,606 138 1.5 - 1.5
Metal sheet/Slate/Asbestos 43,708 855 42 0.4 - 0.4
Stone 11,330 372 14 0.1 - 0.1
Burnt bricks 38,237 233 7 0.1 - 0.1
Cement blocks/Concrete 3,342,462 29,321 778 8.3 - 8.3
Landcrete 104,270 1,890 113 1.2 - 1.2
Bamboo 8,206 54 2 0.0 - 0.0
Palm leaf/Thatch (grass)/Raffia 38,054 435 7 0.1 - 0.1
Other 39,206 455 15 0.2 - 0.2 Source: Ghana Statistical Service, 2010 Population and Housing Census
8.4 Type of Dwelling, Holding and Tenancy Arrangement
Table 8.3 shows that the proportion of houses owned by members of household in the district
is 92.5 percent, owned by a relative who is not a household member is 3.2 percent while the
proportion of dwelling units owned by other private individuals is 2.6 percent. Public or
government-owned housing forms only a small proportion of (0.6%) and the same figure is
recorded for housing units owned by private employers. Only 0.2 percent of dwelling units
are purchased probably through mortgage schemes. The ownership status of dwellings by sex
indicates that 94.1 percent of houses owned by household members are male headed
household as compared to 86.1 percent by their female counterpart.
Table 8.3: Ownership status of dwelling by sex of household head
Ownership
Total
Country Region
District Male
headed
Female
headed Number Percent
Total 5,467,054 177,629 9,199 100.0 100.0 100.0
Owned by household member 2,883,236 154,016 8,511 92.5 94.1 86.1
Being purchased (e.g. mortgage) 45,630 721 15 0.2 0.2 0.1
Relative not a household member 851,630 6,035 290 3.2 2.1 7.6
Other private individual 1,439,021 12,181 238 2.6 2.2 4.3
Private employer 83,610 480 52 0.6 0.6 0.5
Other private agency 21,123 267 8 0.1 0.1 0.1
Public/Government ownership 118,804 3,686 54 0.6 0.6 0.7
Other 24,000 243 31 0.3 0.3 0.6
Source: Ghana Statistical Service, 2010 Population and Housing Census
As shown in Table 8.4, there are 9,199 occupied dwelling units in the district. Out of these,
compound houses are the most common (70.4%) of dwelling units in the Binduri District.
The proportion of dwelling units constituting separate or detached houses are 19.2 percent
whiles Huts/buildings (same compound) constitute 6.4 percent of all dwelling units. The

52
remaining 4.1 percent of dwelling units include semi-detached house, flat/apartment, and
huts/buildings (different compound).
Table 8.4: Type of occupied dwelling unit by sex of household head and type of locality
Type of dwelling
Total
country Region
District Male
headed
Female
headed Urban Rural Number Percent
Binduri
Total 5,467,054 177,629 9,199 100.0 100.0 100.0 - 100.0
Separate house 1,471,391 29,787 1,765 19.2 18.9 20.3 - 19.2
Semi-detached house 391,548 6,836 181 2.0 1.8 2.8 - 2.0
Flat/Apartment 256,355 1,459 47 0.5 0.5 0.6 - 0.5
Compound house (rooms) 2,942,147 103,666 6,476 70.4 70.2 71.1 - 70.4
Huts/Buildings (same
compound) 170,957 22,735 586 6.4 7.0 3.9 - 6.4
Huts/Buildings (different
compound) 36,410 11,616 64 0.7 0.7 0.7 - 0.7
Tent 10,343 300 6 0.1 0.1 0.0 - 0.1
Improvised home
(kiosk/container etc.) 90,934 183 15 0.2 0.1 0.2 - 0.2
Living quarters attached
to office/shop 20,499 348 16 0.2 0.2 0.0 - 0.2
Uncompleted building 66,624 554 39 0.4 0.4 0.3 - 0.4
Other 9,846 145 4 0.0 0.0 0.1 - 0.0 Source: Ghana Statistical Service, 2010 Population and Housing Census
As shown in Table 8.5, the main materials for floors of dwellings (occupied dwellings) in the
Binduri District are largely made of cement or concrete (72.2%). About one in five (23.3%)
houses has floors made of earth or mud. The remaining 4.5 percent is made up of stone, burnt
brick, wood, ceramics/porcelain/granite/marble tiles, terrazzo tiles and others. Material
hardly used for the floors of the dwellings in the district is Vinyl tiles.
Table 8.5: Main construction materials for the floor of dwelling unit by type of locality
Materials for the floor
Total
country Region
District Urban Rural
Number Percent Percent Percent
Total 5,467,054 177,629 9,199 100.0
- 100.0
Earth/Mud 872,161 56,272 2,143 23.3
- 23.3
Cement/Concrete 4,255,611 116,911 6,639 72.2
- 72.2
Stone 32,817 1,623 42 0.5
- 0.5
Burnt brick 6,537 89 5 0.1
- 0.1
Wood 52,856 49 6 0.1
- 0.1
Vinyl tiles 57,032 196 4 0.0
- 0.0
Ceramic/Porcelain/Granite/Marble tiles 88,500 1,181 63 0.7
- 0.7
Terrazzo/Terrazzo tiles 85,973 401 25 0.3
- 0.3
Other 15,567 907 272 3.0 - 3.0 Source: Ghana Statistical Service, 2010 Population and Housing Census
Roofs of dwellings (Occupied and vacant) in Binduri District are mainly made of metal
sheets (80.5%) as shown in Table 8.6. The next widely used material for roofing in the
district is thatch/palm leaves or raffia (14.0%) whiles 2.4 percent of dwellings are roofed with
mud/mud bricks/earth. The situation in the district conforms with the national and regional
distributions where metal sheets constitute 67.2 percent at the regional level and 71.4 percent
at the national level.

53
Table 8.6: Main material for roofing of dwelling unit by type of locality
Main Roofing material
Total
country Region
District Urban Rural
Number Percent Percent Percent
Total 5,817,607 182,845 9,366 100.0
- 100.0
Mud/Mud bricks/Earth 80,644 22,227 222 2.4
- 2.4
Wood 45,547 3,085 86 0.9
- 0.9
Metal sheet 4,152,259 122,942 7,538 80.5
- 80.5
Slate/Asbestos 759,039 646 11 0.1
- 0.1
Cement/Concrete 141,072 879 53 0.6
- 0.6
Roofing tile 31,456 162 1 0.0
- 0.0
Bamboo 71,049 586 31 0.3
- 0.3
Thatch/Palm leaf or Raffia 500,606 30,722 1,312 14.0
- 14.0
Other 35,935 1,596 112 1.2 - 1.2 Source: Ghana Statistical Service, 2010 Population and Housing Census
8.5 Room Occupancy
The number of rooms occupied by a household is one of the best indicators for assessing how
crowded dwelling units in a locality are and the space available per person. There is health
and consequent wellbeing implications or both for the household members. As shown in
Table 8.7, 42.3 percent of households with four members occupy two rooms in the Binduri
District. Also, 85.2 percent of one member households occupy one room.
Table 8.7: Household size and number of sleeping rooms occupied in dwelling unit
House-
hold
size Total
Number of sleeping rooms
One
room
Two
rooms
Three
rooms
Four
rooms
Five
rooms
Six
rooms
Seven
rooms
Eight
rooms
Nine
rooms or
more
Total 9,199 13.8 22.6 22.1 16.6 9.5 6.1 3.0 2.1 4.1
1 351 85.2 9.1 2.6 0.9 1.1 0.3 0.0 0.3 0.6
2 514 44.6 39.9 6.4 4.5 1.8 1.4 0.0 0.2 1.4
3 803 28.6 38.7 22.5 5.0 2.0 0.7 1.4 0.2 0.7
4 1,081 18.9 42.3 22.8 9.3 3.1 0.8 1.2 0.3 1.4
5 1,137 12.8 33.9 30.2 13.1 5.3 1.4 0.9 1.1 1.2
6 1,110 7.3 26.8 32.8 18.6 6.4 4.9 0.8 0.7 1.7
7 978 4.0 17.2 33.0 24.4 11.0 4.1 3.3 0.4 2.6
8 870 2.2 13.6 24.9 26.1 14.9 7.8 3.6 3.2 3.7
9 662 2.3 8.6 20.1 28.2 17.7 13.3 3.5 1.7 4.7
10+ 1,693 0.6 2.8 11.0 20.7 19.5 16.1 8.9 7.3 13.1 Source: Ghana Statistical Service, 2010 Population and Housing Census
8.6 Access to Utilities and Household Facilities
The nature of household utilities and facilities determine the level and quality of life. As
society develops, the source of energy used for lighting and cooking as well as the quality of
cooking space changes from the use of low quality to improved or modern facilities.
Table 8.8 indicates that, the main source of lighting for dwellings in the district is flashlight
(44.0%) followed by kerosene lamp (41.0%) with only 13.0 percent of dwelling units using
electricity. The remaining sources such as gas lamp, candle, firewood, crop residue, etc.
constitute about 2.0 percent.

54
Table 8.8: Main source of lighting of dwelling unit by type of locality
Main source of light
Total
country Region
District
Urban Rural Number Percent
Total 5,467,054 177,629 9,199 100.0
- 100.0
Electricity (mains) 3,511,065 42,866 1,196 13.0
- 13.0
Electricity (private generator) 36,142 1,009 27 0.3
- 0.3
Kerosene lamp 971,807 80,752 3,772 41.0
- 41.0
Gas lamp 9,378 412 28 0.3
- 0.3
Solar energy 9,194 612 19 0.2
- 0.2
Candle 41,214 293 5 0.1
- 0.1
Flashlight/Torch 858,651 49,068 4,043 44.0
- 44.0
Firewood 13,241 1,191 62 0.7
- 0.7
Crop residue 4,623 830 41 0.4
- 0.4
Other 11,739 596 6 0.1 - 0.1 Source: Ghana Statistical Service, 2010 Population and Housing Census
As shown in Table 8.9, the three main sources of energy used for cooking in households in
the district are: wood (62.8%), crop residue (26.6%), and charcoal (5.4%). A part from these,
1.9 percent of households use gas whiles 1.5 percent use other fuel. Due to poverty and the
availability of wood in rural areas, it is the main source of cooking fuel for most of the
households.
Table 8.9: Main source of cooking fuel, and cooking space used by households
Main source of cooking fuel, and cooking
space used by households
Total
country Region
District
Number Percent
Cooking fuel
Total 5,467,054 177,629 9,199 100.0
None no cooking 306,118 3,272 122 1.3
Wood 2,197,083 107,310 5,776 62.8
Gas 996,518 8,735 176 1.9
Electricity 29,794 383 10 0.1
Kerosene 29,868 402 21 0.2
Charcoal 1,844,290 27,021 497 5.4
Crop residue 45,292 29,725 2,446 26.6
Saw dust 8,000 93 1 0.0
Animal waste 2,332 124 9 0.1
Other 7,759 564 141 1.5
Cooking space used by household
Total 5,467,054 177,629 9,199 100.0
No cooking space 386,883 6,822 304 3.3
Separate room for exclusive use of household 1,817,018 75,393 3,751 40.8
Separate room shared with other household(s) 410,765 4,664 722 7.8
Enclosure without roof 117,614 31,567 1,891 20.6
Structure with roof but without walls 349,832 1,788 189 2.1
Bedroom/Hall/Living room) 74,525 572 10 0.1
Verandah 1,173,946 18,444 297 3.2
Open space in compound 1,115,464 38,038 1,991 21.6
Other 21,007 341 44 0.5 Source: Ghana Statistical Service, 2010 Population and Housing Census
The distribution of cooking space used by households in the district is presented in Table 8.9.
The most common type of cooking space for most households is separate room for exclusive
use by households. About forty percent (40.8%) of the household use cooking spaces that are

55
separate for exclusive use of the households while 20.6 percent of households cook in
enclosure without roof. Households who cook in open space in the compound constitute 21.6
percent whiles (7.8%) cook in separate rooms shared with other households.
8.7 Main Source of Water for Drinking and for other Domestic Use
The source of water supply particularly for drinking has tremendous effect on the burden of
disease in a community. The main health benefit of clean water supply is a reduction in
diarrhoeal disease, although the effects on other diseases are also substantial. Water is often
classified as “improved” or “unimproved”. Sources considered as improved are household
connection to public pipe borne water supply system, public standpipe, and bore-hole,
protected (lined) dug well, protected spring, and rainwater collection. Unprotected wells and
springs, vendors, and tanker-trucks are considered unimproved.
The main source of water for drinking and for other domestic purposes by households in
occupied dwellings units in the district is shown in Table 8.10. From the Table, close to half
of households (50.6%) in the district have the bore-hole/pump/tube well as their main source
of drinking water followed by protected well (22.2%) and unprotected well 12.1 percent. The
remaining 15.1 percent use other sources such as bottled water, unprotected spring, rain water
etc. About 85.1 percent of households in the district patronise improved sources of drinking
water while the remaining 14.9 percent patronise unimproved sources.
Table 8.10: Main source of drinking water for household
Sources of water
Total
country Region
District
Urban Rural
Number Percent Percent Percent
Main source of drinking water for household
Total 5,467,054 177,629
9,199 100.0
- 100.0
Pipe-borne inside dwelling 790,493 11,577
181 2.0
- 2.0
Pipe-borne outside dwelling 1,039,667 15,063
447 4.9
- 4.9
Public tap/Standpipe 712,375 5,179
425 4.6
- 4.6
Bore-hole/Pump/Tube well 1,267,688 101,817
4,655 50.6
- 50.6
Protected well 321,091 22,805
2,043 22.2
- 22.2
Rain water 39,438 223
2 0.0
- 0.0
Protected spring 19,345 683
59 0.6
- 0.6
Bottled water 20,261 82
4 0.0
- 0.0
Sachet water 490,283 694
16 0.2
- 0.2
Tanker supply/Vendor provided 58,400 267
1 0.0
- 0.0
Unprotected well 112,567 11,083
1,115 12.1
- 12.1
Unprotected spring 12,222 378
31 0.3
- 0.3
River/Stream 502,804 4,452
123 1.3
- 1.3
Dugout/Pond/Lake/Dam/Canal 76,448 3,175
97 1.1
- 1.1
Other 3,972 151 0 0.0 - 0.0 Source: Ghana Statistical Service, 2010 Population and Housing Census
The main source of water used by households in occupied dwelling units for other domestic
purposes in the district is bore-hole/pump/tube well (49.3%), follow by protected well
(22.4%) and unprotected well (12.0%) and use pipe-borne outside dwelling (4.6).
Households who use public tap/standpipe forms (4.5%) whiles river/stream constitutes 2.5
percent.

56
Table 8.11: Main source of water for other domestic use of household
Sources of water
Total
country Region District
Urban Rural
Number Percent Percent Percent
Main source of water for other domestic use of household
Total 5,467,054 177,629
9,199 100.0
- 100.0
Pipe-borne inside dwelling 905,566 11,408
178 1.9
- 1.9
Pipe-borne outside dwelling 1,089,030 13,957
426 4.6
- 4.6
Public tap/Standpipe 704,293 4,541
416 4.5
- 4.5
Bore-hole/Pump/Tube well 1,280,465 98,487
4,532 49.3
- 49.3
Protected well 465,775 24,798
2,065 22.4
- 22.4
Rain water 39,916 330
5 0.1
- 0.1
Protected spring 18,854 672
46 0.5
- 0.5
Tanker supply/Vendor provided 100,048 301
2 0.0
- 0.0
Unprotected well 152,055 11,607
1,103 12.0
- 12.0
Unprotected spring 15,738 650
51 0.6
- 0.6
River/Stream 588,590 6,125
232 2.5
- 2.5
Dugout/Pond/Lake/Dam/Canal 96,422 4,518
142 1.5
- 1.5
Other 10,302 235 1 0.0 - 0.0
Source: Ghana Statistical Service, 2010 Population and Housing Census
8.8 Bathing and Toilet Facilities
Table 8.12 presents bathing and toilet facilities available in occupied dwelling units in the
district. Bathing facilities used in the district are primarily of four main types: those owned
for exclusive use constitute 28.8%, shared separated bathroom in the same house (26.6%),
and shared open cubicle (15.5%) and private open cubicle (17.9%). The proportion of
households that use open space around the house is 9.8 percent. Households who use public
bath house is 0.8 percent as against 0.5 percent who uses bath rooms in another house.
Table 8.12: Bathing facility and toilet facilities used by household
Bathing facility and toilet facilities used by
household
Total
country Region
District
Rural Number Percent
Toilet facility used by household
Total 5,467,054 177,629 9,199 100.0 9,199
No facilities (bush/beach/field) 1,056,382 146,329 7,699 83.7 7,699
W.C. 839,611 6,050 142 1.5 142
Pit latrine 1,040,883 5,266 490 5.3 490
KVIP 572,824 6,196 244 2.7 244
Bucket/Pan 40,678 405 17 0.2 17
Public toilet (W.C./KVIP/Pit/Pan etc.) 1,893,291 12,828 587 6.4 587
Other 23,385 555 20 0.2 20
Bathing facility used by household
Total 5,467,054 177,629 9,199 100.0 9,199
Own bathroom for exclusive use 1,535,392 73,345 2,645 28.8 2,645
Shared separate bathroom in the same house 1,818,522 33,370 2,449 26.6 2,449
Private open cubicle 381,979 26,114 1,648 17.9 1,648
Shared open cubicle 1,000,257 21,111 1,428 15.5 1,428
Public bath house 140,501 2,391 73 0.8 73
Bathroom in another house 187,337 479 42 0.5 42
Open space around house 372,556 19,987 901 9.8 901
River/Pond/Lake/Dam 14,234 437 5 0.1 5
Other 16,276 395 8 0.1 8
Table 8.12 also shows he distribution of type of toilet facilities used by households in
dwelling units in the district. From the table, over eighty percent (83.7%) have no facility

57
hence resort to bush, fields or beaches as place of convenience. Households using public
toilet constitute (6.4%) whiles 5.3 percent use pit latrine. The remaining (4.6%) of
households use WC, KVIP, Bucket/Pan and Other.
8.9 Methods of waste disposal
A major challenge of districts in Ghana is efficient solid (refuse) and liquid waste disposal.
As shown in Table 8.13 there are varied forms of disposing solid waste (refuse) in the district.
Public dump (open space) accounts for 31.5 percent of refuse disposal in the district follow
by burning by the household (27.3%). The proportion of households who dump solid wastes
indiscriminately is 15.8 percent whiles the proportion of households whose solid wastes is
collected is 11.1 percent. Other proportions of solid waste disposal include public dump
(container) (2.6%), buried by household (9.0%) and other (2.6 %).
The majority of households in the district as shown in Table 8.12 dispose of liquid waste by
either throwing onto the street/outside (44.4%) or throwing onto compound (35.3%).
Approximately 12 percent of households dispose of their liquid waste through drainage
system into a pit (soak away).
Table 8.13: Method of rubbish and liquid waste disposal by households
Method of disposal of solid and liquid waste
by household
Total
country Region
District
Number Percent Rural
Method of rubbish disposal by household
Total 5,467,054 177,629 9,199 100.0 9,199
Collected 785,889 19,758 1,025 11.1 1,025
Burned by household 584,820 44,337 2,515 27.3 2,515
Public dump (container) 1,299,654 14,057 242 2.6 242
Public dump (open space) 2,061,403 55,459 2,900 31.5 2,900
Dumped indiscriminately 498,868 25,994 1,457 15.8 1,457
Buried by household 182,615 12,201 824 9.0 824
Other 53,805 5,823 236 2.6 236
Methods of liquid waste disposal by household
Total 5,467,054 177,629 9,199 100.0 9,199
Through the sewerage system 183,169 4,062 65 0.7 65
Through drainage system into a gutter 594,404 7,676 388 4.2 388
Through drainage into a pit (soak away) 167,555 12,031 1,080 11.7 1,080
Thrown onto the street/outside 1,538,550 105,548 4,085 44.4 4,085
Thrown into gutter 1,020,096 6,029 300 3.3 300
Thrown onto compound 1,924,986 41,258 3,247 35.3 3,247
Other 38,294 1,025 34 0.4 34 Source: Ghana Statistical Service, 2010 Population and Housing Census

58
CHAPTER NINE
SUMMARY OF FINDINGS, CONCLUSION AND
POLICY IMPLICATIONS
9.1 Introduction
The Binduri District is one of the thirteen (13) districts in the Upper East Region of Ghana.
The district has a total population of 61,576. Females constitute 51.8 percent of the total
population while males constitute 48.1 percent. The district has a total land area of 391.91
square kilometres. The Binduri District Assembly is the highest political authority in the
district with the District Chief Executive leading the secretariat in implementing the decisions
of the Assembly. The district has one constituency and four Area Councils.
9.2 Summary of findings
Demographic Characteristics
The total population of the district is 61,576. More than half of the population (51.9%) are
females with 48.1 percent being males. The sex ratio for all age groups is 93. This means that
for every 100 females there are 93 males in the district. The district has a population density
of 157.1 persons per square kilometres.
The dependency ratio of the district is 108.8. This means that every 100 persons in the
working age group (15-64) cater for approximately 109 persons. Male dependency ratio is
higher (122.9) than female dependency ratio (97.3). There are 13,367 women in the
reproductive age group of 15-49 years in the district. This number represents 21.7 percent of
the total population in the district.
The district has a total fertility rate of 3.6 percent which is higher than the regional fertility
rate of 3.4 percent. It has a lower crude birth rate of 21.2 percent compared to the regional
crude birth rate of 22.7 percent. This means that even though the district registers more births
than the region as a whole, the region registers more live births than there are in the district.
Binduri District has one of the lowest numbers of household deaths (510) as compared to the
other districts in the region. The district also has one of the lowest crude death rates of 8.3.in
the region.
Only 5.1 percent of the total population of the Binduri District are migrants. The majority
(31.3%) of migrants in the district have lived for between one and four years. The majority
(1,531) of the migrant population in the district are from the Ashanti Region.
Social Characteristics
The total population of households is 60,878. Children constitute 50.5percentof this
population, while 15.1 percent are household heads. The proportion of those who are married
is 10.7 percent. The proportion of male household heads is 25.2 percent. This is higher than
the proportion of female household heads (5.7%). Like most Ghanaian communities,
extended family structure (54.4%) is dominant in Binduri District, with nuclear families
constituting 21.9 percent.

59
There are more married persons (51.0%) in the district than there are of those who have never
married (38.1%) of the total number of persons 12 years and older. The remaining 13.5
percent are made up of those who are separated, divorced, widowed or are in
informal/consensual union/living together. Persons in the age groups 40-44 years have the
highest percentage of married persons (87.1%) in the district.
Out of a total population of 61,576, 93.6 percent are Ghanaians by birth, 2.5% are Ghanaians
with dual nationality while the remaining 3.9 percent are made up of Ghanaians by
naturalisation, those of ECOWAS, non ECOWAS and other nationalities.
Christianity (Catholic, Protestants, Pentecostal/Charismatic, and Other Christian) is the
dominant religion (41.7%). Islam is the second dominant religion with a proportion of 35
percent of the total population of the district. Traditional religion has a proportion of 20.0
percent, while those without religious affiliation are 2.1 percent.
The non-literate population (23,591) is greater than the literate population (17,228).Of the
literate population, 65.8 percent can read and write English language only, 31.1 percent can
read and write English and Ghanaian language, while 2.9 percent can read and write
Ghanaian language only.
School enrolment is highest at the primary level (58.8%) and lowest at the
Vocational/Technical/Commercial level for those currently attending school. Of those who
attended school in the past, 38.6 percent reached primary level, making it the highest level of
education for majority of those who attended school in the past.
Economic Characteristics
The Binduri District has a high proportion (80.9%) of its population 15 years and older being
economically active with only 19.1 percent being economically not active. The employment
situation in the district is very good with as high as 99.1 percent being employed with less
than one percent (0.9%) being unemployed.
Agriculture is the mainstay of the economy employing as high as 84.3 percent of the
employed population. The agriculture, forestry and fishing industry has the majority of the
employed (83.9%) population 15 years and older. Majority of the employed population in the
district are self-employed, with those who have no employees constituting 65.6 percent.
The private informal sector employs 97.0 percent of the employed population making it the
major sector of employment. The Public (Government) sector employs only 2.0 percent.
Information Communication Technology
A total population of 6,797 representing (17.3%) own mobile phone in the district. More
males (25.0%) own mobile phones as compared to 10.7 percent of their female counterparts.
Only 1.1 percent of the population in the district uses the internet facility. The usage of the
facility among males is higher (1.6%) as compared to 0.6 percent by their female counterpart.
A total of (1.4%) of all households own Laptop/ Desktop computers. Female headed
household has (1.5%) as compared to 1.4 percent male of laptop/desktop ownership in the
district.

60
Disability
There are 1,732 persons with disability representing (2.8%) of the population in the district.
Disability by gender indicates that there are more males (2.9%) than female (2.7%) in the
district. The most predominant type of disability in the district is sight (41.9%) follow by
physical disability (26.3%), hearing (21.2%) and the least is other forms of disability 7.3
percent. Activity status of PWDs shows that61.4% are economically active and 38.6 percent
are economically not active. Out of these (60.3%) are employed whiles 1.1 percent are
unemployed. Over sixty six percent have never attended any form of education.
Housing Conditions
The main materials for construction of outer walls in the district are Mud brick/Earth (88.1%)
and cement block/concrete (8.3%). Main materials used for the floors of dwellings (occupied
dwellings) in the district are largely made of cement or concrete (72.2%). About one in five
(23.3%) houses has floors made of earth or mud. Main material used for the roof of buildings
in the district is metal sheets (80.5%) followed by Thatch/Palm leaves or Raffia. The least
material used for roofing is roofing tiles which accounts for less than one percent.
Over forty percent of household size of four occupies two rooms while 85.2 percent of one
member households in the district occupy one room. Flashlight is the main source of lighting
for dwellings in the district (44.0%) follow by kerosene lamp (41.0%) with 13.0 percent of
them using electricity.
The three main sources of energy used for cooking by the households are: wood (62.8%),
crop residue (26.9%), and Charcoal (5.4%) Besides these (1.9%) of the households use gas
whiles (1.5%) uses other fuel.
Majority of households in the district (50.6%) drink borehole/tube well /pump follow by
protected well (22.2%) and unprotected well 12.1 percent. Borehole (49.3%) is the main
source of water for other domestic use follow by protected well (22.4%) and unprotected well
12.0 percent. Majority of households in the district (83.7%) have no toilet facilities. The
proportion using the public toilet is 6.4% whiles 5.3 percent use pit latrine.
There are many forms of waste disposal methods in the district with public dump (open
space) accounting for (31.5%) follow by burned by the household (27.3%) whiles dump
indiscriminately and collected constitute 15.8 and 11.1 percent respectively.
9.3 Conclusion
With a total population of 61,576 and a population density of 157 km2
, the district is sparsely
populated. The female population is greater constituting 51.9 percent of the entire district
population. This explains the high sex ratio of 93. The district also has a high dependency
ratio of 109 with male dependency (109) being higher than female dependency (97.3%). The
district also has a high fertility rate of 3.6 percent and a low crude death rate of 8.3 in the
region. Migrants in the district are very few making up only 5.1 percent of the total
population.
The district has a youthful population with children constituting 50.5 percent of the entire
population. Male headed households (25.2%) are more than female headed households
(5.7%). The three major religious groups in the district are Christianity (41.7%), Islam (35%)
and Traditional Religion (20.0%). The non-literate population is higher 57.8 percent than the
literate population 42.2 percent. School attendance is highest at the primary level (58.8%).

61
A very high proportion of the population are economically active (80.3%), with less than one
percent of the employable population being unemployed. Agriculture employs a majority of
84.3 percent of the economically active population. The private informal sector employs most
workers (97.0%) with majority of them being self-employed without employees.
The (1.1%) usage of internet facility as recorded in the district is very low even though is
close to the regional average of 1.2 percent. Household ownership of laptop/desktop
computers which stands at (1.4%) though higher than the regional average of (1.3%) falls
below the national average of 7.8 percent.
Persons with disability in the district constitute 2.8 percent of the population which is lower
than the regional and the national average of 3.8 and 3.0 percent. The most common types of
disability in the district are sight, physical and hearing the average number of persons with
disability in the district is lower than that of the regional average. About 88.1 percent of the
outer walls of houses in the district are made of Mud/Mud bricks /Earth. The main source of
lighting in the district is Flash light (44.0%), Kerosene lamp (41.0%) and electricity 13.0
percent. The main source of fuel for cooking is wood (62.8%).
9.4 Policy Implications
Given the high fertility rate of 3.6 in the district, a regional fertility rate of 3.4, the 1969
National Population Policy objective of reducing population growth to 1.7% by 2000, is far
from being achieved. This therefore means that policy interventions in the areas of family
planning and girl child education should be vigorously pursued. This would reduce the
number of unplanned pregnancies as well as early births and keep girls in school in school
longer than has been the case.
Another policy objective of the National Population Policy is to ensure free and compulsory
universal basic education and encourage girls’ retention in schools. With primary enrolment
in the district reaching 58.8 percent, the School Feeding Programme, Capitation, as well as
Free School Uniforms and Textbooks programmes should be expanded and sustained. There
should also be special incentives and scholarships to promote girl child education. Policies
already formulated for the agricultural sector which are yielding positive results need to be
sustained and intensified especially in the rural districts. The programmes on subsidising
agricultural inputs should particularly be sustained to support the largely agrarian economy.
Policy programmes should also be formulated to provide financial assistance to persons in
agriculture.
The use of ICT for interaction, communication and business has become critical in this
knowledge age. Given the importance of mobile phones in community and health
development through mobile-health (m-health), government should encourage and motivate
private phone companies to expand access to mobile phones particularly in rural
communities. There should be a conscious effort to promote ICT, based on the information
available from the census data
The inclusion of disability in the 2010 PHC has provided opportunity to assess the social,
demographic and economic characteristics of PWDs. The results should inform the
development of strategies which will respond to the effective implementation of the
Disability Act in the district. The large proportion of PWDs in the district brings to bare the
need for district authorities to establish special schools and centres e.g. schools for the death
and blind which will offer them opportunities to enhance their livelihoods in these rural
settings.

62
The use of wood and charcoal as the main sources of fuel has for a bearing on the rapid
deforestation in the district. The intermittent shortages of gas and relatively high cost of the
product should be addressed to encourage more households to shift to the use of gas to help
save the environment.
The non-availability of toilet facilities in the district should be of prior concern to the
authorities, NGOs and development partners to avoid the spread of any epidemics in cases of
flooding. the health implications associated with this will have serious consequences on
people in the district. It therefore needs collaboration from all stakeholders to deal with the
problem.

63
REFERENCES
Adesanya, O. (2002) The impact of information technology on dissemination. Madu,E.C and
Dirisu, M B (Ed). Information science and technology for library schools in Africa
Ibadan: Evi-Coleman.
Arther Haupt, Thomas T.Kame and Carl Haub: UN PRBs Population hand book. UN
population Bureau.
Bawku Municipal Assembly (2010) District Medium Development Plan (2010-2013)
Binduri District Assembly (2013) Sustainable Rural Water and Sanitation Project Plan
(2013-2016).
Ghana Districts (http://kassenanankana.ghanadistricts.gov.gh/?arrow=asp&_=105)
Ghana Statistical Service, 2010 Population And Housing Census, National Analytical Report
(MAY 2013)
Ghana Statistical Service, 2010 Population and Housing Census, Regional Analytical Report,
Upper East Region (JUNE 2013)
Ghana Statistical Service, Compendium Of Statistical Standards, Variables and Concepts for
Official Statistics in Ghana (MAY 2013)
Gwillim Law (2008), Districts of Ghana {http://www.statoids.com/ygh.html}
Thioune R.M.C (2003) Information and communication technologies for development in
Africa: Opportunities and challenges for Africa development Volume 1.
Woherem, E.R (2000): Information technology in the Nigeria banking industry.Ibadan
Spectrum Books.
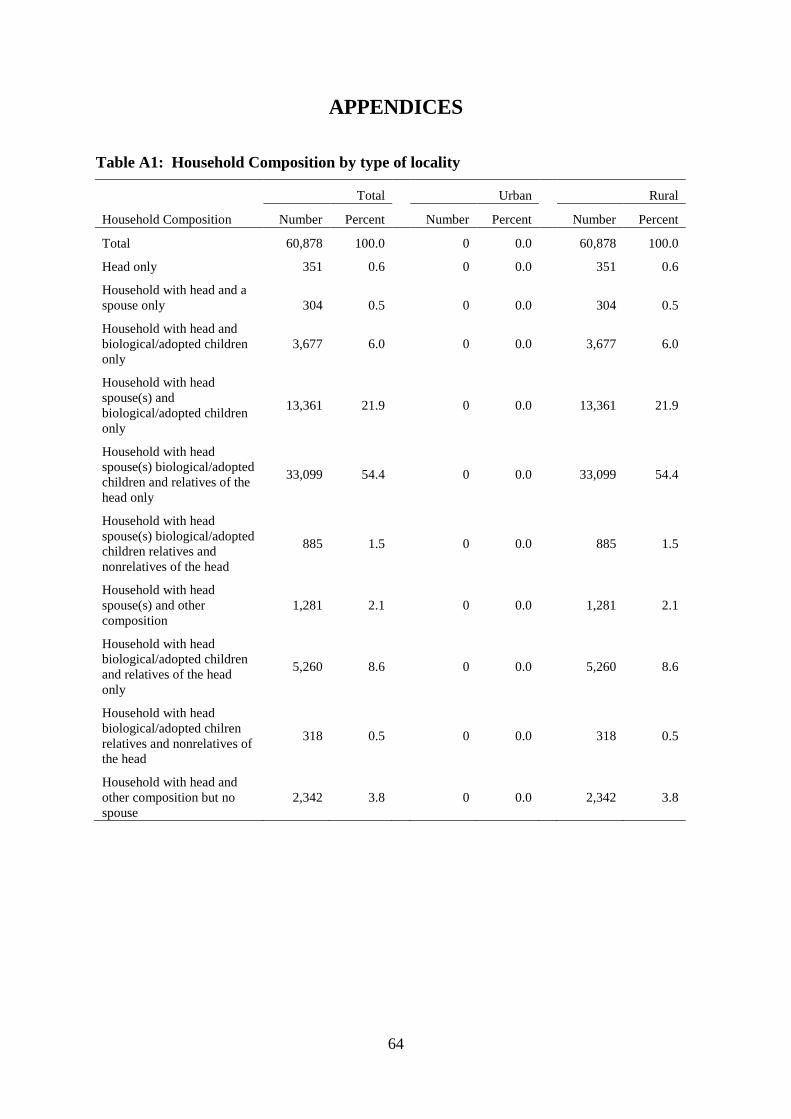
64
APPENDICES
Table A1: Household Composition by type of locality
Household Composition
Total Urban Rural
Number Percent Number Percent Number Percent
Total 60,878 100.0
0 0.0
60,878 100.0
Head only 351 0.6
0 0.0
351 0.6
Household with head and a
spouse only 304 0.5
0 0.0
304 0.5
Household with head and
biological/adopted children
only
3,677 6.0
0 0.0
3,677 6.0
Household with head
spouse(s) and
biological/adopted children
only
13,361 21.9
0 0.0
13,361 21.9
Household with head
spouse(s) biological/adopted
children and relatives of the
head only
33,099 54.4
0 0.0
33,099 54.4
Household with head
spouse(s) biological/adopted
children relatives and
nonrelatives of the head
885 1.5
0 0.0
885 1.5
Household with head
spouse(s) and other
composition
1,281 2.1
0 0.0
1,281 2.1
Household with head
biological/adopted children
and relatives of the head
only
5,260 8.6
0 0.0
5,260 8.6
Household with head
biological/adopted chilren
relatives and nonrelatives of
the head
318 0.5
0 0.0
318 0.5
Household with head and
other composition but no
spouse
2,342 3.8 0 0.0 2,342 3.8

65
Table A2: Population 3 years and older by sex, disability type and level of education
Educational level attained
Sex/Disability type Total
Never
attended Nursery
Kinder
garten Primary
Middle/
JSS/
JHS
Sec./
SSS/
SHS
Voc./
Tech./
Comm.
Post
sec
Bachelor
degree
Post graduate (Cert.
Diploma Masters
PHD etc.)
Total 56,888 28,515 1,938 2,055 15,492 5,928 2,100 194 558 97 11
No disability 55,217 27,411 1,920 2,022 15,241 5,766 2,043 182 529 92 11
With a disability 1,671 1,104 18 33 251 162 57 12 29 5 0
Sight 697 478 6 9 72 65 35 7 21 4 0
Hearing 358 244 6 7 66 28 4 1 2 0 0
Speech 212 135 4 7 39 18 5 0 3 1 0
Physical 442 312 4 7 60 44 5 4 5 1 0
Intellectual 223 159 2 2 36 16 6 0 2 0 0
Emotional 159 88 1 5 30 27 6 0 2 0 0
Other 115 71 2 4 24 9 5 0 0 0 0
Male
Total 27,247 11,571 1,033 1,073 8,349 3,254 1,355 119 405 77 11
No disability 26,413 11,078 1,023 1,052 8,200 3,158 1,319 112 385 75 11
With a disability 834 493 10 21 149 96 36 7 20 2 0
Sight 308 192 2 4 41 30 21 4 13 1 0
Hearing 175 106 3 3 42 18 1 0 2 0 0
Speech 116 64 2 5 27 11 4 0 2 1 0
Physical 220 131 3 4 36 33 4 3 5 1 0
Intellectual 119 77 2 1 21 13 3 0 2 0 0
Emotional 85 39 0 4 19 18 3 0 2 0 0
Other 71 44 2 4 12 7 2 0 0 0 0
Female
Total 29,641 16,944 905 982 7,143 2,674 745 75 153 20 0
No disability 28,804 16,333 897 970 7,041 2,608 724 70 144 17 0
With a disability 837 611 8 12 102 66 21 5 9 3 0
Sight 389 286 4 5 31 35 14 3 8 3 0
Hearing 183 138 3 4 24 10 3 1 0 0 0
Speech 96 71 2 2 12 7 1 0 1 0 0
Physical 222 181 1 3 24 11 1 1 0 0 0
Intellectual 104 82 0 1 15 3 3 0 0 0 0
Emotional 74 49 1 1 11 9 3 0 0 0 0
Other 44 27 0 0 12 2 3 0 0 0 0 Source: Ghana Statistical Service, 2010 Population and Housing Census

66
Table A3: Distribution of households engaged in tree growing or crop farming by type
of crop and population engaged
Households/ Type of crop
House-
holds
Population in occupied
units
Population engaged in
agricultural activities
Total Male Female Total Male Female
Total households in occupied units 9,199 60,878 29,275 31,603
25,986 12,305 13,681
Households engaged in agricultural
activities 8,641 58,523 28,209 30,314
25,986 12,305 13,681
Households engaged in crop
farming or tree growing 8,578 58,127 28,019 30,108
25,816 12,219 13,597
Households engaged in crop
farming 8,578 58,127 28,019 30,108
25,816 12,219 13,597
Households engaged in tree
growing 37 271 142 129
136 75 61
Agro forestry (tree planting) 37 271 142 129
136 75 61
Alligator pepper 20 165 71 94
58 30 28
Apples 13 135 66 69
40 25 15
Asian vegetables (e.g. tinda,
cauliflower) 17 167 82 85
58 29 29
Avocado 15 176 87 89
51 23 28
Banana 77 473 241 232
180 88 92
Beans 3,171 23,111 11,152 11,959
10,526 4,954 5,572
Black pepper 5 19 9 10
12 7 5
Black berries 14 138 74 64
52 25 27
Cabbage 4 30 17 13
21 13 8
Carrot 14 90 43 47
27 19 8
Cashew 9 62 35 27
26 14 12
Cassava 342 1,932 874 1,058
582 245 337
Citronella 1 6 4 2
2 1 1
Citrus 17 114 55 59
36 19 17
Cloves 1 6 4 2
1 0 1
Cocoa 278 1,574 774 800
534 266 268
Cocoyam 77 435 193 242
149 55 94
Cocoyam / Taro (kooko) 24 160 81 79
51 28 23
Coffee 6 53 26 27
13 7 6
Cola 10 92 47 45
27 10 17
Cotton 2 15 9 6
4 2 2
Cucumber 44 354 170 184
158 77 81
Egg plant 1 5 3 2
5 3 2
Garden eggs 66 494 250 244
227 114 113
Ginger 12 70 29 41
25 10 15
Groundnut 1,265 10,023 4,877 5,146
4,404 2,073 2,331
Guava 19 148 59 89
64 30 34
Kenaf 29 230 101 129
82 37 45
Lemon grass 8 44 26 18
21 12 9
Lettuce 10 70 37 33
39 23 16
Maize 6,087 43,330 20,922 22,408
19,423 9,288 10,135
Mango 49 336 161 175
173 90 83
Melon (agusi) 22 144 78 66
65 32 33
Millet 6,334 44,960 21,802 23,158
20,497 9,793 10,704
Mushroom 18 97 48 49
45 20 25
Nut meg 17 93 49 44
43 23 20

67
Table A3: Distribution of households engaged in tree growing or crop farming by type
of crop and population engaged (cont’d)
Households/ Type of crop
House-
holds
Population in occupied
units
Population engaged in
agricultural activities
Total Male Female Total Male Female
Oil palm 102 645 331 314
214 108 106
Okro 455 3,291 1,635 1,656
1,608 750 858
Onion 821 6,721 3,276 3,445
2,977 1,432 1,545
Pawpaw 5 39 18 21
14 9 5
Peas 24 175 80 95
92 42 50
Pepper 224 1,560 770 790
639 293 346
Pineapple 3 7 4 3
4 2 2
Plantain 409 2,348 1,064 1,284
703 290 413
Potatoes 47 425 206 219
230 106 124
Rice 3,859 28,016 13,395 14,621
13,038 6,006 7,032
Rubber 14 81 38 43
55 27 28
Shallot 3 18 10 8
13 7 6
Shea tree 9 53 28 25
33 17 16
Sorghum 342 2,693 1,283 1,410
1,492 729 763
Soya beans 3,028 22,129 10,644 11,485
10,326 4,800 5,526
Spinach 5 26 11 15
8 5 3
Sugarcane 1 9 4 5
3 1 2
Sun flower 26 200 95 105
93 42 51
Sweet pepper 5 43 20 23
21 9 12
Sweet potatoes 89 735 359 376
379 185 194
Tiger nut 8 47 17 30
16 8 8
Tobacco 126 1,029 507 522
476 228 248
Tomatoes 221 1,762 874 888
764 371 393
Water melon 171 1,490 735 755
677 310 367
Yam 61 400 191 209
111 50 61
Other (specify) 226 1,604 765 839 817 379 438 Source: Ghana Statistical Service, 2010 Population and Housing Census

68
Table A4: Population by sex, number of household and houses in the 20 largest
communities
S/No. Community Name Total
Sex House
holds Houses Male Female
1 Narango 3,179 1,534 1,645 536 373
2 Zorsi 3,022 1,457 1,565 466 343
3 Bazua 2,527 1,253 1,274 337 260
4 Boko 2,359 1,113 1,246 314 203
5 Binduri 2,110 995 1,115 287 212
6 Atuba 1,740 861 879 262 189
7 Aporunzua 1,441 671 770 241 194
8 Bauk Sapelliga 1,313 642 671 167 131
9 Nayoko No. 2 1,224 564 660 167 116
10 Azum Sapelliga 1,147 540 607 139 99
11 Tambugu Natinga 1,110 543 567 149 99
12 Manga 1,091 535 556 159 102
13 Kpalugu Bundure 1,058 490 568 147 92
14 Yagore 873 413 460 114 70
15 Yapala 873 435 438 123 100
16 Tandienabug 856 383 473 111 77
17 Ninsako 799 406 393 106 68
18 Kukparigu-Temgpelug 760 345 415 200 83
19 Tempelim Zulugo 760 370 390 100 59
20 Kukparigu 748 335 413 146 77 Source: Ghana Statistical Service, 2010 Population and Housing Census

69
Table A5: Population by age group in the 20 largest communities
S/No. Community Name
All
ages
Age group
0-4 5-9 10-14 15-19 20-24 25-29 30-34 35-39 40-44 45-49 50-54 55-59 60-64 65-69 70-74 75+
1 Narango 3,179 399 488 450 297 255 157 142 169 134 112 141 83 76 54 84 138
2 Zorsi 3,022 414 453 416 360 223 173 144 146 129 108 80 63 71 68 62 112
3 Bazua 2,527 344 394 341 280 190 129 153 115 110 80 88 49 71 30 54 99
4 Boko 2,359 347 364 322 282 168 154 111 118 96 69 55 42 58 36 61 76
5 Binduri 2,110 327 338 288 213 146 107 121 91 75 58 63 38 58 26 73 88
6 Atuba 1,740 310 298 225 157 98 94 81 81 82 71 63 30 46 31 38 35
7 Aporunzua 1,441 171 225 201 167 123 101 66 81 64 51 58 26 35 15 19 38
8 Bauk Sapelliga 1,313 187 216 176 152 90 81 64 60 50 47 27 33 34 21 31 44
9 Nayoko No. 2 1,224 205 178 161 140 107 58 50 49 49 42 33 22 29 30 43 28
10 Azum Sapelliga 1,147 181 201 136 131 66 59 50 55 39 35 40 25 30 20 21 58
11 Tambugu Natinga 1,110 164 197 150 97 59 79 56 50 32 48 58 19 31 20 23 27
12 Manga 1,091 164 182 146 131 83 62 47 45 41 36 29 22 24 18 19 42
13 Kpalugu Bundure 1,058 158 174 145 116 77 61 45 48 40 42 27 12 21 13 24 55
14 Yagore 873 124 126 119 85 58 60 47 50 43 34 27 13 22 16 26 23
15 Yapala 873 140 143 116 116 54 30 21 40 42 21 45 14 32 6 25 28
16 Tandienabug 856 110 176 134 99 25 28 33 48 30 33 26 17 32 12 17 36
17 Ninsako 799 124 127 117 100 44 30 33 28 33 23 28 23 20 14 20 35
18
Kukparigu-
Temgpelug 760 90 86 84 95 79 56 51 37 38 37 27 24 12 11 17 16
19 Tempelim Zulugo 760 102 125 90 94 54 50 30 40 40 32 26 17 16 18 16 10
20 Kukparigu 748 92 98 101 92 73 56 45 34 32 28 31 14 11 12 9 20 Source: Ghana Statistical Service, 2010 Population and Housing Census

70
LIST OF CONTRIBUTORS
Project Secretariat
Dr. Philomena Nyarko, Government Statistician
Mr. Baah Wadieh, Deputy Government Statistician
Mr. David Yenukwa Kombat, Acting Census Coordinator
Mr. Sylvester Gyamfi, DISDAP Project Coordinator
Mrs. Abena A. Osei-Akoto, Data Processing
Mr. Rochester Appiah Kubi Boateng, Data Processing
Mrs. Jacqueline Anum, Data Processing
Mrs. Samilia Mintah, Data Processing
Mr. Yaw Misefa, Data Processing
Mr. Ernest Enyan, Data Processing
Mr. Festus Manu, Regional Statistician
Ms. Hanna Frempong Konadu, Formatting/Typesetting
Mrs. Hellen Ayitevie, Formatting/Typesetting
Ms. Georgina Anagli, Formatting/Typesetting
Writers
Franklin Y. Wailer
Michael Sampa Boateng
Consultant
Dr. Sylvester Galaa
Editor/ Reviewers
Prof. Kwabena Asomanin Anaman
John Foster Agyaho