Embed Size (px)
Citation preview
Phase EquilibriumPhase Equilibrium
Phase RulePhase Rule
Phase DiagramPhase Diagram
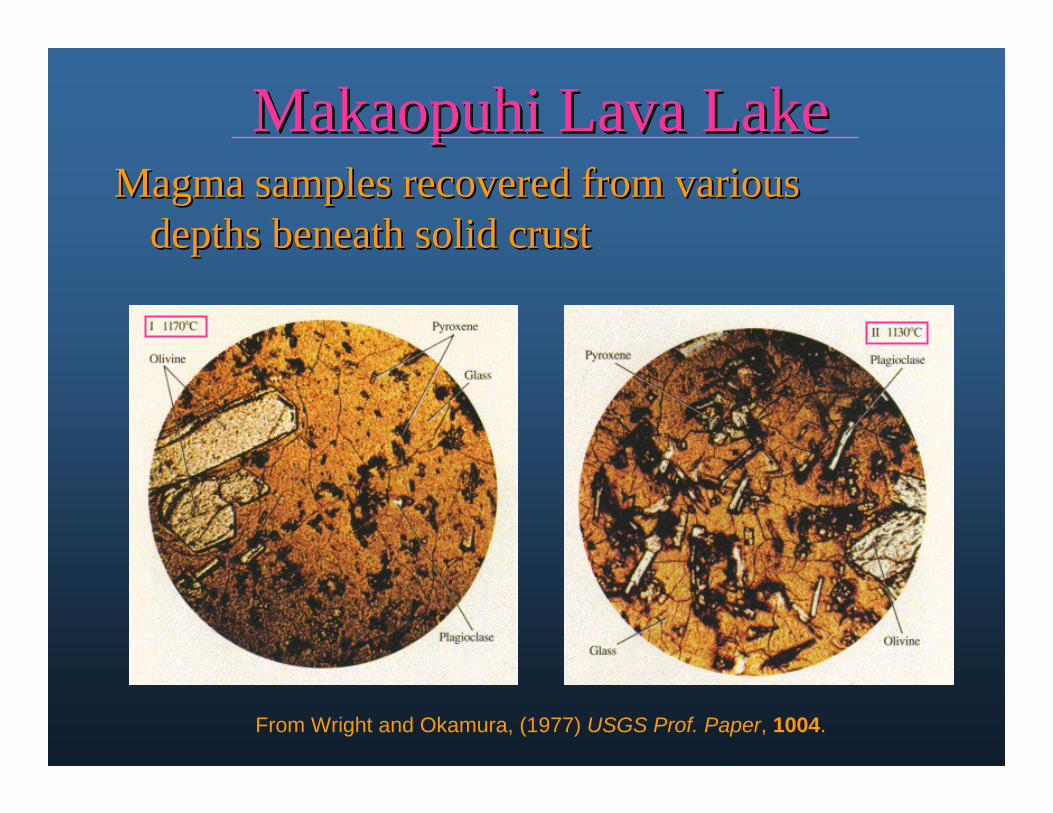
MakaopuhiMakaopuhi Lava LakeLava LakeMagma samples recovered from various Magma samples recovered from various
depths beneath solid crustdepths beneath solid crust
From Wright and Okamura, (1977) USGS Prof. Paper, 1004.
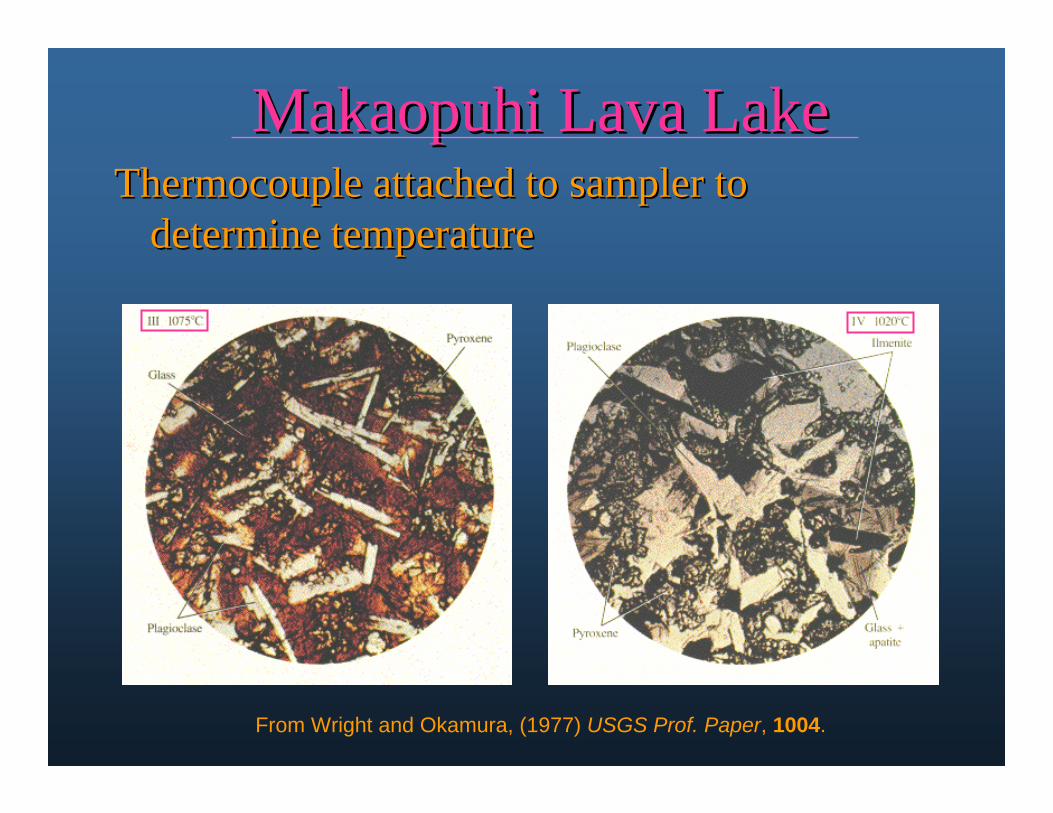
Thermocouple attached to sampler to Thermocouple attached to sampler to determine temperaturedetermine temperature
MakaopuhiMakaopuhi Lava LakeLava Lake
From Wright and Okamura, (1977) USGS Prof. Paper, 1004.
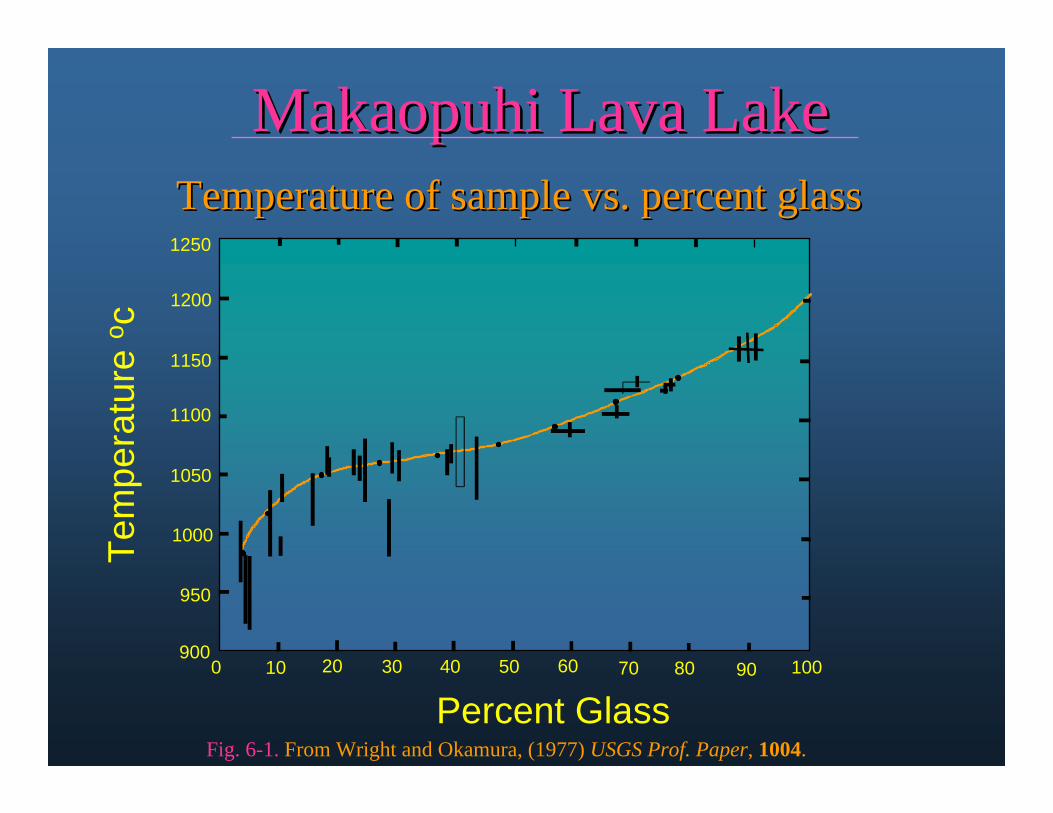
Temperature of sample vs. percent glassTemperature of sample vs. percent glass
10090706050403020100
Percent Glass
900
950
1000
1050
1100
1150
1200
1250
Tem
pera
ture
o c
80
MakaopuhiMakaopuhi Lava LakeLava Lake
Fig. 6-1. From Wright and Okamura, (1977) USGS Prof. Paper, 1004.

Minerals that form during crystallizationMinerals that form during crystallization1250
1200
1150
1100
1050
1000
9500 0 0 010 10 20 10 102030 40 3050 40 50
Liquidus
MeltCrust
Solidus
Olivine Clinopyroxene Plagioclase OpaqueTe
mpe
ratu
re o C
olivine decreases
below 1175oC
MakaopuhiMakaopuhi Lava LakeLava Lake
Fig. 6-2. From Wright and Okamura, (1977) USGS Prof. Paper, 1004.
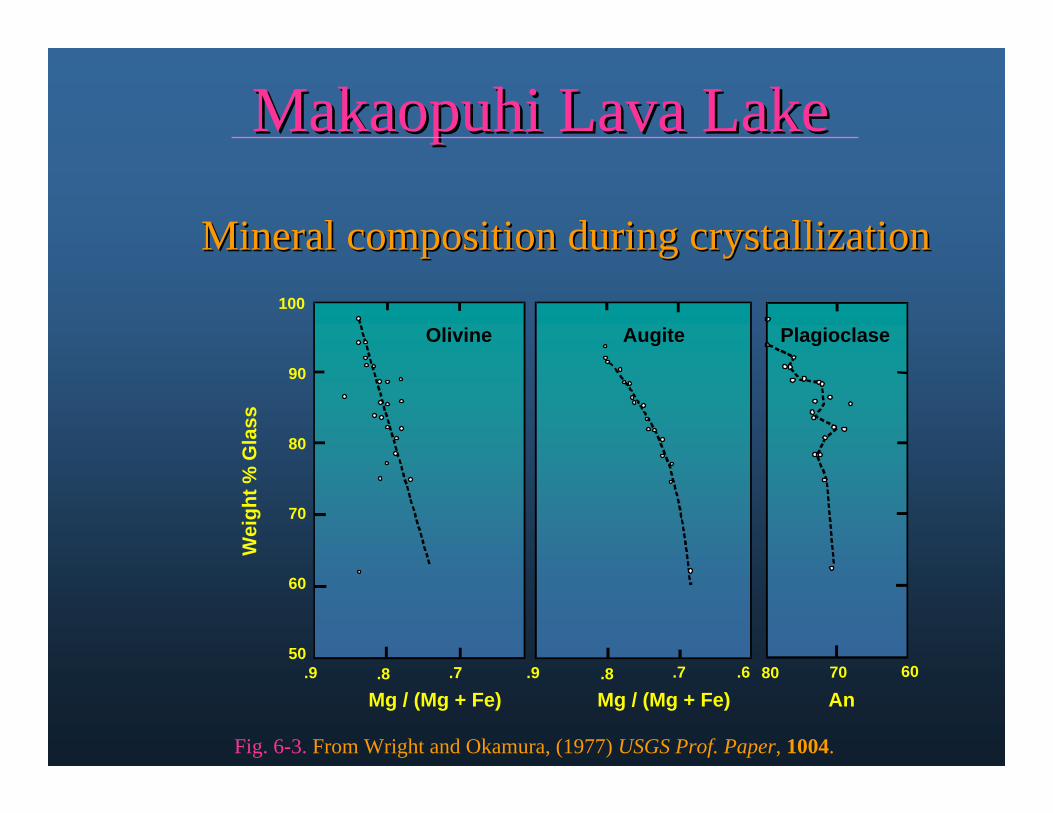
Mineral composition during crystallizationMineral composition during crystallization100
90
80
70
60
50.7.8.9 .9 .8 .7 .6 80 70 60
AnMg / (Mg + Fe)
Wei
ght %
Gla
ss
Olivine Augite Plagioclase
Mg / (Mg + Fe)
MakaopuhiMakaopuhi Lava LakeLava Lake
Fig. 6-3. From Wright and Okamura, (1977) USGS Prof. Paper, 1004.
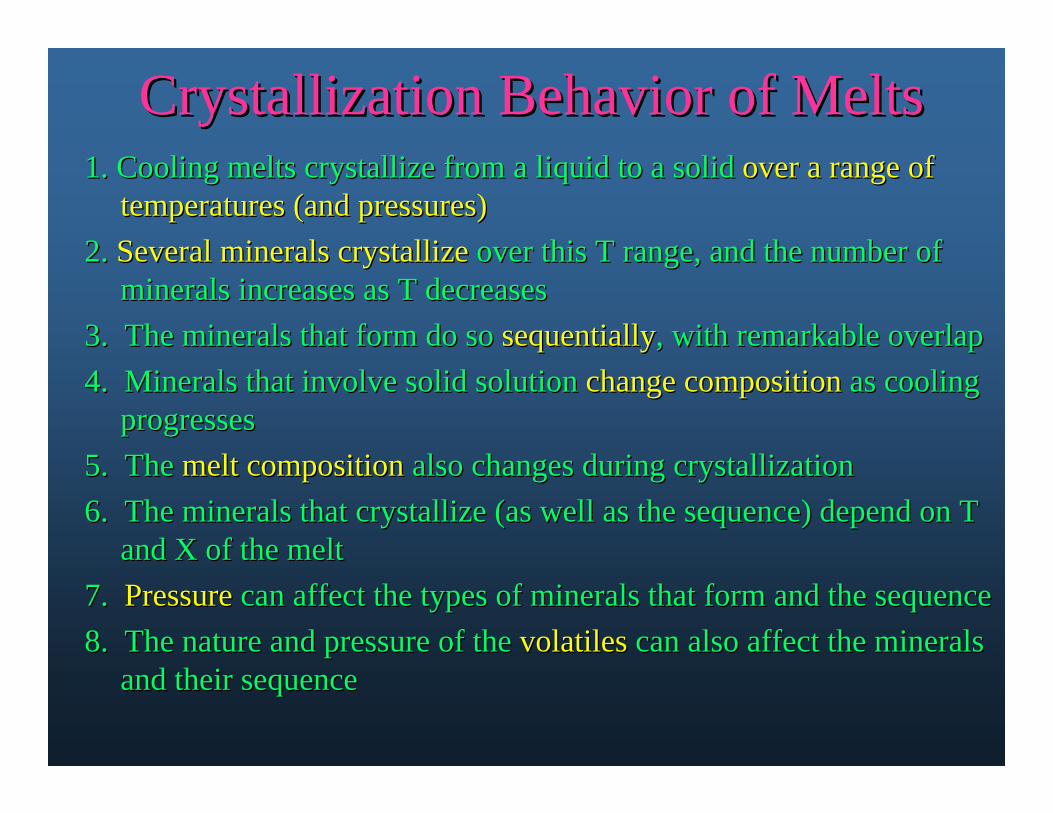
Crystallization Behavior of MeltsCrystallization Behavior of Melts1. Cooling melts crystallize from a liquid to a solid 1. Cooling melts crystallize from a liquid to a solid over a range of over a range of
temperatures (and pressures)temperatures (and pressures)2. 2. Several minerals crystallizeSeveral minerals crystallize over this T range, and the number of over this T range, and the number of
minerals increases as T decreasesminerals increases as T decreases3. The minerals that form do so 3. The minerals that form do so sequentiallysequentially, with remarkable overlap, with remarkable overlap4. Minerals that involve solid solution 4. Minerals that involve solid solution change compositionchange composition as cooling as cooling
progressesprogresses5. The 5. The melt compositionmelt composition also changes during crystallizationalso changes during crystallization6. The minerals that crystallize (as well as the sequence) depe6. The minerals that crystallize (as well as the sequence) depend on T nd on T
and X of the meltand X of the melt7. 7. PressurePressure can affect the types of minerals that form and the sequencecan affect the types of minerals that form and the sequence8. The nature and pressure of the 8. The nature and pressure of the volatilesvolatiles can also affect the minerals can also affect the minerals
and their sequenceand their sequence
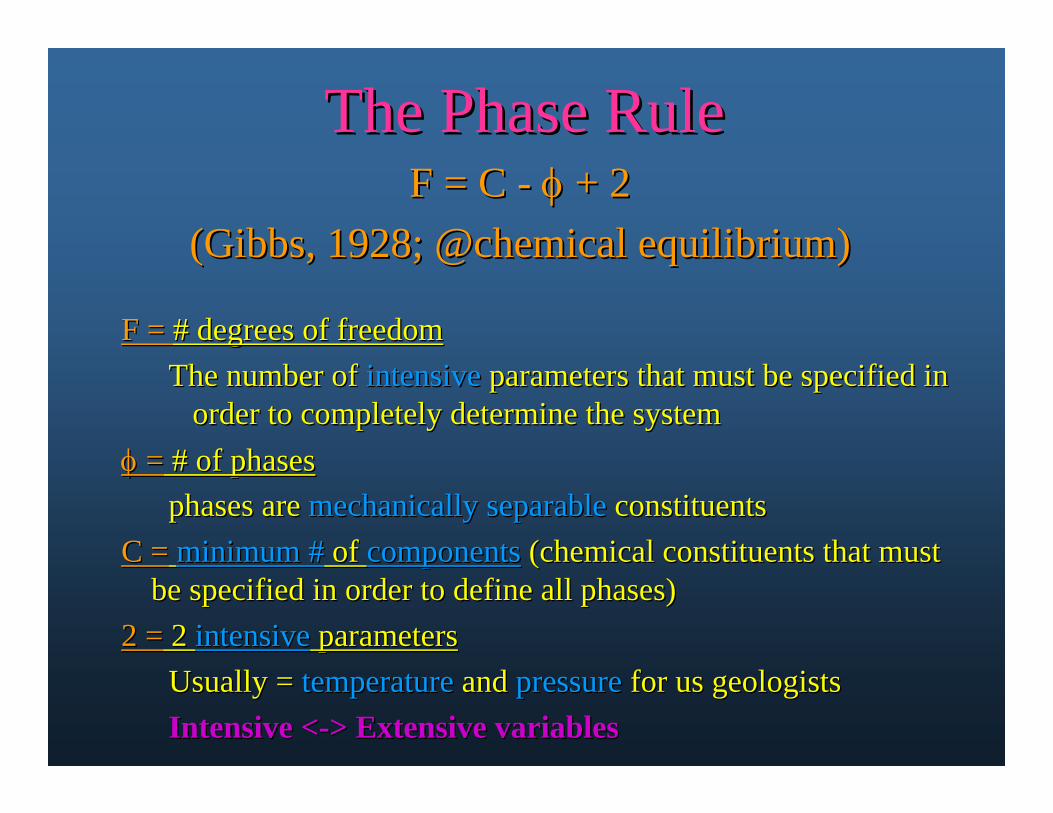
The Phase RuleThe Phase RuleF = C F = C -- + 2+ 2
(Gibbs, 1928; @chemical equilibrium)(Gibbs, 1928; @chemical equilibrium)
F = F = # degrees of freedom# degrees of freedomThe number of The number of intensiveintensive parameters that must be specified in parameters that must be specified in
order to completely determine the systemorder to completely determine the system == # of phases# of phases
phases arephases are mechanically separablemechanically separable constituentsconstituentsC =C = minimum #minimum # of of componentscomponents (chemical constituents that must (chemical constituents that must
be specified in order to define all phases)be specified in order to define all phases)2 =2 = 2 2 intensiveintensive parametersparameters
Usually = Usually = temperaturetemperature and and pressurepressure for us geologistsfor us geologistsIntensive <Intensive <--> Extensive variables> Extensive variables
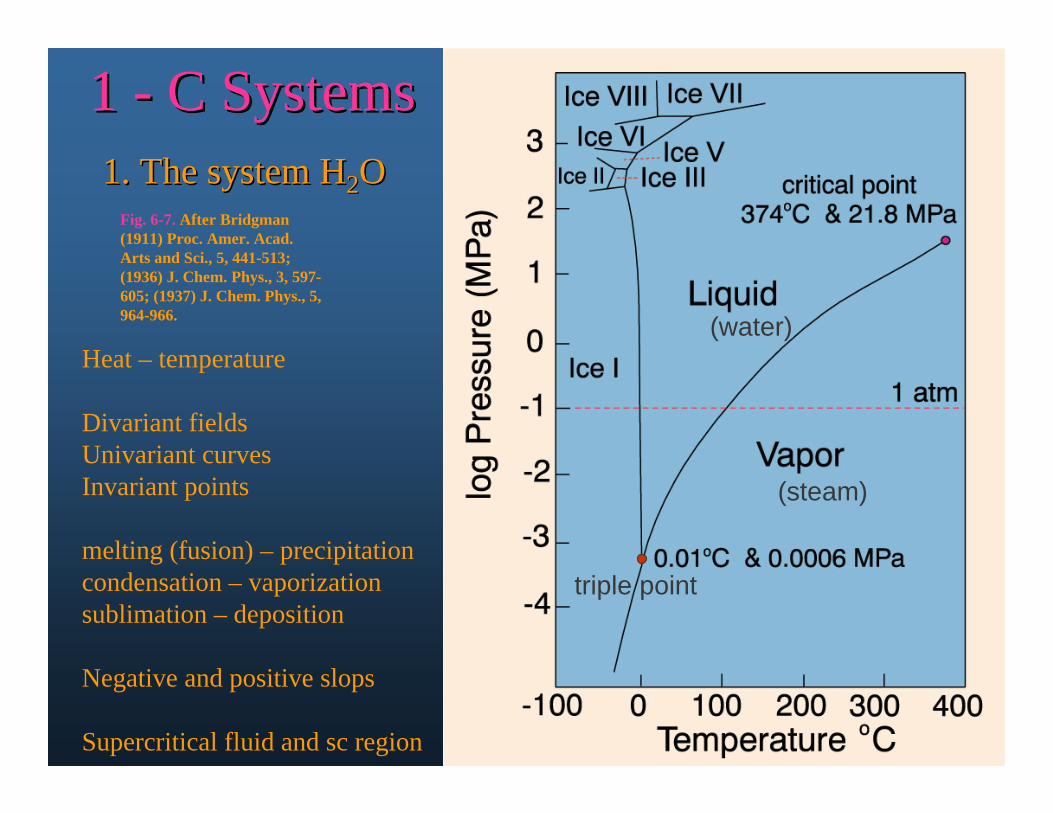
1 1 -- C SystemsC Systems1. The system H1. The system H22OO
Fig. 6-7. After Bridgman (1911) Proc. Amer. Acad. Arts and Sci., 5, 441-513; (1936) J. Chem. Phys., 3, 597-605; (1937) J. Chem. Phys., 5, 964-966.
triple point
Heat – temperature
Divariant fieldsUnivariant curvesInvariant points
melting (fusion) – precipitationcondensation – vaporizationsublimation – deposition
Negative and positive slops
Supercritical fluid and sc region
(water)
(steam)
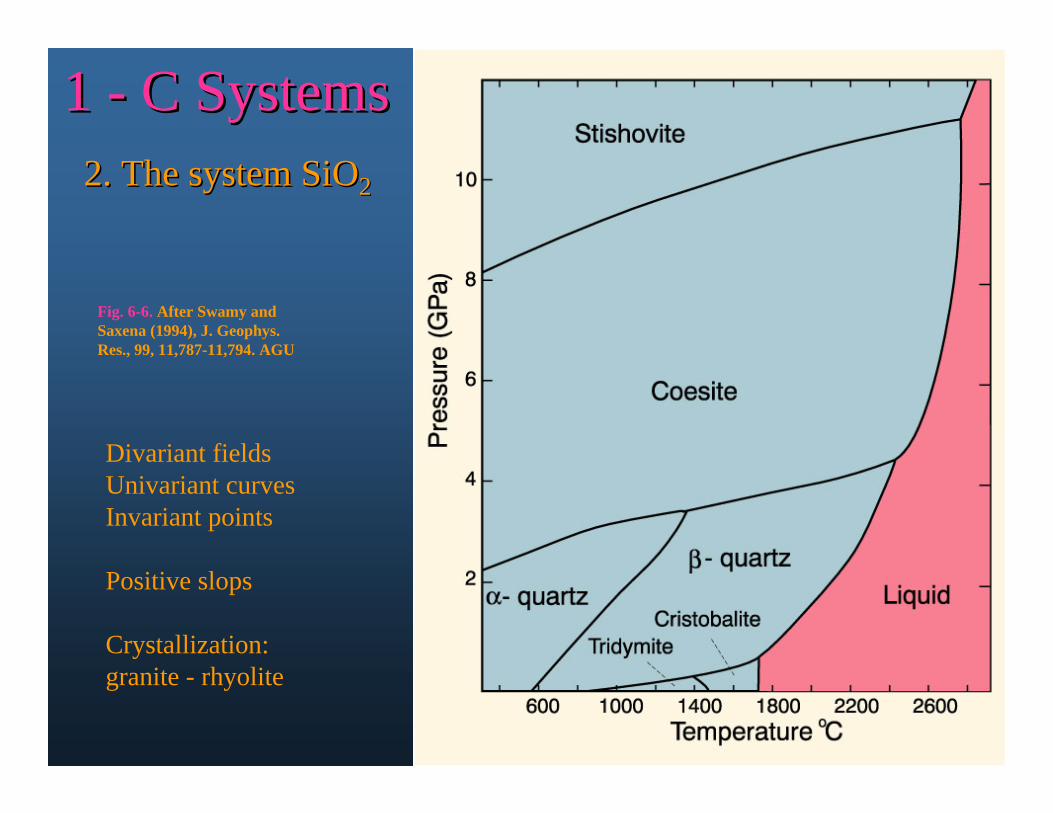
1 1 -- C SystemsC Systems2. The system SiO2. The system SiO22
Fig. 6-6. After Swamy and Saxena (1994), J. Geophys. Res., 99, 11,787-11,794. AGU
Divariant fieldsUnivariant curvesInvariant points
Positive slops
Crystallization:granite - rhyolite
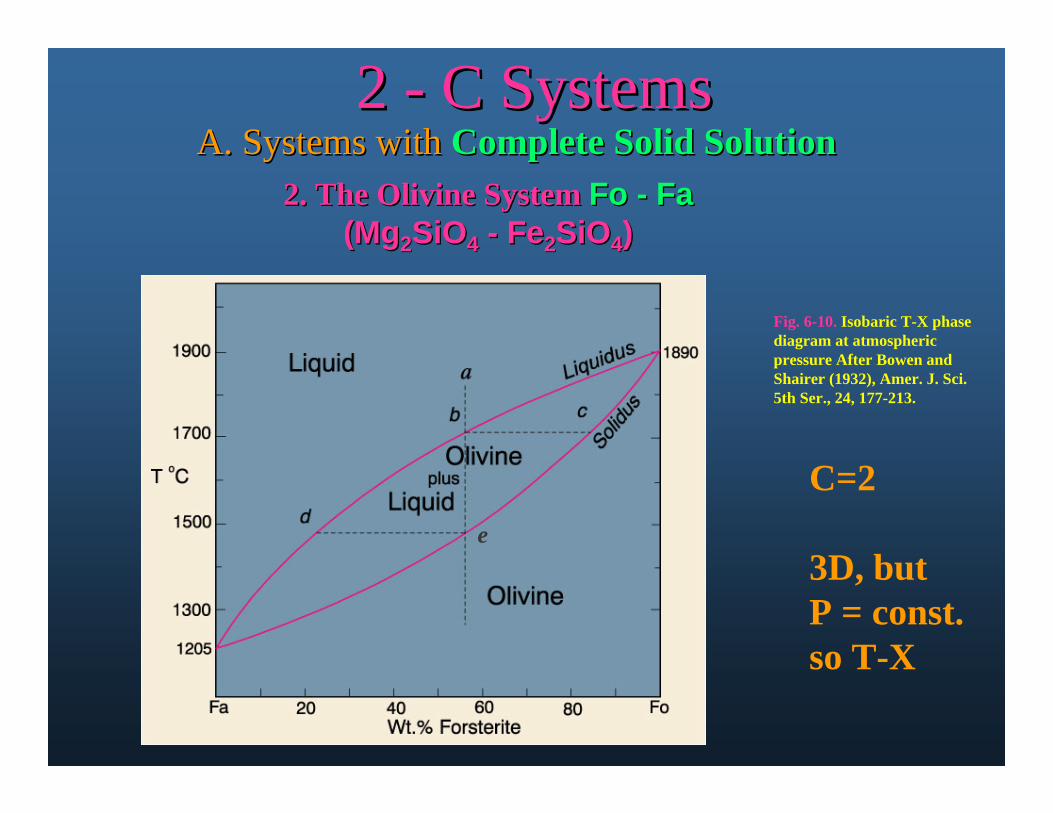
2. The Olivine System 2. The Olivine System FoFo -- FaFa(Mg(Mg22SiOSiO44 -- FeFe22SiOSiO44))
Fig. 6-10. Isobaric T-X phase diagram at atmospheric pressure After Bowen and Shairer (1932), Amer. J. Sci. 5th Ser., 24, 177-213.
2 2 -- C SystemsC SystemsA. Systems with A. Systems with Complete Solid SolutionComplete Solid Solution
C=2
3D, but P = const.so T-X
e
OlivineOlivine
Liquid
LiquidLiquid
plus
Olivine
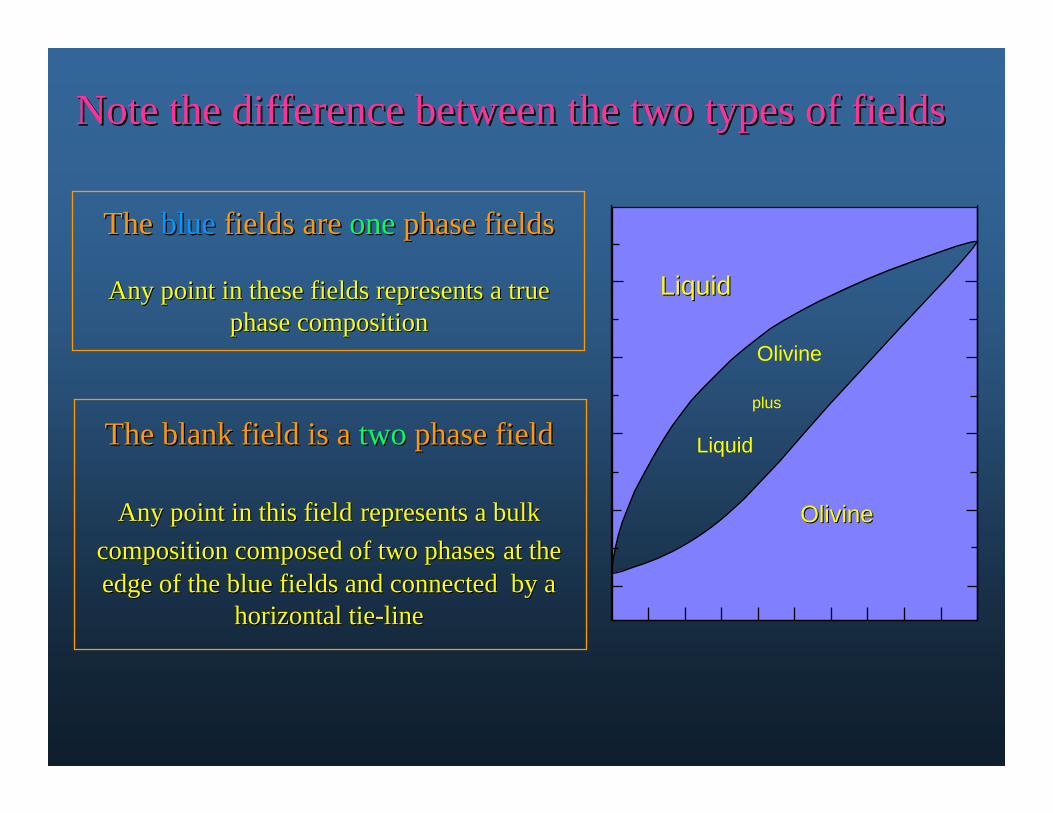
Note the difference between the two types of fieldsNote the difference between the two types of fields
The The blueblue fields are fields are oneone phase fieldsphase fields
Any point in these fields represents a true Any point in these fields represents a true phase compositionphase composition
The blank field is a The blank field is a twotwo phase fieldphase field
Any point in this fieldAny point in this field represents a bulk represents a bulk composition composed of two phasescomposition composed of two phases at the at the edge of the blue fields and connected by a edge of the blue fields and connected by a
horizontal tiehorizontal tie--lineline
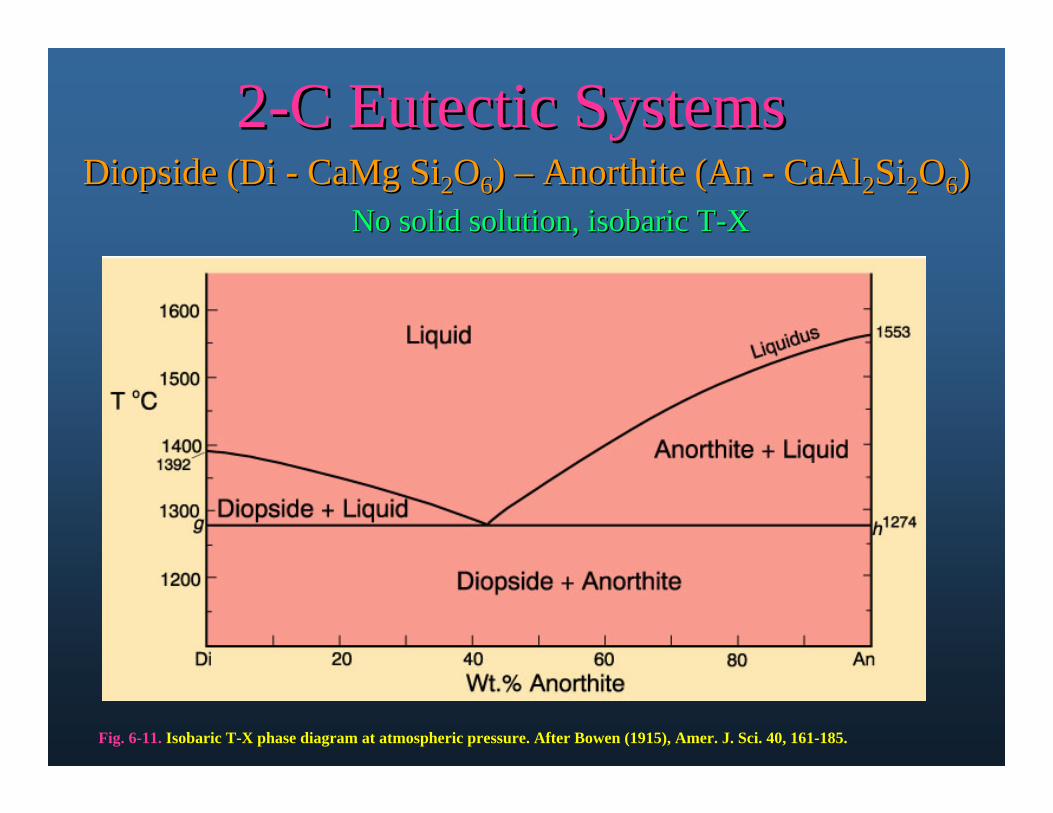
22--C Eutectic SystemsC Eutectic SystemsDiopside (Di Diopside (Di -- CaMgCaMg SiSi22OO66) ) –– Anorthite (An Anorthite (An -- CaAlCaAl22SiSi22OO66) )
No solid solution, isobaric TNo solid solution, isobaric T--XX
Fig. 6-11. Isobaric T-X phase diagram at atmospheric pressure. After Bowen (1915), Amer. J. Sci. 40, 161-185.
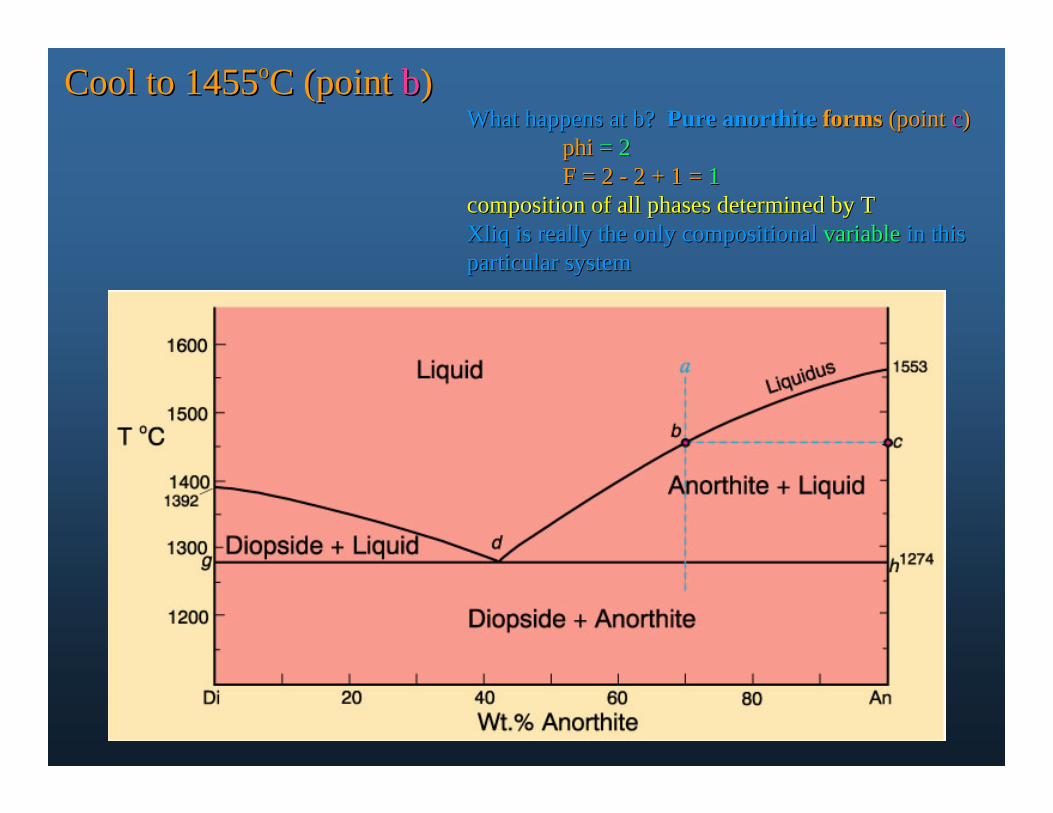
Cool to 1455Cool to 1455ooC (point C (point bb))What happens at b? What happens at b? Pure Pure anorthiteanorthite formsforms (point (point cc))
phiphi = 2= 2F = 2 F = 2 -- 2 + 1 = 2 + 1 = 11
composition of all phases determined by Tcomposition of all phases determined by TXliqXliq is really the only compositional is really the only compositional variablevariable in this in this particular systemparticular system
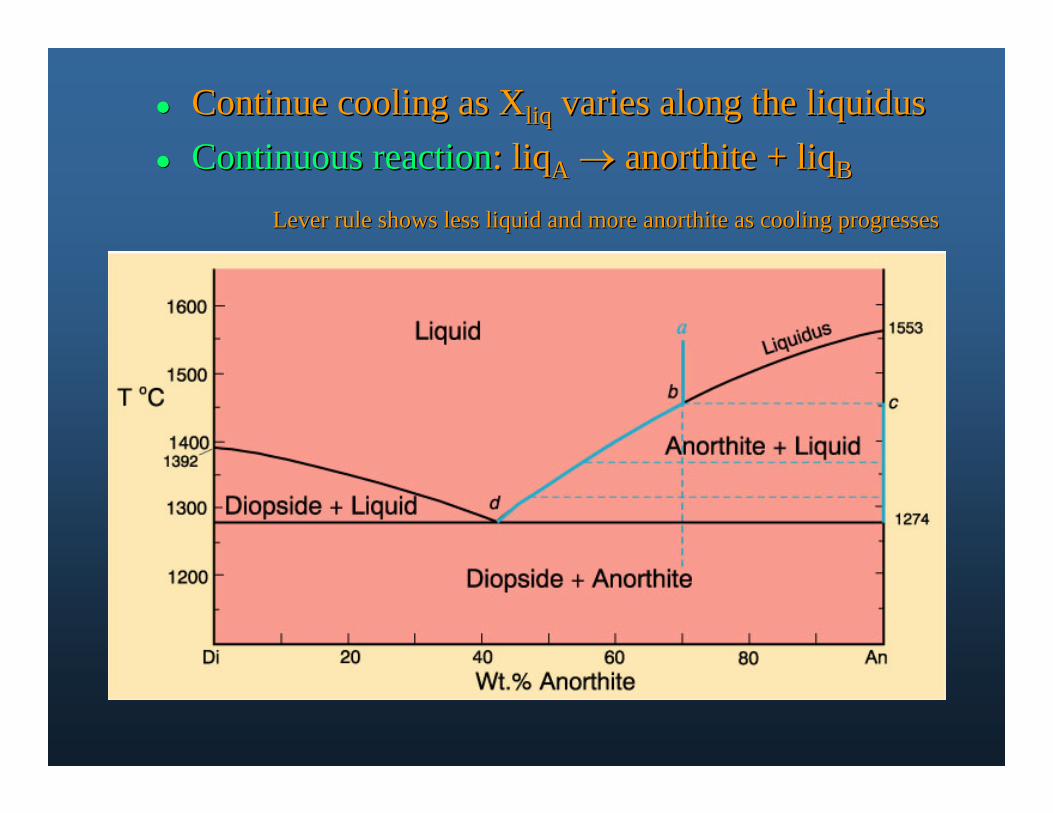
Continue cooling as Continue cooling as XXliqliq varies along the liquidusvaries along the liquidus Continuous reactionContinuous reaction: : liqliqAA anorthite + anorthite + liqliqBB
Lever rule shows less liquid and more Lever rule shows less liquid and more anorthiteanorthite as cooling progressesas cooling progresses
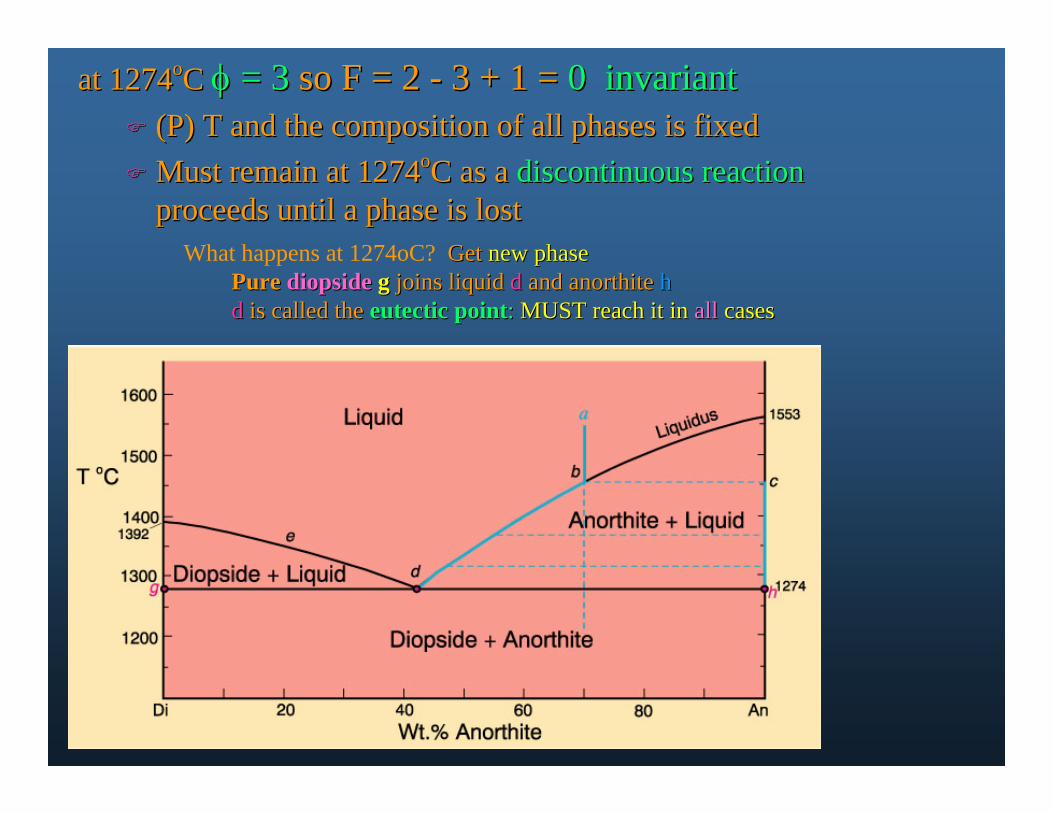
at 1274at 1274ooC C = 3= 3 so F = 2 so F = 2 -- 3 + 1 = 3 + 1 = 0 invariant0 invariant (P) T and the composition of all phases is fixed(P) T and the composition of all phases is fixed Must remain at 1274Must remain at 1274ooC as a C as a discontinuous reactiondiscontinuous reaction
proceeds until a phase is lostproceeds until a phase is lostWhat happens at 1274oC? Get Get new phasenew phase
Pure Pure diopsidediopside gg joins liquid joins liquid dd and and anorthiteanorthite hhdd is called the is called the eutectic pointeutectic point: : MUST reach it in MUST reach it in allall casescases

Note the following:Note the following:1.1. The melt crystallizes over a T range up to ~280The melt crystallizes over a T range up to ~280ooCC2.2. A sequence of minerals forms over this intervalA sequence of minerals forms over this interval
-- And the number of minerals increases as T dropsAnd the number of minerals increases as T drops6.6. The minerals that crystallize depend upon TThe minerals that crystallize depend upon T
-- The sequence changes with the bulk compositionThe sequence changes with the bulk composition
#s are listed#s are listedpoints in textpoints in text
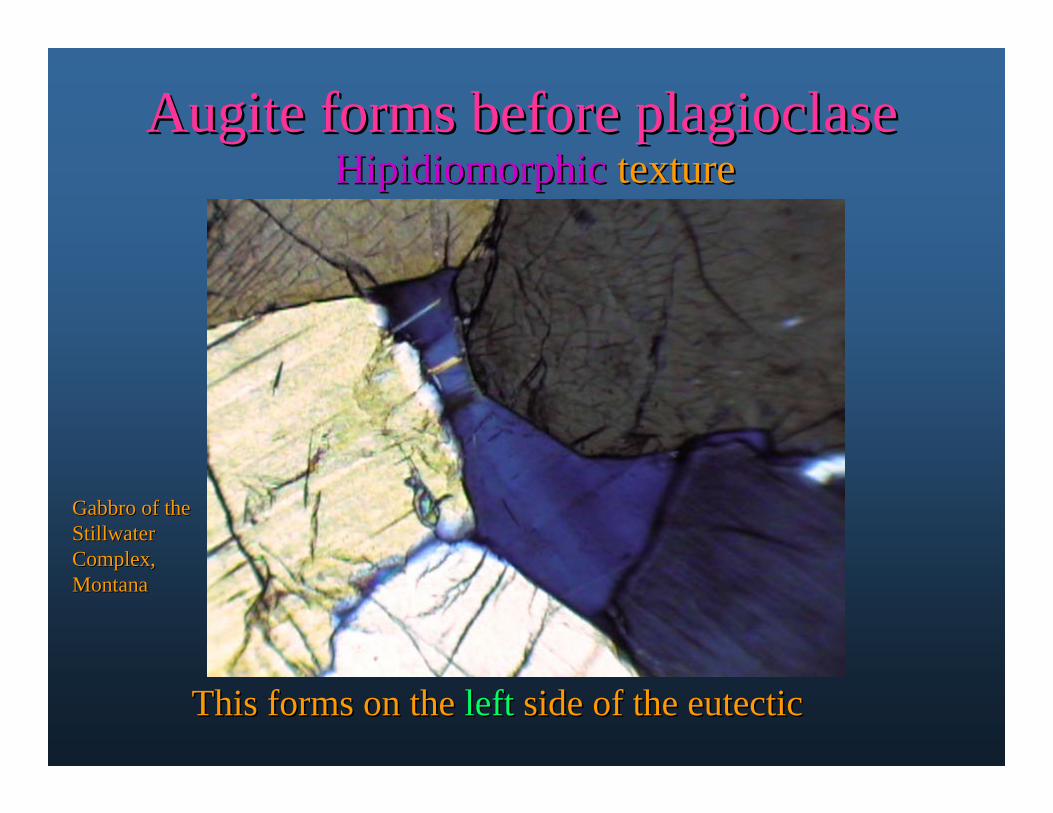
Augite forms before plagioclaseAugite forms before plagioclase
This forms on the This forms on the leftleft side of the eutecticside of the eutectic
Gabbro of the Gabbro of the Stillwater Stillwater Complex, Complex, MontanaMontana
HipidiomorphicHipidiomorphic texturetexture
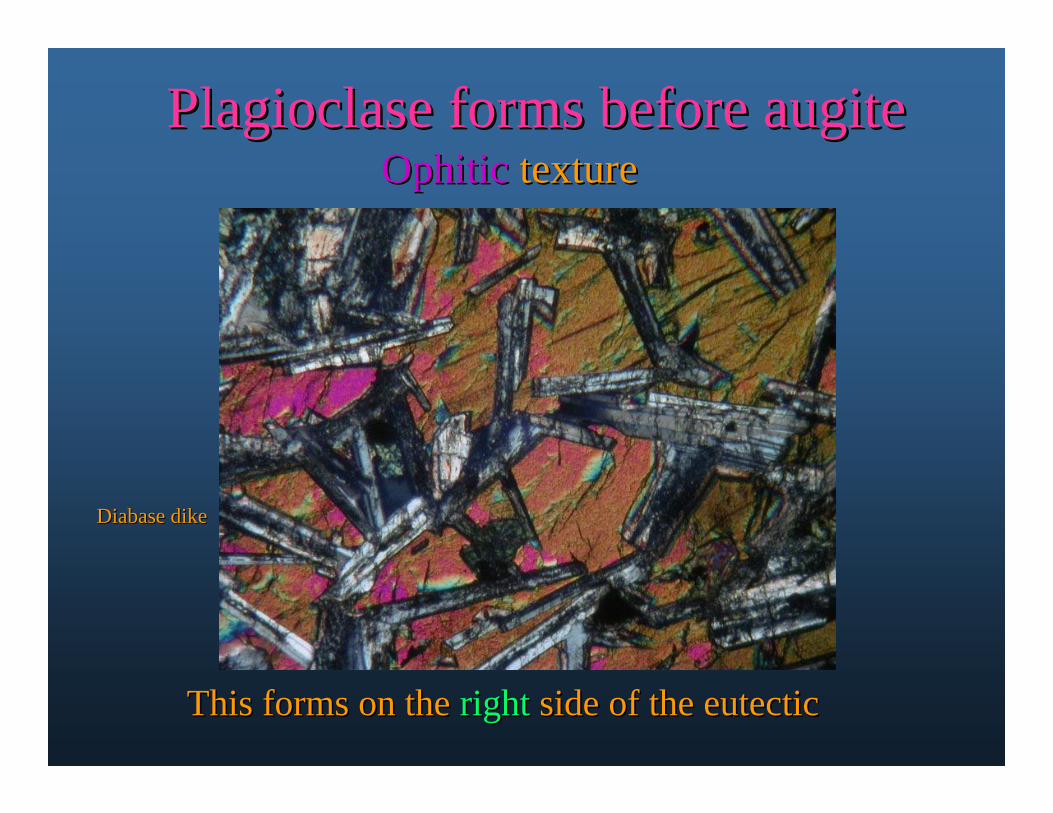
Plagioclase forms before augitePlagioclase forms before augite
This forms on the This forms on the rightright side of the eutecticside of the eutectic
OphiticOphitic texturetexture
Diabase dikeDiabase dike
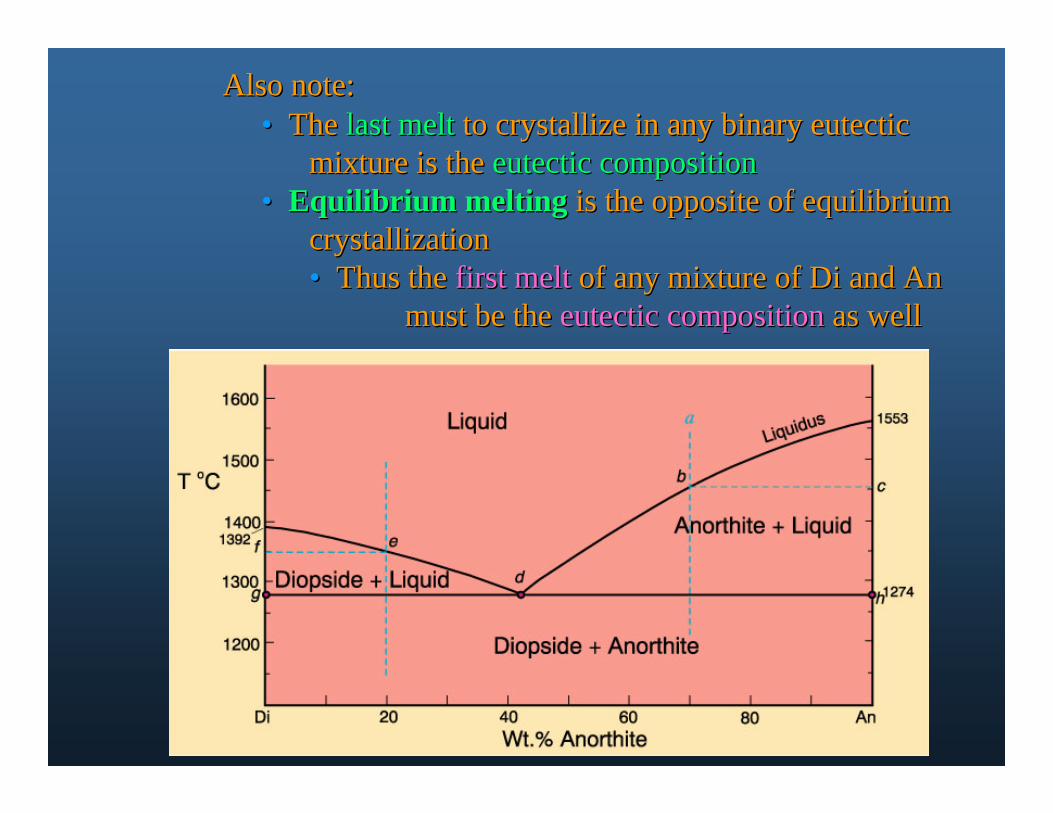
Also note:Also note:•• The The last meltlast melt to crystallize in any binary eutectic to crystallize in any binary eutectic
mixture is the mixture is the eutectic compositioneutectic composition•• Equilibrium meltingEquilibrium melting is the opposite of equilibrium is the opposite of equilibrium
crystallizationcrystallization•• Thus the Thus the first meltfirst melt of any mixture of Di and Anof any mixture of Di and An
must be the must be the eutectic compositioneutectic composition as wellas well
Eutectic systemEutectic system
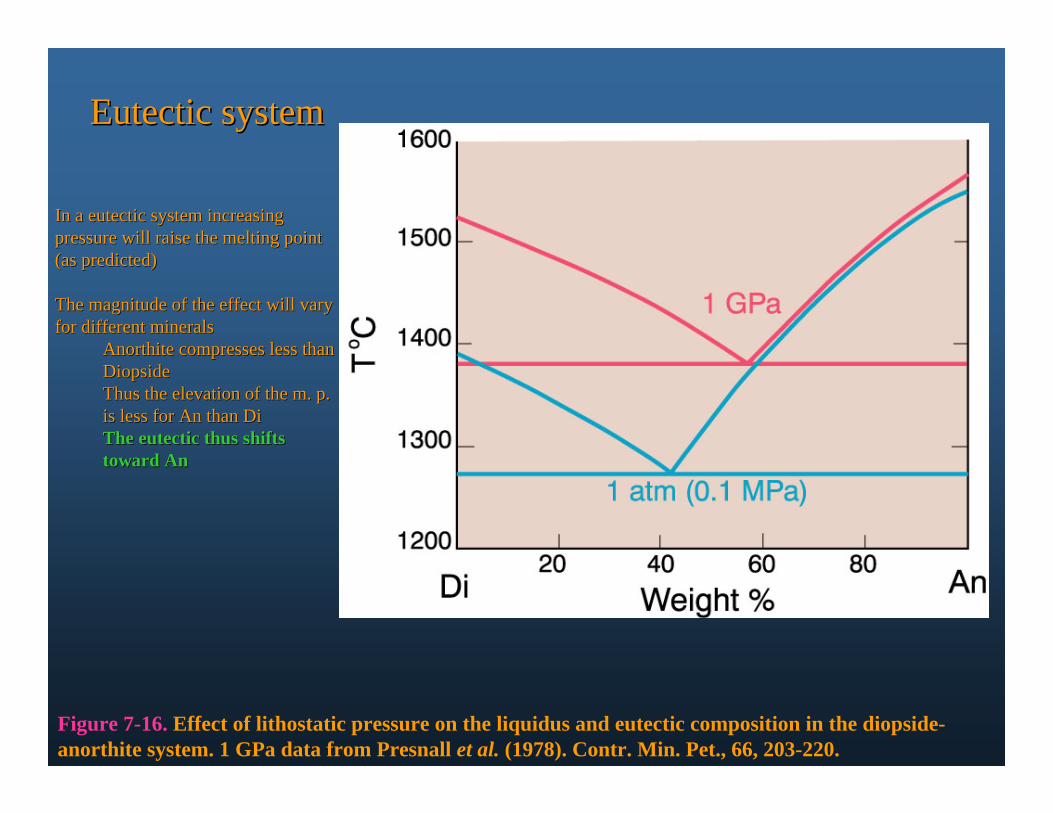
Figure 7-16. Effect of lithostatic pressure on the liquidus and eutectic composition in the diopside-anorthite system. 1 GPa data from Presnall et al. (1978). Contr. Min. Pet., 66, 203-220.
In a eutectic system increasing In a eutectic system increasing pressure will raise the melting point pressure will raise the melting point (as predicted)(as predicted)
The magnitude of the effect will vary The magnitude of the effect will vary for different minerals for different minerals
AnorthiteAnorthite compresses less than compresses less than DiopsideDiopsideThus the elevation of the m. p. Thus the elevation of the m. p. is less for An than Diis less for An than DiThe eutectic thus shifts The eutectic thus shifts toward Antoward An
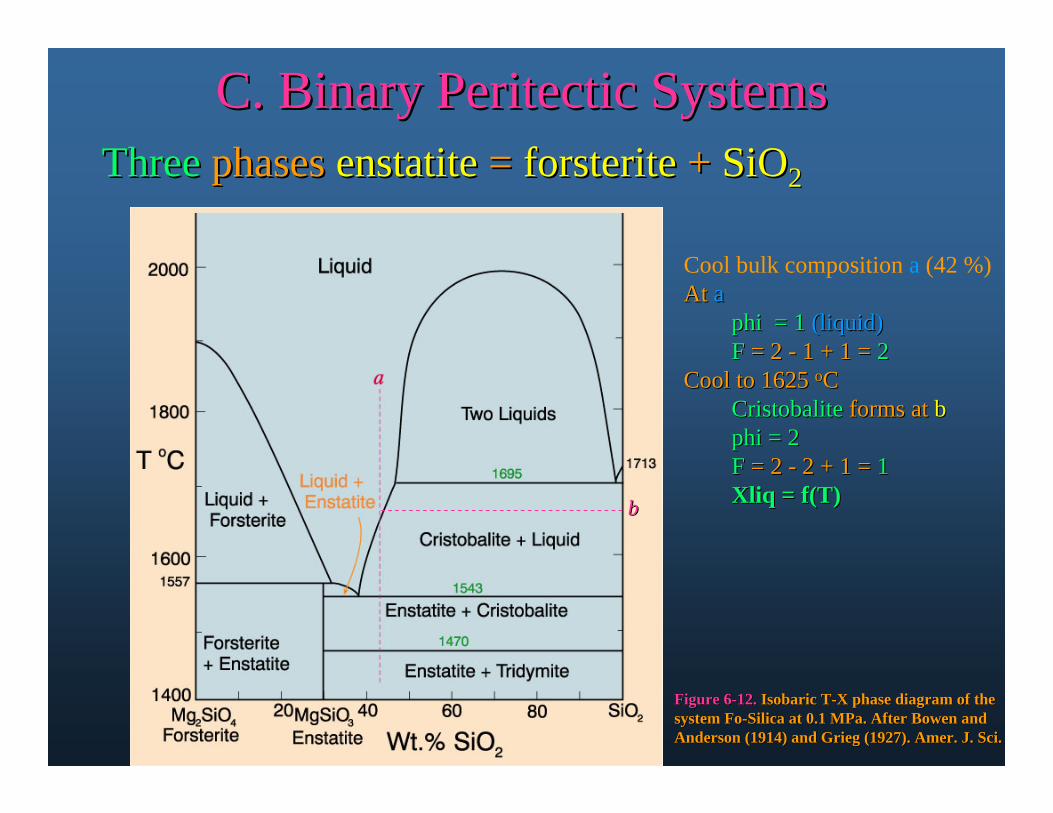
C. Binary Peritectic SystemsC. Binary Peritectic SystemsThreeThree phases phases enstatiteenstatite = = forsteriteforsterite + + SiOSiO22
Figure 6Figure 6--12. 12. Isobaric TIsobaric T--X phase diagram of the X phase diagram of the system Fosystem Fo--Silica at 0.1 MPa. After Bowen and Silica at 0.1 MPa. After Bowen and Anderson (1914) and Grieg (1927).Anderson (1914) and Grieg (1927). Amer. J. Sci.Amer. J. Sci.
Cool bulk composition a (42 %)At At aa
phi = 1 phi = 1 (liquid)(liquid)FF = 2 = 2 -- 1 + 1 = 1 + 1 = 22
Cool to 1625 Cool to 1625 ooCCCristobaliteCristobalite forms at forms at bbphi = 2phi = 2FF = 2 = 2 -- 2 + 1 = 2 + 1 = 11XliqXliq = = f(Tf(T))bb
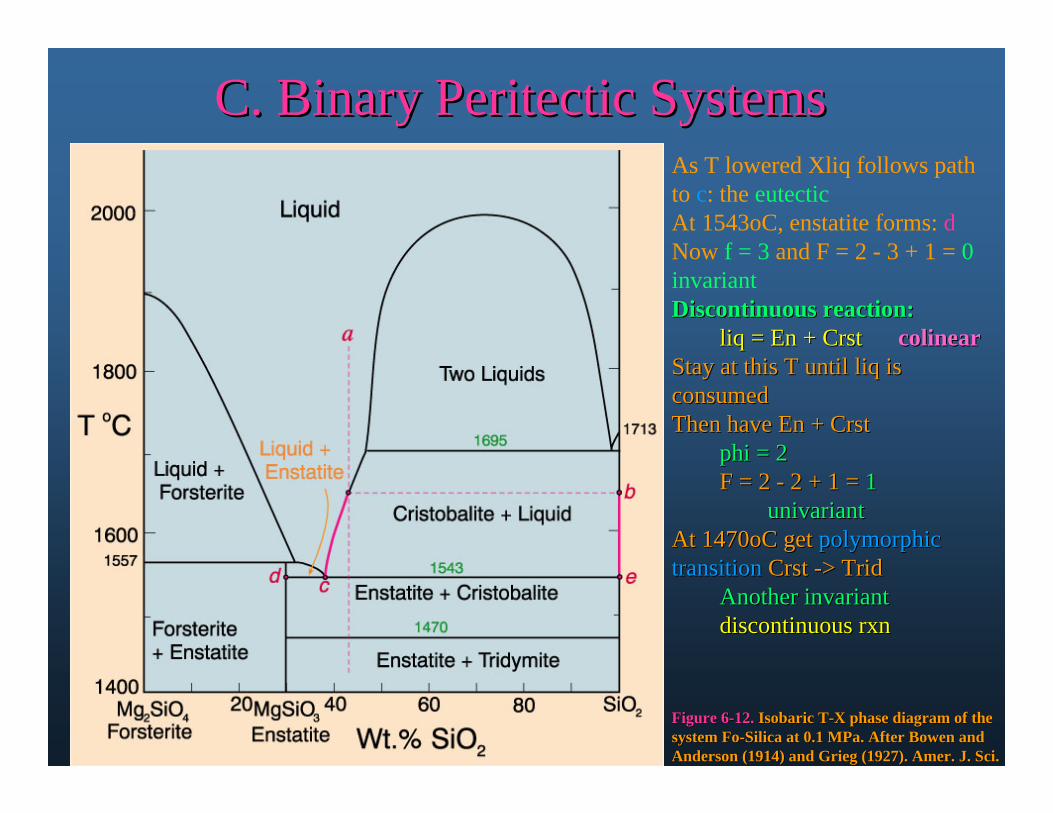
C. Binary Peritectic SystemsC. Binary Peritectic Systems
Figure 6Figure 6--12. 12. Isobaric TIsobaric T--X phase diagram of the X phase diagram of the system Fosystem Fo--Silica at 0.1 MPa. After Bowen and Silica at 0.1 MPa. After Bowen and Anderson (1914) and Grieg (1927).Anderson (1914) and Grieg (1927). Amer. J. Sci.Amer. J. Sci.
As T lowered Xliq follows path to c: the eutecticAt 1543oC, enstatite forms: dNow f = 3 and F = 2 - 3 + 1 = 0 invariantDiscontinuous reaction:Discontinuous reaction:
liqliq = En + = En + CrstCrst colinearcolinearStay at this T until Stay at this T until liqliq is is consumedconsumedThen have En + Then have En + CrstCrst
phi = 2phi = 2F = 2 F = 2 -- 2 + 1 = 2 + 1 = 11
univariantunivariantAt 1470oC get At 1470oC get polymorphic polymorphic transitiontransition CrstCrst --> > TridTrid
Another invariantAnother invariantdiscontinuous discontinuous rxnrxn
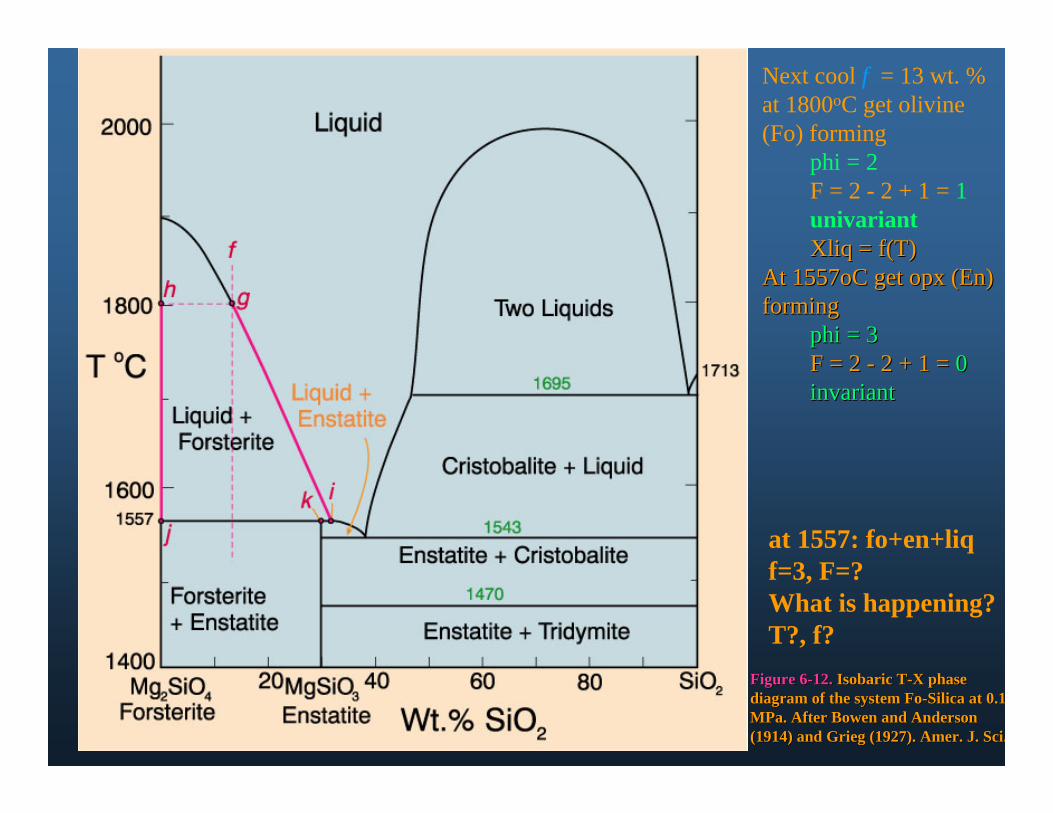
Figure 6Figure 6--12. 12. Isobaric TIsobaric T--X phase X phase diagram of the system Fodiagram of the system Fo--Silica at 0.1Silica at 0.1MPa. After Bowen and Anderson MPa. After Bowen and Anderson (1914) and Grieg (1927).(1914) and Grieg (1927). Amer. J. Sci.Amer. J. Sci.
at 1557: fo+en+liqf=3, F=?What is happening?T?, f?
Next cool f = 13 wt. %at 1800oC get olivine (Fo) forming
phi = 2F = 2 - 2 + 1 = 1univariantXliqXliq = = f(Tf(T))
At 1557oC get At 1557oC get opxopx (En) (En) formingforming
phi = 3phi = 3F = 2 F = 2 -- 2 + 1 = 2 + 1 = 00invariantinvariant
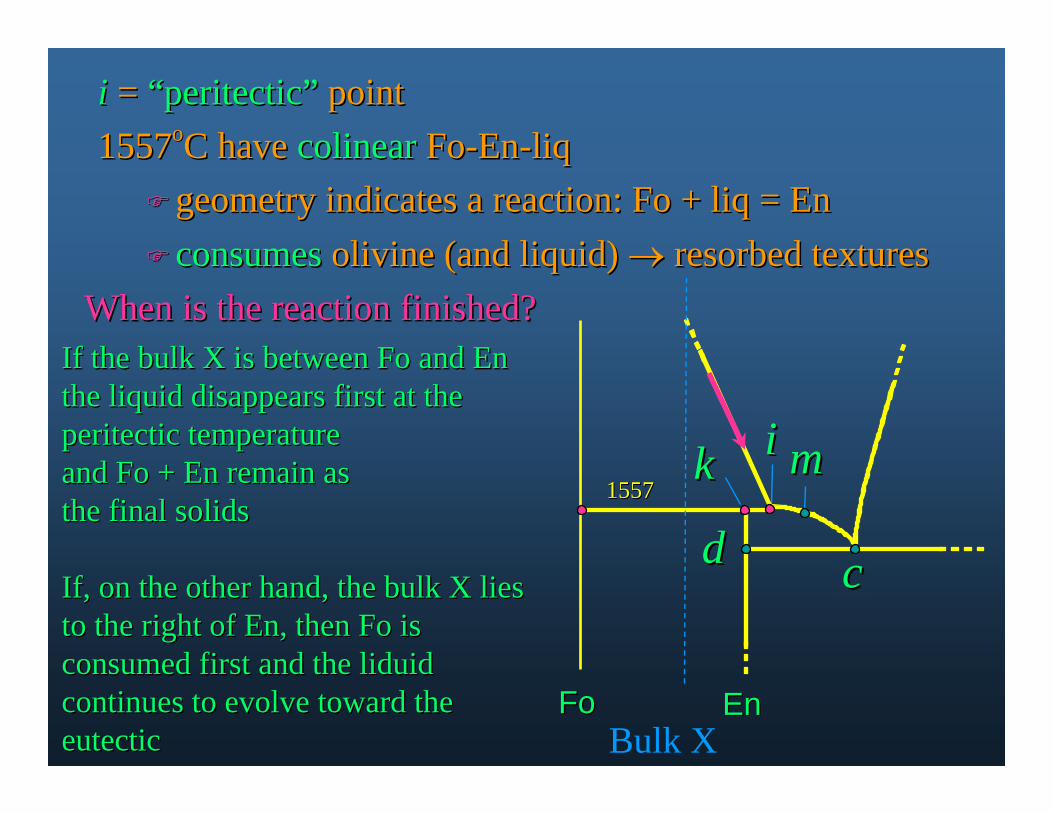
ii = = ““peritecticperitectic”” pointpoint15571557ooC have C have colinearcolinear FoFo--EnEn--liqliq
geometry indicates a reaction: Fo + geometry indicates a reaction: Fo + liqliq = En= En consumesconsumes olivine (and liquid) olivine (and liquid) resorbed texturesresorbed textures
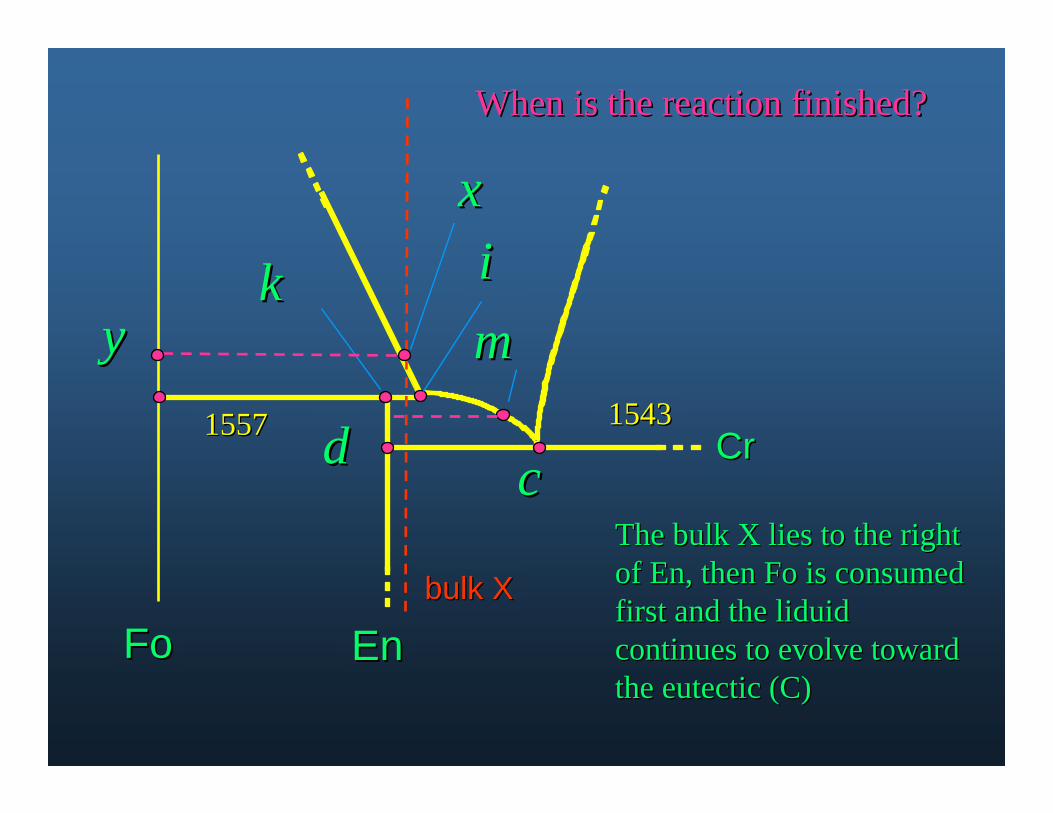
When is the reaction finished?When is the reaction finished?
ccdd
iikk mm
FoFo EnEn
15571557
Bulk X
If the bulk X is between If the bulk X is between FoFo and En and En the liquid disappears first at thethe liquid disappears first at theperitecticperitectic temperature temperature and and FoFo + En remain as + En remain as the final solidsthe final solids
If, on the other hand, the bulk X lies If, on the other hand, the bulk X lies to the right of En, then to the right of En, then FoFo is is consumed first and the consumed first and the liduidliduidcontinues to evolve toward the continues to evolve toward the eutecticeutectic
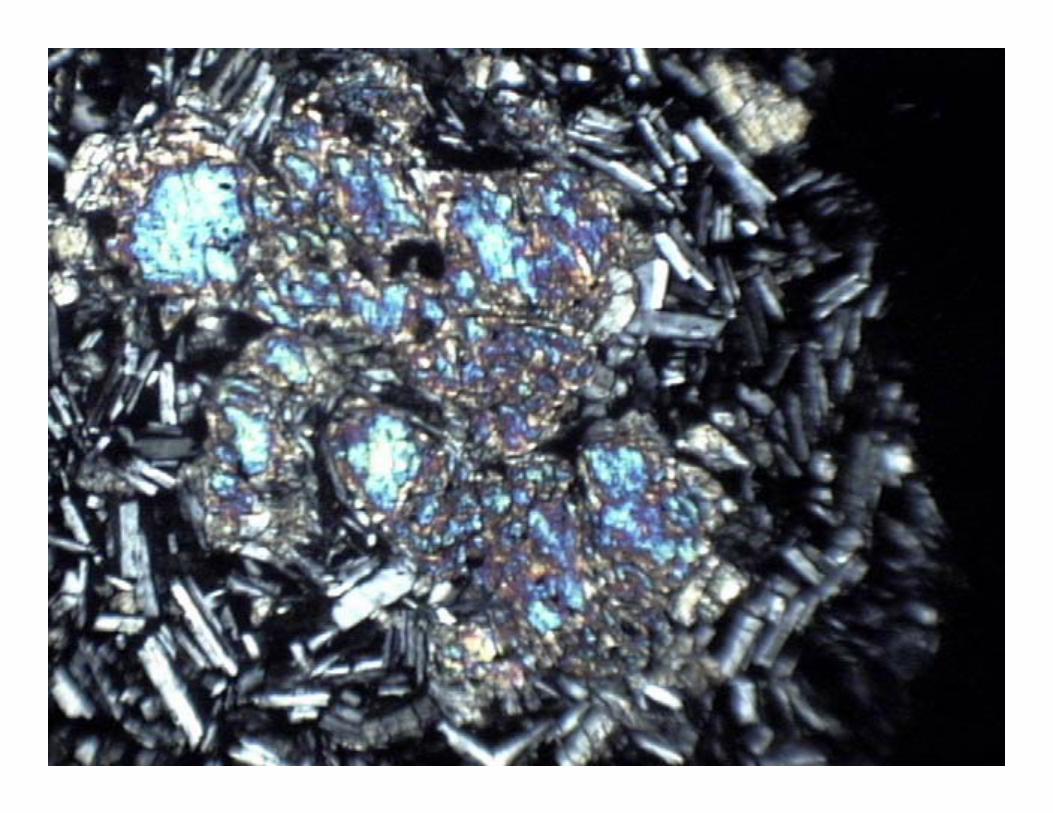
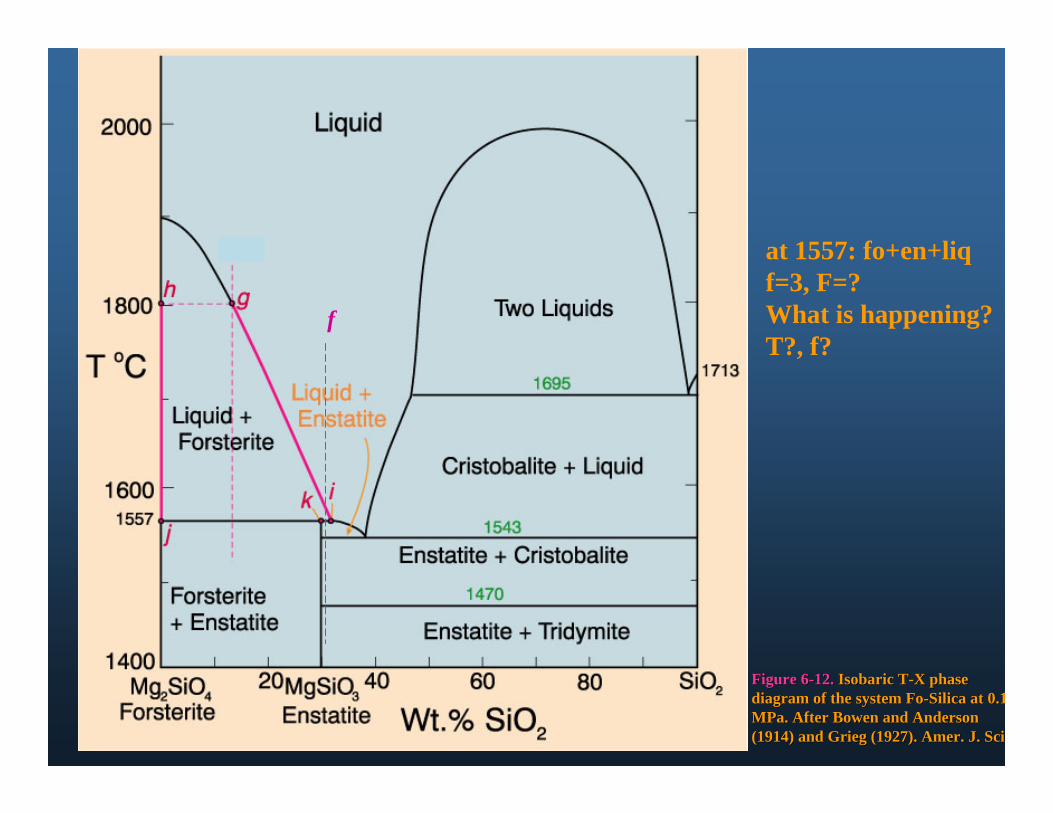
Figure 6Figure 6--12. 12. Isobaric TIsobaric T--X phase X phase diagram of the system Fodiagram of the system Fo--Silica at 0.1Silica at 0.1MPa. After Bowen and Anderson MPa. After Bowen and Anderson (1914) and Grieg (1927).(1914) and Grieg (1927). Amer. J. SciAmer. J. Sci.
at 1557: fo+en+liqf=3, F=?What is happening?T?, f?
f
15431543
ccdd
iikkmm
FoFo EnEn
15571557
bulk Xbulk X
xx
yy
CrCr
When is the reaction finished?When is the reaction finished?
The bulk X lies to the right The bulk X lies to the right of En, then of En, then FoFo is consumed is consumed first and the first and the liduidliduidcontinues to evolve toward continues to evolve toward the eutectic (C)the eutectic (C)
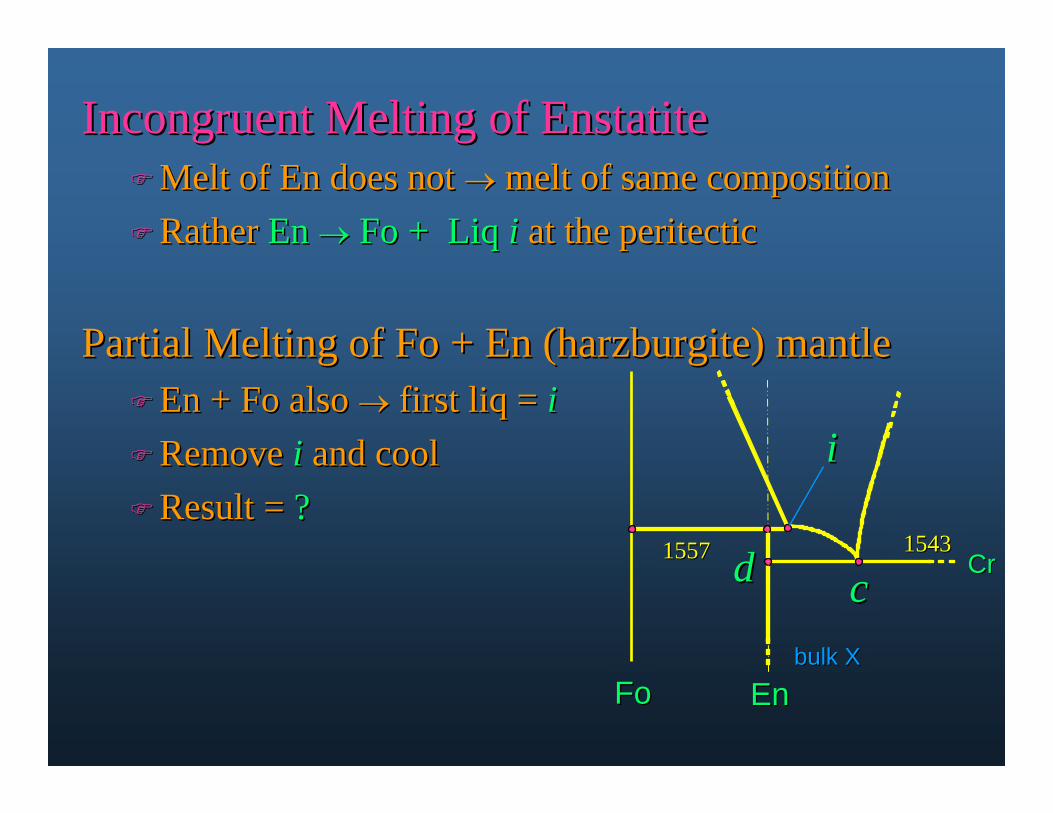
Incongruent Melting of EnstatiteIncongruent Melting of EnstatiteMelt of En does not Melt of En does not melt of same compositionmelt of same compositionRather Rather En En Fo + Fo + LiqLiq ii at the peritecticat the peritectic
Partial Melting of Fo + En (harzburgite) mantlePartial Melting of Fo + En (harzburgite) mantleEn + Fo also En + Fo also first first liqliq = = iiRemove Remove ii and cooland coolResult = Result = ??
15431543
ccdd
ii
FoFo EnEn
15571557
bulk Xbulk X
CrCr
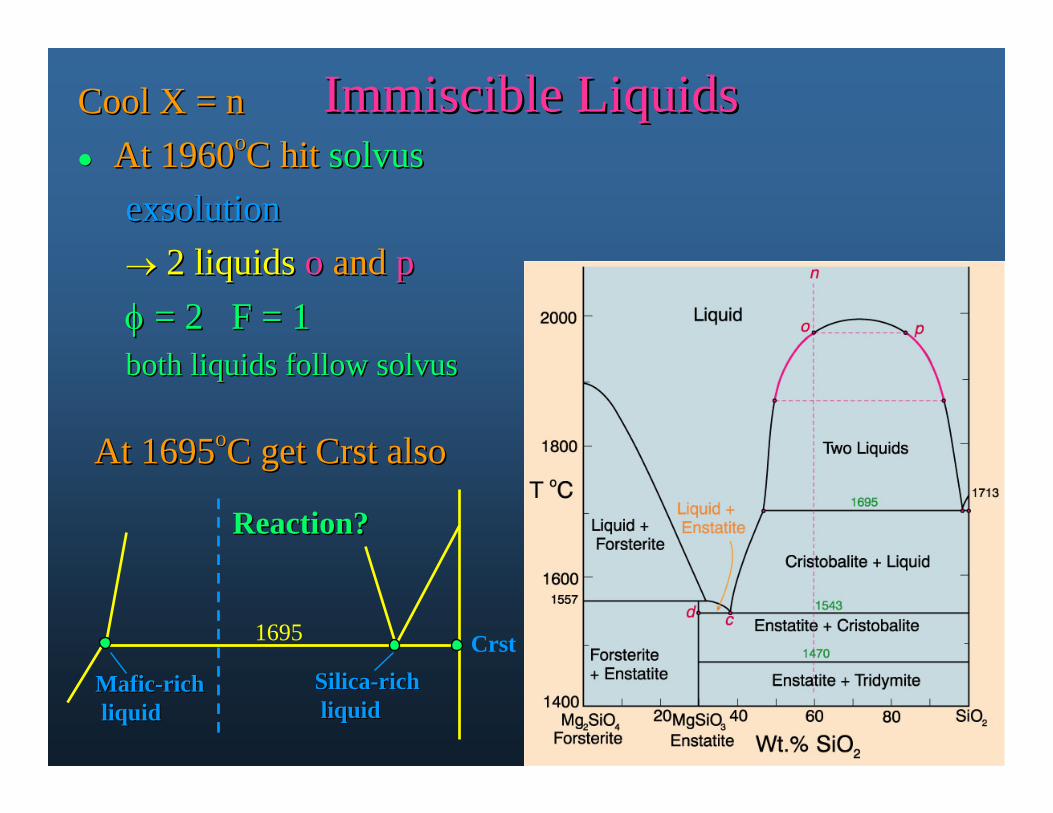
Immiscible LiquidsImmiscible LiquidsCool X = nCool X = n At 1960At 1960ooC hit C hit solvussolvus
exsolutionexsolution 2 liquids2 liquids oo and and pp = 2 F = 1= 2 F = 1both liquids follow solvusboth liquids follow solvus
MaficMafic--richrichliquidliquid
SilicaSilica--richrichliquidliquid
Crst1695
Reaction?Reaction?
At 1695At 1695ooC get C get CrstCrst alsoalso
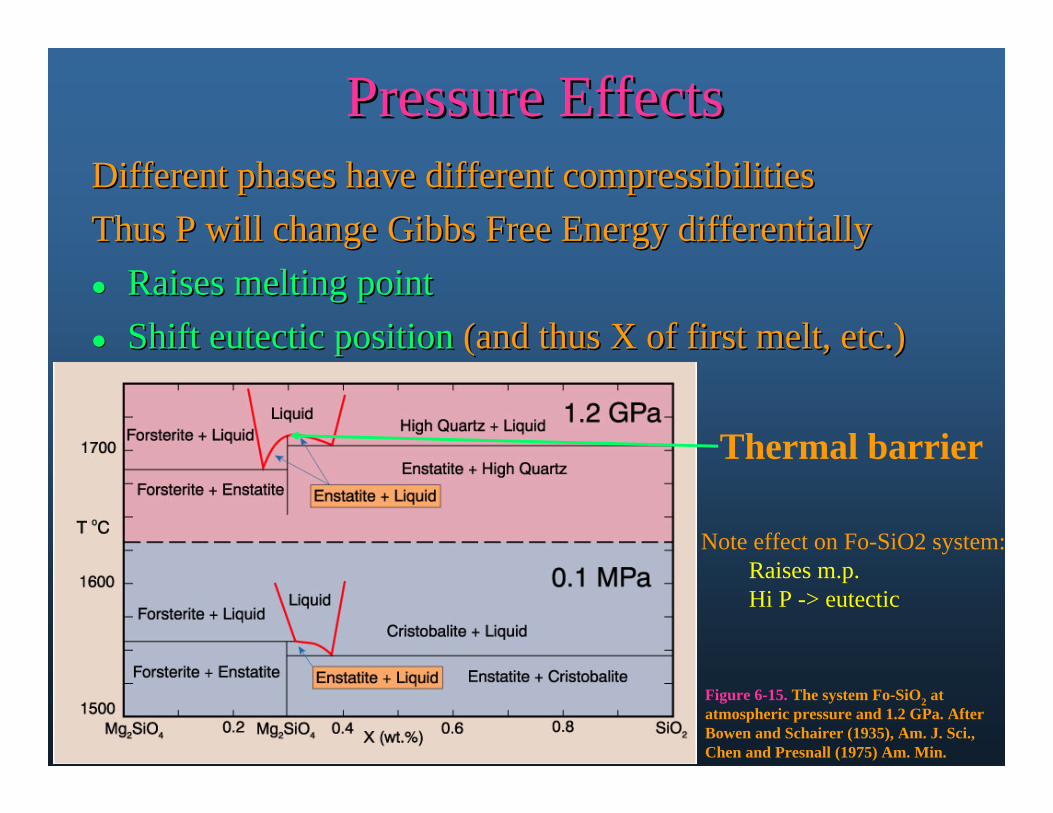
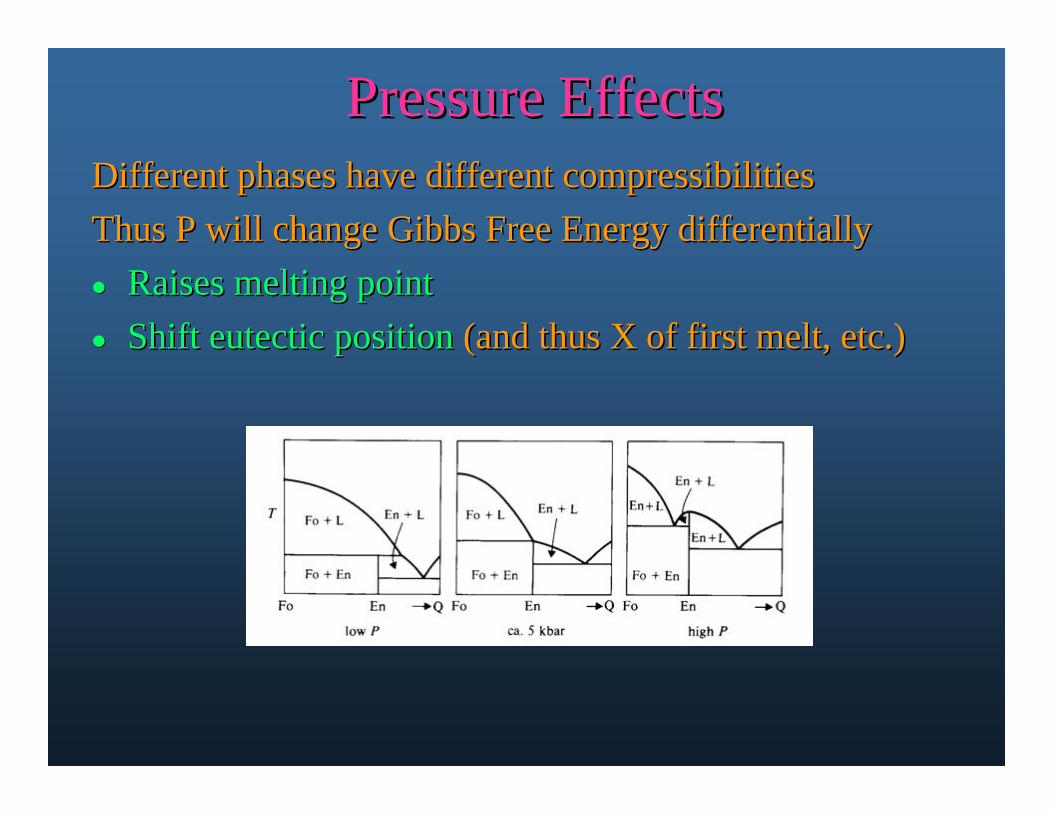
Pressure EffectsPressure EffectsDifferent phases have different compressibilitiesDifferent phases have different compressibilitiesThus P will change Gibbs Free Energy differentiallyThus P will change Gibbs Free Energy differentially Raises melting pointRaises melting point Shift eutectic positionShift eutectic position (and thus X of first melt, etc.)(and thus X of first melt, etc.)
Figure 6-15. The system Fo-SiO2 at atmospheric pressure and 1.2 GPa. After Bowen and Schairer (1935), Am. J. Sci., Chen and Presnall (1975) Am. Min.
Thermal barrier
Note effect on Fo-SiO2 system:Raises m.p. Hi P -> eutectic
Pressure EffectsPressure EffectsDifferent phases have different compressibilitiesDifferent phases have different compressibilitiesThus P will change Gibbs Free Energy differentiallyThus P will change Gibbs Free Energy differentially Raises melting pointRaises melting point Shift eutectic positionShift eutectic position (and thus X of first melt, etc.)(and thus X of first melt, etc.)