Embed Size (px)
Citation preview
BINARY INSTRUMENTATION FOR HACKERS
GAL DISKIN / INTEL(@GAL_DISKIN)
HACK.LU 2011
LEGAL DISCLAIMER
INFORMATION IN THIS DOCUMENT IS PROVIDED “AS IS”. NO LICENSE, EXPRESS OR IMPLIED, BY ESTOPPEL OR OTHERWISE, ANY INTELLECTUAL PROPERTY RIGHTS IS GRANTED BY THIS DOCUMENT. INTEL ASSUMES NO LIABILITY WHATSOEVER AND INTEL DISCLAIMS ANY EXPRESS OR IMPLIED WARRANTY, RELATING TO THIS INFORMATION INCLUDING LIABILITY OR WARRANTIES RELATING TO FITNESS FOR A PARTICULAR PURPOSE, MERCHANTABILITY, OR INFRINGEMENT OF ANY PATENT, COPYRIGHT OR OTHER INTELLECTUAL PROPERTY RIGHT.
Intel and the Intel logo are trademarks of Intel Corporation in the U.S. and other countries.
*Other names and brands may be claimed as the property of others.
Copyright © 2011. Intel Corporation.
ALL CODE IN THIS PRESENTATION IS COVERED BY THE FOLLOWING:/*BEGIN_LEGAL
Intel Open Source License
Copyright (c) 2002-2011 Intel Corporation. All rights reserved.
Redistribution and use in source and binary forms, with or without modification, are permitted provided that the following conditions are met:
Redistributions of source code must retain the above copyright notice, this list of conditions and the following disclaimer. Redistributions in binary form must reproduce the above copyright notice, this list of conditions and the following disclaimer in the documentation and/or other materials provided with the distribution. Neither the name of the Intel Corporation nor the names of its contributors may be used to endorse or promote products derived from this software without specific prior written permission.
THIS SOFTWARE IS PROVIDED BY THE COPYRIGHT HOLDERS AND CONTRIBUTORS ``AS IS'' AND ANY EXPRESS OR IMPLIED WARRANTIES, INCLUDING, BUT NOT LIMITED TO, THE IMPLIED WARRANTIES OF MERCHANTABILITY AND FITNESS FOR A PARTICULAR PURPOSE ARE DISCLAIMED. IN NO EVENT SHALL THE INTEL OR ITS CONTRIBUTORS BE LIABLE FOR ANY DIRECT, INDIRECT, INCIDENTAL, SPECIAL, EXEMPLARY, OR CONSEQUENTIAL DAMAGES (INCLUDING, BUT NOT LIMITED TO, PROCUREMENT OF SUBSTITUTE GOODS OR SERVICES; LOSS OF USE, DATA, OR PROFITS; OR BUSINESS INTERRUPTION) HOWEVER CAUSED AND ON ANY THEORY OF LIABILITY, WHETHER IN CONTRACT, STRICT LIABILITY, OR TORT (INCLUDING NEGLIGENCE OR OTHERWISE) ARISING IN ANY WAY OUT OF THE USE OF THIS SOFTWARE, EVEN IF ADVISED OF THE POSSIBILITY OF SUCH DAMAGE.
END_LEGAL */
WHO AM I
» Currently @ Intel
• Security researcher
• Evaluation team leader
» Formerly a member of the binary instrumentation team @ Intel
» Before that a private consultant
» Always a hacker
» …
Online presence: www.diskin.org, @gal_diskin, LinkedIn, E-mail (yeah, even FB & G+)
CREDITS
» Tevi Devor of the Pin development team for parts of his Pin tutorial that were adapted used as a base for the Pin tutorial part of this presentation
» Dmitriy "D1g1" Evdokimov (@evdokimovds) from DSecRG for reviewing the presentation and providing constructive criticism
ABOUT THIS WORKSHOP
» How does DBI work – Intro to a DBI engine (Pin)
» The InfoSec usages of DBI
» InfoSec DBI tools
WHAT IS INSTRUMENTATION
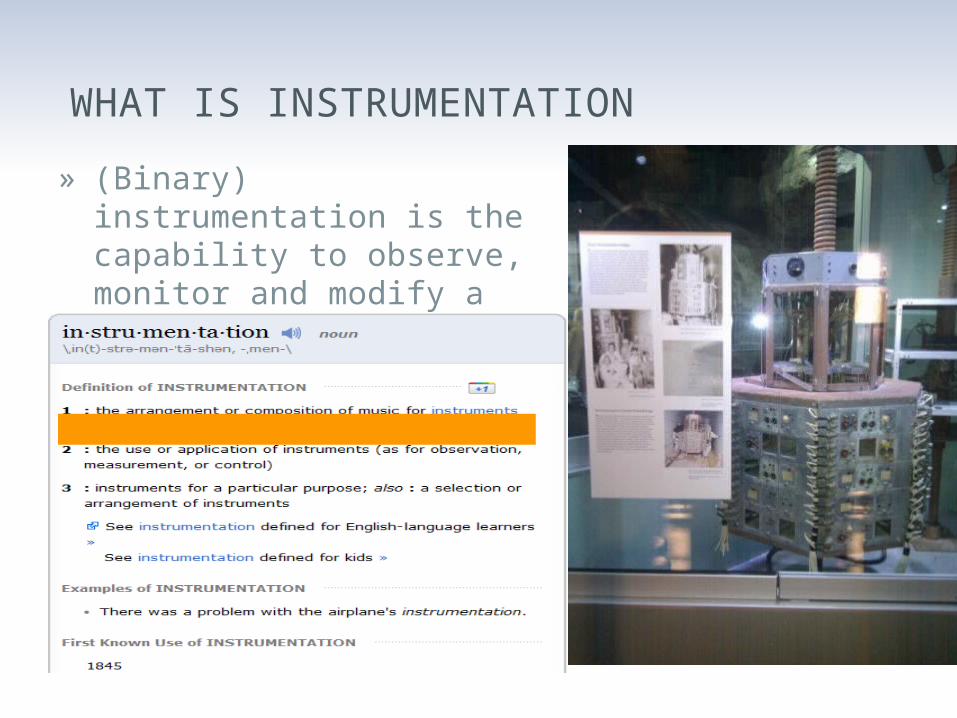
» (Binary) instrumentation is the capability to observe, monitor and modify a (binary) program behavior
INSTRUMENTATION TYPES
» Source / Compiler Instrumentation
» Static Binary Instrumentation
» Dynamic Binary Instrumentation
INTRO TO A DBI ENGINE AND HOW IT WORKS
I told you DBI is wonderful - what’s next?
BINARY INSTRUMENTATION ENGINES
» Pin
» DynamoRio
» Valgrind
» DynInst
» ERESI
» Many more…
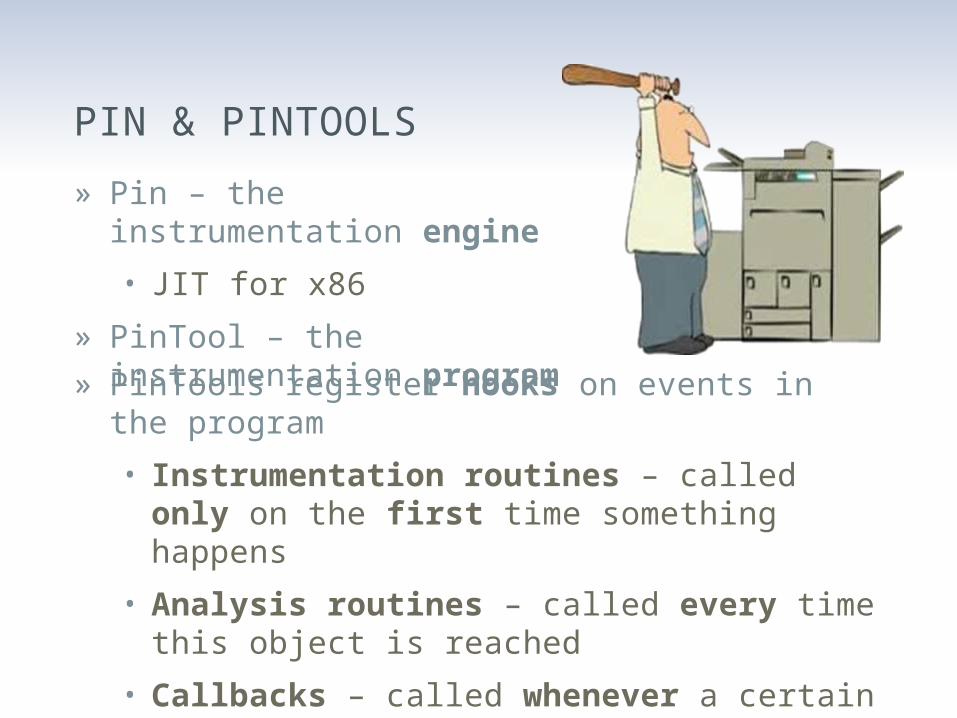
PIN & PINTOOLS
» Pin – the instrumentation engine
• JIT for x86
» PinTool – the instrumentation program
» PinTools register hooks on events in the program
• Instrumentation routines – called only on the first time something happens
• Analysis routines – called every time this object is reached
• Callbacks – called whenever a certain event happens
WHERE TO FIND INFO ABOUT PIN
» Website: www.pintool.org
» Mailing list @ Yahoo groups: Pinheads
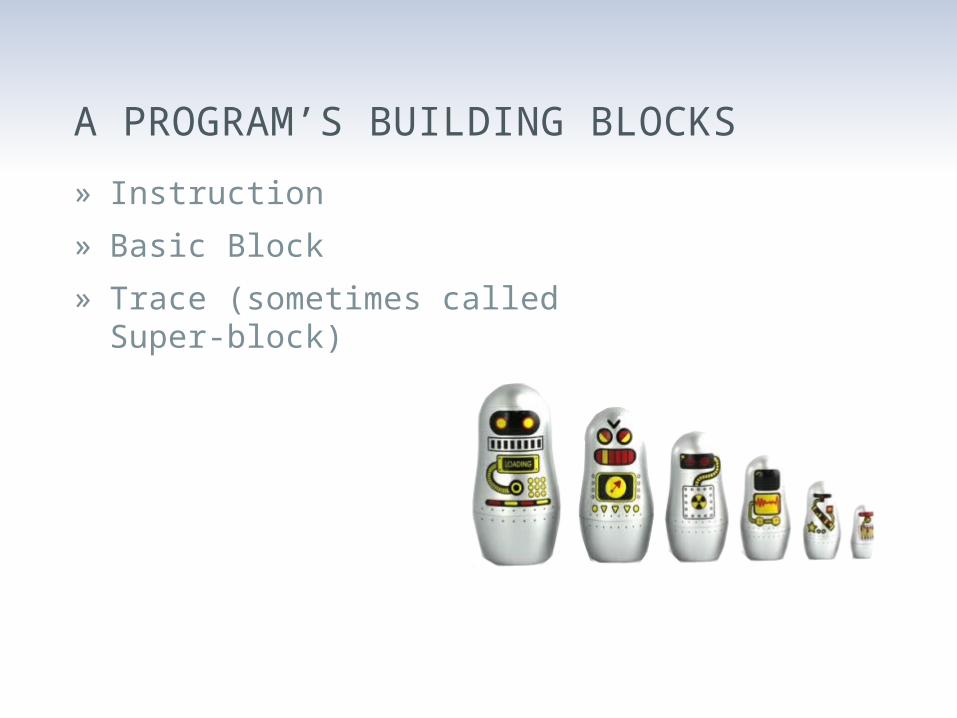
A PROGRAM’S BUILDING BLOCKS
» Instruction
» Basic Block
» Trace (sometimes called Super-block)
PIN EXECUTION
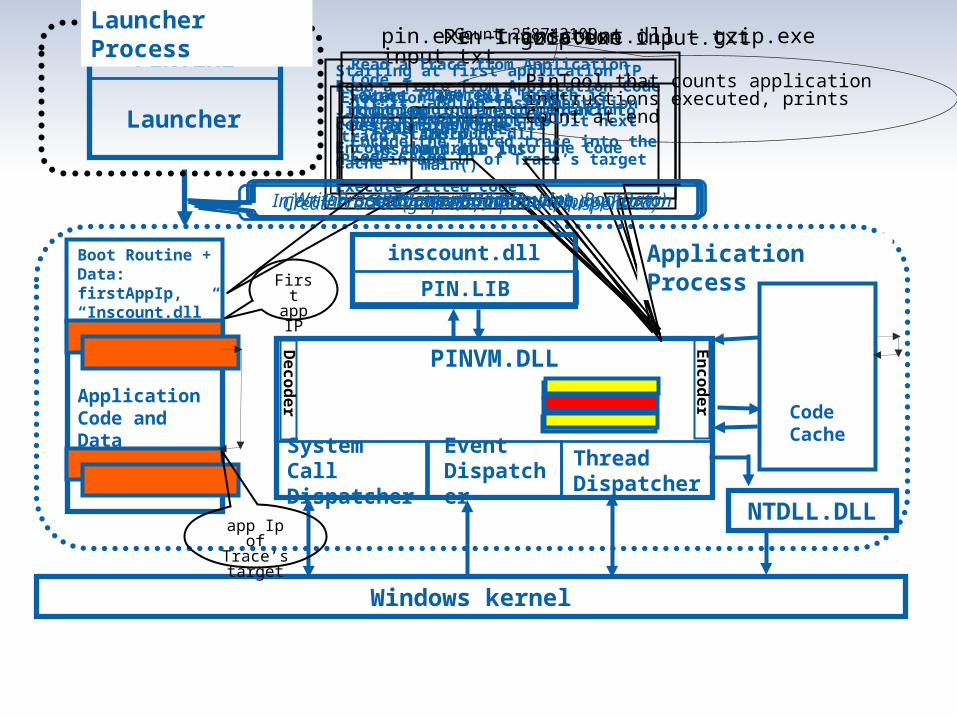
Starting at first application IP Read a Trace from Application Code
Jit it, adding instrumentation code from inscount.dll
Encode the trace into the Code Cache
Execute Jitted code
Execution of Trace ends
Call into PINVM.DLL to Jit next trace
Pass in app IP of Trace’s target
Source Trace exit branch is modified to directly branch to Destination Trace
Pin Invocation gzip.exe input.txt
Application Code andData
Application Process
System Call Dispatcher
Event Dispatcher
Thread Dispatcher
PINVM.DLL
inscount.dll
PIN.LIB
Code Cache
NTDLL.DLL
Windows kernel
CreateProcess (gzip.exe, input.txt, suspended)
Launcher
PIN.EXE
Launcher Process
Boot Routine +Data:firstAppIp,“Inscount.dll”
Load PINVM.DLL
Inject Pin BootRoutine and Data into application
Load inscount.dll and run its main()
Start PINVM.DLL running
(firstAppIp, “inscount.dll”)
pin.exe –t inscount.dll – gzip.exe input.txtCount 258743109
PinTool that counts application instructions executed, prints Count at end
Resume at BootRoutine
First app IP
app Ip of Trace’s target
Read a Trace from Application Code
Jit it, adding instrumentation code from inscount.dll
Encode the jitted trace into the Code Cache
GetContext(&firstAppIp)SetContext(BootRoutineIp)WriteProcessMemory(BootRoutine, BootData)
Decoder
Encoder
SECTION SUMMARY
» There are many DBI engines
» We’re focusing on Pin in this workshop
» We’ve seen how Pin injection into a process works
» We’ve seen how it behaves during execution
INTRO TO PINTOOLSHow do you program a DBI engine?
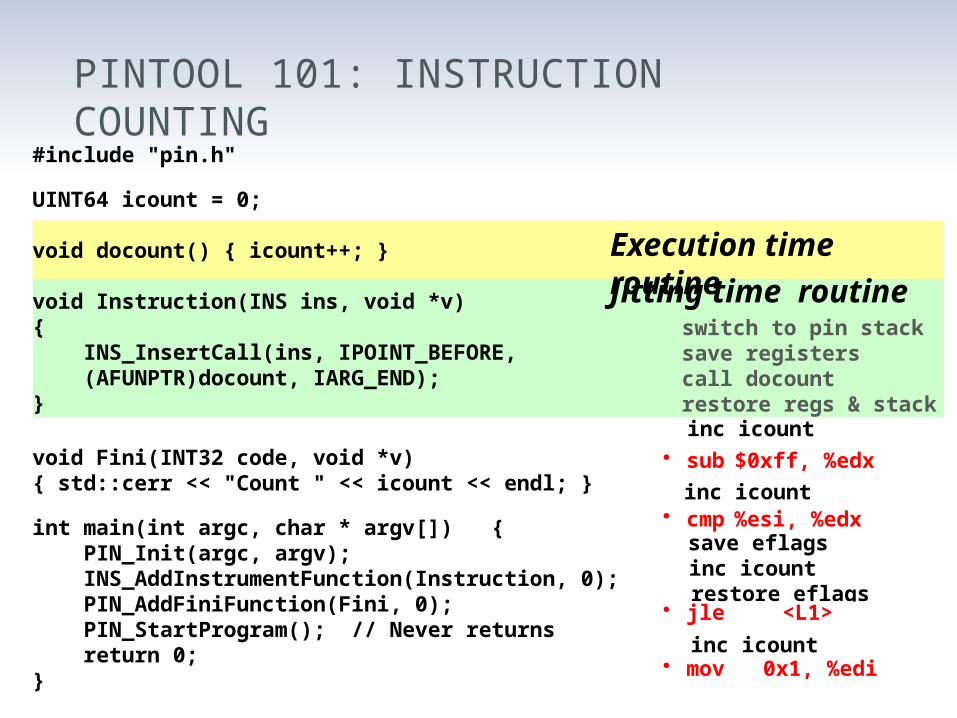
#include "pin.h"
UINT64 icount = 0;
void docount() { icount++; }
void Instruction(INS ins, void *v) { INS_InsertCall(ins, IPOINT_BEFORE, (AFUNPTR)docount, IARG_END);}
void Fini(INT32 code, void *v) { std::cerr << "Count " << icount << endl; }
int main(int argc, char * argv[]) { PIN_Init(argc, argv); INS_AddInstrumentFunction(Instruction, 0); PIN_AddFiniFunction(Fini, 0); PIN_StartProgram(); // Never returns return 0; }
PINTOOL 101: INSTRUCTION COUNTING
restore eflags
• mov 0x1, %edi
• jle <L1>
switch to pin stack save registers call docount restore regs & stack
inc icount
inc icount
inc icount
inc icount
• sub $0xff, %edx
• cmp %esi, %edxsave eflags
Jitting time routine
Execution time routine
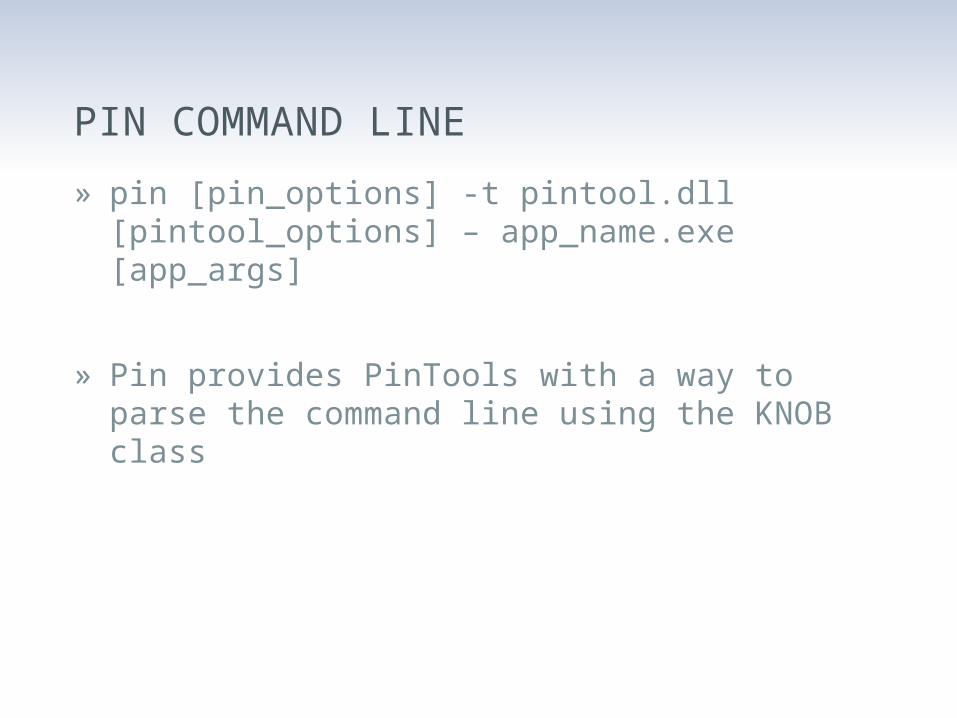
PIN COMMAND LINE
» pin [pin_options] -t pintool.dll [pintool_options] – app_name.exe [app_args]
» Pin provides PinTools with a way to parse the command line using the KNOB class
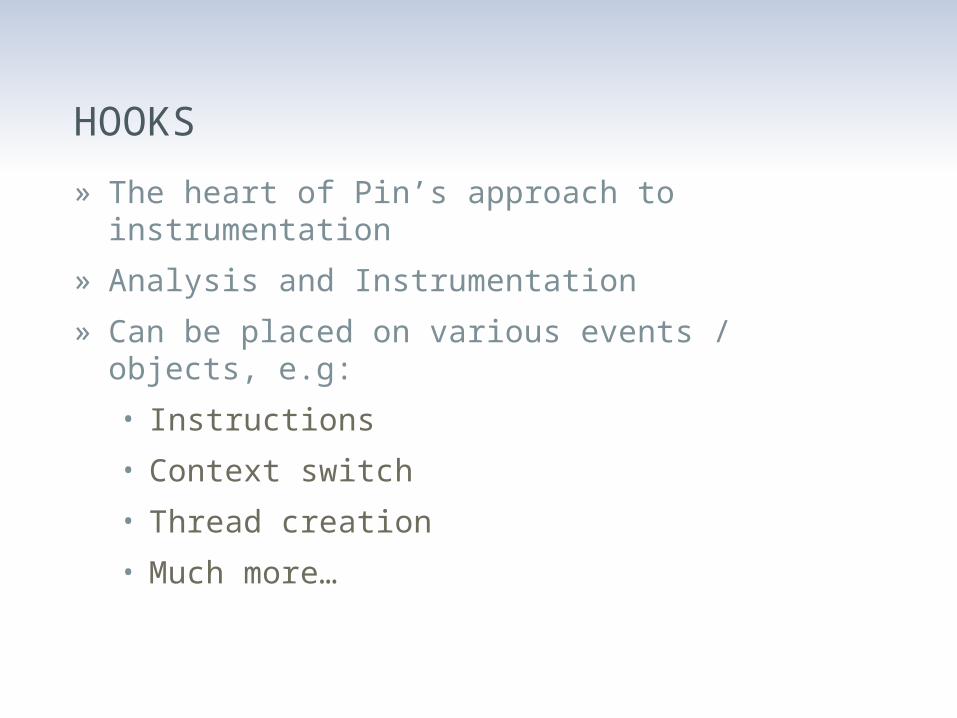
HOOKS
» The heart of Pin’s approach to instrumentation
» Analysis and Instrumentation
» Can be placed on various events / objects, e.g:
• Instructions
• Context switch
• Thread creation
• Much more…
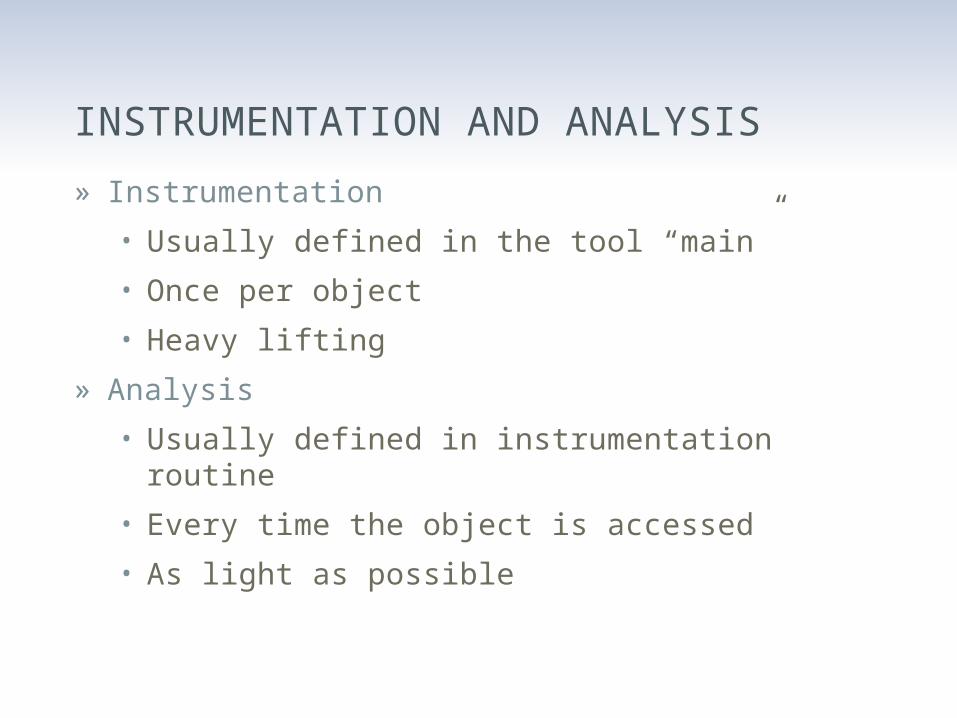
INSTRUMENTATION AND ANALYSIS
» Instrumentation
• Usually defined in the tool “main”
• Once per object
• Heavy lifting
» Analysis
• Usually defined in instrumentation routine
• Every time the object is accessed
• As light as possible
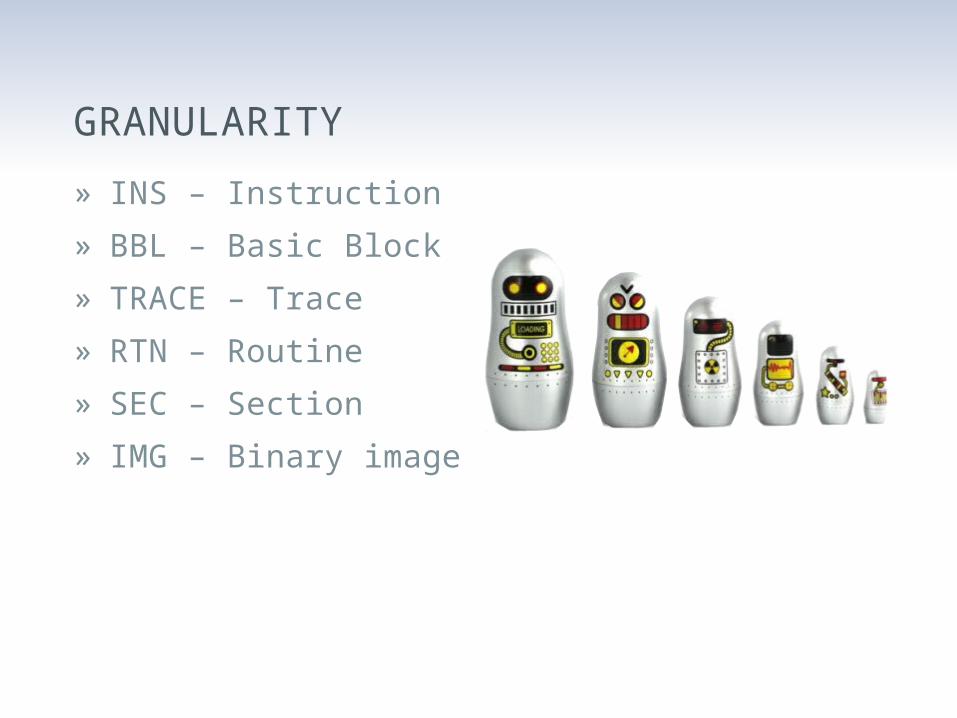
GRANULARITY
» INS – Instruction
» BBL – Basic Block
» TRACE – Trace
» RTN – Routine
» SEC – Section
» IMG – Binary image
OTHER INSTRUMENTABLE OBJECTS
» Threads
» Processes
» Exceptions and context changes
» Syscalls
» …
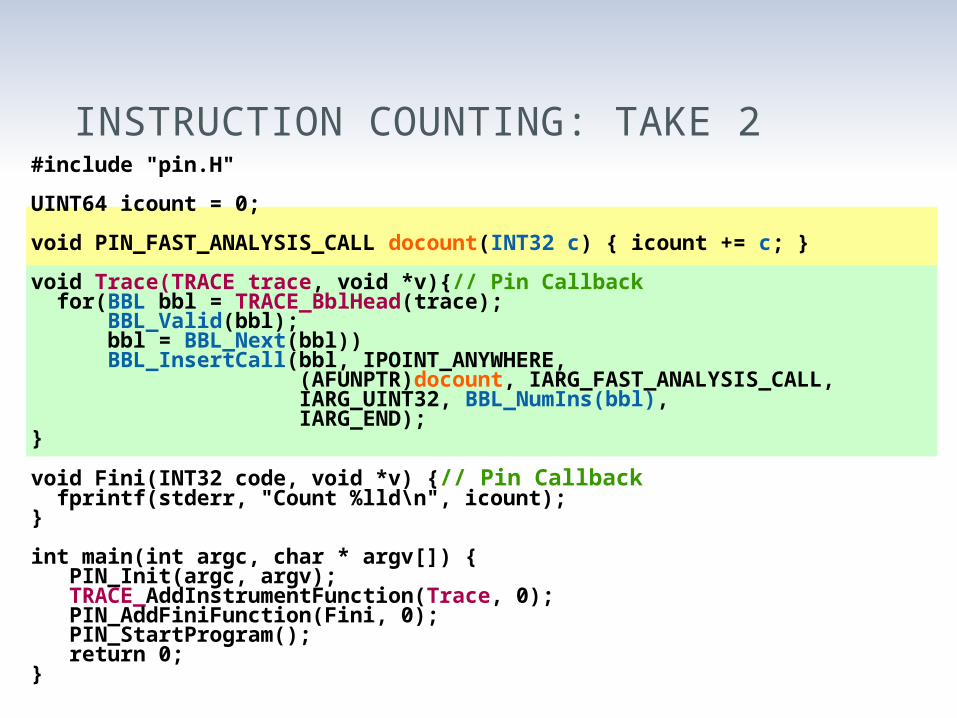
INSTRUCTION COUNTING: TAKE 2#include "pin.H"
UINT64 icount = 0;
void PIN_FAST_ANALYSIS_CALL docount(INT32 c) { icount += c; }
void Trace(TRACE trace, void *v){// Pin Callback for(BBL bbl = TRACE_BblHead(trace); BBL_Valid(bbl); bbl = BBL_Next(bbl)) BBL_InsertCall(bbl, IPOINT_ANYWHERE, (AFUNPTR)docount, IARG_FAST_ANALYSIS_CALL, IARG_UINT32, BBL_NumIns(bbl), IARG_END);}
void Fini(INT32 code, void *v) {// Pin Callback fprintf(stderr, "Count %lld\n", icount);}
int main(int argc, char * argv[]) { PIN_Init(argc, argv); TRACE_AddInstrumentFunction(Trace, 0); PIN_AddFiniFunction(Fini, 0); PIN_StartProgram(); return 0;}
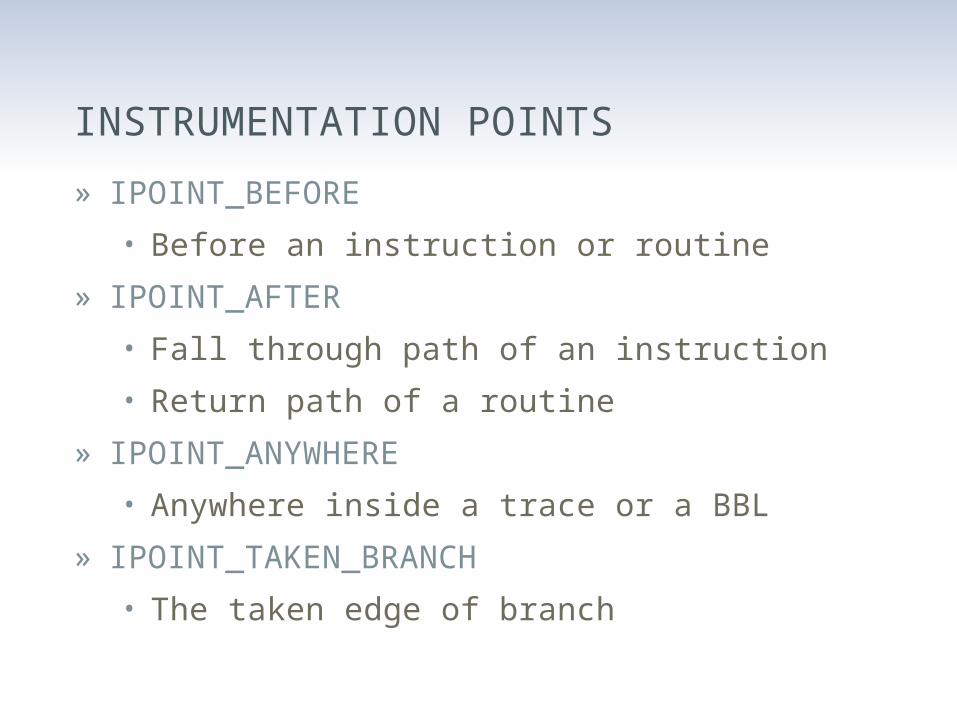
INSTRUMENTATION POINTS
» IPOINT_BEFORE
• Before an instruction or routine
» IPOINT_AFTER
• Fall through path of an instruction
• Return path of a routine
» IPOINT_ANYWHERE
• Anywhere inside a trace or a BBL
» IPOINT_TAKEN_BRANCH
• The taken edge of branch
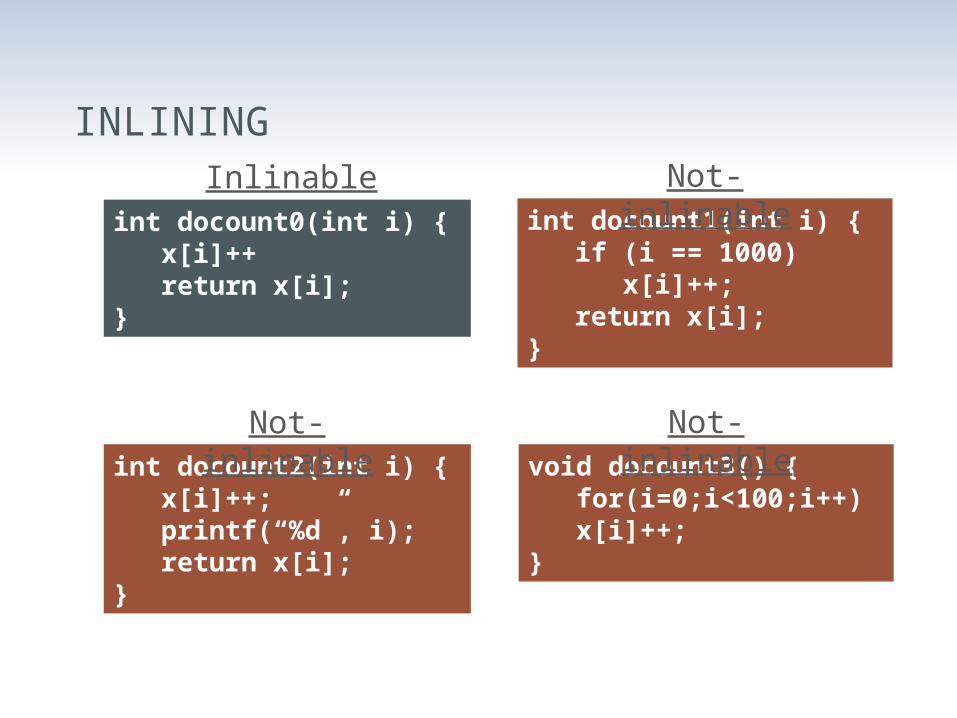
INLINING
int docount0(int i) { x[i]++ return x[i];}
Inlinableint docount1(int i) { if (i == 1000) x[i]++; return x[i];}
Not-inlinable
int docount2(int i) { x[i]++; printf(“%d”, i); return x[i];}
Not-inlinable void docount3() {
for(i=0;i<100;i++)x[i]++;
}
Not-inlinable
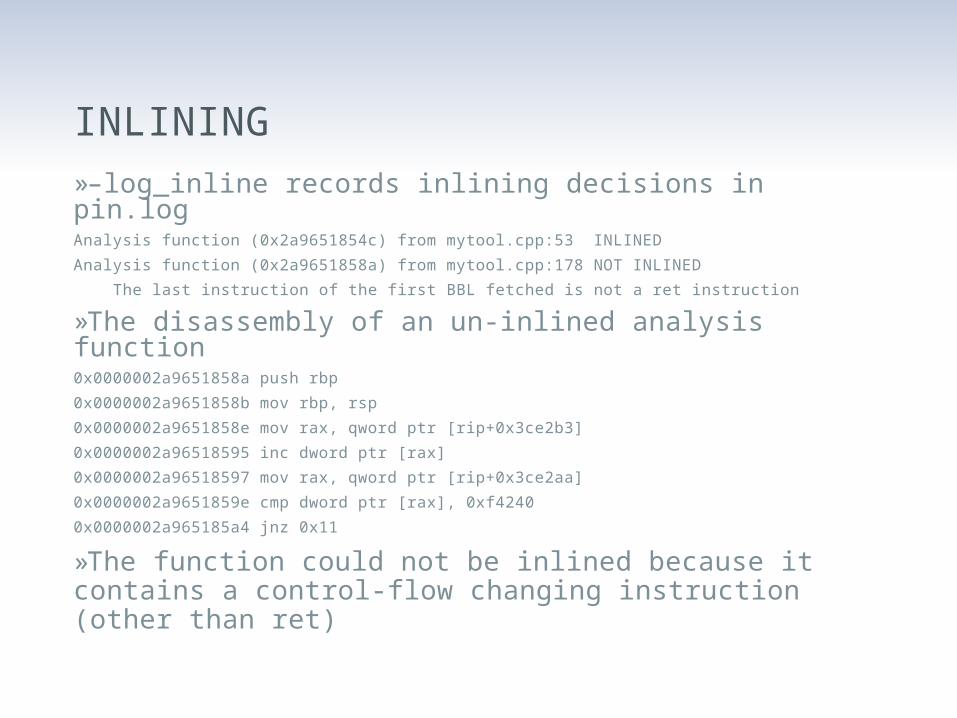
INLINING
»–log_inline records inlining decisions in pin.logAnalysis function (0x2a9651854c) from mytool.cpp:53 INLINED
Analysis function (0x2a9651858a) from mytool.cpp:178 NOT INLINED
The last instruction of the first BBL fetched is not a ret instruction
»The disassembly of an un-inlined analysis function0x0000002a9651858a push rbp
0x0000002a9651858b mov rbp, rsp
0x0000002a9651858e mov rax, qword ptr [rip+0x3ce2b3]
0x0000002a96518595 inc dword ptr [rax]
0x0000002a96518597 mov rax, qword ptr [rip+0x3ce2aa]
0x0000002a9651859e cmp dword ptr [rax], 0xf4240
0x0000002a965185a4 jnz 0x11
»The function could not be inlined because it contains a control-flow changing instruction (other than ret)
CONDITIONAL INSTRUMENTATION
» XXX_InsertIfCall
» XXX_InsertThenCall
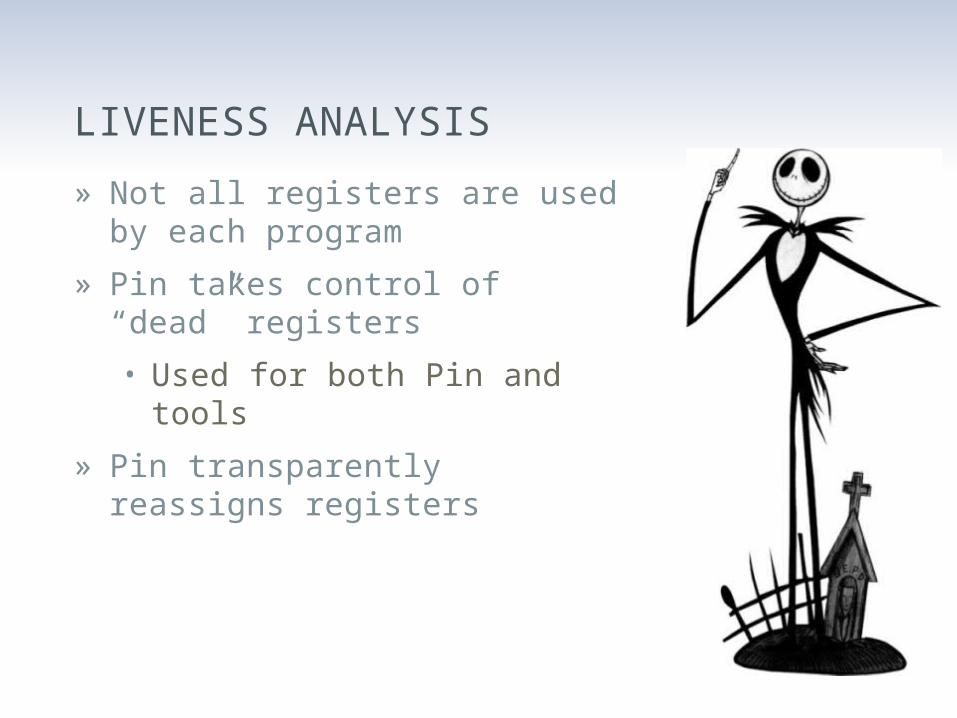
LIVENESS ANALYSIS
» Not all registers are used by each program
» Pin takes control of “dead” registers
• Used for both Pin and tools
» Pin transparently reassigns registers
HOW TRANSLATED CODE LOOKS?
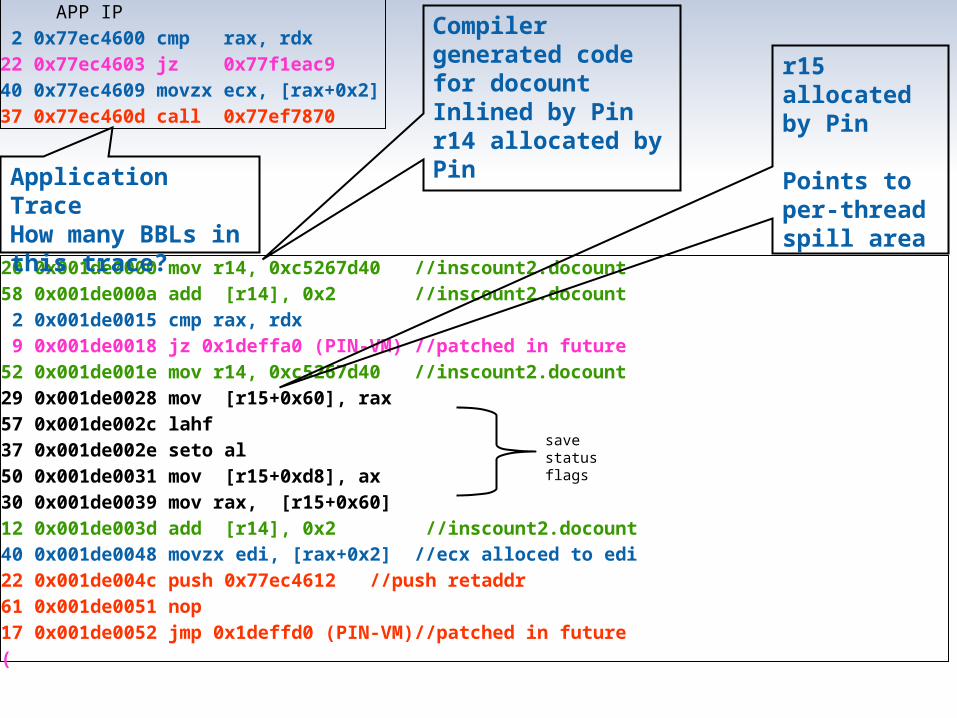
20 0x001de0000 mov r14, 0xc5267d40 //inscount2.docount58 0x001de000a add [r14], 0x2 //inscount2.docount 2 0x001de0015 cmp rax, rdx 9 0x001de0018 jz 0x1deffa0 (PIN-VM) //patched in future52 0x001de001e mov r14, 0xc5267d40 //inscount2.docount 29 0x001de0028 mov [r15+0x60], rax 57 0x001de002c lahf 37 0x001de002e seto al 50 0x001de0031 mov [r15+0xd8], ax 30 0x001de0039 mov rax, [r15+0x60] 12 0x001de003d add [r14], 0x2 //inscount2.docount40 0x001de0048 movzx edi, [rax+0x2] //ecx alloced to edi22 0x001de004c push 0x77ec4612 //push retaddr 61 0x001de0051 nop 17 0x001de0052 jmp 0x1deffd0 (PIN-VM)//patched in future(
APP IP 2 0x77ec4600 cmp rax, rdx 22 0x77ec4603 jz 0x77f1eac9 40 0x77ec4609 movzx ecx, [rax+0x2]37 0x77ec460d call 0x77ef7870
save status flags
Application TraceHow many BBLs in this trace?
r15 allocated by Pin
Points to per-thread spill area
Compiler generated code for docountInlined by Pinr14 allocated by Pin
SECTION SUMMARY
» The “Hello (DBI) World” is instruction counting
» There are various levels of granularity we can instrument as well as various points we can instrument in
» Instrumentation routines are called once, analysis routines are called every time
» Performance is better when working at higher granularity, when your heavy work is done in instrumentation routines and when your code is inline-able or you use conditional instrumentation
PIN INJECTION
» Also known as “Early Injection”
» Allows you to instrument every instruction in the process starting from the very first loader instruction
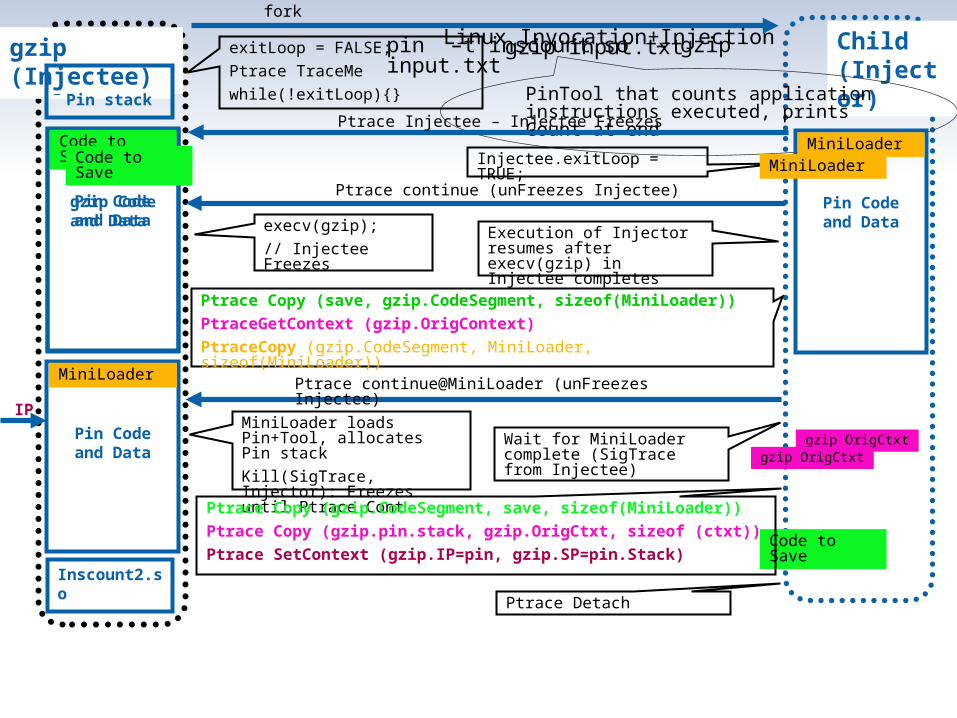
pin –t inscount.so – gzip input.txtLinux Invocation+Injection gzip input.txt Child
(Injector)Pin (Injectee)
PinTool that counts application instructions executed, prints Count at end
fork
exitLoop = FALSE;
Ptrace TraceMe
while(!exitLoop){}
Ptrace Injectee – Injectee Freezes
Injectee.exitLoop = TRUE;
execv(gzip);
// Injectee Freezes
Ptrace continue (unFreezes Injectee)
Ptrace Copy (save, gzip.CodeSegment, sizeof(MiniLoader))
PtraceGetContext (gzip.OrigContext)
PtraceCopy (gzip.CodeSegment, MiniLoader, sizeof(MiniLoader))
Ptrace continue@MiniLoader (unFreezes Injectee)
MiniLoader loads Pin+Tool, allocates Pin stack
Kill(SigTrace, Injector): Freezes until Ptrace Cont
Execution of Injector resumes after execv(gzip) in Injectee completes
Ptrace Detach
Wait for MiniLoader complete (SigTrace from Injectee)
Pin Code and Data
MiniLoader
Pin Code and Data
MiniLoader
gzip Code and Data
Code to SaveCode to Save MiniLoader
Code to Save
Ptrace Copy (gzip.CodeSegment, save, sizeof(MiniLoader))
Ptrace Copy (gzip.pin.stack, gzip.OrigCtxt, sizeof (ctxt))
Ptrace SetContext (gzip.IP=pin, gzip.SP=pin.Stack)
gzip OrigCtxtPin Code and Data
MiniLoader
Inscount2.so
gzip (Injectee)
Pin stack
gzip OrigCtxt
IP
TRANSPARENT DEBUGGING & EXTENDING THE DEBUGGER
Simple, yet powerful
TRANSPARENT DEBUGGING
» Transparent debugging
• “-appdebug” on Linux
» Experimental Windows support exists and might go mainline soon (look for vsdbg.bat in the Pin kit)
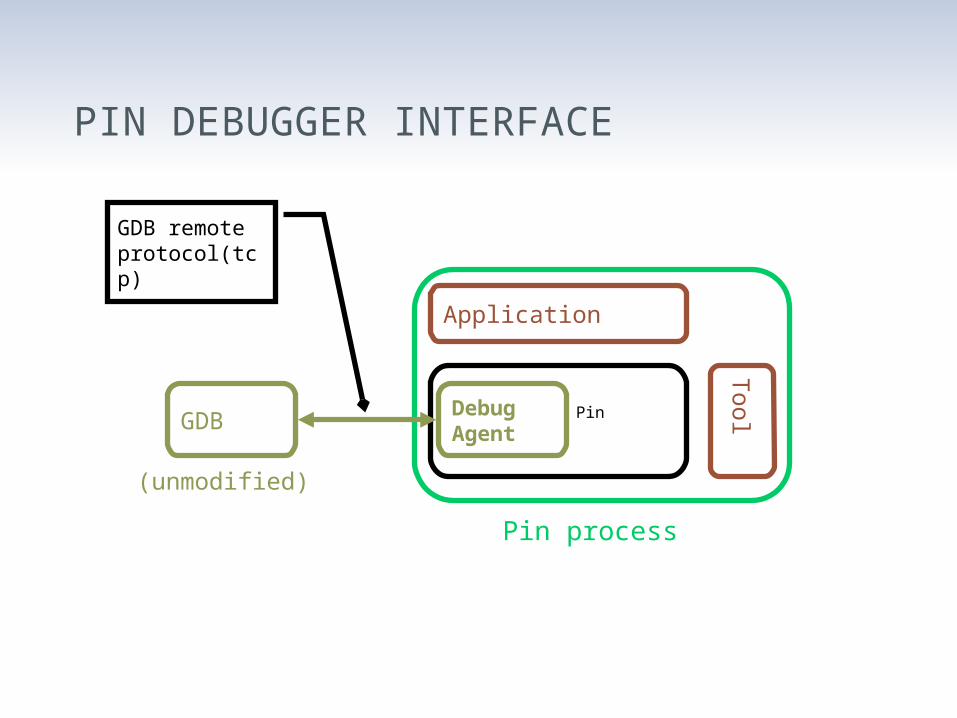
PIN DEBUGGER INTERFACE
37
Application
Tool
GDBDebugAgent
Pin
GDB remote protocol(tcp)
Pin process
(unmodified)
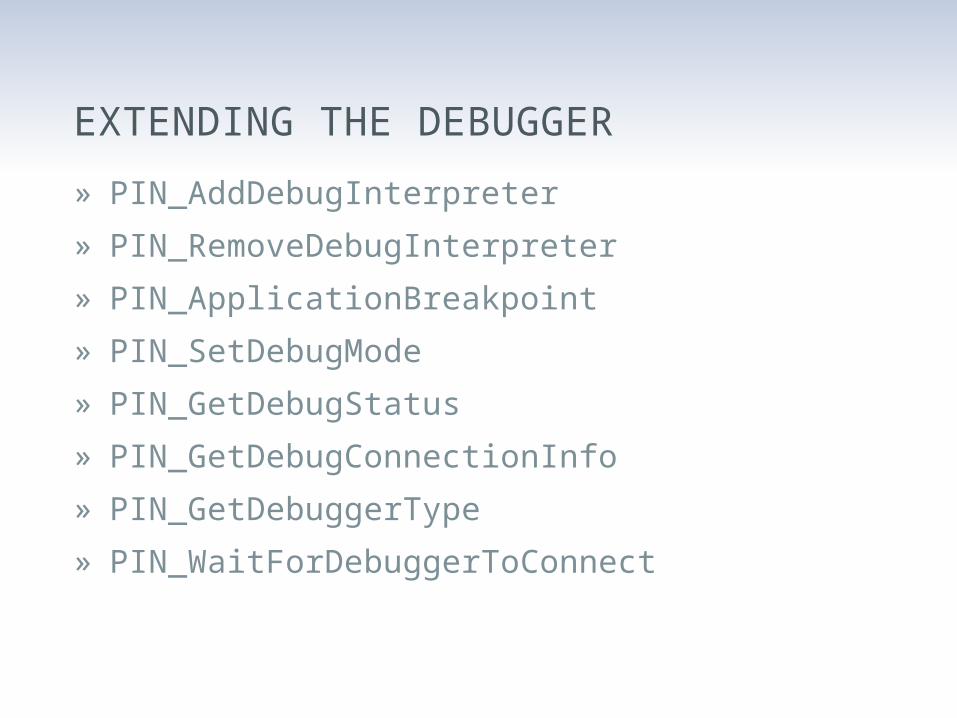
EXTENDING THE DEBUGGER
» PIN_AddDebugInterpreter
» PIN_RemoveDebugInterpreter
» PIN_ApplicationBreakpoint
» PIN_SetDebugMode
» PIN_GetDebugStatus
» PIN_GetDebugConnectionInfo
» PIN_GetDebuggerType
» PIN_WaitForDebuggerToConnect
SYMBOLS, FUNCTIONS & PROBESWe don’t want to concentrate on instructions all the time.
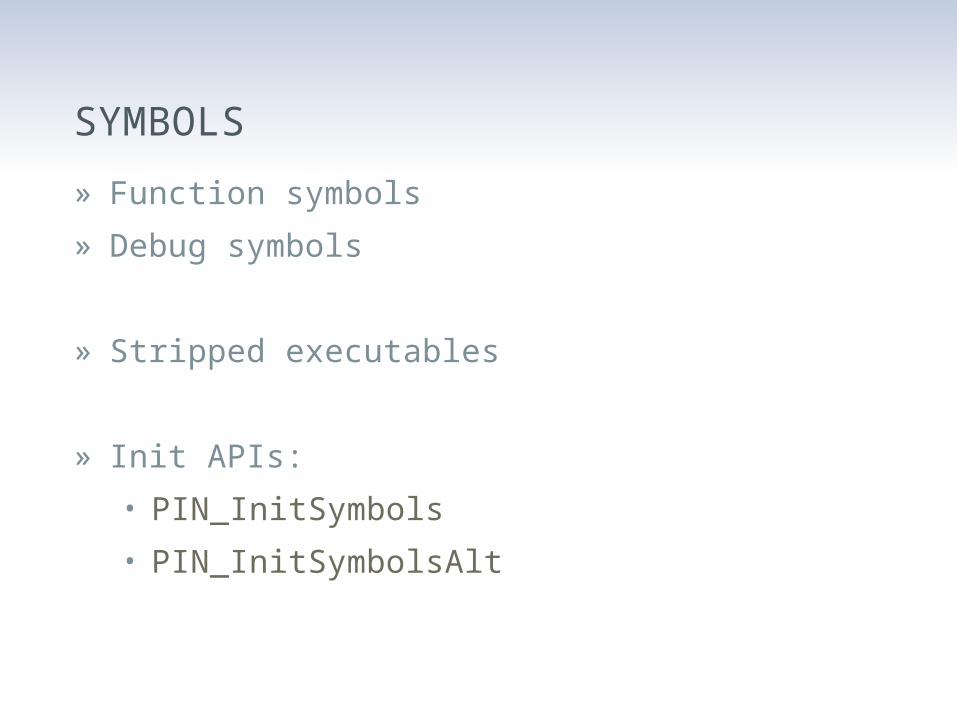
SYMBOLS
» Function symbols
» Debug symbols
» Stripped executables
» Init APIs:
• PIN_InitSymbols
• PIN_InitSymbolsAlt
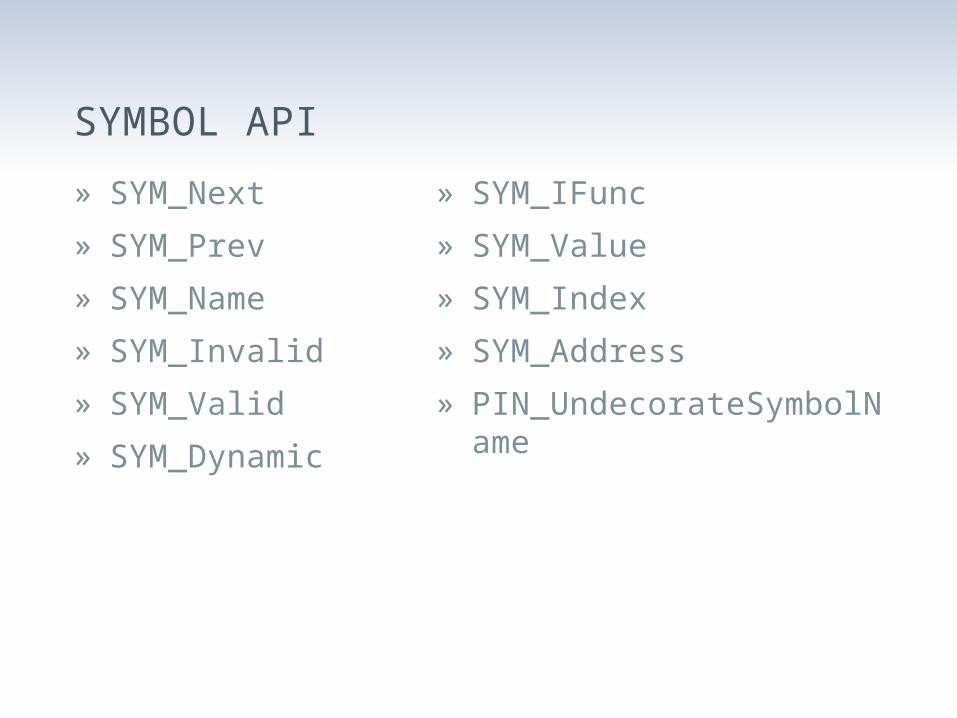
» SYM_Next
» SYM_Prev
» SYM_Name
» SYM_Invalid
» SYM_Valid
» SYM_Dynamic
» SYM_IFunc
» SYM_Value
» SYM_Index
» SYM_Address
» PIN_UndecorateSymbolName
SYMBOL API
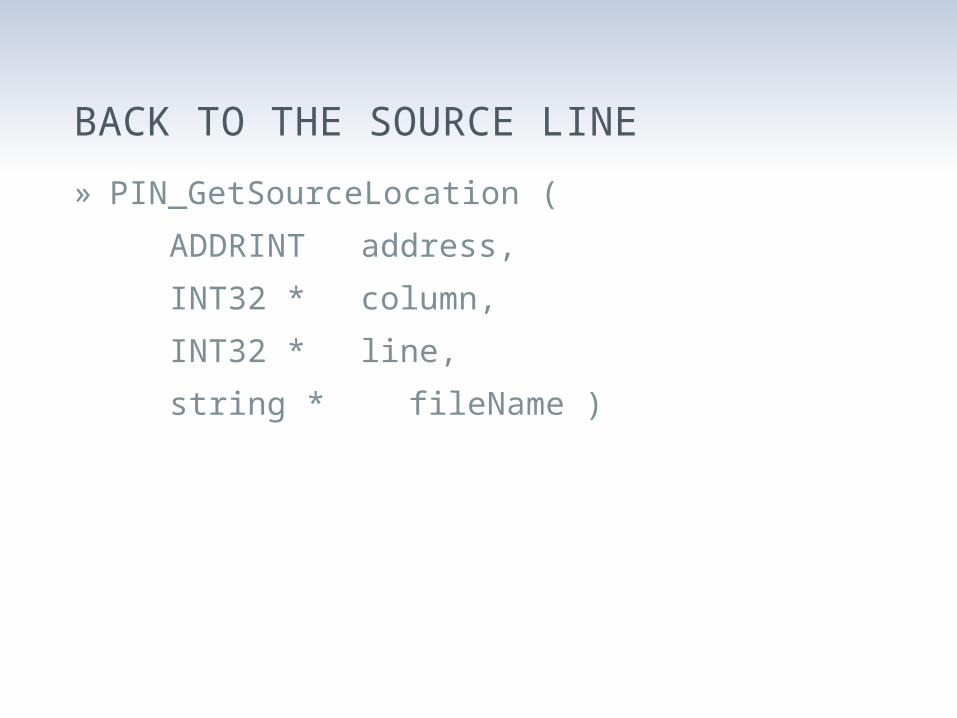
BACK TO THE SOURCE LINE
» PIN_GetSourceLocation (
ADDRINT address,
INT32 * column,
INT32 * line,
string * fileName )
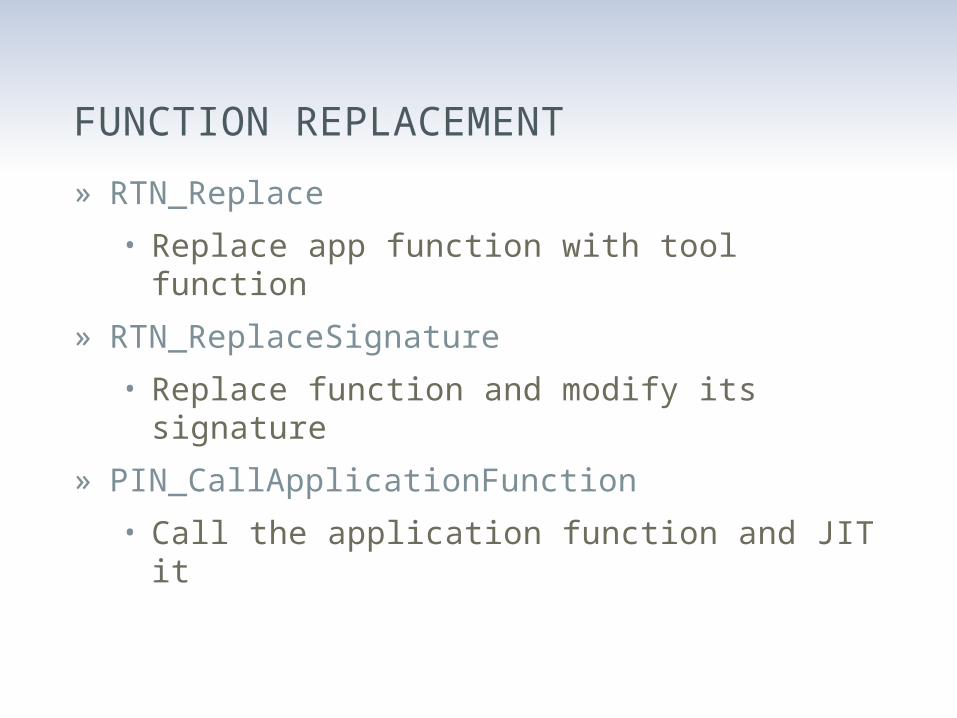
FUNCTION REPLACEMENT
» RTN_Replace
• Replace app function with tool function
» RTN_ReplaceSignature
• Replace function and modify its signature
» PIN_CallApplicationFunction
• Call the application function and JIT it
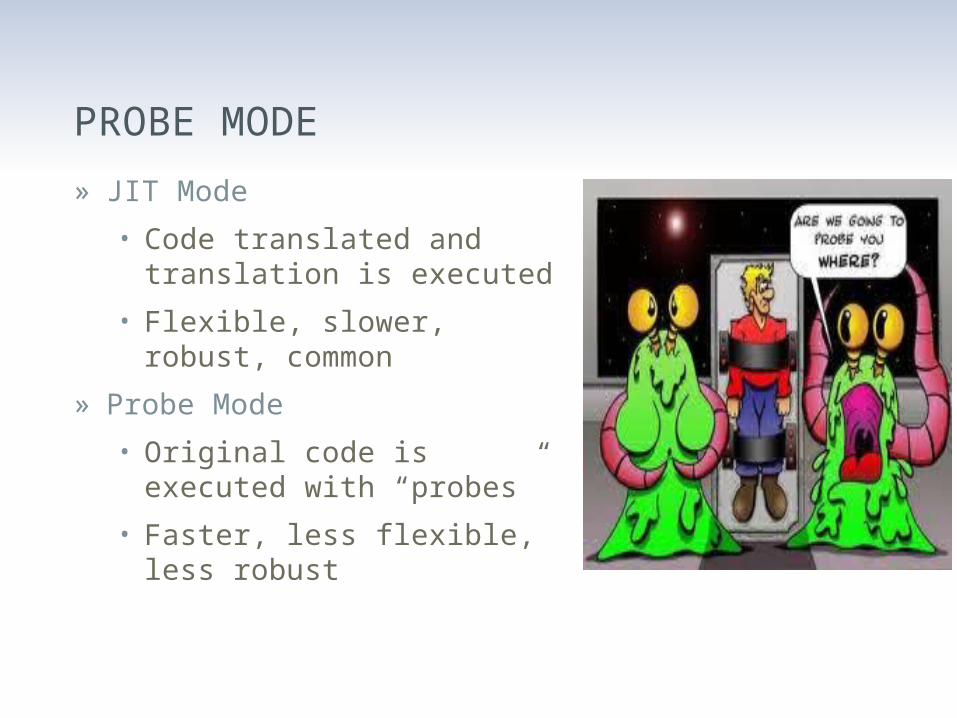
PROBE MODE
» JIT Mode
• Code translated and translation is executed
• Flexible, slower, robust, common
» Probe Mode
• Original code is executed with “probes”
• Faster, less flexible, less robust
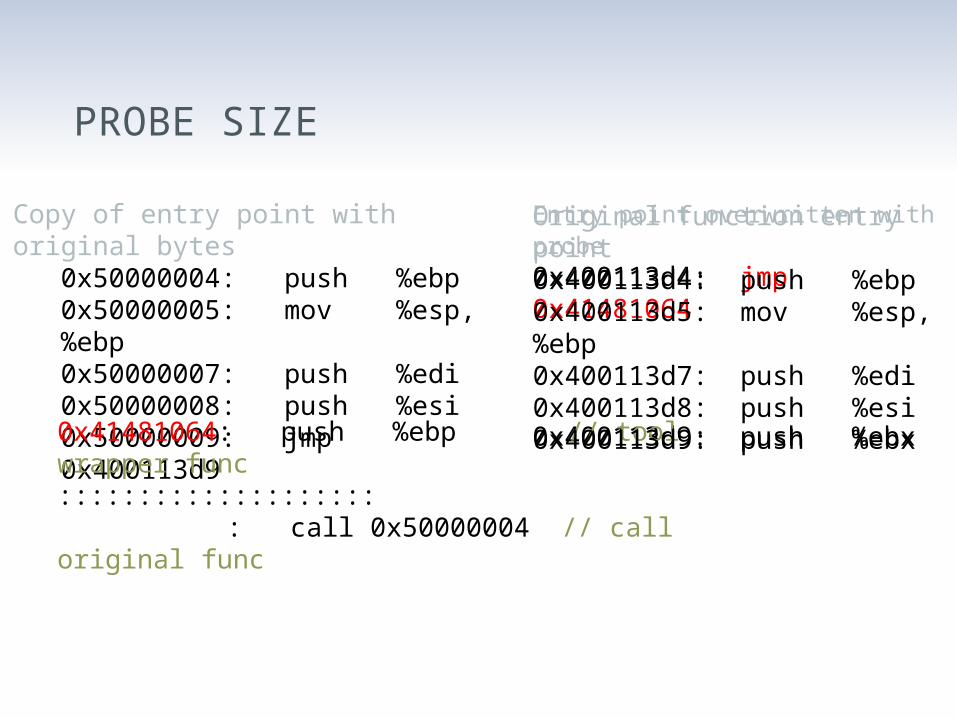
PROBE SIZE
Entry point overwritten with probe:0x400113d4: jmp 0x41481064
0x400113d9: push %ebx
Copy of entry point with original bytes:
0x50000004: push %ebp0x50000005: mov %esp,%ebp0x50000007: push %edi0x50000008: push %esi0x50000009: jmp 0x400113d90x41481064: push %ebp // tool wrapper func:::::::::::::::::::: 0x414827fe: call 0x50000004 // call original func
Original function entry point:0x400113d4: push %ebp0x400113d5: mov %esp,%ebp0x400113d7: push %edi0x400113d8: push %esi0x400113d9: push %ebx
OUT OF MEMORY FAULT INJECTION
» The following example will show how to use probe mode to randomly inject out of memory errors into programs
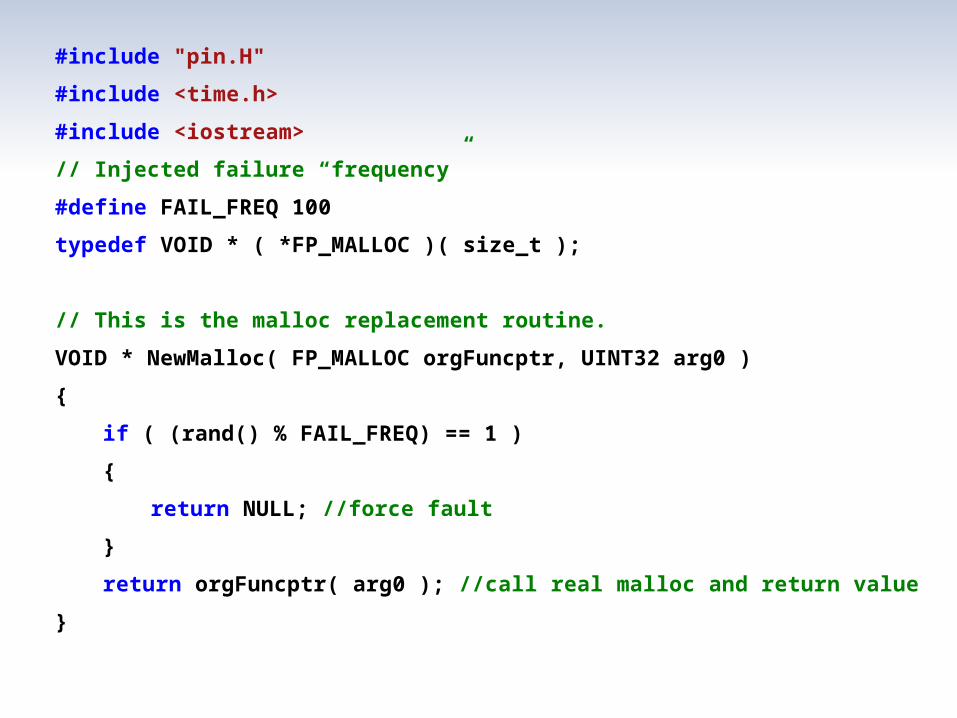
#include "pin.H"
#include <time.h>
#include <iostream>
// Injected failure “frequency”
#define FAIL_FREQ 100
typedef VOID * ( *FP_MALLOC )( size_t );
// This is the malloc replacement routine.
VOID * NewMalloc( FP_MALLOC orgFuncptr, UINT32 arg0 )
{
if ( (rand() % FAIL_FREQ) == 1 )
{
return NULL; //force fault
}
return orgFuncptr( arg0 ); //call real malloc and return value
}
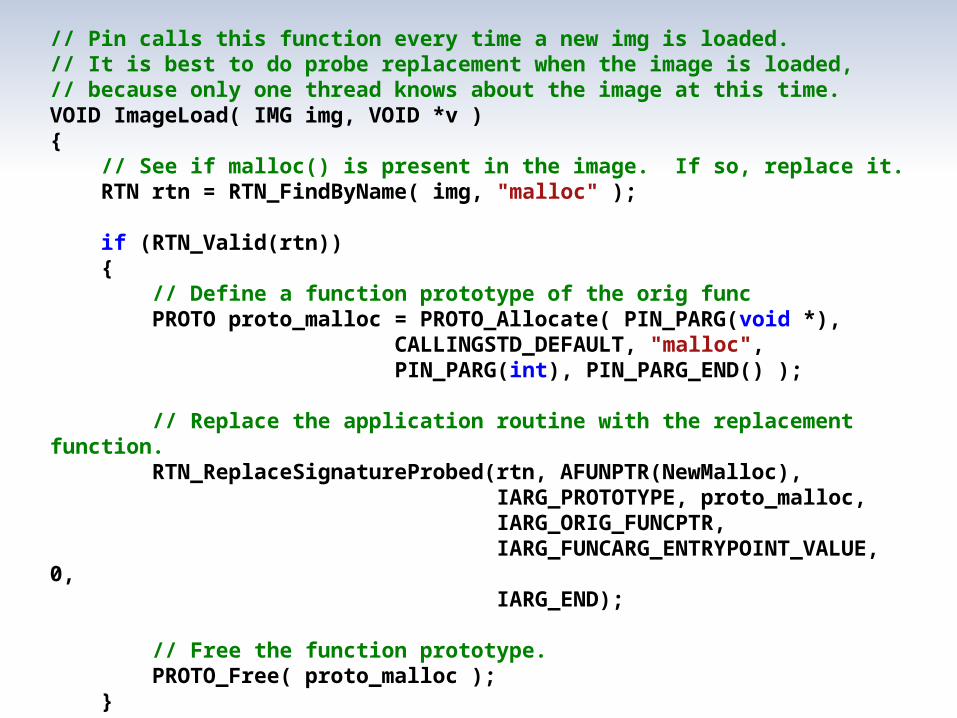
// Pin calls this function every time a new img is loaded.// It is best to do probe replacement when the image is loaded,// because only one thread knows about the image at this time.VOID ImageLoad( IMG img, VOID *v ){ // See if malloc() is present in the image. If so, replace it. RTN rtn = RTN_FindByName( img, "malloc" ); if (RTN_Valid(rtn)) { // Define a function prototype of the orig func PROTO proto_malloc = PROTO_Allocate( PIN_PARG(void *), CALLINGSTD_DEFAULT, "malloc", PIN_PARG(int), PIN_PARG_END() ); // Replace the application routine with the replacement function. RTN_ReplaceSignatureProbed(rtn, AFUNPTR(NewMalloc), IARG_PROTOTYPE, proto_malloc, IARG_ORIG_FUNCPTR, IARG_FUNCARG_ENTRYPOINT_VALUE, 0, IARG_END);
// Free the function prototype. PROTO_Free( proto_malloc ); }}
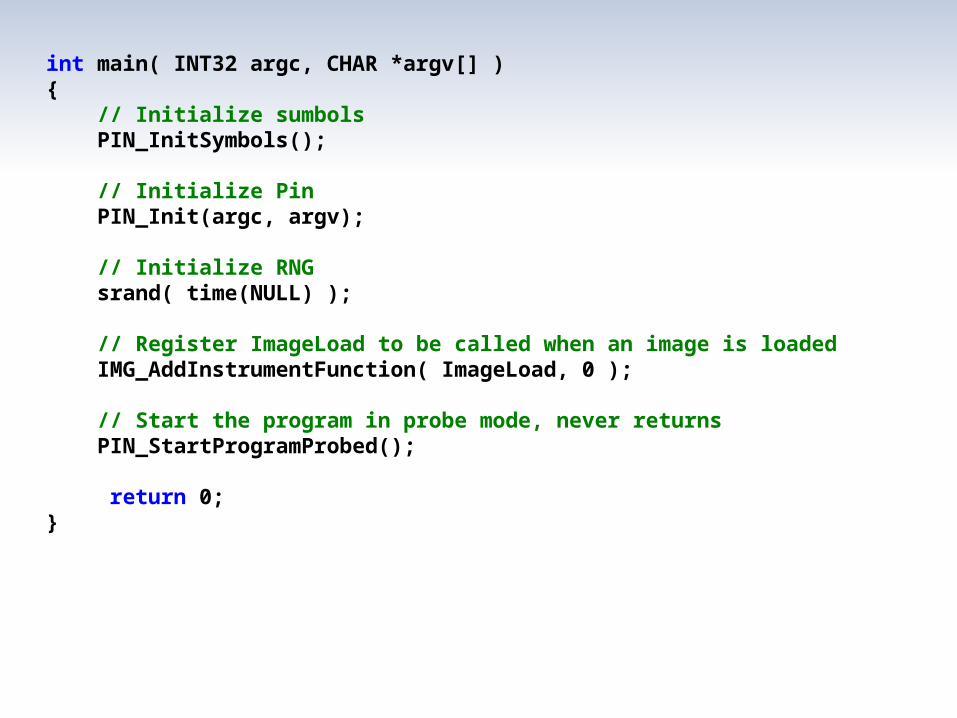
int main( INT32 argc, CHAR *argv[] ){ // Initialize sumbols PIN_InitSymbols();
// Initialize Pin PIN_Init(argc, argv);
// Initialize RNG srand( time(NULL) ); // Register ImageLoad to be called when an image is loaded IMG_AddInstrumentFunction( ImageLoad, 0 ); // Start the program in probe mode, never returns PIN_StartProgramProbed();
return 0;}
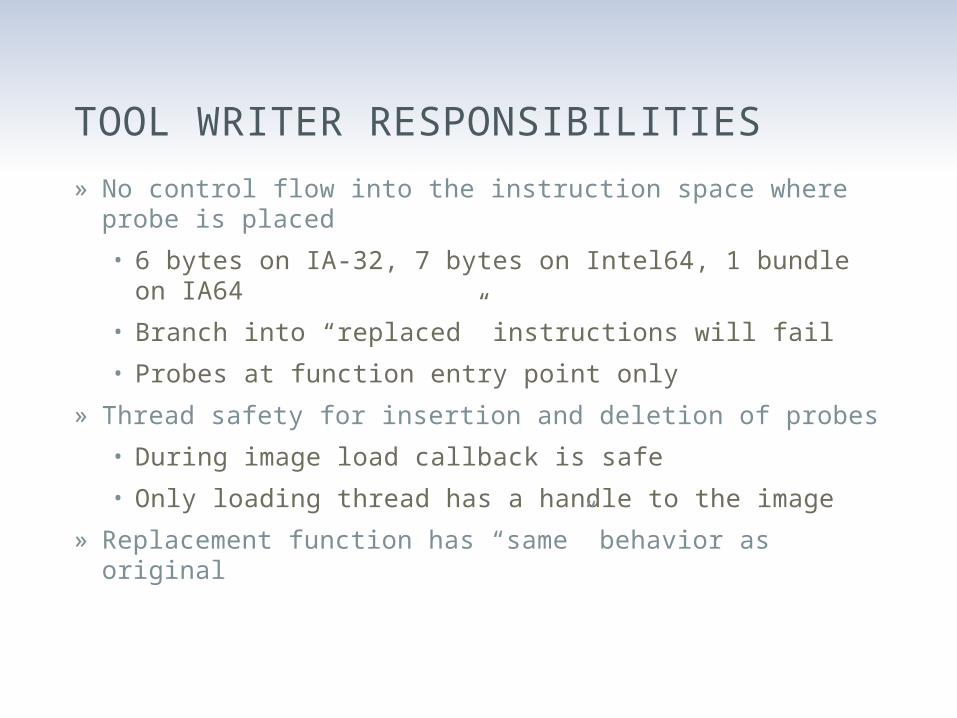
TOOL WRITER RESPONSIBILITIES
» No control flow into the instruction space where probe is placed
• 6 bytes on IA-32, 7 bytes on Intel64, 1 bundle on IA64
• Branch into “replaced” instructions will fail
• Probes at function entry point only
» Thread safety for insertion and deletion of probes
• During image load callback is safe
• Only loading thread has a handle to the image
» Replacement function has “same” behavior as original
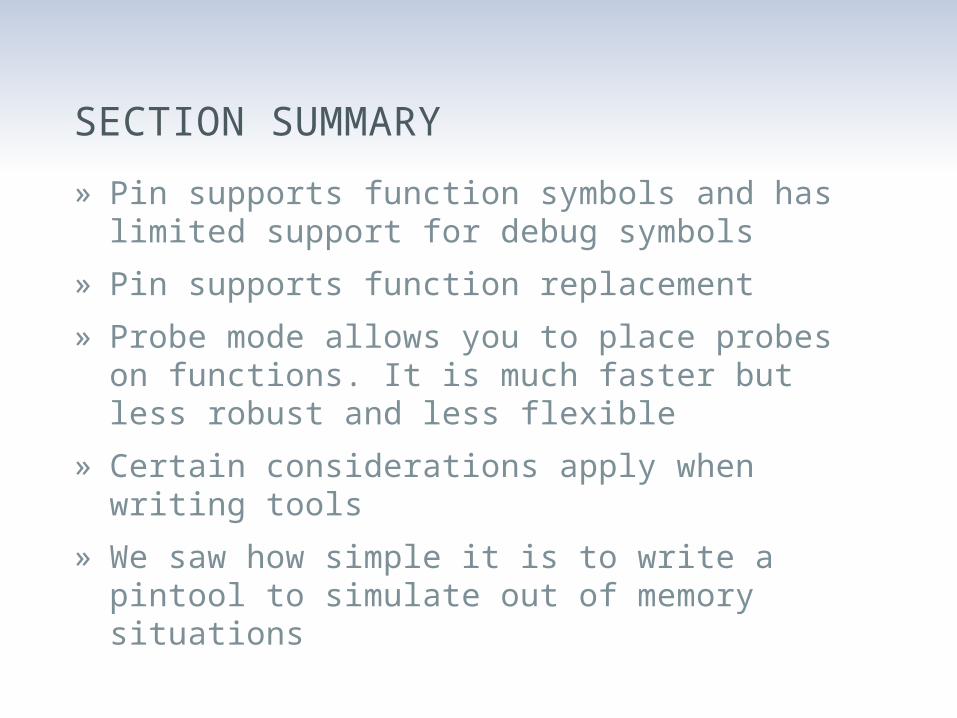
SECTION SUMMARY
» Pin supports function symbols and has limited support for debug symbols
» Pin supports function replacement
» Probe mode allows you to place probes on functions. It is much faster but less robust and less flexible
» Certain considerations apply when writing tools
» We saw how simple it is to write a pintool to simulate out of memory situations
ATTACHING AND DETACHINGWhen we can’t start the process ourselves
ATTACHING TO A RUNNING PROCESS
» Simply add “-pid <PID#>” command line option instead of giving a program at the end of command line
• pin –pid 12345 –t MyTool.so
» Related APIs:
• PIN_IsAttaching
• IMG_AddInstrumentFunction
• PIN_AddApplicationStartFunction
DETACHING
» Pin can also detach from the application
» Related APIs:
• PIN_Detach
• PIN_AddDetachFunction
DBI USAGESWhat is it good for?
WHAT NON-SECURITY PEOPLE USE DBI FOR
» Simulation / Emulation
» Performance analysis
» Correctness checking
» Memory debugging
» Parallel optimization
» Call graphs
» Collecting code metrics
» Automated debugging

WHAT DO WE WANT TO USE IT FOR?
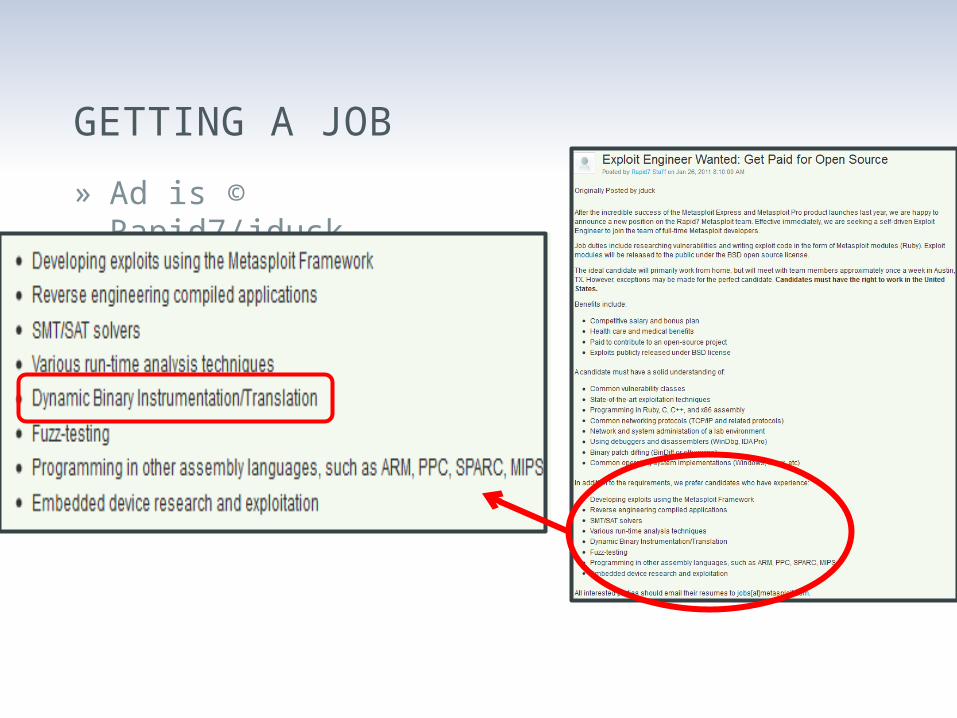
GETTING A JOB
» Ad is © Rapid7/jduck
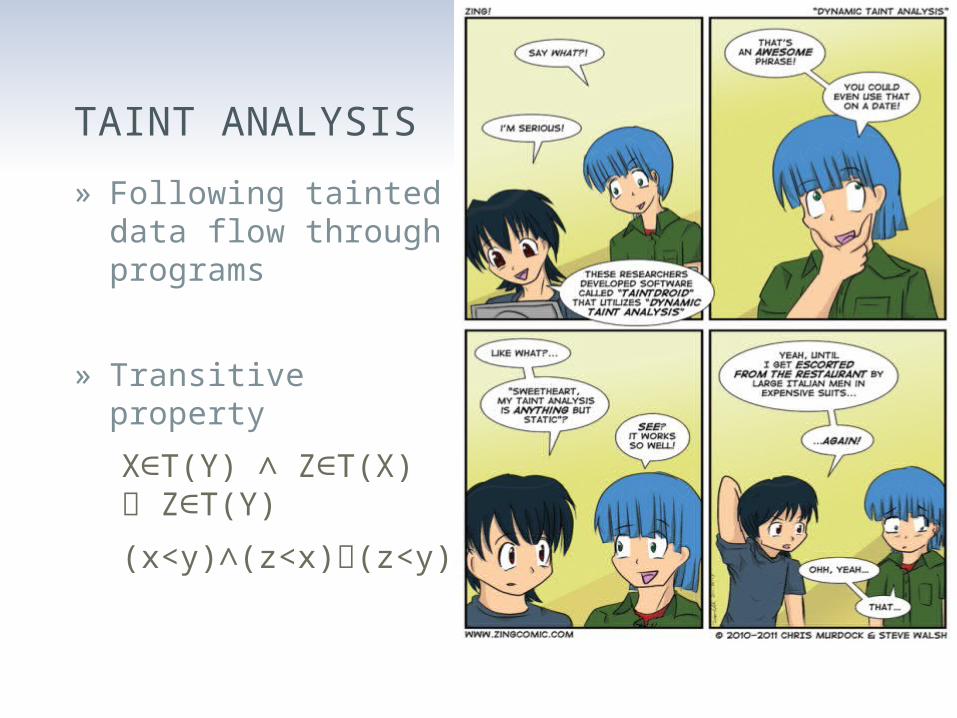
TAINT ANALYSIS
» Following tainted data flow through programs
» Transitive property
X T(Y) Z T(X)∈ ∧ ∈ Z T(Y)∈
(x<y) (z<x)∧ (z<y)
TAINT (DATA FLOW) ANALYSIS
» Data flow analysis
• Vulnerability research
• Privacy
» Malware analysis
» Unknown vulnerability detection
» Test case generation
» …
TAINT (DATA FLOW) ANALYSIS
» Edgar Barbosa in H2HC 2009
» Flayer
» Some programming languages have a taint mode
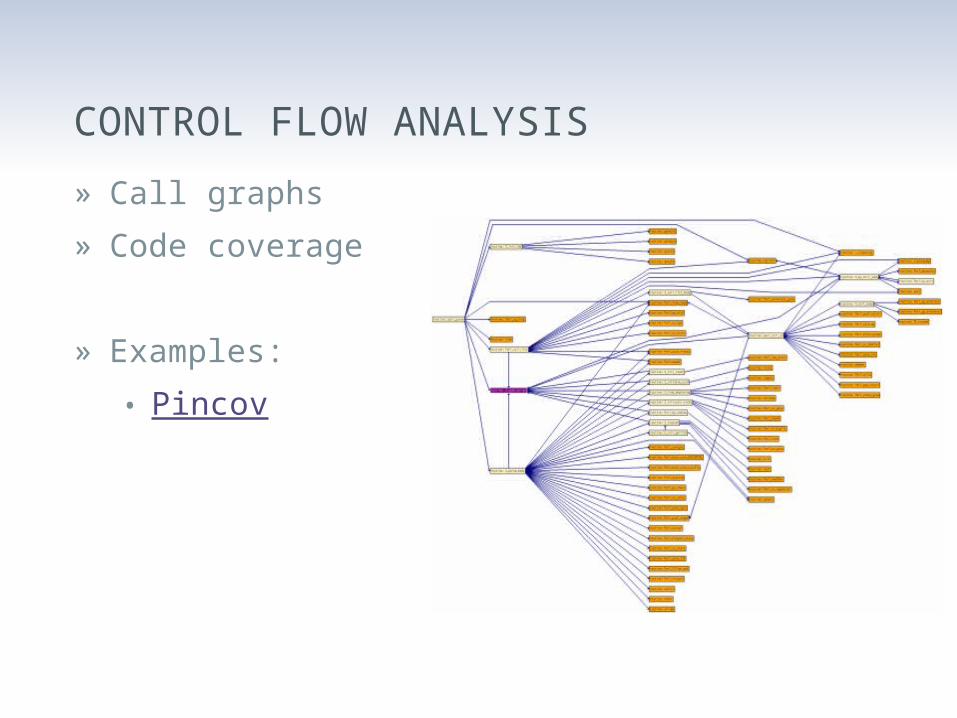
CONTROL FLOW ANALYSIS
» Call graphs
» Code coverage
» Examples:
• Pincov
PRIVACY MONITORING
» Relies on taint analysis
• Source = personal information
• Sink = external destination
» Examples:
• Taintdroid
• Privacy Scope
KNOWN VULNERABILITY DETECTION
» Detect exploitable condition
• Double free
• Race condition
• Dangling pointer
• Memory leak
UNKNOWN VULNERABILITY DETECTION
» Detect exploit behavior
• Overwriting a return address
• Corruption of meta-data
‒ E.g. Heap descriptors
• Execution of user data
• Overwrite of function pointers ?
VULNERABILITY DETECTION
» Examples:
• Intel ® Parallel Studio
• Determina
FUZZING / SECURITY TEST CASE GENERATION
» Feedback driven fuzzing
• Code coverage driven
‒ Corpus distillation
• Data coverage driven
‒ Haven’t seen it in the wild
• Constraints
• Evolutionary fuzzing
» Checkpointing
» In-memory fuzzing
» Event / Fault injection
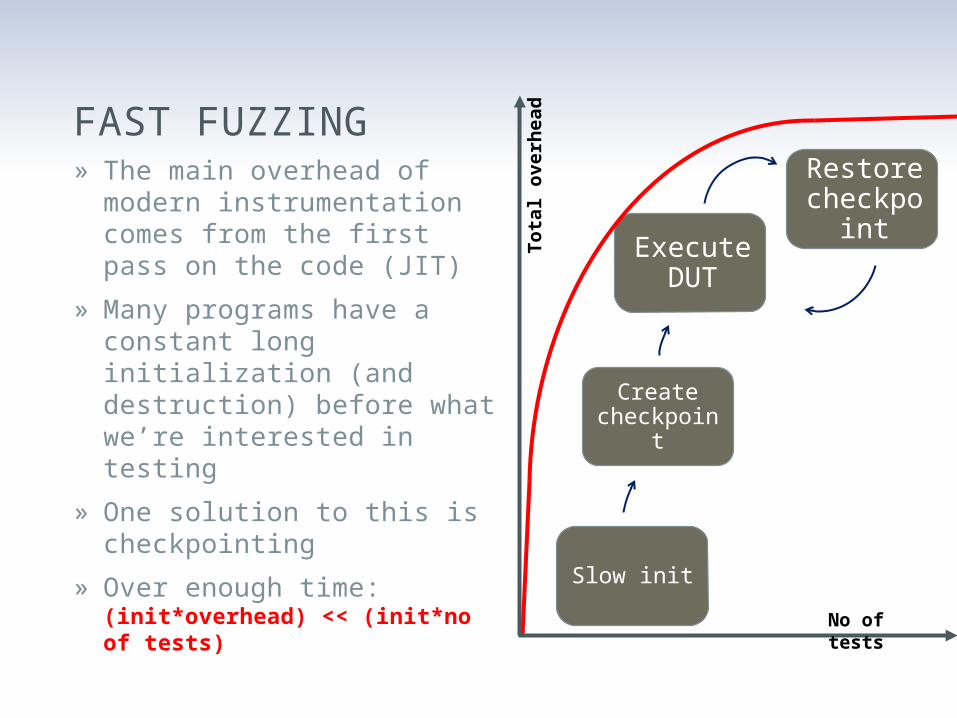
FAST FUZZING» The main overhead of
modern instrumentation comes from the first pass on the code (JIT)
» Many programs have a constant long initialization (and destruction) before what we’re interested in testing
» One solution to this is checkpointing
» Over enough time:(init*overhead) << (init*no of tests)
Execute DUT
Restore checkpoint
Slow init
Create checkpoint
Tot
al o
verh
ead
No of tests
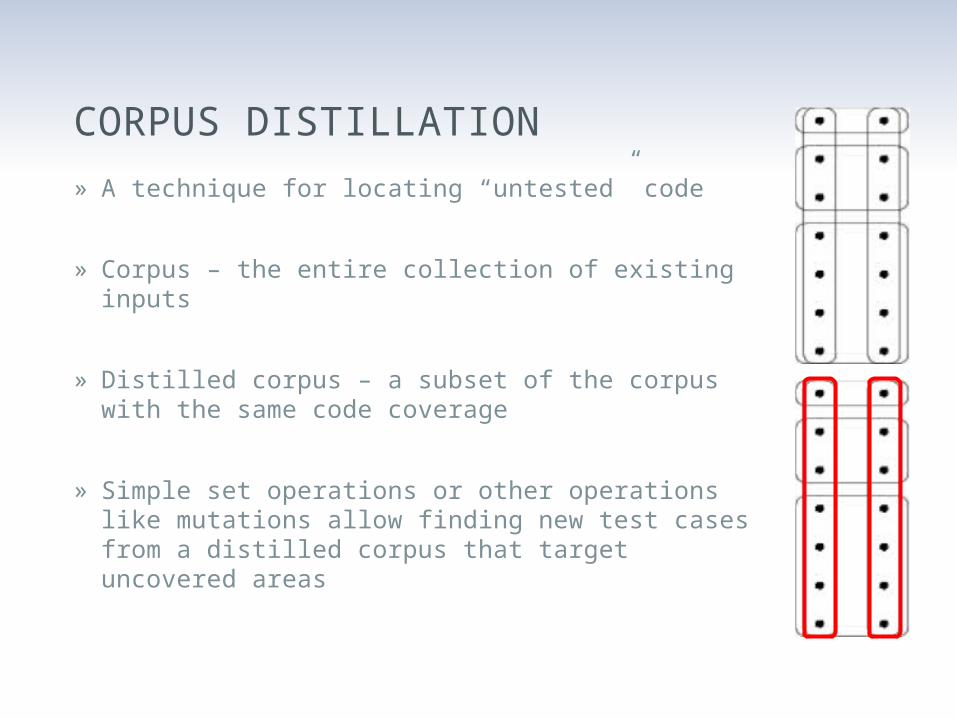
CORPUS DISTILLATION
» A technique for locating “untested” code
» Corpus – the entire collection of existing inputs
» Distilled corpus – a subset of the corpus with the same code coverage
» Simple set operations or other operations like mutations allow finding new test cases from a distilled corpus that target uncovered areas
ADVANCED MONITORING» Defining advanced restrictions on your program behavior
and detecting violations of those
» In particular applying vulnerability detection:
• Generic:
‒ Exploitable condition
‒ Exploitable behavior
• Specific:
‒ Illegal state or sequence of states
‒ Illegal values
‒ Illegal data-flow
‒ Illegal control-flowINTEL CONFIDENTIAL 70
FUZZING / SECURITY TEST CASE GENERATION
» Examples:
• Tavis Ormandy @ HITB’09
• Microsoft SAGE
AUTOMATED EXPLOIT DEVELOPMENT
» Known exploit techniques
» SAT/SMT
AUTOMATED VACCINATIONS
» Detecting attacks
» Introducing diversity
» Adaptive self-regenerative systems
» Examples:
• Sweeper
• GENESIS
PRE-PATCHING OF VULNERABILITIES
» Modify vulnerable binary code
» Insert additional checks
» Example:
• Determina LiveShield
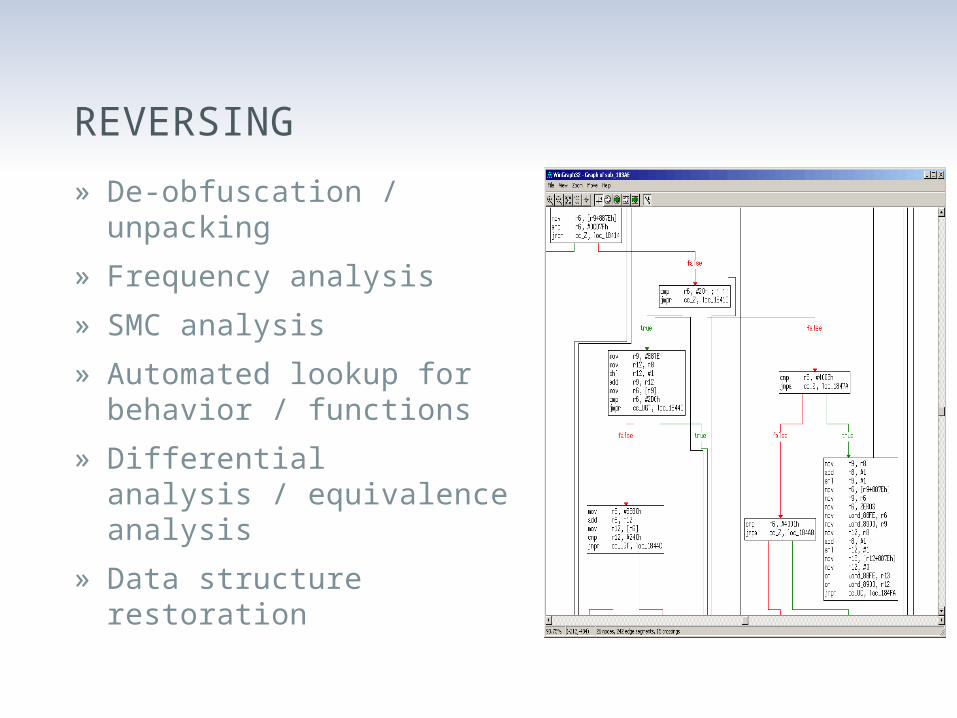
REVERSING
» De-obfuscation / unpacking
» Frequency analysis
» SMC analysis
» Automated lookup for behavior / functions
» Differential analysis / equivalence analysis
» Data structure restoration
REVERSING
» Examples:
• Covert debugging / Danny Quist & Valsmith @ BlackHat USA 2007
• Black Box Auditing Adobe Shockwave - Aaron Portnoy & Logan Brown
• tartetatintools
• Automated detection of cryptographic primitives
TRANSPARENT DEBUGGING
» Hiding from anti-debug techniques
» Anti-instrumentation
» Anti-anti instrumentation
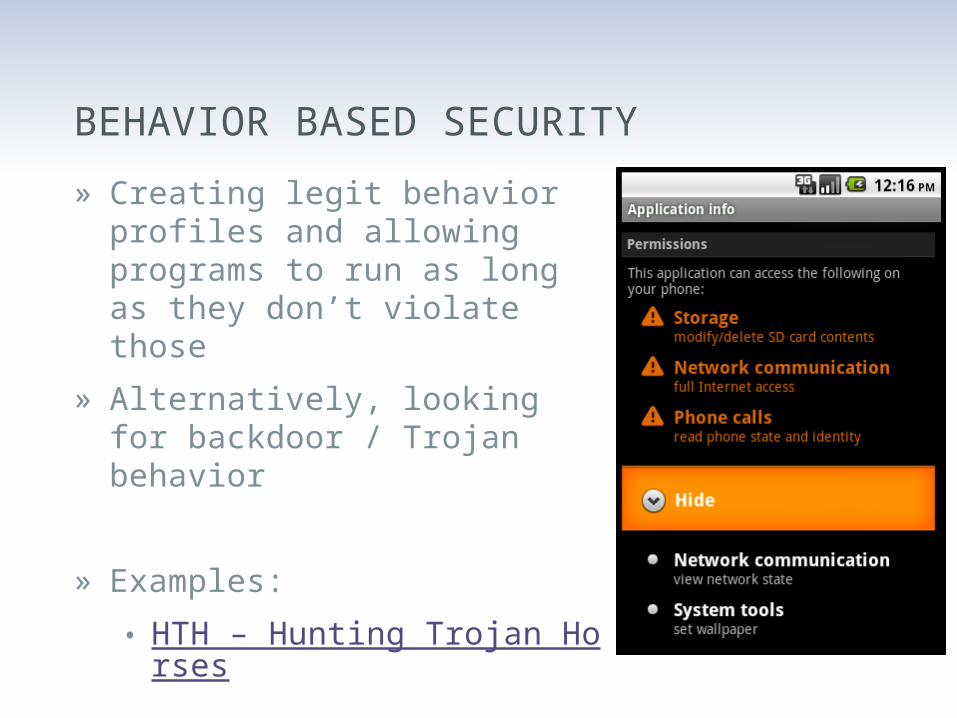
BEHAVIOR BASED SECURITY
» Creating legit behavior profiles and allowing programs to run as long as they don’t violate those
» Alternatively, looking for backdoor / Trojan behavior
» Examples:
• HTH – Hunting Trojan Horses
OTHER USAGES
» Vulnerability classification
» Anti-virus technologies
» Forcing security practices
• Adding stack cookies
• Forcing ASLR
» Sandboxing
» Forensics
SECTION SUMMARY
» Data & Control flow analysis
» Privacy
» Vulnerability detection
» Fuzzing
» Automated exploitation
» Reverse engineering & Transparent debugging
» Behavior based security
» Pre-patching
SECURITY PINTOOLSThe real deal
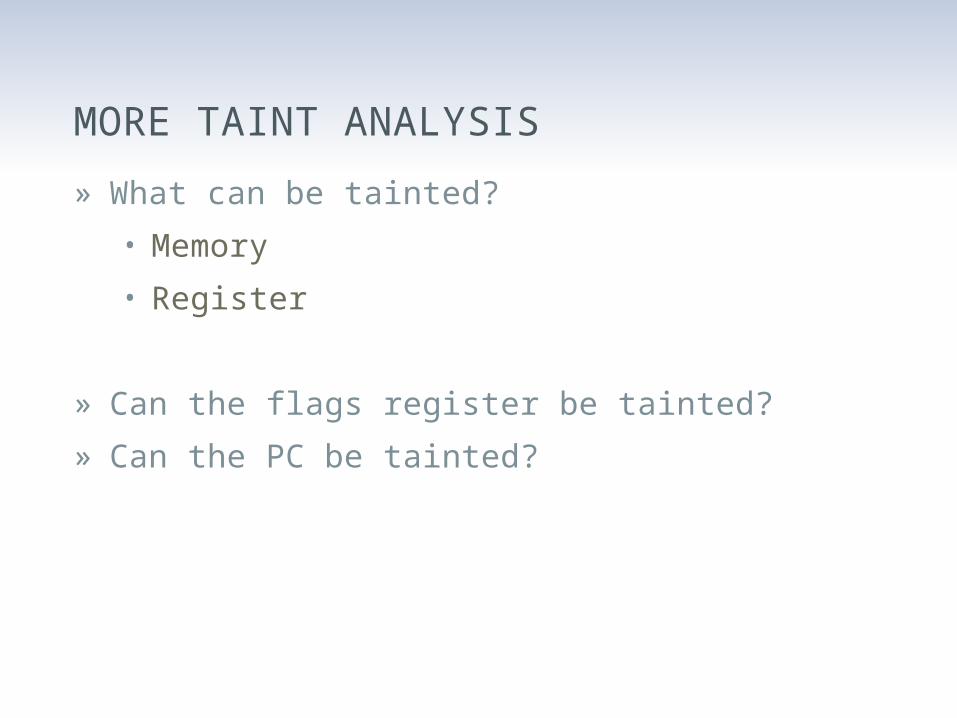
MORE TAINT ANALYSIS
» What can be tainted?
• Memory
• Register
» Can the flags register be tainted?
» Can the PC be tainted?
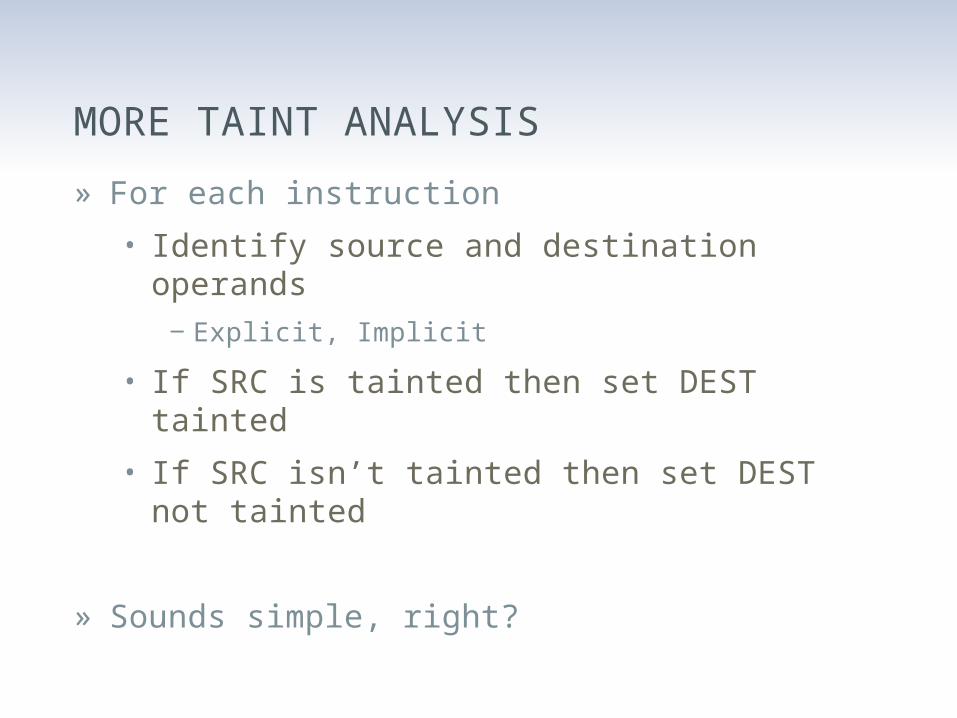
MORE TAINT ANALYSIS
» For each instruction
• Identify source and destination operands
‒ Explicit, Implicit
• If SRC is tainted then set DEST tainted
• If SRC isn’t tainted then set DEST not tainted
» Sounds simple, right?
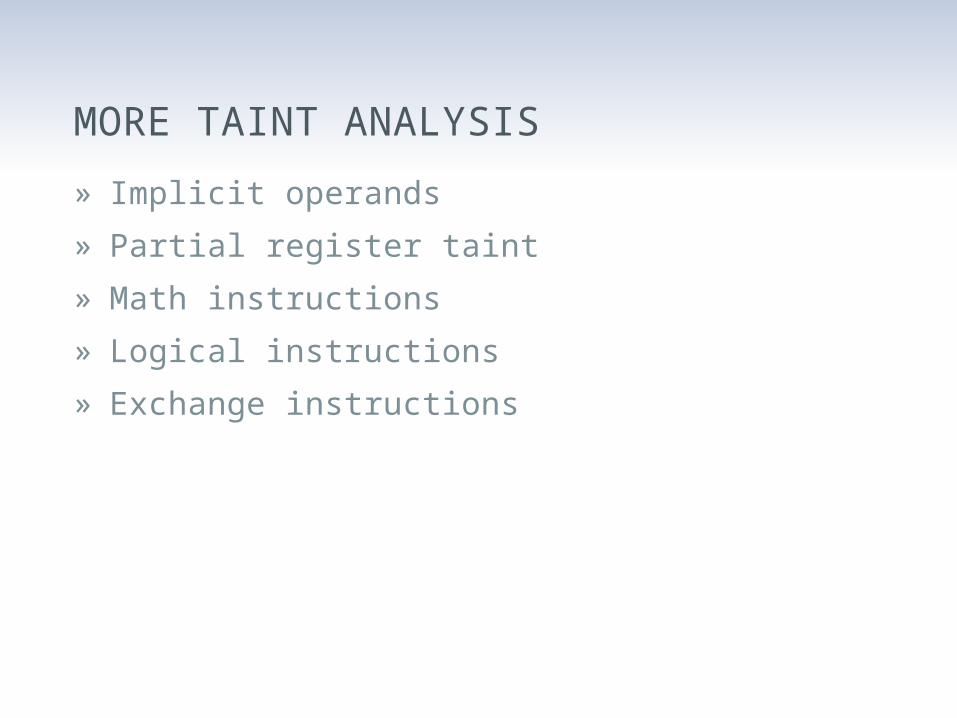
MORE TAINT ANALYSIS
» Implicit operands
» Partial register taint
» Math instructions
» Logical instructions
» Exchange instructions
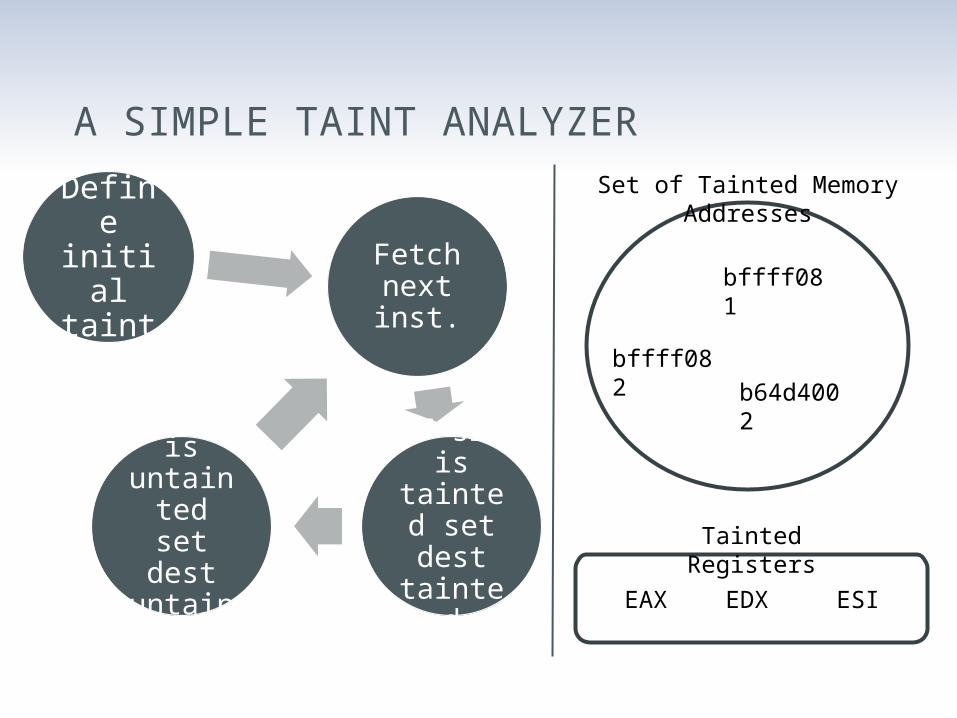
A SIMPLE TAINT ANALYZER
Set of Tainted Memory Addresses
Tainted Registers
Fetch next inst.
If src is tainted set
dest tainted
If src is untainted set dest
untainted
bffff081
bffff082
b64d4002
EAX EDX ESI
Define initial taint
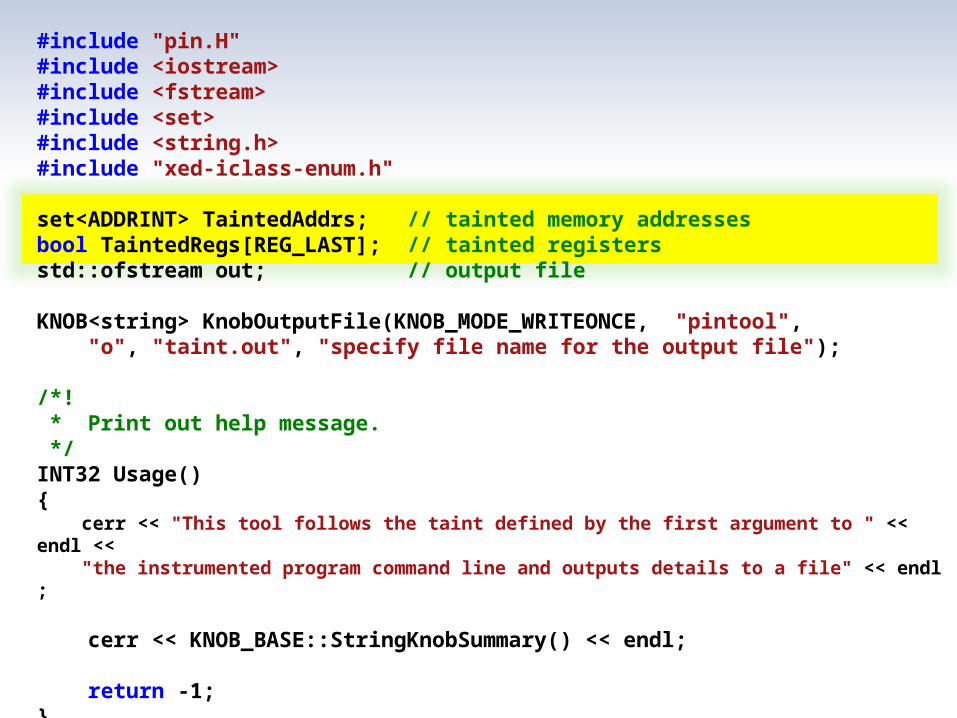
#include "pin.H"#include <iostream>#include <fstream>#include <set>#include <string.h>#include "xed-iclass-enum.h"
set<ADDRINT> TaintedAddrs; // tainted memory addressesbool TaintedRegs[REG_LAST]; // tainted registersstd::ofstream out; // output file
KNOB<string> KnobOutputFile(KNOB_MODE_WRITEONCE, "pintool", "o", "taint.out", "specify file name for the output file");
/*! * Print out help message. */INT32 Usage(){ cerr << "This tool follows the taint defined by the first argument to " << endl << "the instrumented program command line and outputs details to a file" << endl ;
cerr << KNOB_BASE::StringKnobSummary() << endl;
return -1;}
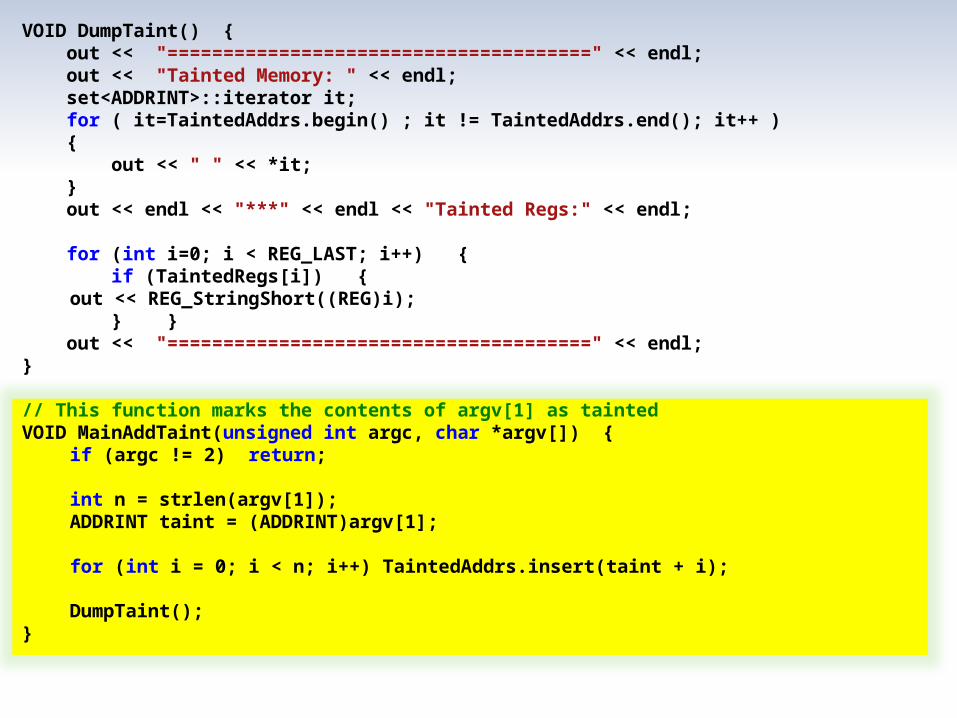
VOID DumpTaint() { out << "======================================" << endl; out << "Tainted Memory: " << endl; set<ADDRINT>::iterator it; for ( it=TaintedAddrs.begin() ; it != TaintedAddrs.end(); it++ ) { out << " " << *it; } out << endl << "***" << endl << "Tainted Regs:" << endl;
for (int i=0; i < REG_LAST; i++) { if (TaintedRegs[i]) {
out << REG_StringShort((REG)i); } } out << "======================================" << endl;}
// This function marks the contents of argv[1] as taintedVOID MainAddTaint(unsigned int argc, char *argv[]) {
if (argc != 2) return;
int n = strlen(argv[1]);ADDRINT taint = (ADDRINT)argv[1];
for (int i = 0; i < n; i++) TaintedAddrs.insert(taint + i);
DumpTaint();}
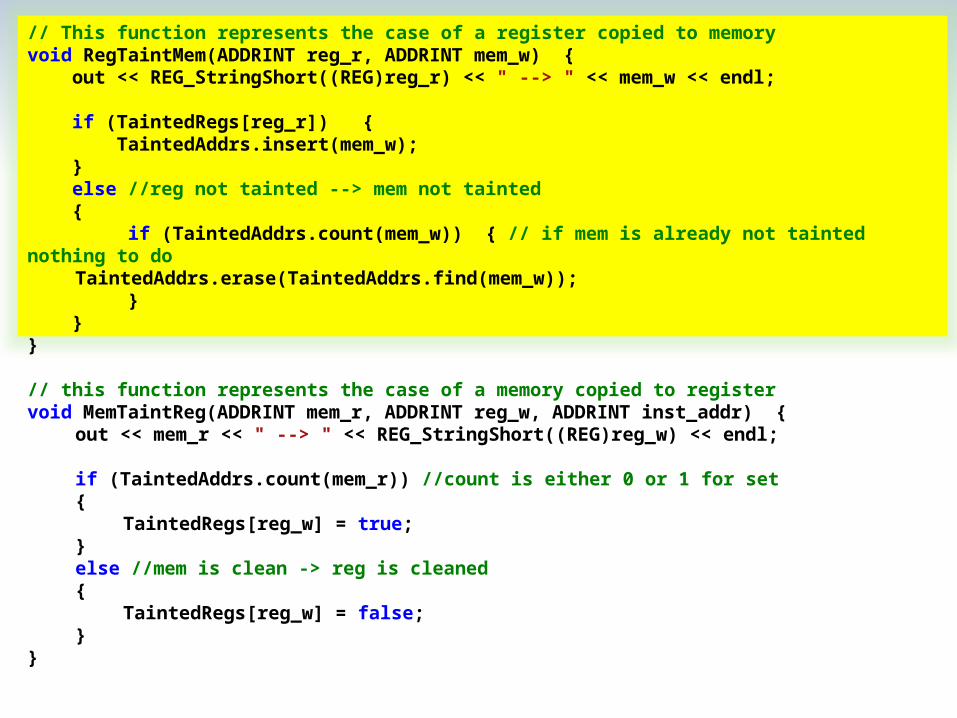
// This function represents the case of a register copied to memoryvoid RegTaintMem(ADDRINT reg_r, ADDRINT mem_w) { out << REG_StringShort((REG)reg_r) << " --> " << mem_w << endl;
if (TaintedRegs[reg_r]) { TaintedAddrs.insert(mem_w); } else //reg not tainted --> mem not tainted { if (TaintedAddrs.count(mem_w)) { // if mem is already not tainted nothing to do TaintedAddrs.erase(TaintedAddrs.find(mem_w)); } }}
// this function represents the case of a memory copied to registervoid MemTaintReg(ADDRINT mem_r, ADDRINT reg_w, ADDRINT inst_addr) {
out << mem_r << " --> " << REG_StringShort((REG)reg_w) << endl;
if (TaintedAddrs.count(mem_r)) //count is either 0 or 1 for set{
TaintedRegs[reg_w] = true;}else //mem is clean -> reg is cleaned{
TaintedRegs[reg_w] = false;}
}
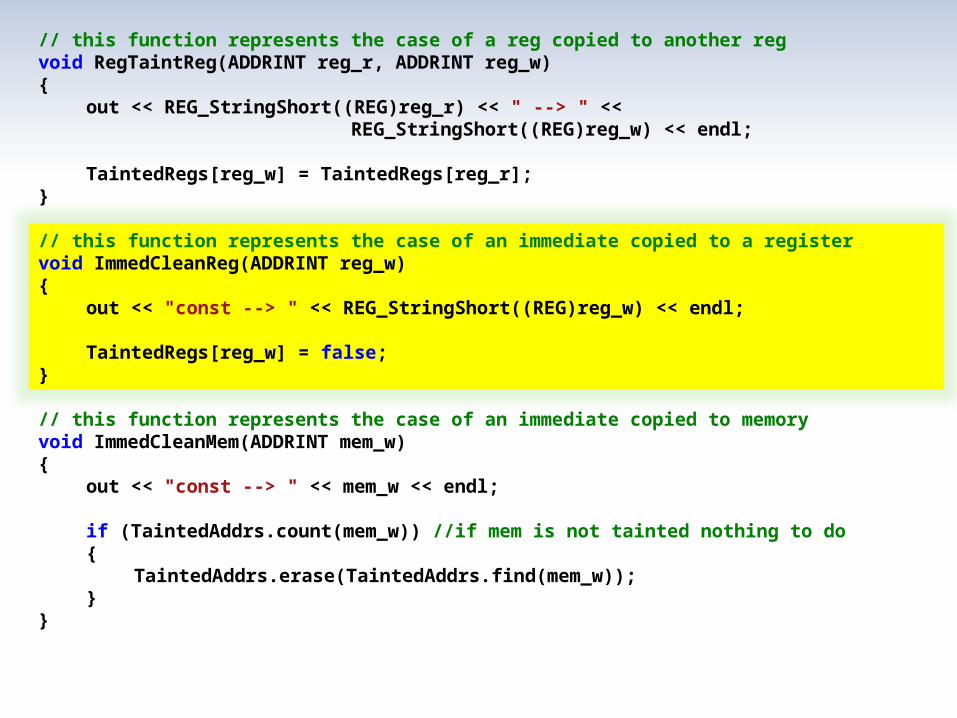
// this function represents the case of a reg copied to another regvoid RegTaintReg(ADDRINT reg_r, ADDRINT reg_w){
out << REG_StringShort((REG)reg_r) << " --> " << REG_StringShort((REG)reg_w) << endl;
TaintedRegs[reg_w] = TaintedRegs[reg_r];}
// this function represents the case of an immediate copied to a registervoid ImmedCleanReg(ADDRINT reg_w){
out << "const --> " << REG_StringShort((REG)reg_w) << endl;
TaintedRegs[reg_w] = false;}
// this function represents the case of an immediate copied to memoryvoid ImmedCleanMem(ADDRINT mem_w){
out << "const --> " << mem_w << endl;
if (TaintedAddrs.count(mem_w)) //if mem is not tainted nothing to do{
TaintedAddrs.erase(TaintedAddrs.find(mem_w));}
}
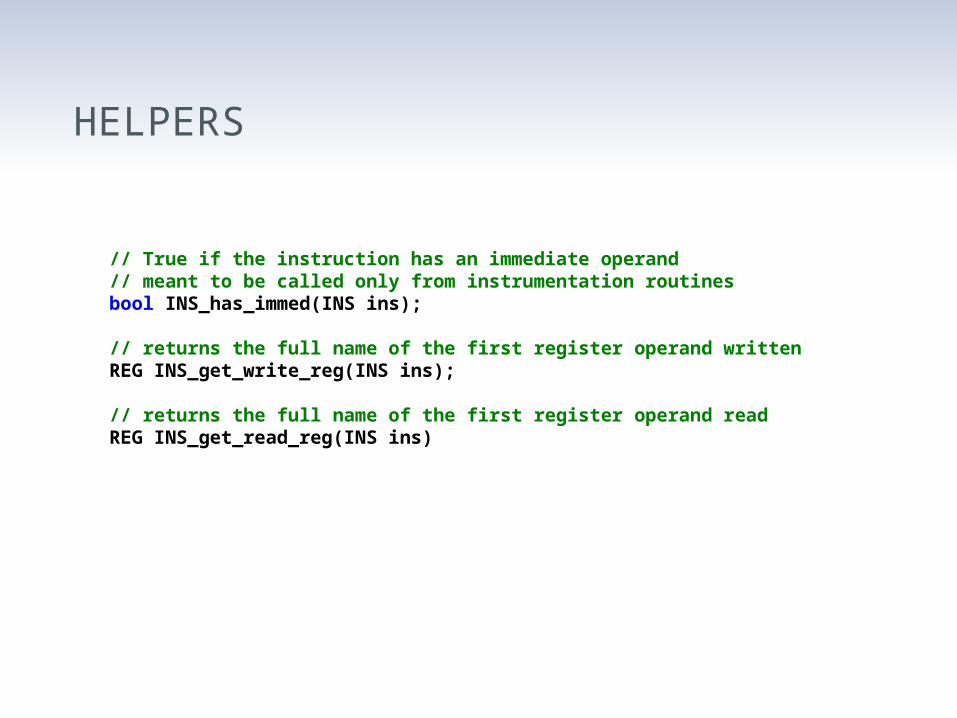
// True if the instruction has an immediate operand// meant to be called only from instrumentation routinesbool INS_has_immed(INS ins);
// returns the full name of the first register operand writtenREG INS_get_write_reg(INS ins);
// returns the full name of the first register operand readREG INS_get_read_reg(INS ins)
HELPERS
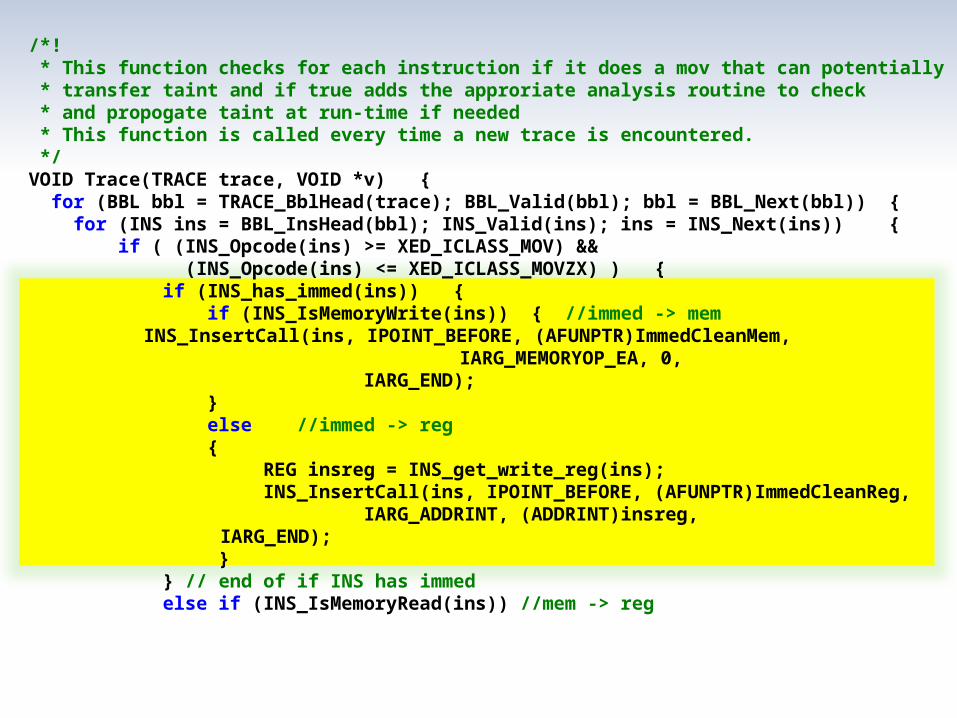
/*! * This function checks for each instruction if it does a mov that can potentially * transfer taint and if true adds the approriate analysis routine to check * and propogate taint at run-time if needed * This function is called every time a new trace is encountered. */VOID Trace(TRACE trace, VOID *v) { for (BBL bbl = TRACE_BblHead(trace); BBL_Valid(bbl); bbl = BBL_Next(bbl)) { for (INS ins = BBL_InsHead(bbl); INS_Valid(ins); ins = INS_Next(ins)) { if ( (INS_Opcode(ins) >= XED_ICLASS_MOV) && (INS_Opcode(ins) <= XED_ICLASS_MOVZX) ) { if (INS_has_immed(ins)) { if (INS_IsMemoryWrite(ins)) { //immed -> mem
INS_InsertCall(ins, IPOINT_BEFORE, (AFUNPTR)ImmedCleanMem, IARG_MEMORYOP_EA, 0, IARG_END);
} else //immed -> reg { REG insreg = INS_get_write_reg(ins); INS_InsertCall(ins, IPOINT_BEFORE, (AFUNPTR)ImmedCleanReg,
IARG_ADDRINT, (ADDRINT)insreg,IARG_END);
} } // end of if INS has immed else if (INS_IsMemoryRead(ins)) //mem -> reg
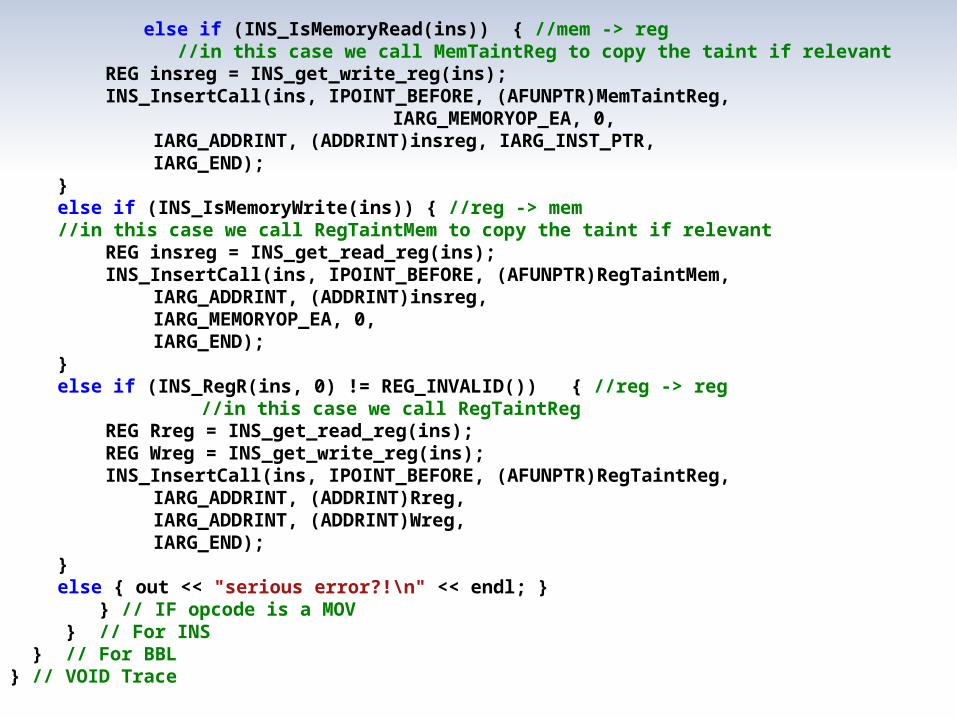
else if (INS_IsMemoryRead(ins)) { //mem -> reg //in this case we call MemTaintReg to copy the taint if relevant
REG insreg = INS_get_write_reg(ins);INS_InsertCall(ins, IPOINT_BEFORE, (AFUNPTR)MemTaintReg,
IARG_MEMORYOP_EA, 0,IARG_ADDRINT, (ADDRINT)insreg, IARG_INST_PTR,IARG_END);
}else if (INS_IsMemoryWrite(ins)) { //reg -> mem //in this case we call RegTaintMem to copy the taint if relevant
REG insreg = INS_get_read_reg(ins); INS_InsertCall(ins, IPOINT_BEFORE, (AFUNPTR)RegTaintMem,
IARG_ADDRINT, (ADDRINT)insreg,IARG_MEMORYOP_EA, 0,IARG_END);
}else if (INS_RegR(ins, 0) != REG_INVALID()) { //reg -> reg
//in this case we call RegTaintRegREG Rreg = INS_get_read_reg(ins); REG Wreg = INS_get_write_reg(ins); INS_InsertCall(ins, IPOINT_BEFORE, (AFUNPTR)RegTaintReg,
IARG_ADDRINT, (ADDRINT)Rreg,IARG_ADDRINT, (ADDRINT)Wreg,IARG_END);
}else { out << "serious error?!\n" << endl; }
} // IF opcode is a MOV } // For INS } // For BBL} // VOID Trace
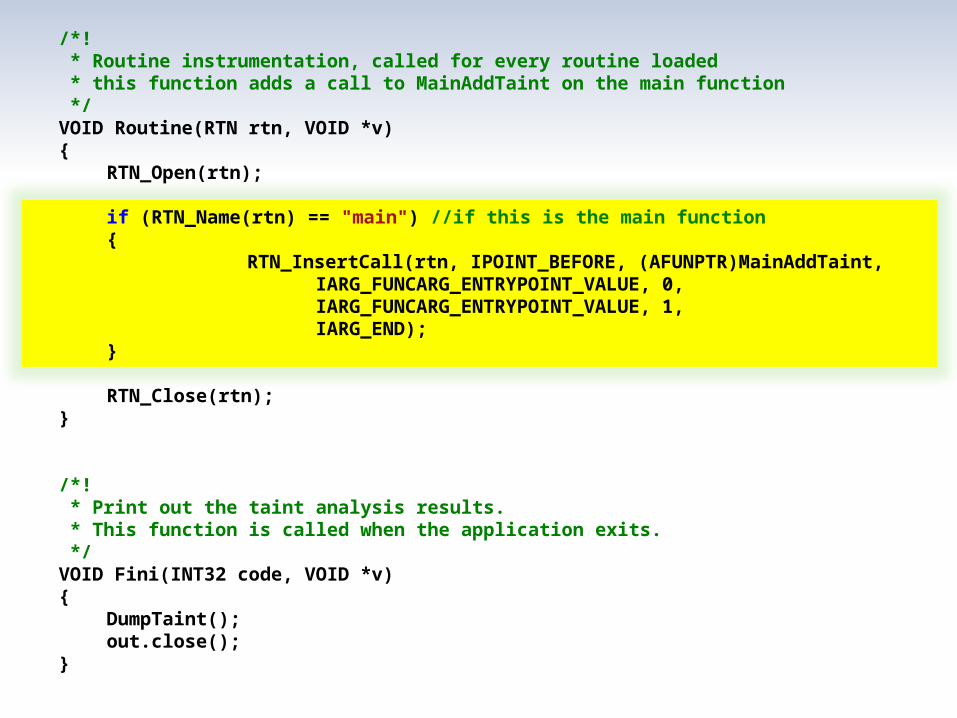
/*! * Routine instrumentation, called for every routine loaded * this function adds a call to MainAddTaint on the main function */VOID Routine(RTN rtn, VOID *v){
RTN_Open(rtn);
if (RTN_Name(rtn) == "main") //if this is the main function{
RTN_InsertCall(rtn, IPOINT_BEFORE, (AFUNPTR)MainAddTaint, IARG_FUNCARG_ENTRYPOINT_VALUE, 0, IARG_FUNCARG_ENTRYPOINT_VALUE, 1, IARG_END); }
RTN_Close(rtn);}
/*! * Print out the taint analysis results. * This function is called when the application exits. */VOID Fini(INT32 code, VOID *v){
DumpTaint();out.close();
}
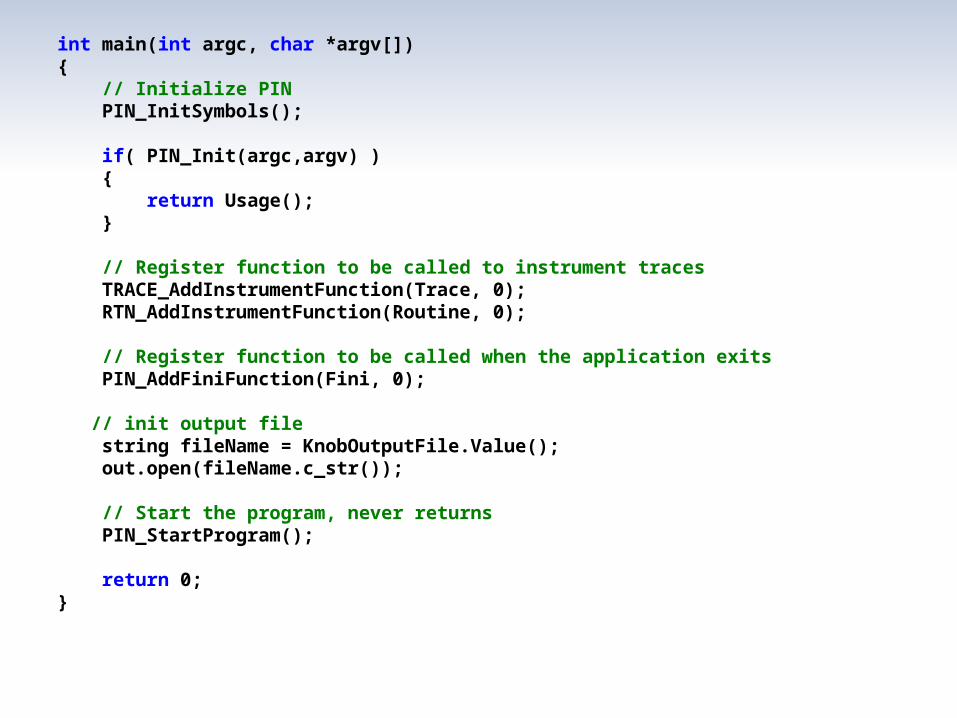
int main(int argc, char *argv[]){ // Initialize PIN PIN_InitSymbols();
if( PIN_Init(argc,argv) ) { return Usage(); } // Register function to be called to instrument traces TRACE_AddInstrumentFunction(Trace, 0); RTN_AddInstrumentFunction(Routine, 0);
// Register function to be called when the application exits PIN_AddFiniFunction(Fini, 0); // init output file string fileName = KnobOutputFile.Value(); out.open(fileName.c_str());
// Start the program, never returns PIN_StartProgram(); return 0;}
TAINT VISUALIZATION
» Do we need to visualize registers?
» How to visualize memory?
» Is the PC important?
RETURN ADDRESS PROTECTION
» Detecting return address overwrites for functions in a certain binary
» Before function: save the expected return address
» After function: check that the return address was not modified
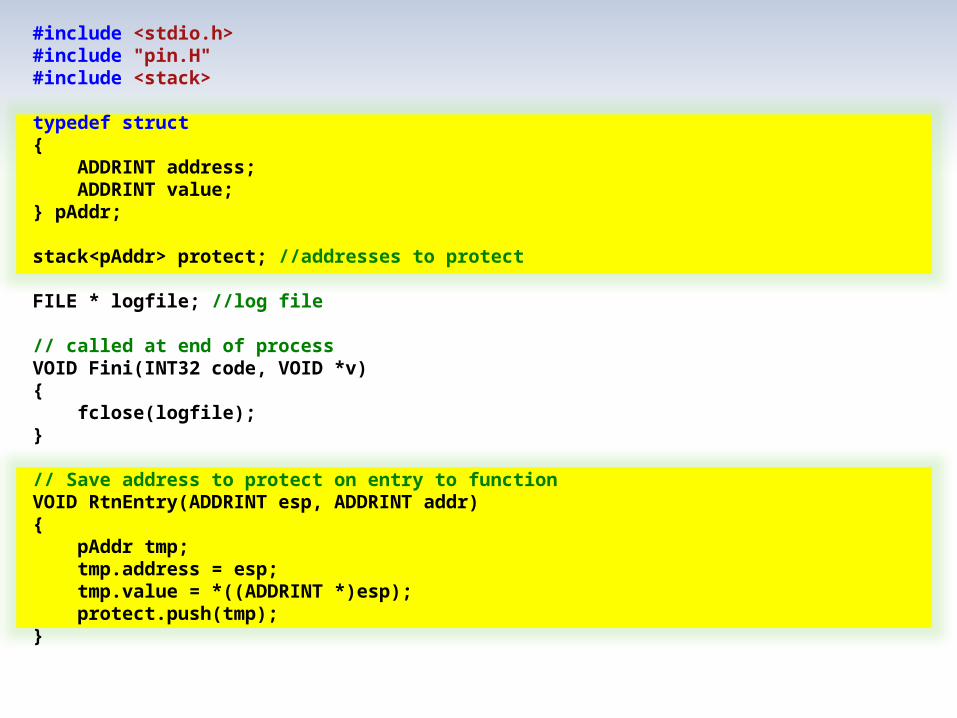
#include <stdio.h>#include "pin.H"#include <stack>
typedef struct{ ADDRINT address; ADDRINT value;} pAddr;
stack<pAddr> protect; //addresses to protect
FILE * logfile; //log file
// called at end of processVOID Fini(INT32 code, VOID *v){ fclose(logfile);}
// Save address to protect on entry to functionVOID RtnEntry(ADDRINT esp, ADDRINT addr){ pAddr tmp; tmp.address = esp; tmp.value = *((ADDRINT *)esp); protect.push(tmp);}
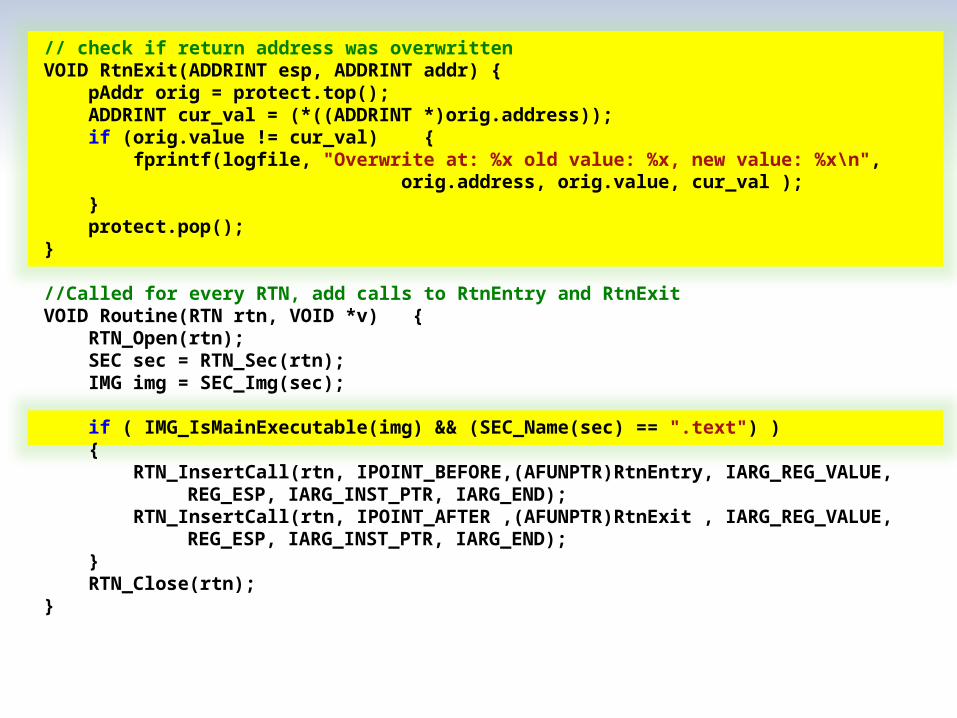
// check if return address was overwrittenVOID RtnExit(ADDRINT esp, ADDRINT addr) { pAddr orig = protect.top(); ADDRINT cur_val = (*((ADDRINT *)orig.address)); if (orig.value != cur_val) { fprintf(logfile, "Overwrite at: %x old value: %x, new value: %x\n", orig.address, orig.value, cur_val ); } protect.pop();}
//Called for every RTN, add calls to RtnEntry and RtnExitVOID Routine(RTN rtn, VOID *v) { RTN_Open(rtn); SEC sec = RTN_Sec(rtn); IMG img = SEC_Img(sec);
if ( IMG_IsMainExecutable(img) && (SEC_Name(sec) == ".text") ) { RTN_InsertCall(rtn, IPOINT_BEFORE,(AFUNPTR)RtnEntry, IARG_REG_VALUE,
REG_ESP, IARG_INST_PTR, IARG_END); RTN_InsertCall(rtn, IPOINT_AFTER ,(AFUNPTR)RtnExit , IARG_REG_VALUE,
REG_ESP, IARG_INST_PTR, IARG_END); } RTN_Close(rtn);}
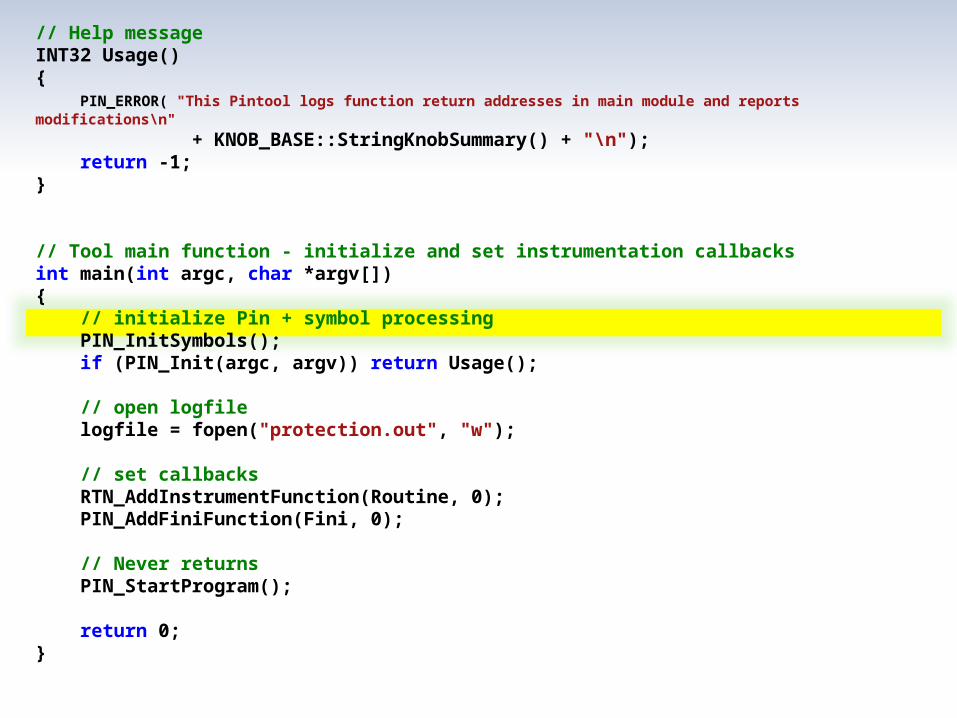
// Help messageINT32 Usage(){ PIN_ERROR( "This Pintool logs function return addresses in main module and reports modifications\n"
+ KNOB_BASE::StringKnobSummary() + "\n"); return -1;}
// Tool main function - initialize and set instrumentation callbacksint main(int argc, char *argv[]){ // initialize Pin + symbol processing PIN_InitSymbols(); if (PIN_Init(argc, argv)) return Usage();
// open logfile logfile = fopen("protection.out", "w");
// set callbacks RTN_AddInstrumentFunction(Routine, 0); PIN_AddFiniFunction(Fini, 0);
// Never returns PIN_StartProgram(); return 0;}

AUTOMATED EXPLOITATION
» This program is the bastard son of the previous two examples
» It relies on the ability to find the source of the taint to connect the taint to the input
» This PinTool creates a log we can use to exploit the program
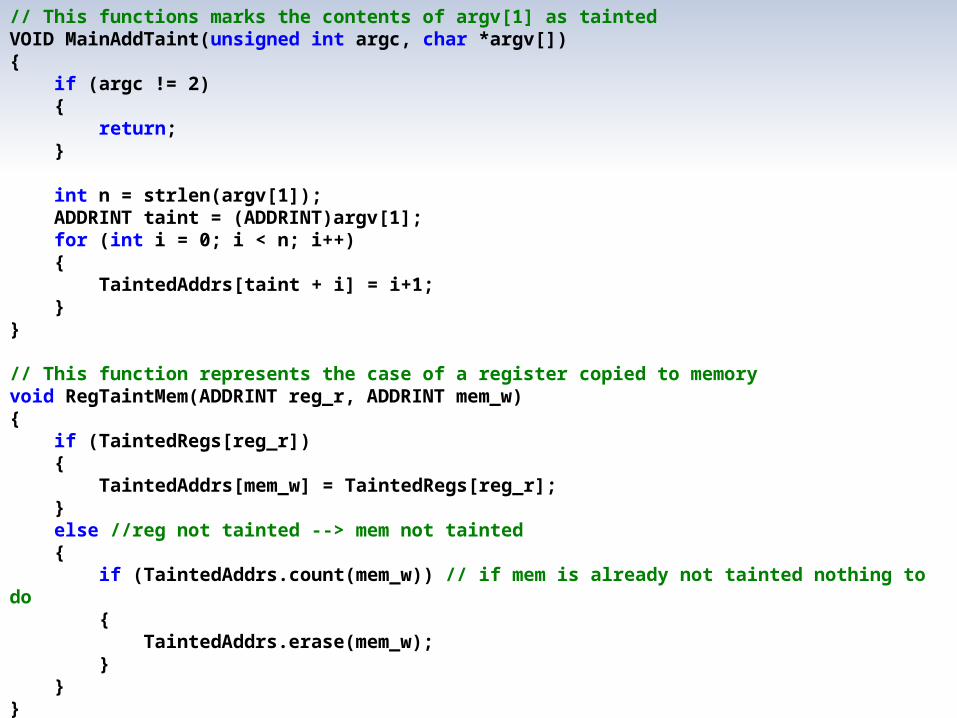
// This functions marks the contents of argv[1] as taintedVOID MainAddTaint(unsigned int argc, char *argv[]){ if (argc != 2) { return; }
int n = strlen(argv[1]); ADDRINT taint = (ADDRINT)argv[1]; for (int i = 0; i < n; i++) { TaintedAddrs[taint + i] = i+1; }}
// This function represents the case of a register copied to memoryvoid RegTaintMem(ADDRINT reg_r, ADDRINT mem_w){ if (TaintedRegs[reg_r]) { TaintedAddrs[mem_w] = TaintedRegs[reg_r]; } else //reg not tainted --> mem not tainted { if (TaintedAddrs.count(mem_w)) // if mem is already not tainted nothing to do { TaintedAddrs.erase(mem_w); } }}
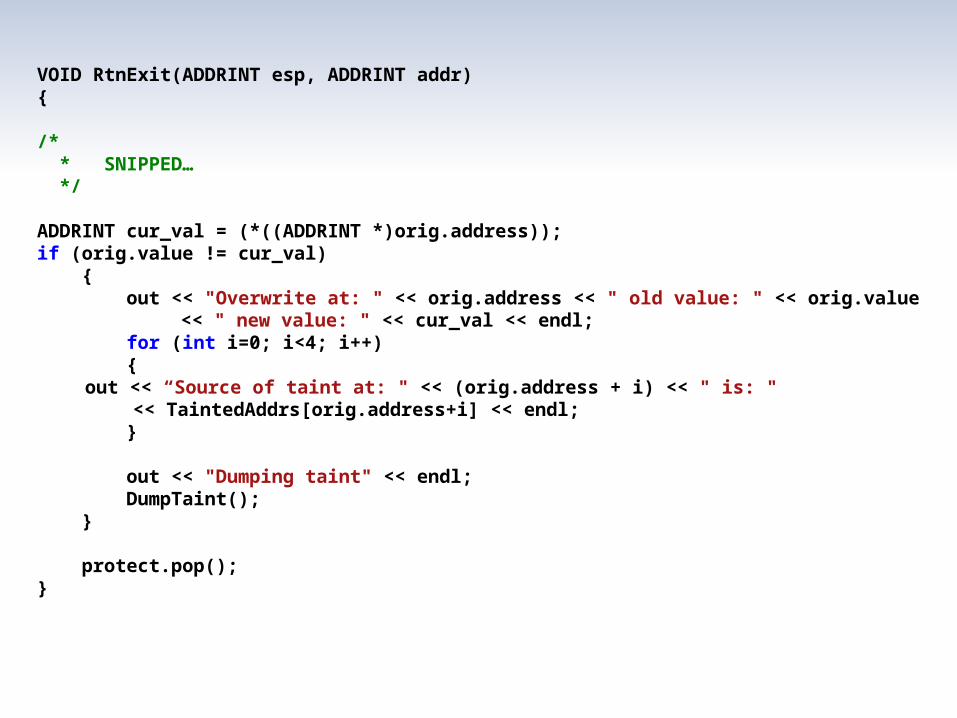
VOID RtnExit(ADDRINT esp, ADDRINT addr){
/* * SNIPPED… */
ADDRINT cur_val = (*((ADDRINT *)orig.address));if (orig.value != cur_val) { out << "Overwrite at: " << orig.address << " old value: " << orig.value
<< " new value: " << cur_val << endl; for (int i=0; i<4; i++) {
out << “Source of taint at: " << (orig.address + i) << " is: " << TaintedAddrs[orig.address+i] << endl;
}
out << "Dumping taint" << endl; DumpTaint(); }
protect.pop();}
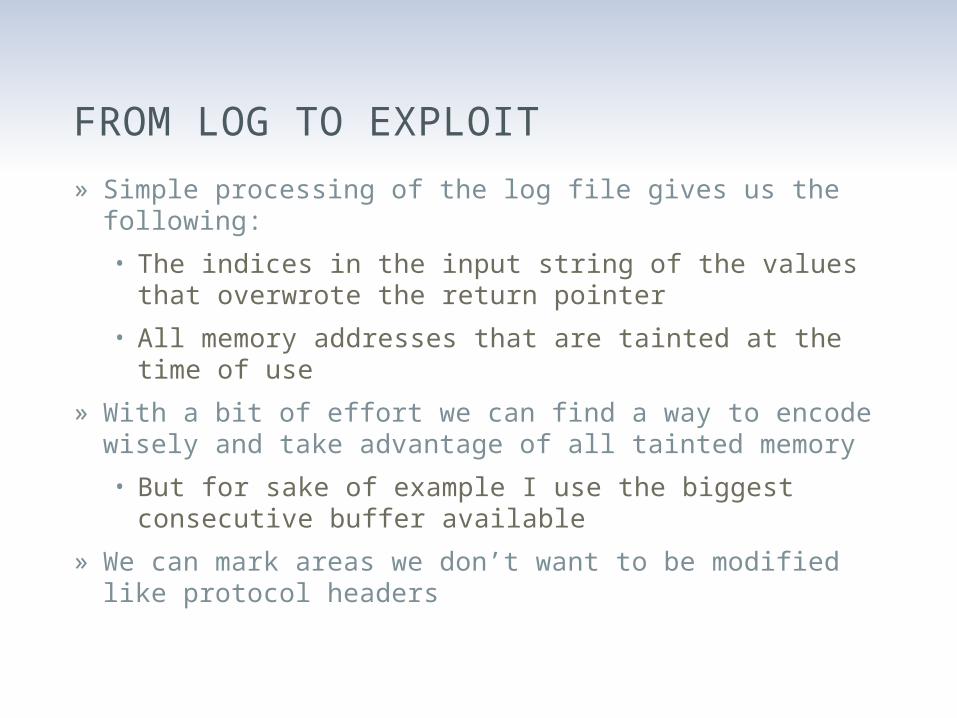
FROM LOG TO EXPLOIT
» Simple processing of the log file gives us the following:
• The indices in the input string of the values that overwrote the return pointer
• All memory addresses that are tainted at the time of use
» With a bit of effort we can find a way to encode wisely and take advantage of all tainted memory
• But for sake of example I use the biggest consecutive buffer available
» We can mark areas we don’t want to be modified like protocol headers

BONUS: PROCESSES AND THREADSBecause we live in a parallel universe
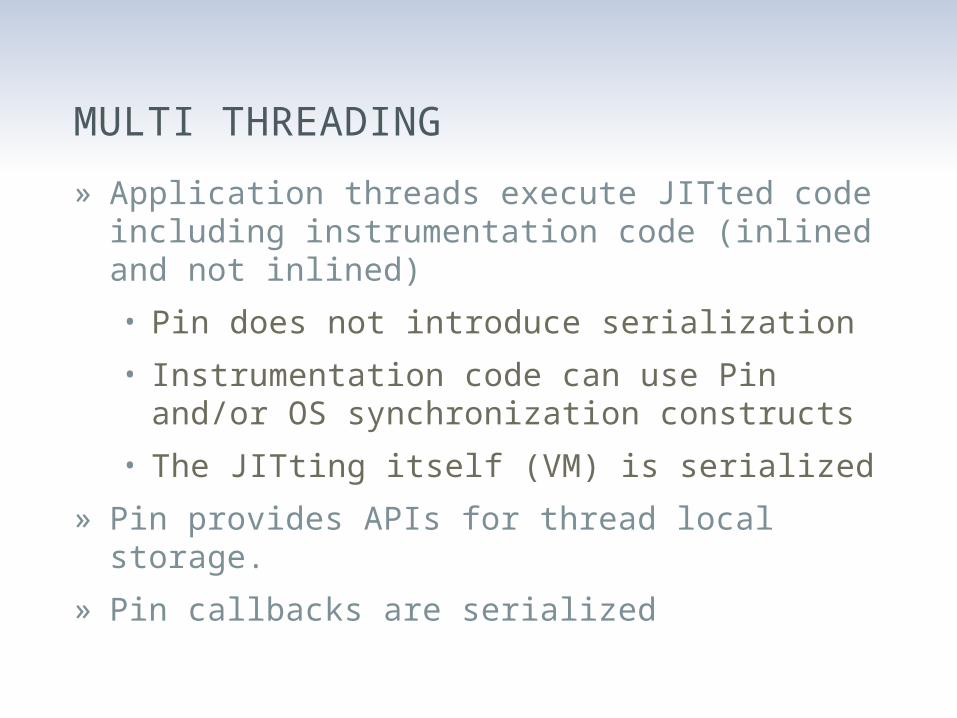
MULTI THREADING
» Application threads execute JITted code including instrumentation code (inlined and not inlined)
• Pin does not introduce serialization
• Instrumentation code can use Pin and/or OS synchronization constructs
• The JITting itself (VM) is serialized
» Pin provides APIs for thread local storage.
» Pin callbacks are serialized
INSTRUCTION COUNTING: TAKE 3 - MT
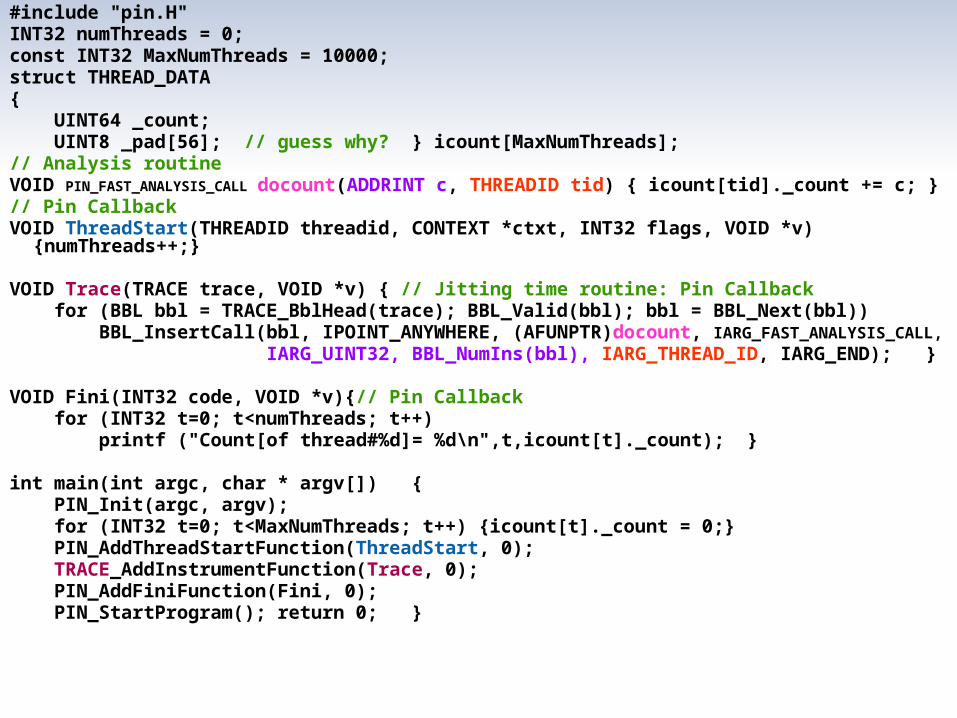
#include "pin.H"INT32 numThreads = 0;const INT32 MaxNumThreads = 10000;struct THREAD_DATA{ UINT64 _count; UINT8 _pad[56]; // guess why? } icount[MaxNumThreads];// Analysis routineVOID PIN_FAST_ANALYSIS_CALL docount(ADDRINT c, THREADID tid) { icount[tid]._count += c; }// Pin CallbackVOID ThreadStart(THREADID threadid, CONTEXT *ctxt, INT32 flags, VOID *v)
{numThreads++;}
VOID Trace(TRACE trace, VOID *v) { // Jitting time routine: Pin Callback for (BBL bbl = TRACE_BblHead(trace); BBL_Valid(bbl); bbl = BBL_Next(bbl)) BBL_InsertCall(bbl, IPOINT_ANYWHERE, (AFUNPTR)docount, IARG_FAST_ANALYSIS_CALL, IARG_UINT32, BBL_NumIns(bbl), IARG_THREAD_ID, IARG_END); }
VOID Fini(INT32 code, VOID *v){// Pin Callback for (INT32 t=0; t<numThreads; t++) printf ("Count[of thread#%d]= %d\n",t,icount[t]._count); }
int main(int argc, char * argv[]) { PIN_Init(argc, argv); for (INT32 t=0; t<MaxNumThreads; t++) {icount[t]._count = 0;} PIN_AddThreadStartFunction(ThreadStart, 0); TRACE_AddInstrumentFunction(Trace, 0); PIN_AddFiniFunction(Fini, 0); PIN_StartProgram(); return 0; }
THREADING CALLBACKS
» PIN_AddThreadStartFunction
» PIN_AddThreadFiniFunction
» PIN_ThreadId
» PIN_ThreadUid
» PIN_GetParentTid
» PIN_WaitForThreadTermination
» PIN_CreateThreadDataKey
» PIN_DeleteThreadDataKey
» PIN_Yield
» PIN_ExitThread
» PIN_SetThreadData
» PIN_GetThreadData
» PIN_Sleep
THREADING API
TOOL THREADS
» You can create tool threads
• Handle buffers
• Parallelize data processing
TOOL THREAD API
» PIN_SpawnInternalThread
» PIN_IsApplicationThread
» PIN_ExitThread
INSTRUMENTING A PROCESS TREE
» Fork
» Execv
» Windows
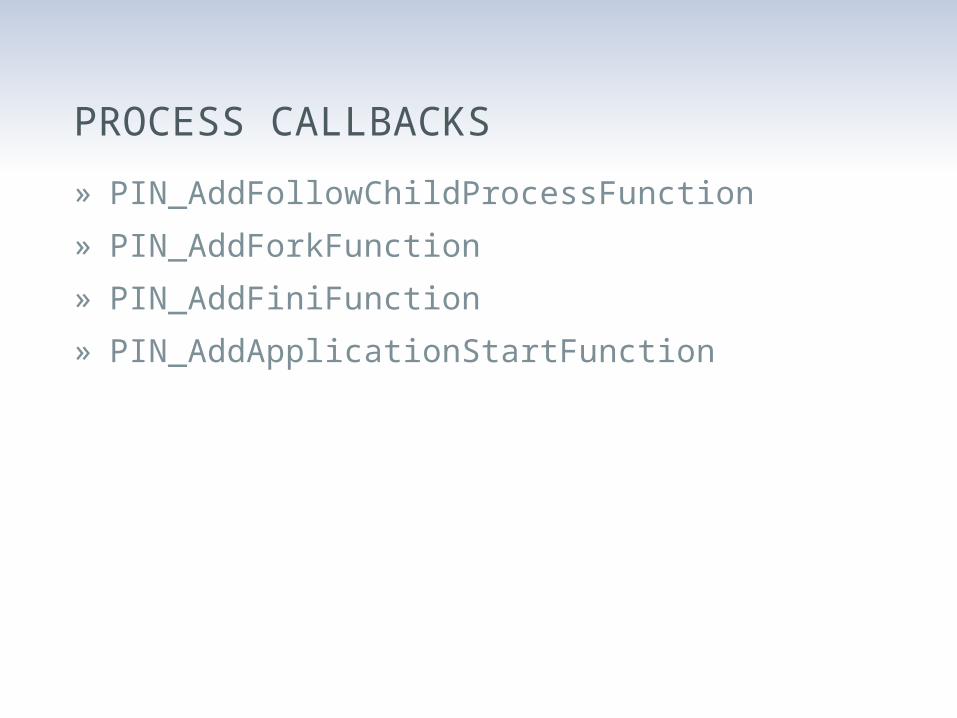
PROCESS CALLBACKS
» PIN_AddFollowChildProcessFunction
» PIN_AddForkFunction
» PIN_AddFiniFunction
» PIN_AddApplicationStartFunction
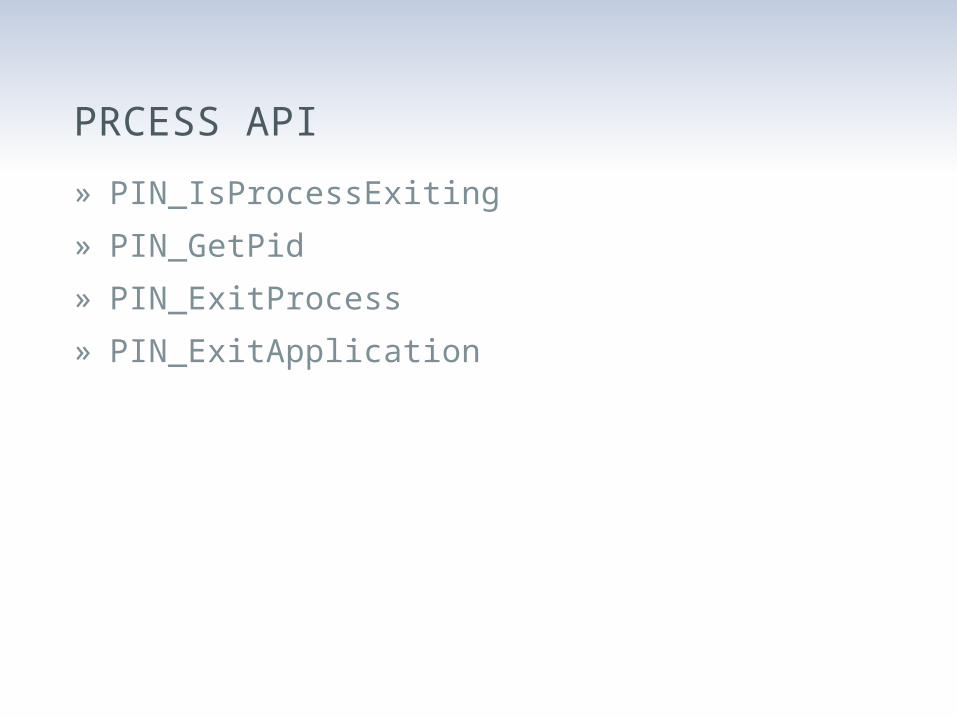
PRCESS API
» PIN_IsProcessExiting
» PIN_GetPid
» PIN_ExitProcess
» PIN_ExitApplication
SECTION SUMMARY
» Pin has various APIs and callbacks to handle multi threading
» Pin supports instrumenting entire process trees using “–follow_execv”
» You can get callbacks on fork and execv in Linux

BIBLIOGRAPHY AND REFERENCESWhere to look for information?
BIBLIOGRAPHY & REFERENCES
» This is a list some relevant material. No specific logical order was applied to the list. The list is in no way complete nor aims to be.
» Dino Dai Zvoi publications on DBT and security
» Shellcode analysis using DBI / Daniel Radu & Bruce Dang (Caro 2011)
» Black Box Auditing Adobe Shockwave / Black Box Auditing Adobe Shockwave
» Making Software Dumber / Tavis Ormandy
BIBLIOGRAPHY & REFERENCES
» Taint Analysis / Edgar Barbosa
» ROPdefender: A Detection Tool to Defend Against Return-Oriented Programming Attacks / Lucas Davi, Ahmad-Reza Sadeghi, Marcel Winandy
» Hybrid Analysis of Executables to Detect Security Vulnerabilities
» Tripux: Reverse-Engineering Of Malware Packers For Dummies / Joan Calvet
» Tripux @ Google code
» devilheart: Analysis of the spread of taint of MS-Word
BIBLIOGRAPHY & REFERENCES
» PIN home page
» PIN mailing list @Yahoo (PinHeads)
» Pin online documentation
» DynamoRIO mailing list
» DynamoRIO homepage
» Valgrind homepage
» ERESI project
» Secure Execution Via Program Shepherding / Vladimir Kiriansky, Derek Bruening, Saman Amarasinghe
BIBLIOGRAPHY & REFERENCES
» Pincov – a code coverage module for PIN
» P-debugger – a multi thread debugging tool based on PIN
» Tartetatintools - a bunch of experimental pintools for malware analysis
» PrivacyScope
» TaintDroid
» Dynamic Binary Instrumentation for Deobfuscation and Unpacking / Jean-Yves Marion, Daniel Reynaud
BIBLIOGRAPHY & REFERENCES
» Automated Identication of Cryptographic Primitives in Binary Programs / Felix Grobert, Carsten Willems and Thorsten Holz
» Covert Debugging: Circumventing Software Armoring Techniques / Danny Quist, Valsmith
» Using feedback to improve black box fuzz testing of SAT solvers
» All You Ever Wanted to Know About Dynamic Taint Analysis and Forward Symbolic Execution / Edward J. Schwartz, Thanassis Avgerinos, David Brumley
» Automated SW debugging using PIN
BIBLIOGRAPHY & REFERENCES
» Determina website (no real information)
» Determina blog
» Sweeper: A Lightweight End-to-End System for Defending Against Fast Worms / James Newsome, David Brumley, et. el.
» Hunting Trojan Horses / Micha Moffie and David Kaeli
» Helios: A Fast, Portable and Transparent Instruction Tracer / Stefan Bühlmann and Endre Bangerter
» secuBT: Hacking the Hackers with User-Space Virtualization / Mathias Payer
BIBLIOGRAPHY & REFERENCES
» Understanding Swizzor’s Obfuscation / Joan Calvet and Pierre-Marc Bureau
» GENESIS: A FRAMEWORK FOR ACHIEVING SOFTWARE COMPONENT DIVERSITY
» A PinTool implementing datacollider algorithm from MS
» Rootkit detection via Kernel Code Tunneling / Mihai Chiriac
» Dytan: A Generic Dynamic Taint Analysis Framework / James Clause, Wanchun Li, and Alessandro Orso


![[Attacks Part] BetterCrypto Workshop @ Hack.lu 2014](https://img.pdfslide.us/doc/110x75/559b47381a28abb42e8b45fa/attacks-part-bettercrypto-workshop-hacklu-2014.jpg)

