Embed Size (px)
Citation preview
Draft
BIM UTILIZATION FOR OPTIMIZING MILLING QUANTITY
AND HMA PAVEMENT OVERLAY QUALITY
Journal: Canadian Journal of Civil Engineering
Manuscript ID cjce-2015-0001.R2
Manuscript Type: Article
Date Submitted by the Author: 24-Jun-2016
Complete List of Authors: Bae, Abraham; Samsung C&T Corporation, Construction Engineering Group, Civil Infra Biz Unit Lee, David; Samsung C&T Coriporation, Civil Project Management Team, Civil Infra Biz Unit Park, ByoungYck; Samsung C&T Corporation, Construction Engineering Group, Civil Infra Biz Unit
Keyword: construction (CA) < Computer Applications, highways < Transportation, constr. management < Construction, transportation structures < Construction, transportation < Computer Applications
https://mc06.manuscriptcentral.com/cjce-pubs
Canadian Journal of Civil Engineering
Draft
1
Manuscript DOI No: 10.1139/cjce-2015-0001
Title: BIM UTILIZATION FOR OPTIMIZING MILLING QUANTITY AND HMA PAVEMENT OVERLAY QUALITY
Authors:
Abraham Bae, Ph.D., P.E. (Corresponding Author)
Deputy General Manager, Samsung C&T Corporation
(Address) Construction Engineering Group, Civil Infra Biz Unit
(E-Mail) [email protected], [email protected]
(Tel) +82-10-4222-7980, +82-2-2145-6013
David Lee, M.S., P.E.
General Manager, Samsung C&T Corporation (Project Manager in MCE C486 Project in Singapore)
(Address) Civil Project Management Team, Civil Infra Biz Unit
(E-Mail) [email protected]
(Tel) +82-2-3458-4291
ByoungYck Park
Assitant Manager, Samsung C&T Corporation
(Address) Construction Engineering Group, Civil Infra Biz Unit
(E-Mail) [email protected]
(Tel) +82-2-2145-7989
Page 1 of 34
https://mc06.manuscriptcentral.com/cjce-pubs
Canadian Journal of Civil Engineering
Draft
2
ABSTRACT: An approach to a practice paving technique using Building Information Modeling (BIM) was
developed. When planning hot mix asphalt (HMA) overlay on a concrete slab, in-advance paving simulations
can help to preemptively evaluate pavement quality, such as HMA thickness, and prevent excessive HMA
quantity. The BIM technique has the capabilities of ‘In-advance Simulation,’ ‘3-D Visualization,’ ‘Interference
Identification,’ and ‘Quantification.’ BIM could be successfully implemented to optimize milling quantity and
improve HMA pavement quality in an actual paving project. Based on the established BIM model, alternative
paving levels were derived and paving sequences were simulated. Through 3-D visualized images, locations
where HMA thickness was inadequate could be effectively identified. Quantified information for simulation
results enabled optimization of milling and paving options. Milling was selectively conducted for the
identified undulations. The cost was reduced by approximately 12%. Paving thickness and density had
coefficients of variation (COV) of about 15% and 0.2%, respectively.
Key Words: BIM, HMA, overlay, simulation, 3-D visualization, interference, quantification, milling,
optimization
RÉSUMÉ: Développement d’une approche d’une technique de revétement de chaussée pratique en utilisant la
“Building Information Modeling” (BIM). Lors de la phase d’études pour un projet d’enrobé bitumineux à
chaud (Hot Mix Asphalt / HMA) en surcouche sur une dalle de béton, des simulations préalables peuvent aider à
évaluer à l’avance la qualité du revêtement, telle que l'épaisseur de HMA, et d’éviter les quantités excessives de
HMA. La technique BIM offre des possibilités de “Simulation En-Avance”, de “Visualisation 3D”,
d’“Identification d’Interférence” et de “Quantification”. La BIM pourrait être mise en œuvre avec succès pour
optimiser la quantité de rabotage et pour améliorer la qualité du revétement en HMA dans un projet de
revétement de chaussée réel. Basées sur un modèle de BIM prédéfini, les épaisseurs de revétement possibles ont
été déduites et le phasage du revétement a été simulé. Grâce à la visualization d’images 3D, les emplacements
où l'épaisseur de HMA était insuffisante ont pu être efficacement identifiés. La quantification des informations
pour la simulation de résultats a permis l'optimisation des possibilités de rabotage et de revétement. Le rabotage
a été réalisé de manière sélective pour les ondulations identifiées. Le coût a été réduit d'environ 12%.
L’épaisseur et la densité du revétement ont eu des coefficients de variation (Coefficient Of Variation / COV)
d'environ 15% et 0,2%, respectivement.
Mots-clés: BIM, enrobé, HMA, revétement, simulation, 3D visualisation, interférence, quantification,
optimization, rabotage
Page 2 of 34
https://mc06.manuscriptcentral.com/cjce-pubs
Canadian Journal of Civil Engineering
Draft
3
1. INTRODUCTION
For pavement inside tunnel, one or two layers of hot mix asphalt (HMA) overlay are generally designed on the
top of the concrete base slab. Similar to concrete deck slab surfaces on bridges, the as-built base slab surfaces
at the bottom of the tunnel exhibit some undulations. To have uniform overlaid pavement qualities such as
thickness, milling of the pre-overlay surface is usually conducted before overlaying. In current practice,
milling would be seldom selectively performed, and consecutive overlaying is usually conducted based on a 2-D
survey. The approach outlined here can potentially reduce milling and HMA overlaying costs.
A BIM has several capabilities, including ‘In-advance Simulation,’ ‘3-D Visualization,’ ‘Interference
Identification,’ and ‘Quantification.’ In this study, a state-of-the-practice method based on the BIM technique
for milling and HMA overlay is developed. The methodology was initiated by modeling the as-built pre-
overlay surface. To optimize paving, alternative paving levels were derived from the BIM model. Paving
sequences were successfully simulated in the BIM model before field paving was completed. The simulated
outputs for pre-overlay conditions and virtual HMA overlaying were quantified exactly. Based on the
quantified information, an optimized milling and paving option was chosen based on the paving quality. 3-D
visualized results helped to identify interferences that could affect HMA thickness quality. This prevented
unnecessary milling and waste of HMA materials. A series of developed processes was reflected in cost
savings in field milling and paving. The developed method was implemented for tunnel road pavement of the
C486 site in the Marina Coastal Expressway (MCE) in Singapore.
2. BACKGROUND
2.1. BIM Implementation in Civil Infrastructure Projects
The BIM technique is widely implemented and used by architectural engineers for building projects. Civil
infrastructure projects have been relatively late in implementing BIM due to its lower efficiency for smaller
projects, costs, training time required, lack of internal understanding of BIM, and other factors. Nevertheless,
the incidence of BIM implementation in infrastructure projects has increased drastically in recent years. In the
U.S., 79% of current BIM users in 2012 anticipated the adoption of BIM in more than 25% of their
infrastructure projects by 2013 (McGraw-Hill Construction, 2012). Note that, in 2011, only 43% of users
forecast the same level of implementation. This increase in demand for BIM appears to be correlated to the
Page 3 of 34
https://mc06.manuscriptcentral.com/cjce-pubs
Canadian Journal of Civil Engineering
Draft
4
improvement in return on investment (ROI) that use of BIM yields. A positive ROI was reported by 67% of all
BIM users for infrastructure projects in 2011. Note that ROI for building projects was reported to be 63% in
that same year. Japan has implemented BIM in civil projects as construction information
modeling/management (CIM). The Ministry of Land, Transport and Tourism of Japan (MLIT) promoted an
information and communication technology (ICT) civil engineering production process to improve construction
productivity, and have carried out CIM projects since 2012. Moreover, the Japan construction information
center (JACIC), which is an academic organization, was established to support the MLIT’s CIM projects
(JACIC, 2014). Singapore is one of the global leaders in BIM implementation. The building and construction
authority (BCA) in Singapore made BIM submissions mandatory for architectural projects by 2013, structural
and mechanical & electrical (M&E) projects by 2014, and ultimately all projects with a gross floor area of more
than 5,000 m2 by 2015 (BCA, 2011).
Various civil infrastructure projects such as road and highway projects, airport projects, transit projects,
dams, water and wastewater facilities, and others are implementing BIM. U.K. Crossrail would be the first
infrastructure project to comprehensively implement BIM (Crossrail Ltd, 2016). The roles of BIM in the
project are primarily to facilitate cost saving for all assets during the lifecycle, and to create an integrated 3D
information model that will facilitate multidisciplinary collaboration through design, construction, operations,
and maintenance. The Crossrail project is expected to be a reference project that will influence future
worldwide infrastructure projects. Subway stations are also very important civil infrastructures for which BIM
has been adopted because of the complexity of the various construction sectors e.g. architectural, structural, and
M&E facilities. In road and highway projects, BIM implementation has becomes more prevalent in bridge
structures, because the design shape for bridges is more standardized than for other road elements such as
tunnels or road geometry. For example, in bridge construction in the Denver metropolitan area, 5 to 9% cost
savings were predicted based on use of BIM to reduce change orders or reworks (Fanning et al., 2015).
Graphical in-advance simulation implemented in a BIM improved detection of design flaws in a cable-stayed
bridge (Kim et al., 2011). Road surveys, road geometry design, and cut and fill evaluations have recently
begun to adopt 3-D engineering techniques (Redder and Nelson, 2015), and modeling of tunnel shape was
attempted for standardization purposes (Yabuki et al., 2007). However, pavement element, no remarkable
studies have been documented on BIM application. This is because pavement structural geometry and design
are relatively simpler than other elements, and thus there is not much demand for asset management or as-built
drawing documentation management. However, the benefits of BIM during paving construction may be
Page 4 of 34
https://mc06.manuscriptcentral.com/cjce-pubs
Canadian Journal of Civil Engineering
Draft
5
underappreciated. In this study, it is presented that BIM tool can be effectively utilized in terms of cost-saving
and that improves the quality of paving.
2.2. Relationship between Milling and HMA Overlaying Thickness
There are proper compaction thickness ranges associated with HMA Nominal Maximum Aggregate Size
(NMAS) (FHWA, 2001). If the thickness is too thin compared to NMAS, the composition of aggregate sizes
in the mat HMA layer may be inadequate, causing unwanted segregation and sometimes large aggregates to be
broken during compaction. On the other hand, a thicker mat lowers the compaction energy efficiency. In
order to achieve admissible HMA density, proper mat thickness should be secured before HMA overlaying.
Prior to HMA overlaying, milling is usually conducted in order to remove distress and to level
irregular higher elevations on the existing pavement (Brown et al., 1996). When HMA is overlaid without
milling under irregular pre-overlay surfaces, NMAS and the thickness ratio are not constant over the entire
paving surface. This obviously causes differential compaction, resulting in lower density. Thus, milling is
usually recommended as a prerequisite in order to guarantee overlaid HMA quality. Other concerns are milling
quantity and HMA material costs.
2.3. 2-D and 3-D Milling on Concrete Slab Surfaces
On highways or local roads, milling is conducted for an entire lane with a certain cut depth. Once cutting
depth is set for the anticipated elevation level, milling equipment moves forward along the road track and keeps
producing constant level surfaces. The ‘traditional’ milling process is completed two-dimensionally.
However, in the case of HMA overlay on concrete slab surface in tunnel, 2-D milling would not be the best
option. A review of the case study in the MCE C483 and C486 projects shows two primary limitations. First,
2-D milling for the entire concrete slab surface is expensive. Concrete slab surface usually has wide, broad
irregularities, and correspondingly, the required milling volume and area are quite large. Second, milling
should be selectively conducted since the cover thickness for steel wire embedded in the concrete slab should be
maintained within a certain tolerance. In addition, the working environment inside the tunnel is not supportive
for milling work. Milling with a 2-D method might cause large amounts of dust and atmospheric pollution
inside the tunnel.
Milling efficiency is of interest to the paving industries since it is primarily dependent on equipment.
Page 5 of 34
https://mc06.manuscriptcentral.com/cjce-pubs
Canadian Journal of Civil Engineering
Draft
6
It is mostly focused on improving milling equipment capability or operation techniques (Sidlar, 2006, Schwarz
2006, Ensell, 2012). However, correct recognition of the pre-overlay surface condition is an important factor
for enhancing the milling efficiency, and seems to be neglected in some pavement situations. If milling is
selectively conducted in areas that exceed the allowable elevation level, the costs would be considerably
reduced. Selective milling can be regarded as ‘3-D milling.’ Recently, 3-D milling was attempted as a
pioneering technique in Europe (Woof, 2011). Using a 3-D monitoring system, cut depth is instantly altered
according to the monitored elevation profile, and only areas that need to be milled are removed. Utilization of
BIM tool can enhance the 3-D milling efficiency. A BIM tool provides better 3-D profiles than surveying
output for pre-overlay surface irregularities, and milling location and quantity become more precise. Beyond
the precision, BIM offers integrated paving information that improves the overlay HMA quality.
3. CONCRETE SLAB CONDITION AS PRE-OVERLAY SURFACE
3.1. Open-Cut Tunnel and Overlay Pavement Design
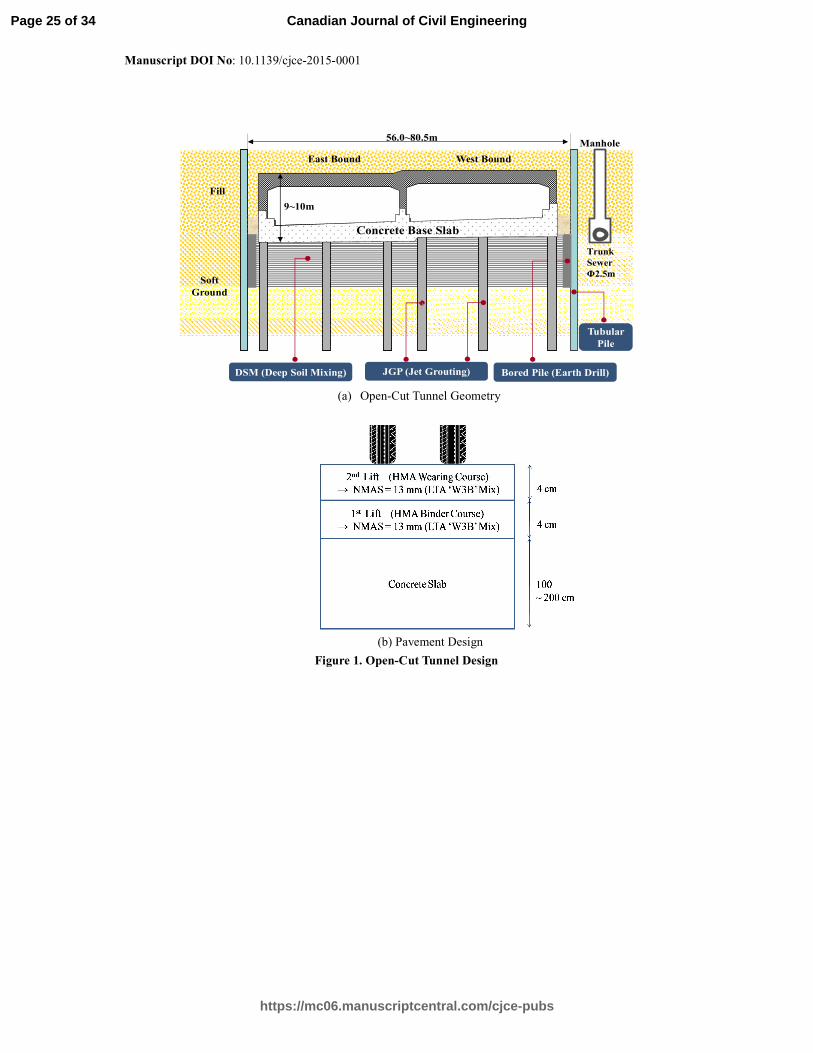
Figure 1(a) displays a typical box tunnel structure in the Marina Coastal Expressway C486 site in Singapore.
The twin cell box tunnel is placed over soft ground. For ground improvement, Deep Soil Mixing (DSM) and
Jet Grouted Pile (JGP) were applied for about 10 m beneath driving lanes and tunnel edges, respectively. In
spite of the improvements, deep ground mass was expected to keep consolidating even after completion of
construction. For tunnel structure support, bored piles were installed around 50 − 60 m deep.
Concrete slab is an element at the base at the bottom of the box tunnel. Its thickness varies by about
1.0 − 2.0 m depending on construction geometry. Although the concrete base slab is not regarded as pavement,
it comprehensively compensates for the pavement structural capability for the expected design traffic volume.
One or two HMA layer(s) are usually designed for driving comfort and final surfacing. The proposed HMA
overlay design, which is two HMA layers, each 4 cm-thick with a NMAS of 19 mm, is shown in Figure 1 (b)
(Bae et al., 2015).
[Figure 1. Open-Cut Tunnel Design]
Page 6 of 34
https://mc06.manuscriptcentral.com/cjce-pubs
Canadian Journal of Civil Engineering
Draft
7
3.2. Base Slab Surface Condition
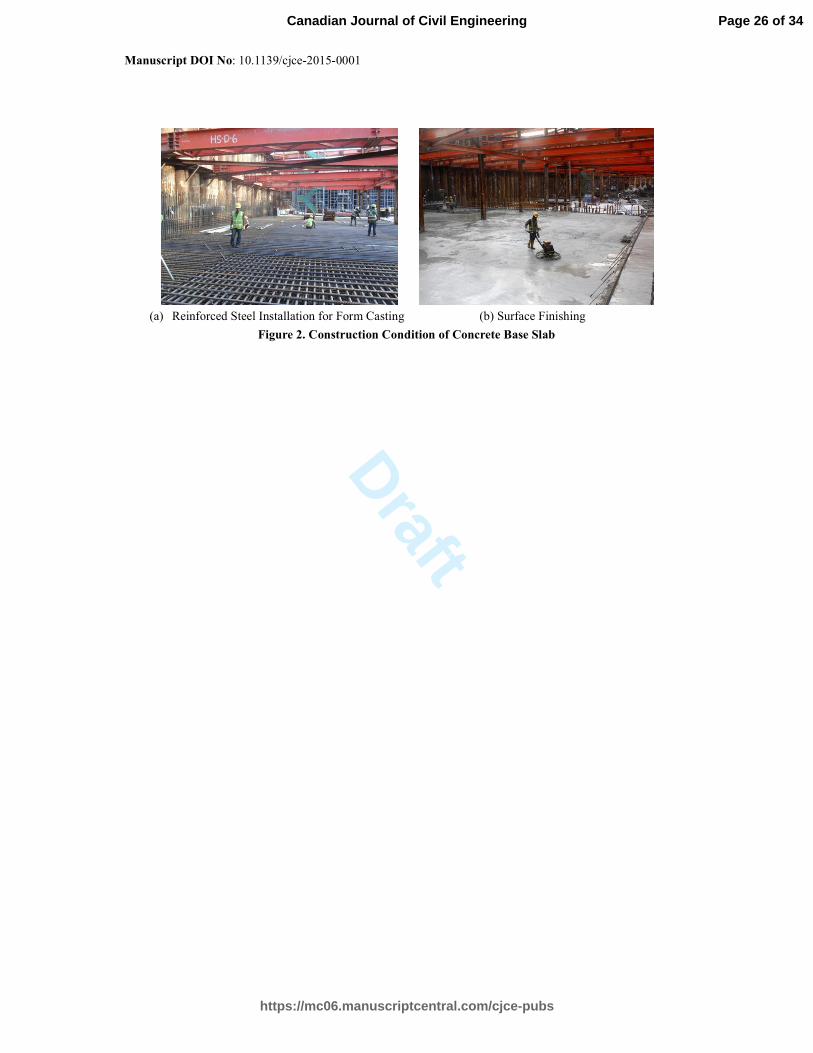
Concrete base slab is cast under complex conditions such as improved grounds and bored piles. Construction
is mostly conducted in the dark, and equipment is operated in narrow spaces. The concrete base slab is
constructed using form-casting method after reinforced steel installation (Figure 2(a)), and the surface is
manually finished (Figure 2(b)). Due to these restrictions, the concrete base slab surface usually has
undulations.
[Figure 2. Construction Condition of Concrete Base Slab]
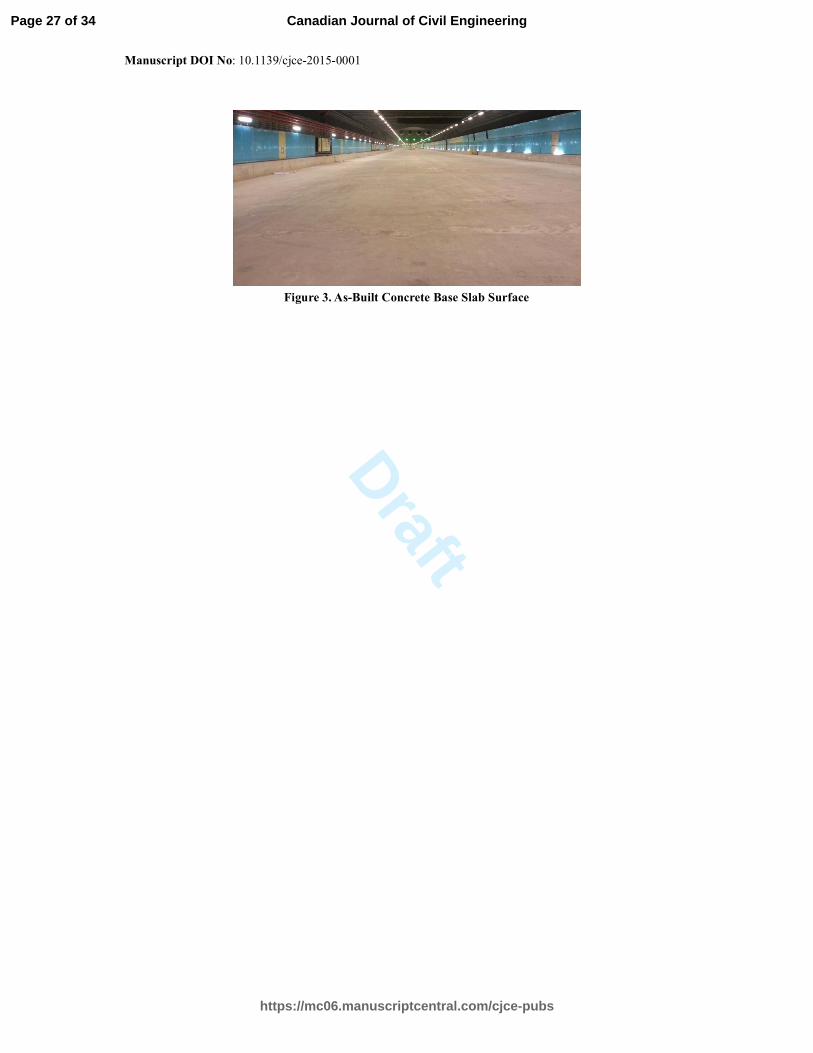
Figure 3 displays the as-built base slab surface. The concrete base slab in the tunnel expressway is
regarded as a structural part, not pavement. Undulation of the surface is not a critical quality control item.
However, the undulation influences pavement overlay quality and cost. Pre-overlay surface irregularity is a
challenge for paving work.
[Figure 3. As-Built Concrete Base Slab Surface]
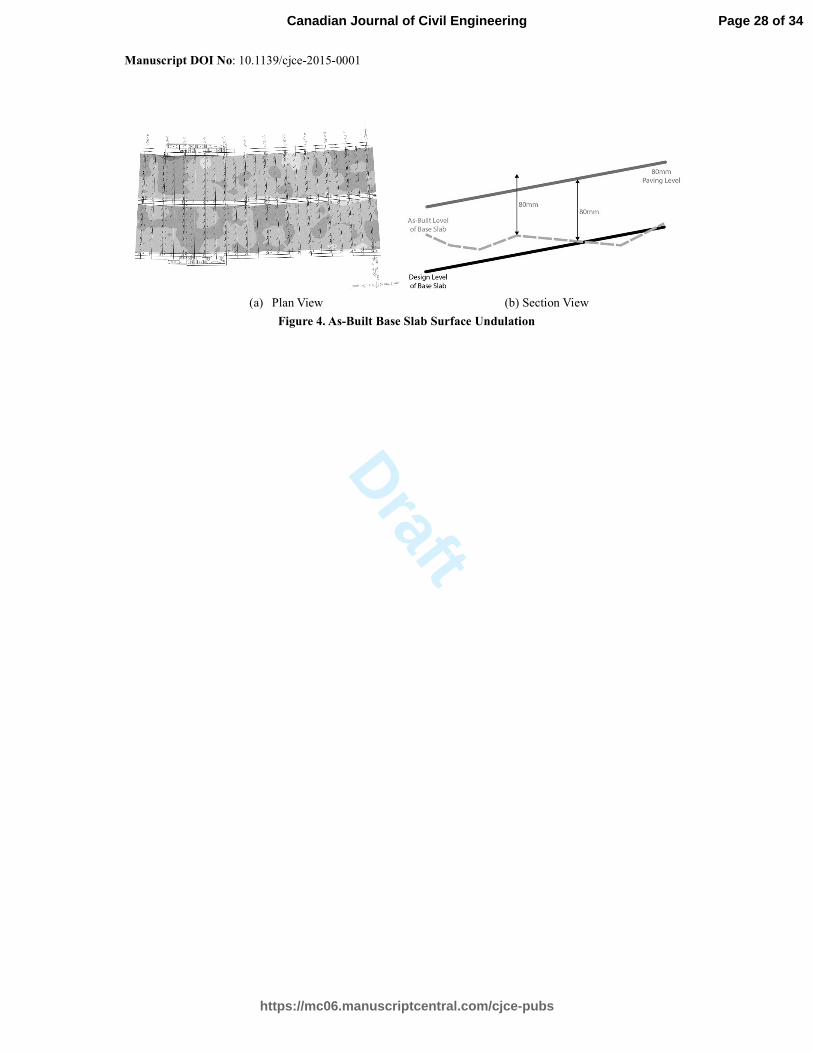
Figure 4(a) presents a section of the plan view for the as-built base slab surface undulation of the
MCE C486 site. The pre-overlay surface contains various lower (‘valley’) and higher (‘hill’) spots. Colored
contours represent elevation differences in both horizontal and longitudinal directions. Figure 4(b) presents a
schematic section view of undulations in the horizontal direction as well. If an HMA design thickness of 80
mm is applied at the basis of the design level, the ‘valley’ part requires surplus HMA materials and the ‘hill’ part
produces insufficient thickness. The ‘valley’ is not a challenge for conforming to HMA thickness and
smoothness requirements since it can be easily leveled out by filling with additional HMA. Construction cost
and NMAS for the increased thickness are the only concerns. On the other hand, the ‘hill’ should be
eliminated in order to secure the HMA thickness. Milling is a fundamental treatment to remove elevation
deviation. A challenge is to estimate the milling quantity. Overestimation of the milling quantity increases
the cost and time, and underestimation results in lower pavement quality. In order to exactly estimate the 3-D
milling volume, a technical approach with the BIM tool was implemented.
[Figure 4. As-Built Base Slab Surface Undulation]
Page 7 of 34
https://mc06.manuscriptcentral.com/cjce-pubs
Canadian Journal of Civil Engineering
Draft
8
4. METHOD
4.1. Summary of Method Development
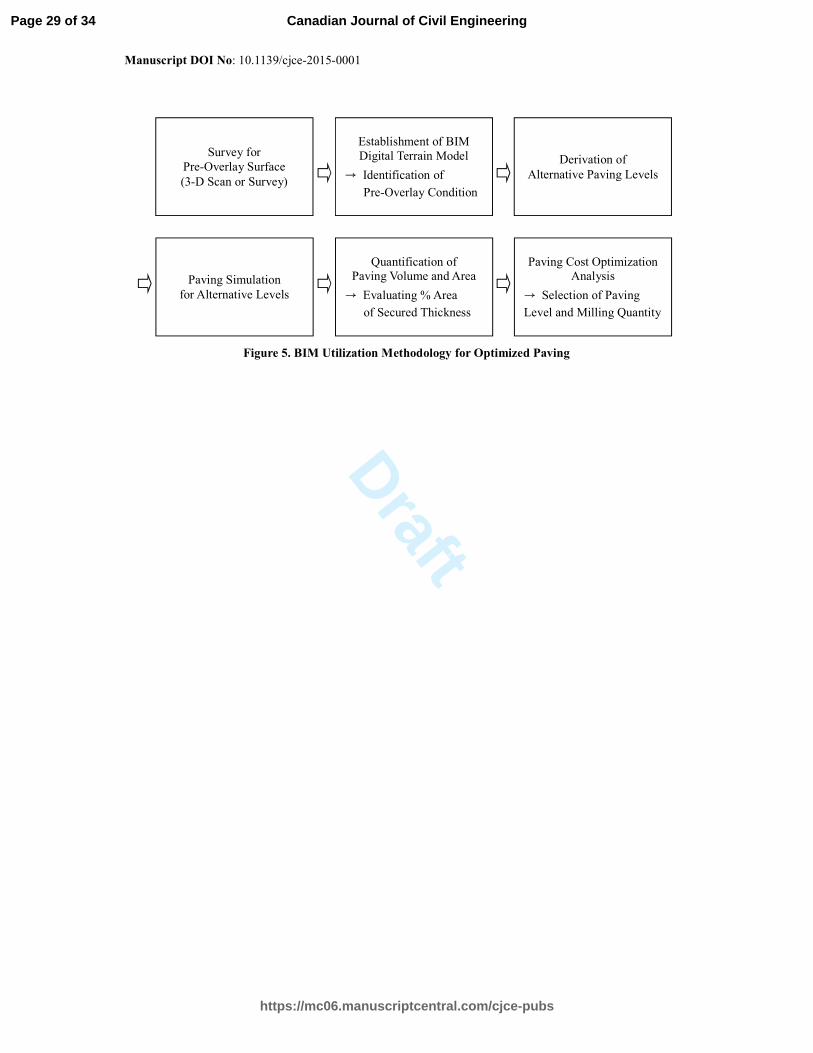
Figure 5 presents the BIM utilization process developed in order to optimize milling and HMA quantity. As an
initiation process, the elevation of the pre-overlay surface should be surveyed. Using the surveyed elevation
data, the BIM tool creates a Digital Terrain Model (DTM) that is a fundamental geometry format for BIM
simulation. Based on the DTM, several paving level alternatives are derived to improve thickness or density
qualities. Virtual paving can then be simulated in the BIM model. The percent area and volume for the secured
HMA thickness (or undulation condition) can be visually identified and quantitatively computed in the BIM
model. The quantified information is used in quality and cost optimization analysis, and finally, construction
paving level and milling quantity are determined.
[Figure 5. BIM Utilization Methodology for Optimized Paving]
4.2. Digital Terrain Modeling of Pre-Overlay Surface
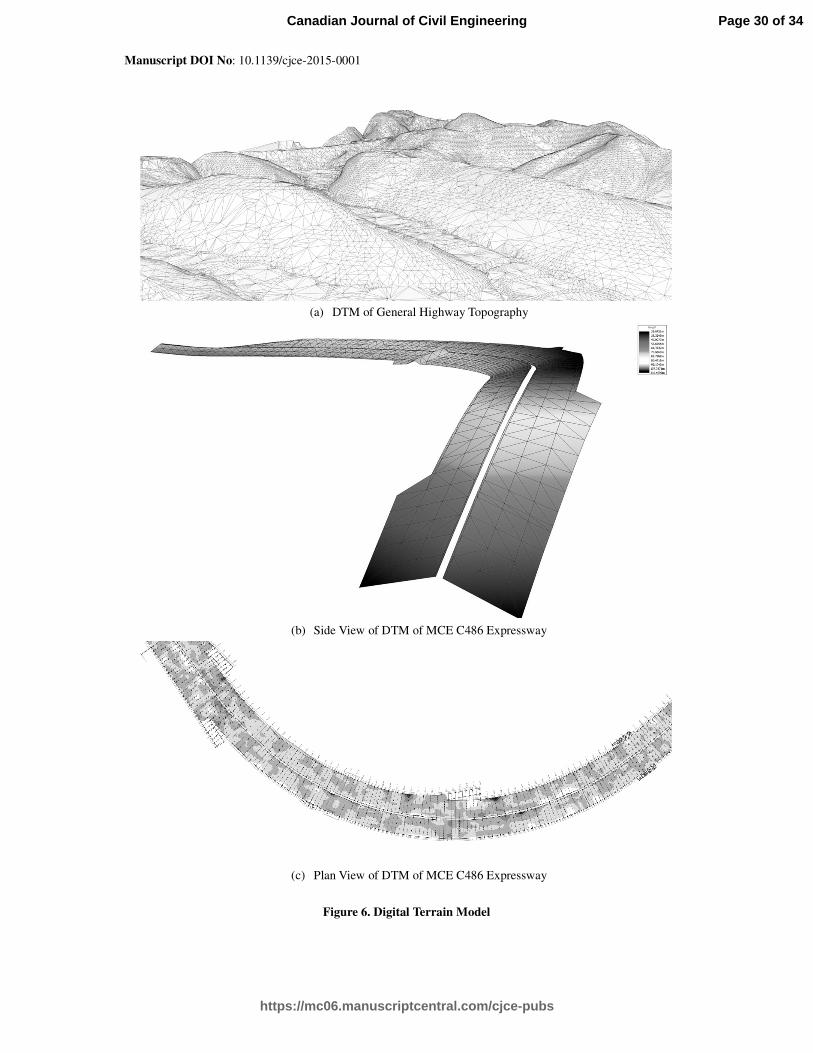
For the paving simulation in BIM, a basic frame needs to be established. The frame is called the DTM.
When modeling a typical highway, the frame is usually composed of geological topography. Figure 6(a)
presents a typical DTM for a highway project before any structural objects are added in the BIM model.
Substantial BIM modeling may include various civil structures such as bridges or tunnels in the DTM, and BIM
may evaluate constructability and efficiency. With any types of spatial elevation data, the BIM tool can
generate DTM model. Obviously, as the resolution of the spatial data increases, the DTM becomes more
refined.
In this study, DTM was established for the as-built concrete base slab in the tunnel. In order to
collect spatial data, the as-built base slab surface elevation was surveyed at the interval of 3 m and 10 m in
transverse and longitudinal directions, respectively. The surveyed data was digitized and transferred to the
BIM tool. Figures 6(b) and 6(c) show the DTM for an 800 m-long expressway section of the MCE C486 site.
The contour represents variation of the as-built slab surface elevations. In the BIM tool, the contour interval
can be adjusted by users.
[Figure 6. Digital Terrain Model]
Page 8 of 34
https://mc06.manuscriptcentral.com/cjce-pubs
Canadian Journal of Civil Engineering
Draft
9
4.3. Derivation of Alternative Paving Level
The primary purpose of deriving paving level alternatives is to find optimized milling quantity and HMA
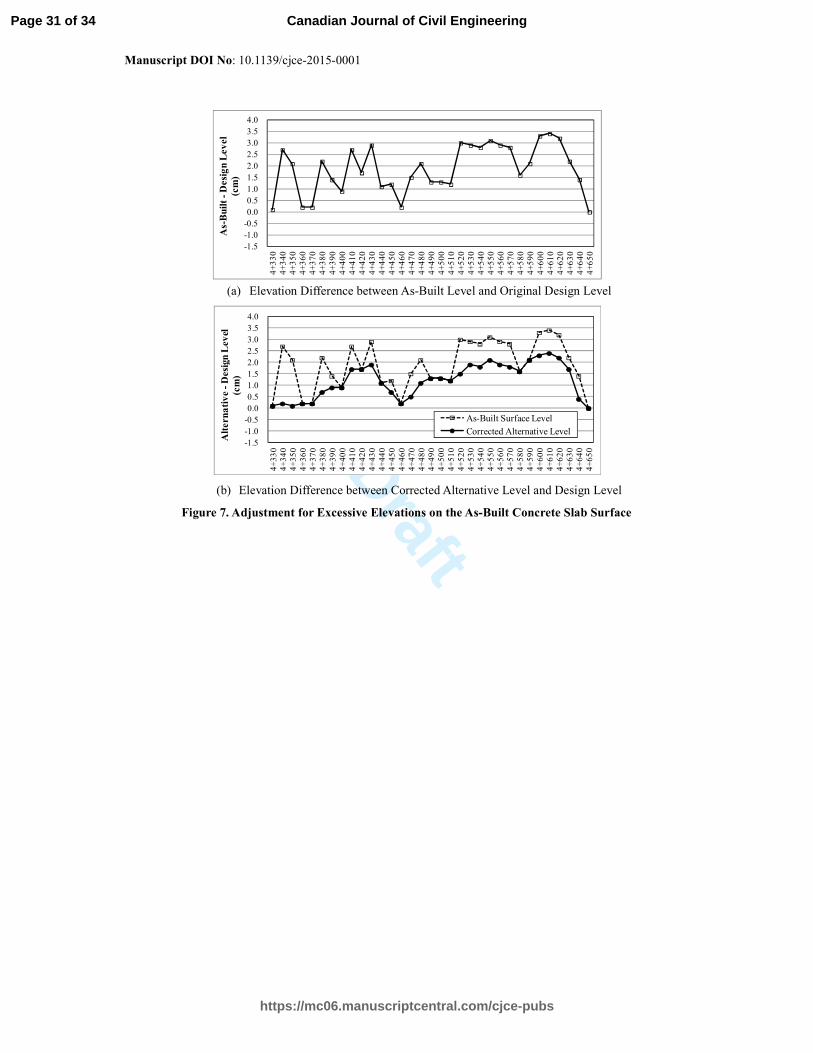
overlay quality. In order to evaluate the as-built surface condition, the difference between the as-built and
design level of the base slab was computed. Figure 7(a) shows the computed data for a specific section. Note
that the data in Figure 7(a) were extracted from the center of the east bound highway, which is about 30 m wide
with 5 lanes. Many points along the station number were found to exceed the design level. If an 80 mm
design thickness is applied, the required thickness would not be guaranteed for locations with points exceeding
that thickness. They would be milled by a ‘zero’ difference in order to achieve the required HMA compaction
thickness. Such an approach would increase milling costs.
[Figure 7. Adjustment for Excessive Elevations on the As-Built Concrete Slab Surface]
Instead, if the original paving level were adjusted within the tolerance, the quantity of milling required
could be reduced. This treatment is facilitated in the BIM model. Note that the Singapore LTA elevation
tolerance for pavement formation is ±25 mm (Engineering Group, 2010). Figure 7(b) shows the corrected as-
built elevations (line with filled legend) within less than +20 mm difference. If the magnitude of adjustment is
higher, corrected elevation profiles would be flatter (i.e., conservative) as the design level. It requires more
HMA, but less milling work is expected. The paving level was created by the overlay design thickness of 80
mm to the corrected as-built elevations. Two alternatives were derived based on the different degrees of
adjustment. Note that alternative 2 was derived to be more conservative than alternative 1.
4.4. Paving Simulation
Paving simulation identifies locations with insufficient HMA thickness to provide quantified information for
paving work afterwards. After BIM processing, HMA overlaying layers were newly added onto the DTM
frame that was previously modeled by an as-built slab surface. This step can be regarded as a BIM technique
to detect interference during construction. In this study, ‘interference’ means insufficient HMA overlaying
thickness due to undulations in the concrete base slab surface.
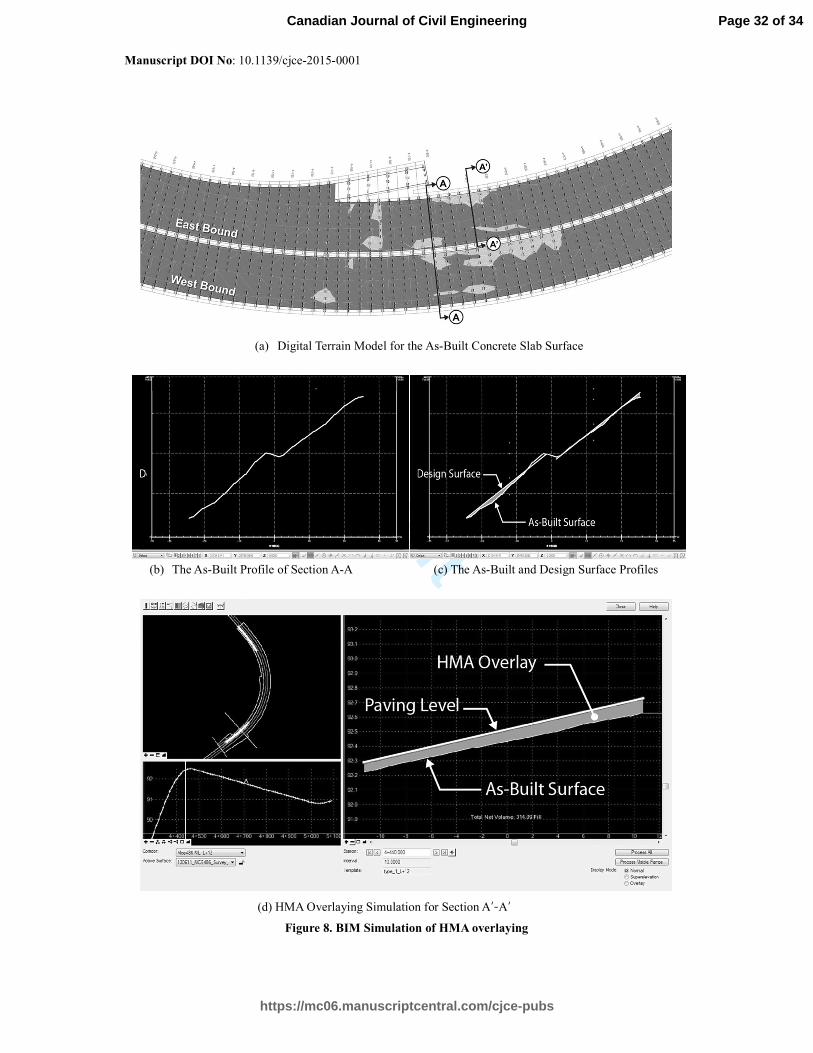
Figure 8 demonstrates the BIM simulation process of HMA overlaying. Figure 8(a) represents the
DTM for a specific section, where the colored areas represent higher elevations. For section A-A, transverse
surface profiles are shown in Figures 8(b) and 8(c). In Figure 8(c), the as-built and design surfaces are
Page 9 of 34
https://mc06.manuscriptcentral.com/cjce-pubs
Canadian Journal of Civil Engineering
Draft
10
displayed together, and the elevation differences are noticeable. Engineers can easily detect ‘hill’ and ‘valley’
spots. Note that excessive levels observed adjacent to the median in the east bound lane in section A-A in
Figure 8(a) are confirmed in detail in Figure 8(c). Figure 8(d) shows the paving simulation after applying an
alternative paving level for section A’-A’. Paving thickness security after overlaying can be visually identified.
Note that in section A’-A’, excessive elevations at the edge of the east-bound lane produced insufficient HMA
thickness (Figure 8(d)).
[Figure 8. BIM Simulation of HMA overlaying]
In addition to the visual identifications, the simulated HMA overlaying quantity can be automatically
calculated in terms of volume and area. The required milling quantity can also be computed in the BIM model.
The combined quantified information for milling and HMA will be used for optimizing paving work in terms of
quality and cost.
4.5. Quantification of Simulated Paving Works
One primary advantage of utilizing BIM is the capability to extract quantitative information for construction
objectives. Quantified information for virtual paving works enables milling to be optimized and HMA paving
quantity to be known. Since paving costs can be directly estimated in BIM, information on paving quantity
and cost can be integrated and instantly analyzed. HMA thickness conditions observed in the visual
identification process can be confirmed and related to quantified information.
4.6. Cost Optimization
There are several ways to achieve the allowable compaction thickness. One way is to pave the surface at a
very conservative paving level, that is to say, thicker overlaying. This is convenient in that milling work can
be minimized. However, the uniformity of the HMA thickness might be inadequate. Costs would be much
higher since the HMA overlay has to mask all undulations. In addition, the paving level cannot be raised as
high as required since there is an elevation tolerance for the pavement structure.
The other approach is, without a paving level adjustment, to mill the surface until excessive elevation
is completely removed. This should result in more uniform thickness and smoother pavement. Traditional 2-
Page 10 of 34
https://mc06.manuscriptcentral.com/cjce-pubs
Canadian Journal of Civil Engineering
Draft
11
D milling with only a single setting for the cutting depth is one approach. However, milling all excessive
elevations requires extensive work hours and costs and is impractical inside a tunnel. In addition, for very
excessive elevations, milling thickness is limited because the cover thickness from the concrete slab surface
should be maintained for reinforced steel. Therefore, the best combination of paving level and milling quantity
is sought in the optimization process, as measured by the pavement quality and cost.
5. FIELD WORK - Milling and HMA Overlaying at Paving Site
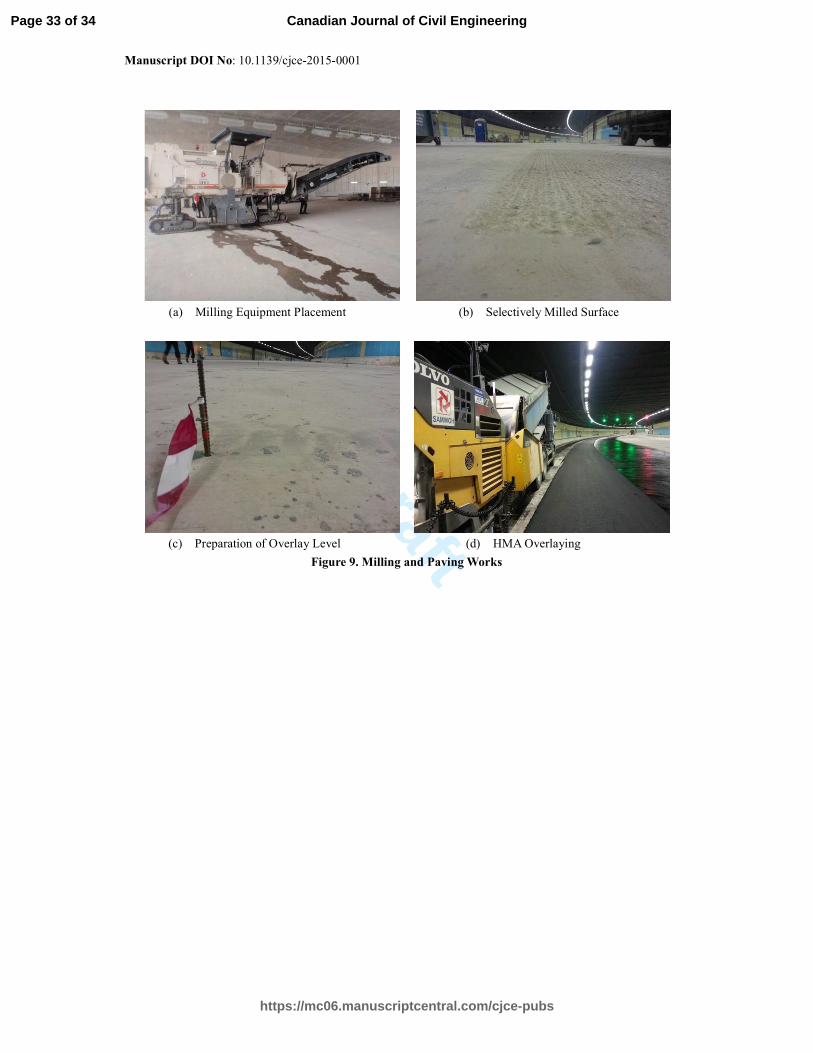
According to the optimized paving plan, milling was conducted and the HMA overlay level was set. In field
paving work, milling locations were designated by 3-D visualized information. Field engineers transformed
identified high elevations in the 3-D view into 2-D CAD file. Then, the field operator located milling
equipment in the designated area and conducted ‘selective’ milling. Undulation areas in the drawing were not
always coincident with the as-built surface. This was inferred to be due to the resolution of the BIM model
with spatial data of 3 m by 10 m. In addition, as mentioned before, a sizable milling area exists along the
edges of the main driving lanes. In the edge area, steel drainage gratings are embedded at regular intervals,
and thus milling equipment is difficult to access in those areas. Consequently, milling equipment could not be
placed on those areas. Instead, the high elevations in those areas were manually removed by field workers.
Figures 9(a) and (b) show milling equipment placement based on BIM analysis as well as selectively milled
surfaces.
After milling work, HMA materials were overlaid. As designed, two layers, 40 mm each, were
separately laid down. For overlay paving, a string stick was installed at the bottom of the concrete base slab at
intervals of 10 m in the longitudinal direction and with both paving edges over entire paving lanes (Figure 9 (c)).
For the first lift, a string line was set to the sticks based on 19 mm of NMAS and paving alternative 1. The
paver was maneuvered along with the string line level. For the second lift, the string line was not used for the
paver. However, mat thickness paving was conducted during surveying for the first lift layer surface elevation.
Figure 9 (d) shows HMA overlay paving.
[Figure 9. Milling and Paving Works]
Page 11 of 34
https://mc06.manuscriptcentral.com/cjce-pubs
Canadian Journal of Civil Engineering
Draft
12
6. ANALYSIS AND RESULTS
6.1. Analysis Results for the Paving Simulation
Detection of the ‘thin area’ contributes to improved pavement quality in advance. Three paving levels,
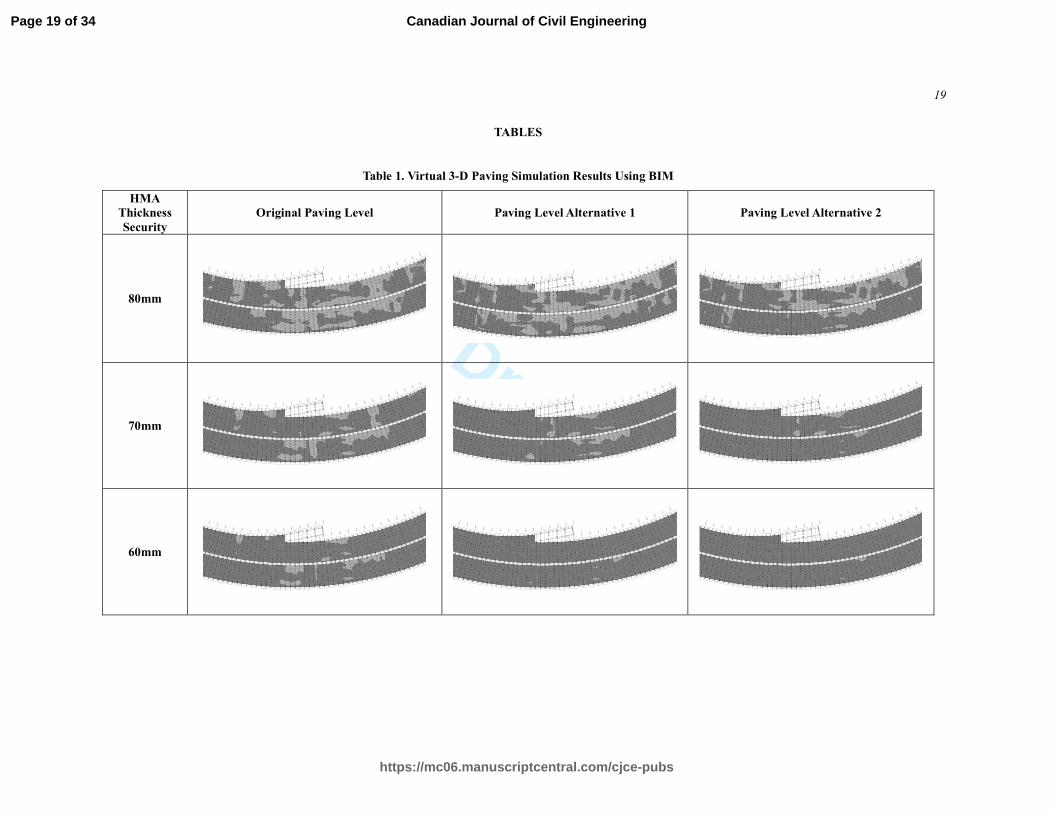
alternatives 1 and 2 and the original paving level, were virtually simulated using BIM. Table 1 displays the
simulation views for STA 4+670 to STA 4+910. Two colors distinguish areas in which the thickness is secured
at thicknesses of 80 mm, 70 mm and 60 mm. Alternative 2 produces the largest area when the 80 mm design
thickness is secured for required compaction density and the original level is the smallest. Alternatives 1 and 2
were found to provide over 60 mm thickness in most paving areas, but the original level still contains some thin
areas.
In further analysis, various simulation results were examined at any thickness level, although they were not
illustrated in Table 1. There were some locations with 40 mm or 50 mm thickness are not secured, but the
percentage of area affected was insignificant. In the field paving stage, the extreme irregular elevations were
completely removed by the milling work.
In addition, the lower edge of each bound was commonly observed to exhibit higher elevations than
designed. It is inferred that during base slab casting and curing, the concrete mass formed is gravitationally
pushed out toward the lower edges of expressway sides. This detection is a valuable outcome resulting from
BIM utilization.
[Table 1. Virtual 3-D Paving Simulation Results Using BIM]
6.2. Analysis Results for Quantification
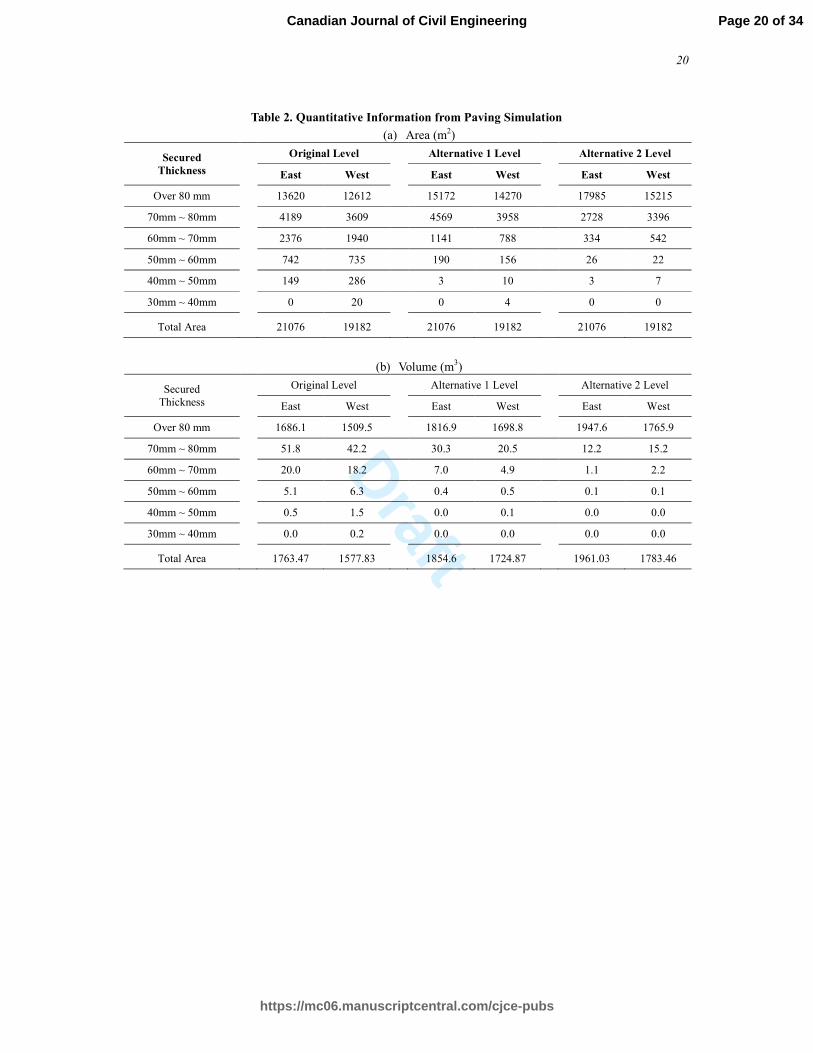
Table 2 presents paving area and volume with regard to secured thicknesses. As identified in visual
examination, most east and west bound lanes exhibited over 70 mm overlay thickness. The total area is the
same for the original and alternative levels since the 2-D area does not change for different vertical paving levels.
On the other hand, the total volumes are different for all levels since the volume of HMA overlay changes
reflects a vertical elevation difference. Alternative 2 obviously produces the largest total paving volume since
its level was established the most conservatively. However, area or volume requiring milling is the smallest in
alternative 2. The original level has an advantage in terms of HMA quantity, but not in milling quantity.
[Table 2. Quantitative Information from Paving Simulation]
Page 12 of 34
https://mc06.manuscriptcentral.com/cjce-pubs
Canadian Journal of Civil Engineering
Draft
13
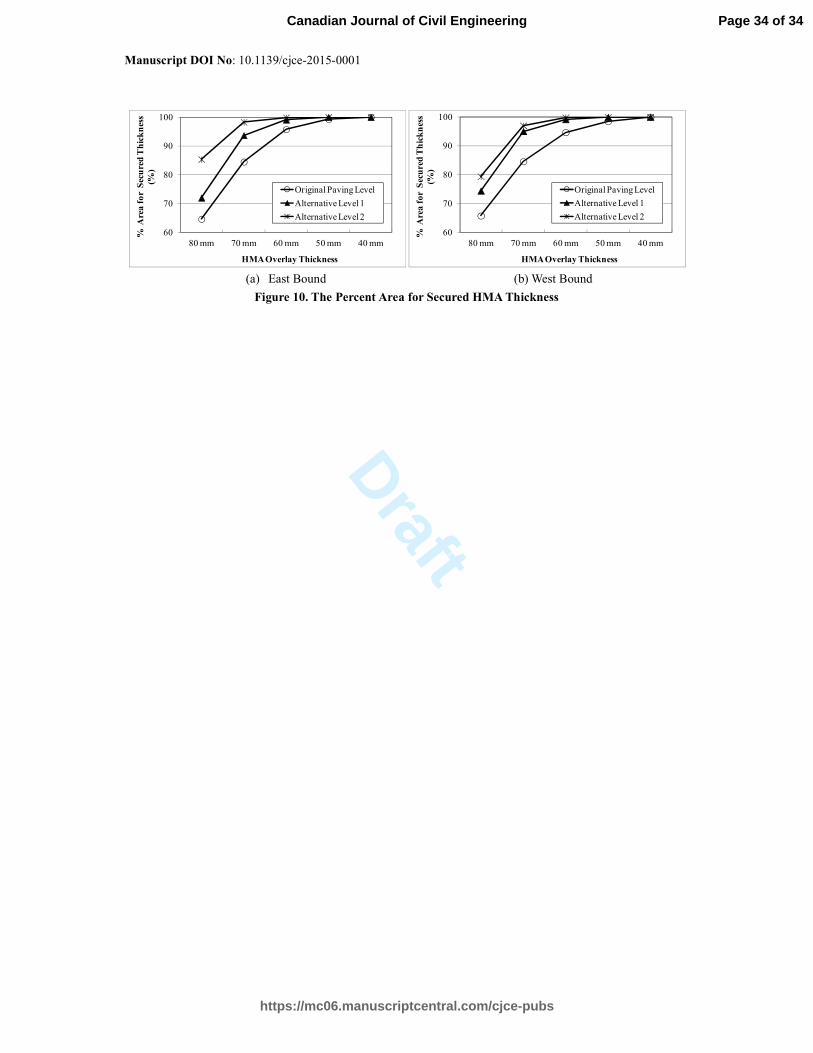
Figure10 presents the cumulative percent areas with respect to secured thickness for each paving level.
If the original paving level under the as-built concrete slab surface is applied, only about 65% of the total paving
area satisfies the design thickness, 80 mm for both east and west bound lanes. About 85% and 95% are
guaranteed for 70 mm and 60 mm thickness, respectively. However, alternative levels 1 and 2 after elevation
correction distinctively improved the percentage. Alternative 2 overlaying can produce about 85% and 80%
area for 80 mm thicknesses in east and west bound lanes, respectively. Particularly, alternatives 1 and 2
already achieve about 95% for 70 mm thicknesses, which means that milling work is required for only about 5%
of the total paving to ensure thickness quality assurance. Note that the original level needs to have about 15%
of the area milled to achieve the same level of thickness quality.
[Figure 10. The Percent Area for Secured HMA Thickness]
6.3. Analysis Results for Cost Optimization
6.3.1. Factors for Optimization Analysis
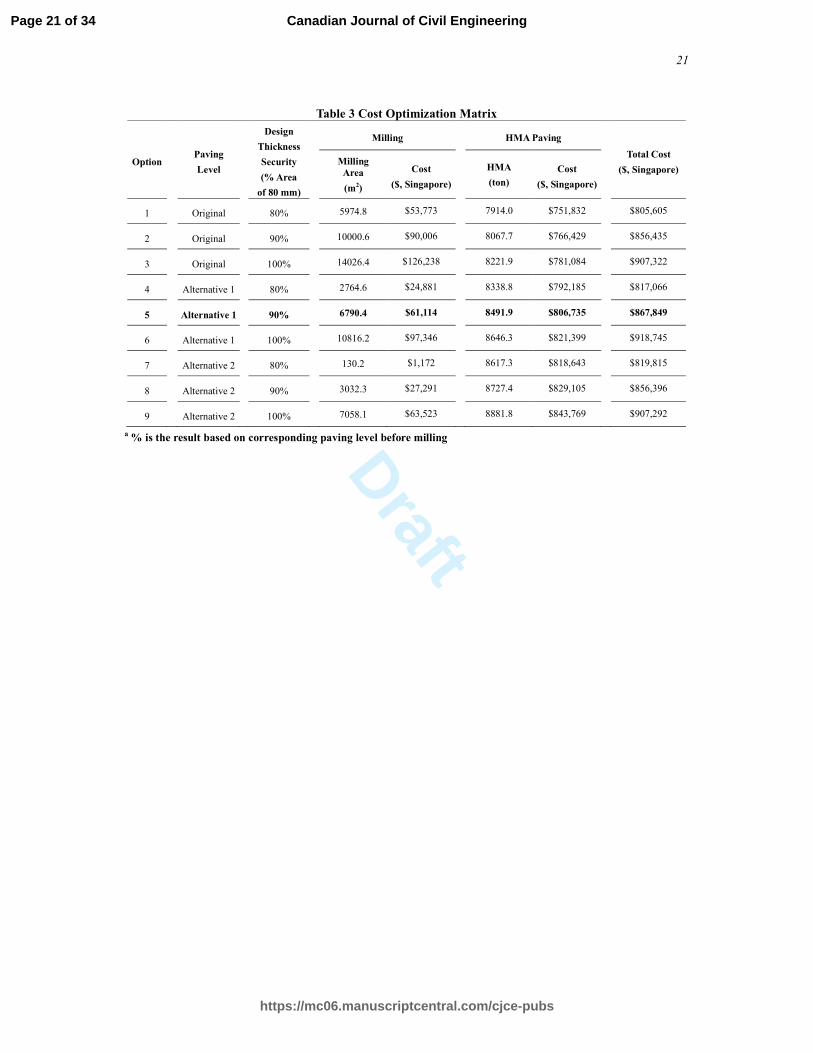
Table 3 presents an optimization matrix with 9 options. The options are composed of paving level, design
thickness security, HMA quantity, and milling work. HMA material quantities and milling work were
computed under the assumption that the corresponding paving level is applied and the percentage of design
thickness security is achieved.
Thickness quality was categorized with 3 levels, 80%, 90%, and 100% for securing design thickness
As shown in Figure 9, virtual paving simulation indicates that over 70 mm thickness covered more than 80% of
the area for all paving levels. Eighty percent coverage was the lowest level chosen for optimization analysis.
Milling area was computed for the corresponding percent of secured thickness, 80%, 90%, and 100%. Unit
cost of milling work was $9 Singapore dollars per 25 mm depth, and overall milling cost was estimated for the
corresponding milling area. Note that milled concrete volume was assumed to be a third of the milling area
multiplied by the 25 mm milling depth. HMA tonnage was computed by multiplying the simulated volume by
2.3 ton/m3 of unit HMA weight. Milled concrete volume was also added in the HMA tonnage since the milled
volume will be replaced by HMA. The unit cost of HMA was $95 Singapore dollars per ton.
Page 13 of 34
https://mc06.manuscriptcentral.com/cjce-pubs
Canadian Journal of Civil Engineering
Draft
14
6.3.2. Optimization Results
Cost cannot be the only criterion to select the final paving option. Pavement quality is the priority in the
optimization process. The degree of pavement quality should be simultaneously examined. In addition,
construction period by milling should be carefully taken into consideration, although that factor was not listed in
Table 3.
Options with original levels were excluded since they cause significant milling work. A smaller
HMA quantity than the original level is not expected to compensate for the construction time delay associated
with milling work. Options with alternative 2 have the advantage of reducing the milling quantity compared to
alternative 1. On the other hand, alternative 1 seems to be favorable for pavement qualities such as uniformity
of HMA overlay thickness, compaction efficiency, and smoothness. Consequently, alternative 1 with milling
for 90% thickness security, option 5 in Table 3, was recommended as the optimized option. Note that this
choice does not mean that paving works were limited to the pavement quality of 90% thickness security. The
optimized choice was used as a reference plan to prevent surpluses from being wasted. In field milling work, a
higher degree of undulations could be removed.
[Table 3 Cost Optimization Matrix]
6.4. Expenses for Milling and Paving in the Field
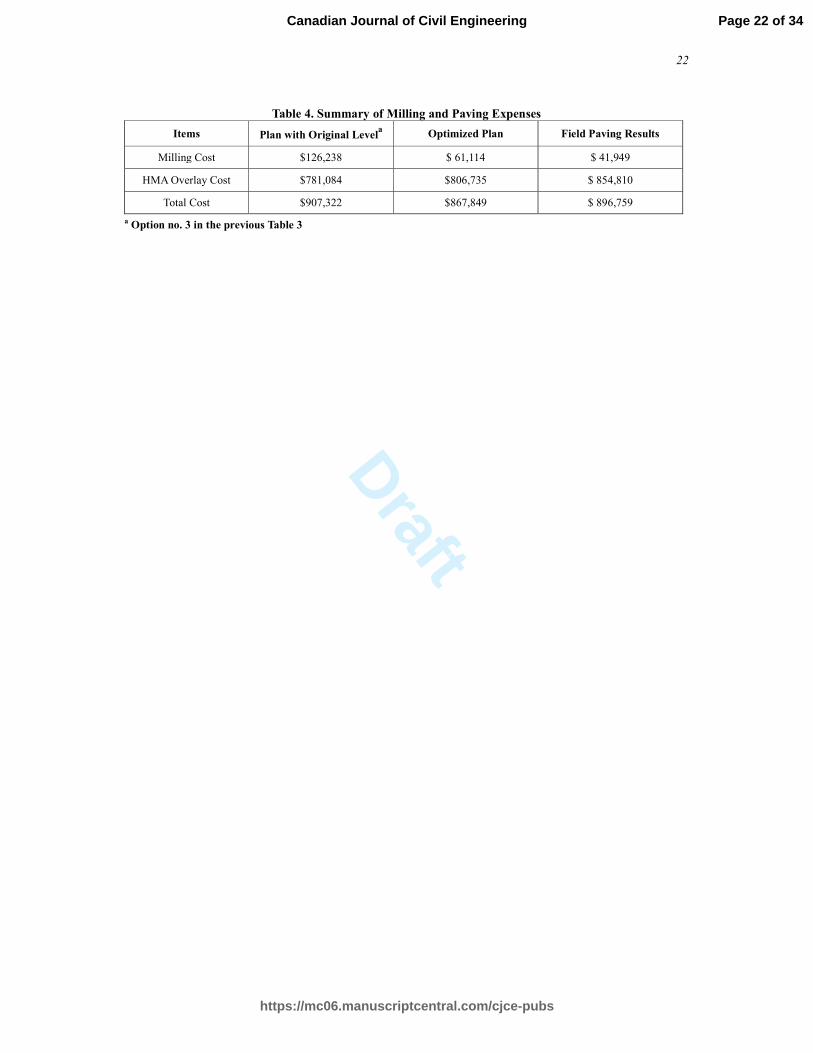
Table 4 summarizes the expenses for milling and paving. Selective milling using 3-D BIM reduced the cost by
a third compared to the original milling cost. Extension of the construction period by the amount of milling
work was not considered in this cost evaluation. If the effect was included in the cost analysis, the actual cost
benefits would be much higher.
As explained, due to use of a thickness paving method for the 2nd lift overlay, the HMA overlay
quantity consumed more than the optimized plan or the original plan. However, in those plans, thickness
paving was not counted. If the plans had been applied during field paving, they would increase HMA quantity
as well.
[Table 4. Summary of Milling and Paving Expenses]
Page 14 of 34
https://mc06.manuscriptcentral.com/cjce-pubs
Canadian Journal of Civil Engineering
Draft
15
6.5. Quality Assurance (QA) Results for Thickness and Density after Field Paving
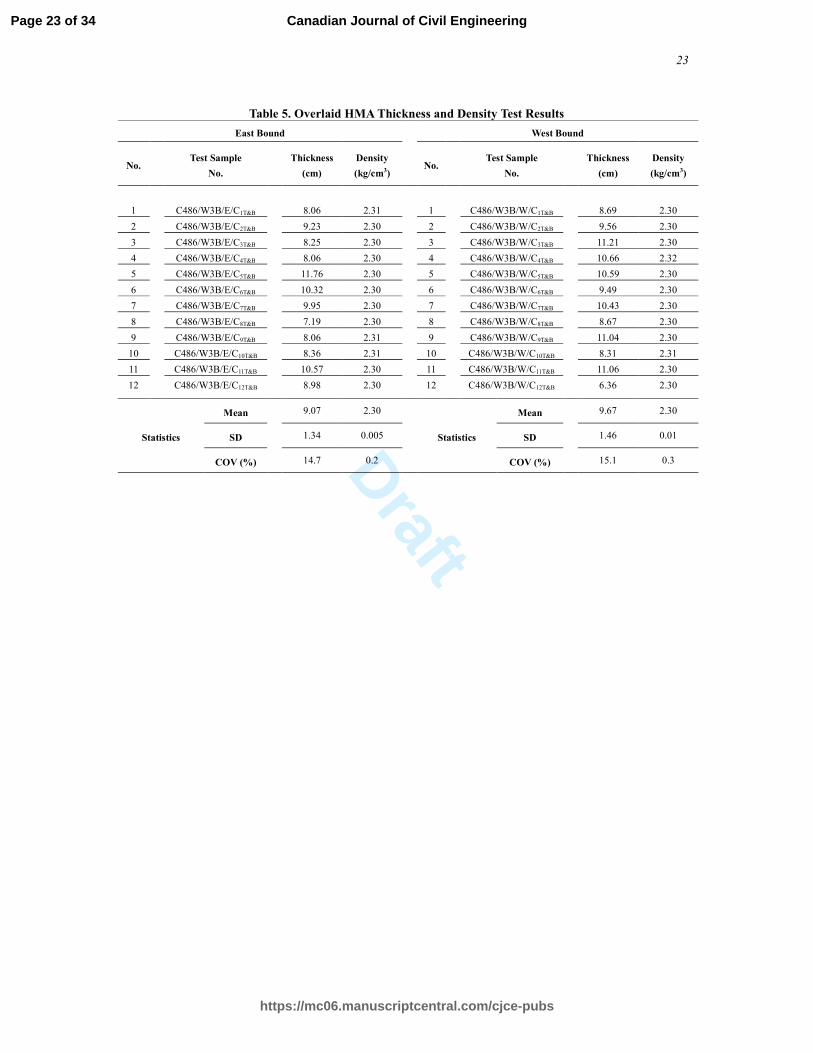
Table 5 presents quality assurance data for the thickness and density of the paved HMA core samples. A total
of 24 core samples were collected from the completed HMA overlay pavement. Thickness data shows that 22
out of 24 samples satisfy design thickness criteria. Mean thicknesses are 9.07 cm and 9.67 cm, east and west
bound, respectively. Most data is thicker than the design thickness, 80 mm. As mentioned, HMA quantity
was reduced slightly more than planned. The thicker results are consistent with the supplied HMA quantity.
Considering the LTA specification thickness range for the single lift, 40 mm − 65 mm, the thickness data for two
lifts can be regarded as satisfactory. Moreover, the coefficients of variation for both bounds are 14.7% and
15.1%, respectively. Thickness uniformity can be regarded as successfully achieved. Selective milling
contributes to the uniformity.
In addition, data for all samples indicates bulk dry densities, Gmb, over 2.30 kg/m3. The density
requirement was 98% of the reference density. The density results reflect that the 19 mm NMAS mix was
compacted within proper HMA mat thickness ranges.
[Table 5. Overlaid HMA Thickness and Density Test Results]
7. CONCLUSIONS AND FUTURE RECOMMENDATIONS
The primary significance of this study is to show that BIM can be effectively utilized to optimize quality and
cost in ‘pavement engineering’ just as in other civil structure(s). The ‘In-advance Simulation,’ ‘3-D
Visualization’, ‘Interference Identification,’ and ‘Quantification’ capabilities of BIM enhance the efficiencies of
individual paving sequences. Implementation of BIM in HMA overlaying work resulted in an obvious
improvement in pavement quality and reduced paving costs. The developed method can be regarded as state-
of-practice for pavement engineering. Detailed achievements include
� In-Advance Simulation:
Paving sequences could be successfully simulated in BIM. Condition of the pre-overlay surface was
accurately modeled. Paving level alternatives could be derived from the BIM model. Diverse HMA
overlaying patterns could be readily simulated in the BIM model.
� 3-D Visualization:
Page 15 of 34
https://mc06.manuscriptcentral.com/cjce-pubs
Canadian Journal of Civil Engineering
Draft
16
BIM produced 3-D visualized displays or drawings for simulated paving conditions. During simulation
and quantification processes, engineers were able to observe paving results on a 3-D display. The 3-D
display helps to identify potential sources of interference such as paving thickness. In the field paving
process, based on the 3-D outputs, interferences were marked in 2-D drawings, and field engineers
selectively operated milling equipment only at those locations that had excessive elevation. Selective
milling reduced project costs.
� Interference Identification:
Interference identification is one of the primary functions of BIM. Interference items in paving work
include thickness security, elevation tolerance, and paving equipment accessibility. This study proved
that interferences in paving work, as in other civil structures, can be detected using BIM.
� Quantification:
Simulated paving results were quantified in terms of volume and area, particularly for milling and
overlaying. The quantified information was used to optimize pavement quality and cost. BIM was
easily capable of computing every possible realistic paving case. The amount of quantified information
from BIM allows the best paving option to be determined.
The BIM model in this study was established with a survey resolution of 3 m x 10 m. If a higher resolution
had been used, outputs would have been more defined. Undulation conditions on a concrete bridge deck
surface are similar to those on a tunnel concrete base slab surface. The BIM paving technique developed in this
study can therefore be applied to HMA overlay on a concrete bridge deck surface.
Page 16 of 34
https://mc06.manuscriptcentral.com/cjce-pubs
Canadian Journal of Civil Engineering
Draft
17
REFERENCES
Bae, A, Lee, D, and Tan., J. 2015. IRI reduction of HMA overlay on concrete base slab in urban tunnel
expressway. TRB 94th Annual Meeting, Washington D.C.
Brown, E.R., Kandhal, P.S., Roberts, F.L., Kim, Y.R., Lee, D.Y., and Kennedy, T.W. 2009. Hot mix asphalt
materials, mixture design, and construction. Third Edition. National Asphalt Paving Association Research
and Education Foundation. Lanham, MD.↵
Building and Construction Authority (BCA). 2011. BCA’s building information modelling roadmap. Available
from https://www.bca.gov.sg/newsroom/others/pr02112011_bib.pdf, Singapore Government [accessed 03 June
2016]
Building Information Modeling. 2008. BIM Handbook: A guide to building information modeling for owners,
managers, designers, engineers, and contractors. John Wiley & Sons, Inc.
Crossrail Ltd. 2016. Driving industry standards for design innovation on major infrastructure projects,. Available
from http://www.crossrail.co.uk/construction/building-information-modelling [accessed 02 June 2016]
Engineering Group. 2010. Materials and workmanship specification for civil and structural works, Land
Transport Authority, Singapore.
Ensell, J. 2012. Milling and paving operations for smoothness and uniformity. J. the Association of Asphalt
Technologists, 51: 769-772.
Fanning, B, Clevenger, M. C., Ozbek, E. M., and Mahmoud, H. 2015. Implementing BIM on infrastructure:
comparison of two bridge construction projects, ASCE, The Practice Periodical on Structural Design and
Construction, DOI: 10.1061/(ASCE)SC.1943-5576.0000239.
Federal Highways Administration (FHWA) and National Asphalt Pavement Association (NAPA). 2001.
HMA pavement mix type selection guide, Information Series 128, U.S. Department of Transportation.
Japan Construction Information Center (JACIC). 2016. The key-base information station for the construction
industry to pave way for the future japan construction information center - General Incorporated Foundation.
Available from http://www.jacic.or.jp/english/count31.html [accessed 02 June 2016]
Page 17 of 34
https://mc06.manuscriptcentral.com/cjce-pubs
Canadian Journal of Civil Engineering
Draft
18
Kim, C., Kim, H., Park, T., and Kim, M. 2011. Applicability of 4D CAD in civil engineering construction: Case
study of a cable-stayed bridge project,” ASCE, J. Computing in Civil Engineering, 25(1): 98-107 DOI:
10.1061/(ASCE)CP.1943-5487.0000074.
McGraw-Hill Construction. 2012. The business value of BIM for infrastructure – Addressing America’s
infrastructure challenges with collaboration and technology, Smart Market Report.
Reeder D. G. and Nelson, A. G. 2015. Implementation manual - 3D engineered models for highway construction:
The Iowa experience,” Report no. RB33-014, National Concrete Pavement Technology Center Institute for
Transportation, Iowa State University.
Schwarz, J. 2006. Three degrees of cold: today's milling contractor needs to stock up on latest and most
complete line of equipment. Roads and Bridges, 44(5): 54-56.
Sidlar, G. 2006. Must be exact: when done right, precision milling carries heavy benefits in urban areas. Roads
and Bridges, 44(5): 50-52.
Woof, M. 2011. Milling sophistication, World Highways/Routes du Monde, July/August:48-50. Available from
http://www.worldhighways.com/categories/measurement-survey-design-software/features/asphalt-milling-
optimised-by-3d-controls [accessed 21 July 2016]
Yabuki, N., Azumaya, Y., Akiyama, M., Kawanai, Y., and Miya, T. (2007). Fundamental study on development
of a shield tunnel product model. J. Applied Computing in Civil Engineering, 16: 261-268.
Page 18 of 34
https://mc06.manuscriptcentral.com/cjce-pubs
Canadian Journal of Civil Engineering
Draft
19
TABLES
Table 1. Virtual 3-D Paving Simulation Results Using BIM
HMA Thickness Security
Original Paving Level Paving Level Alternative 1 Paving Level Alternative 2
80mm
70mm
60mm
Page 19 of 34
https://mc06.manuscriptcentral.com/cjce-pubs
Canadian Journal of Civil Engineering
Draft
20
Table 2. Quantitative Information from Paving Simulation
(a) Area (m2)
Secured Thickness
Original Level
Alternative 1 Level
Alternative 2 Level
East West
East West
East West
Over 80 mm
13620 12612
15172 14270
17985 15215
70mm ~ 80mm
4189 3609
4569 3958
2728 3396
60mm ~ 70mm
2376 1940
1141 788
334 542
50mm ~ 60mm
742 735
190 156
26 22
40mm ~ 50mm
149 286
3 10
3 7
30mm ~ 40mm
0 20
0 4
0 0
Total Area
21076 19182
21076 19182
21076 19182
(b) Volume (m3)
Secured Thickness
Original Level
Alternative 1 Level
Alternative 2 Level
East West
East West
East West
Over 80 mm
1686.1 1509.5
1816.9 1698.8
1947.6 1765.9
70mm ~ 80mm
51.8 42.2
30.3 20.5
12.2 15.2
60mm ~ 70mm
20.0 18.2
7.0 4.9
1.1 2.2
50mm ~ 60mm
5.1 6.3
0.4 0.5
0.1 0.1
40mm ~ 50mm
0.5 1.5
0.0 0.1
0.0 0.0
30mm ~ 40mm
0.0 0.2
0.0 0.0
0.0 0.0
Total Area
1763.47 1577.83
1854.6 1724.87
1961.03 1783.46
Page 20 of 34
https://mc06.manuscriptcentral.com/cjce-pubs
Canadian Journal of Civil Engineering
Draft
21
Table 3 Cost Optimization Matrix
Option
Paving
Level
Design
Thickness
Security
(% Area
of 80 mm)
Milling
HMA Paving
Total Cost
($, Singapore) Milling
Area
(m2)
Cost
($, Singapore)
HMA
(ton) Cost
($, Singapore)
1 Original 80% 5974.8 $53,773 7914.0 $751,832 $805,605
2 Original 90% 10000.6 $90,006 8067.7 $766,429 $856,435
3 Original 100% 14026.4 $126,238 8221.9 $781,084 $907,322
4 Alternative 1 80% 2764.6 $24,881 8338.8 $792,185 $817,066
5 Alternative 1 90% 6790.4 $61,114 8491.9 $806,735 $867,849
6 Alternative 1 100% 10816.2 $97,346 8646.3 $821,399 $918,745
7 Alternative 2 80% 130.2 $1,172 8617.3 $818,643 $819,815
8 Alternative 2 90% 3032.3 $27,291 8727.4 $829,105 $856,396
9 Alternative 2 100% 7058.1 $63,523 8881.8 $843,769 $907,292
a % is the result based on corresponding paving level before milling
Page 21 of 34
https://mc06.manuscriptcentral.com/cjce-pubs
Canadian Journal of Civil Engineering
Draft
22
Table 4. Summary of Milling and Paving Expenses
Items Plan with Original Levela Optimized Plan Field Paving Results
Milling Cost $126,238 $ 61,114 $ 41,949
HMA Overlay Cost $781,084 $806,735 $ 854,810
Total Cost $907,322 $867,849 $ 896,759
a Option no. 3 in the previous Table 3
Page 22 of 34
https://mc06.manuscriptcentral.com/cjce-pubs
Canadian Journal of Civil Engineering
Draft
23
Table 5. Overlaid HMA Thickness and Density Test Results
East Bound West Bound
No. Test Sample
No.
Thickness
(cm)
Density
(kg/cm3) No.
Test Sample
No.
Thickness
(cm)
Density
(kg/cm3)
1 C486/W3B/E/C1T&B 8.06 2.31 1 C486/W3B/W/C1T&B 8.69 2.30
2 C486/W3B/E/C2T&B 9.23 2.30 2 C486/W3B/W/C2T&B 9.56 2.30
3 C486/W3B/E/C3T&B 8.25 2.30 3 C486/W3B/W/C3T&B 11.21 2.30
4 C486/W3B/E/C4T&B 8.06 2.30 4 C486/W3B/W/C4T&B 10.66 2.32
5 C486/W3B/E/C5T&B 11.76 2.30 5 C486/W3B/W/C5T&B 10.59 2.30
6 C486/W3B/E/C6T&B 10.32 2.30 6 C486/W3B/W/C6T&B 9.49 2.30
7 C486/W3B/E/C7T&B 9.95 2.30 7 C486/W3B/W/C7T&B 10.43 2.30
8 C486/W3B/E/C8T&B 7.19 2.30 8 C486/W3B/W/C8T&B 8.67 2.30
9 C486/W3B/E/C9T&B 8.06 2.31 9 C486/W3B/W/C9T&B 11.04 2.30
10 C486/W3B/E/C10T&B 8.36 2.31 10 C486/W3B/W/C10T&B 8.31 2.31
11 C486/W3B/E/C11T&B 10.57 2.30 11 C486/W3B/W/C11T&B 11.06 2.30
12 C486/W3B/E/C12T&B 8.98 2.30 12 C486/W3B/W/C12T&B 6.36 2.30
Statistics
Mean 9.07 2.30
Statistics
Mean 9.67 2.30
SD 1.34 0.005 SD 1.46 0.01
COV (%) 14.7 0.2 COV (%) 15.1 0.3
Page 23 of 34
https://mc06.manuscriptcentral.com/cjce-pubs
Canadian Journal of Civil Engineering
Draft
24
Lists of Figure Captions
Figure 1. Open-Cut Tunnel Design
Figure 2. Construction Condition of Concrete Base Slab
Figure 3. As-Built Concrete Base Slab Surface
Figure 4. As-Built Base Slab Surface Undulation
Figure 5. BIM Utilization Methodology for Optimized Paving
Figure 6. Digital Terrain Model
Figure 7. Adjustment for Excessive Elevations on the As-Built Concrete Slab Surface
Figure 8. BIM Simulation of HMA overlaying
Figure 9. Milling and Paving Works
Figure 10. The Percent Area for Secured HMA Thickness
Page 24 of 34
https://mc06.manuscriptcentral.com/cjce-pubs
Canadian Journal of Civil Engineering
Draft
Manuscript DOI No: 10.1139/cjce-2015-0001
(a) Open-Cut Tunnel Geometry
(b) Pavement Design
Figure 1. Open-Cut Tunnel Design
Fill
Trunk
Sewer
Φ2.5m
Manhole
Strut 2
Strut 1
56.0~80.5m
Tubular
Pile
DSM (Deep Soil Mixing) JGP (Jet Grouting)
9~10m
Bored Pile (Earth Drill)
East Bound West Bound
Concrete Base Slab
Soft
Ground
Page 25 of 34
https://mc06.manuscriptcentral.com/cjce-pubs
Canadian Journal of Civil Engineering
Draft
Manuscript DOI No: 10.1139/cjce-2015-0001
(a) Reinforced Steel Installation for Form Casting (b) Surface Finishing
Figure 2. Construction Condition of Concrete Base Slab
Page 26 of 34
https://mc06.manuscriptcentral.com/cjce-pubs
Canadian Journal of Civil Engineering
Draft
Manuscript DOI No: 10.1139/cjce-2015-0001
Figure 3. As-Built Concrete Base Slab Surface
Page 27 of 34
https://mc06.manuscriptcentral.com/cjce-pubs
Canadian Journal of Civil Engineering
Draft
Manuscript DOI No: 10.1139/cjce-2015-0001
(a) Plan View (b) Section View
Figure 4. As-Built Base Slab Surface Undulation
Page 28 of 34
https://mc06.manuscriptcentral.com/cjce-pubs
Canadian Journal of Civil Engineering
Draft
Manuscript DOI No: 10.1139/cjce-2015-0001
Figure 5. BIM Utilization Methodology for Optimized Paving
Derivation of
Alternative Paving Levels
Establishment of BIM
Digital Terrain Model
→ Identification of Pre-Overlay Condition
Survey for
Pre-Overlay Surface
(3-D Scan or Survey)
Paving Cost Optimization
Analysis
→ Selection of Paving Level and Milling Quantity
Quantification of
Paving Volume and Area
→ Evaluating % Area
of Secured Thickness
Paving Simulation
for Alternative Levels
Page 29 of 34
https://mc06.manuscriptcentral.com/cjce-pubs
Canadian Journal of Civil Engineering
Draft
Manuscript DOI No: 10.1139/cjce-2015-0001
(a) DTM of General Highway Topography
(b) Side View of DTM of MCE C486 Expressway
(c) Plan View of DTM of MCE C486 Expressway
Figure 6. Digital Terrain Model
Page 30 of 34
https://mc06.manuscriptcentral.com/cjce-pubs
Canadian Journal of Civil Engineering
Draft
Manuscript DOI No: 10.1139/cjce-2015-0001
(a) Elevation Difference between As-Built Level and Original Design Level
(b) Elevation Difference between Corrected Alternative Level and Design Level
Figure 7. Adjustment for Excessive Elevations on the As-Built Concrete Slab Surface
-1.5
-1.0
-0.5
0.0
0.5
1.0
1.5
2.0
2.5
3.0
3.5
4.0
4+330
4+340
4+350
4+360
4+370
4+380
4+390
4+400
4+410
4+420
4+430
4+440
4+450
4+460
4+470
4+480
4+490
4+500
4+510
4+520
4+530
4+540
4+550
4+560
4+570
4+580
4+590
4+600
4+610
4+620
4+630
4+640
4+650
As-
Built -D
esign L
evel
(cm
)
-1.5
-1.0
-0.5
0.0
0.5
1.0
1.5
2.0
2.5
3.0
3.5
4.0
4+330
4+340
4+350
4+360
4+370
4+380
4+390
4+400
4+410
4+420
4+430
4+440
4+450
4+460
4+470
4+480
4+490
4+500
4+510
4+520
4+530
4+540
4+550
4+560
4+570
4+580
4+590
4+600
4+610
4+620
4+630
4+640
4+650
Alternative -
Design L
evel
(cm
)
As-Built Surface Level
Corrected Alternative Level
Page 31 of 34
https://mc06.manuscriptcentral.com/cjce-pubs
Canadian Journal of Civil Engineering
Draft
Manuscript DOI No: 10.1139/cjce-2015-0001
(a) Digital Terrain Model for the As-Built Concrete Slab Surface
(b) The As-Built Profile of Section A-A (c) The As-Built and Design Surface Profiles
(d) HMA Overlaying Simulation for Section A’-A’
Figure 8. BIM Simulation of HMA overlaying
Page 32 of 34
https://mc06.manuscriptcentral.com/cjce-pubs
Canadian Journal of Civil Engineering
Draft
Manuscript DOI No: 10.1139/cjce-2015-0001
(a) Milling Equipment Placement (b) Selectively Milled Surface
(c) Preparation of Overlay Level (d) HMA Overlaying
Figure 9. Milling and Paving Works
Page 33 of 34
https://mc06.manuscriptcentral.com/cjce-pubs
Canadian Journal of Civil Engineering
Draft
Manuscript DOI No: 10.1139/cjce-2015-0001
(a) East Bound (b) West Bound
Figure 10. The Percent Area for Secured HMA Thickness
60
70
80
90
100
80 mm 70 mm 60 mm 50 mm 40 mm
% Area for Secured Thickness
(%)
HMA Overlay Thickness
Original Paving Level
Alternative Level 1
Alternative Level 2
60
70
80
90
100
80 mm 70 mm 60 mm 50 mm 40 mm
% Area for Secured Thickness
(%)
HMA Overlay Thickness
Original Paving Level
Alternative Level 1
Alternative Level 2
Page 34 of 34
https://mc06.manuscriptcentral.com/cjce-pubs
Canadian Journal of Civil Engineering