Embed Size (px)
Citation preview
Bile Acid and Sterol Metabolism with Combined
HMGCoA Reductase and PCSK9 Suppression
Rex A. Parker1*
, Ricardo Garcia1, Carol S. Ryan
1, Xiaoqin Liu
1, Petia Shipkova
2, Valentin Livanov
3,
Pritesh Patel3, and Siew P. Ho
3
1 Cardiovascular Discovery Biology,
2 Discovery Analytical Sciences, and
3 Applied Genomics;
Bristol-Myers Squibb Pharmaceutical Research & Development, Pennington, NJ 08534 USA
* Corresponding author: Rex A. Parker [email protected] 609-818-3252
Running title:
Statin/PCSK9 combined effects on murine bile acid metabolism
by guest, on June 21, 2018w
ww
.jlr.orgD
ownloaded from
2
Abstract
PCSK9 inhibition markedly augments the LDL lowering action of statins. The combination is being
evaluated for long-term effects on atherosclerotic disease outcomes. However, effects of combined
treatment on hepatic cholesterol and bile acid metabolism have not yet been reported. To study this,
PCSK9-Y119X mutant (knockout) and wild type mice were treated atorvastatin for 12 wks.
Atorvastatin progressively lowered plasma LDL in each group, but no differences in liver cholesterol,
cholesterol ester, or total bile acid concentrations, or in plasma total bile acid levels were seen. In
contrast, atorvastatin increased fecal total bile acids (~2-fold, P<0.01) and cholesterol concentrations
(~3-fold, P<0.01) vs. controls for both PCSK9-Y119X and wild type mice. All 14 individual bile acids
resolved by LC-MS, including primary, secondary, and conjugated species, reflected similar increases.
Expression of key liver bile acid synthesis genes CYP7A1 and CYP8B1 were ~2.5-fold higher with
atorvastatin in both strains, but mRNA for liver bile acid export and reuptake transporters and
conjugating enzymes were not unaffected. The data suggest that hepatocyte cholesterol and bile acid
homeostasis is maintained with combined PCSK9 and HMGCoA reductase inhibition through efficient
liver enzymatic conversion of LDL-derived cholesterol into bile acids and excretion of both, with
undisturbed enterohepatic recycling.
Supplementary key words: PCSK9 inhibitors, HMGCoA reductase inhibitors, statins, bile acids,
CYP7A1, bile acid transporter, cholestasis, LDL receptor, ENU mutagenesis
by guest, on June 21, 2018w
ww
.jlr.orgD
ownloaded from
3
Introduction
Proprotein convertase subtilisin-kexin-9 (PCSK9) activity has a profound effect on cholesterol
metabolism in humans and animal models, as revealed through genetic studies,1
2
3
4 knockout and
transgenic mice,5 6 7 and recent studies with PCSK9-inhibiting monoclonal antibodies, Adnectins, and
antisense oligonucleotides.8
9
10 Evaluation of PCSK9 inhibitors in combination with statins is
important to understand the full potential of this new class of low density lipoprotein cholesterol (LDL-
C) lowering agents. Both statins and PCSK9 inhibitors lower circulating LDL-C levels by increasing
LDL receptor (LDLR) activity primarily in liver. The hepatic production and enterohepatic circulation
of bile acids is important for regulation of whole body cholesterol metabolism, recycling of bile acids,
and absorption of nutrients. However the effects of PCSK9 suppression, in the presence and absence of
statins, on bile acid metabolism have not been previously reported. Greater LDL clearance increases
liver cholesterol exposure, potentially leading to cholesterol accumulation and/or increased conversion
to bile acids through liver metabolic pathways, which could affect gastrointestinal exposure to BAs.
Therefore the present study was conducted to analyze the pharmacological effects of statins combined
with PCSK9 suppression on bile acid and cholesterol balance and gene regulation in a mouse model.
Some PSK9 biologic inhibitors exhibit species-dependent target binding, and potential immune
responses to humanized antibodies in animal models can confound chronic pharmacological modeling in
animals. Therefore we used a genetic model of PCSK9 suppression, the PCSK9-Y119X mutant
(knockout) mouse model, to evaluate the long-term effects of combination inhibition. The mouse
tyrosine-119 mutation (Y119X) in the PCSK9 coding sequence results in loss of PCSK9 expression and
reduced plasma LDL, analogous to the PCSK9-Y142X loss of function mutation in humans. The loss
of PCSK9 expression in this model leads to increased liver LDLR protein and activity, and decreased
circulating LDL and total cholesterol. Using this mutant mouse model compared to wild type mice, the
effects of atorvastatin treatment (vs. statin-free controls) were studied over 12 wks. 48-hr fecal samples
by guest, on June 21, 2018w
ww
.jlr.orgD
ownloaded from

4
were collected and comprehensive analyses of fecal bile acids and cholesterol were conducted using LC-
MS. At the end of the study, liver cholesterol content was assayed and liver mRNA concentrations for
16 key sterol and bile acid pathway genes were conducted by RT-PCR. Significant changes in sterol
and bile acid metabolism were observed, with metabolic regulation driven by increased expression of a
very few liver genes accommodating the increased flux of cholesterol in liver and the increased
production of bile acids following stimulated cholesterol uptake with combined statin/PCSK9
suppression.
by guest, on June 21, 2018w
ww
.jlr.orgD
ownloaded from
5
Methods
Mouse model. Mice carrying a nonsense mutation (point mutation) in the PCSK9 coding sequence at
tyrosine 119 (Y119X) were generated through N-ethyl N-nitrosourea (ENU) mutagenesis.11
Frozen
embryos produced from matings of G1 male mice heterozygous for the Y119X allele of PCSK9 and
wild type female mice were used to establish a breeding colony of the mutant mice at BMS. The Y119X
positive progeny were extensively backcrossed with C57BL/6J mice through more than 8 generations
using speed congenics to derive the Y119X mice with >99.8% homogenous genetic background. The
mice were fertile and bred as homozygous matings to maintain the colony. Control C57BL/6J mice,
age- and weight- matched to the mutant mice, were obtained from The Jackson Laboratory.
Study design. For the study, each group comprised 10 homozygous mutant or wild-type mice (6 males
and 4 females for each treatment group) aged 3 months at the start. Mice were placed on diet containing
0.05% atorvastatin, or normal chow for 12 wks total Baseline plasma cholesterol and LDL-C values
were obtained and mice were randomized into control diet and atorvastatin supplemented diet (0.05% by
weight). The use of 0.05% idetary atorvastatin has previously been used in mouse studies of cholesterol
and bile acid metabolism.12
In our past work, this resulted in atorvastatin plasma exposure equivalent to
~10-15 mg/kg/day by oral gavage. Animals had continuous access to diet for the duration of the study.
Blood plasma samples collected in ethylenediamine tetraacetic acid were taken at 9-10 AM in the
morning (light phase) without fasting, every 2 wks for 8 wks. At wk 9, 48-hr accumulated fecal samples
were collected for each mouse for bile acid and cholesterol analyses. The study was terminated at wk 12
and liver samples were collected for assay of free and esterified cholesterol, and for isolation of RNA.
Plasma chemistry. EDTA plasma samples from were assayed for total cholesterol, LDL cholesterol
(direct LDL), and total bile acids by standard plasma chemistry laboratory enzymatic methods using an
Olympus automated analyzer (model AU680). In addition, interim plasma samples at 6 weeks were
assayed for alanine aminotransferase (ALT) and aspartate aminotransferase (AST) levels to assess
by guest, on June 21, 2018w
ww
.jlr.orgD
ownloaded from
6
potential liver toxicity. The plasma chemistry analyses used enzymatic reagent kits: Cholesterol Assay
and Dirct LDL Assay, Roche Diagnostics; Total Bile Acids Assay, Bio Quant Laboratories.
Liver cholesterol and total bile acids. Homogenates of 0.3-0.5 g samples of livers were prepared in PBS
buffer. Aliquots were assayed for free and esterified cholesterol using enzymatic methods according to
Wako free cholesterol and Infinity esterified cholesterol reagent kits. Total bile acids were assayed
using the enzymatic recycling method from Bio Quant Laboratories.
LC-MS analysis of bile acids and cholesterol. The method for liquid chromatography-mass
spectrometry (LC-MS) quantitation of fecal cholesterol and bile acids from mice was as follows. The
MS responses and LC retention time characteristics were confirmed during method development using
commercially available standards. Mouse fecal samples were taken over a 48-hr collection period at wk
9 of the study and mixed before drying overnight (50 C). Aliquots (0.10 g) of dried samples received
0.7 mL water and were vortexed to a paste, and 1.4 ml of 1 N NaOH in EtOH was added followed by
vortexing and heating at 85 C for 2 hrs. Aliquots then received addition of 0.7 mL of water, 80 μg D6-
cholesterol (deuterated cholesterol standard) and 4.5 ug of D4-cholic acid (deuterated deoxycholic acid
standard) in 25 μL working solution to all samples. After vortexing, 3.0 mL of petroleum ether was
added with vortexing. Samples were centrifuged at 500 X G for 5 min, and for cholesterol 0.5 mL of the
upper phase was transferred to a 96-well assay block; for bile acids 0.6 mL of the lower clear layer was
transferred to the 96-well block. For cholesterol LC-MS analysis, the dried samples were reconstituted
in 200 uL of methanol/well in the 96-well plate, vortexed for 2 min, and centrifuged for 10 min. 120 uL
of the supernatant were transferred to new 96-well plates for LCMS analysis. The LC-MS analysis was
performed on a Thermo Acella uHPLC system interfaced with a Thermo Exactive mass spectrometer.
The uHPLC column used was a Waters BEH C8 2.1, 1.7u, 50mm and the detection was performed in
APCI positive ion mode at 25K resolution and data collection between 200 and 600 Da. For bile acid
LC-MS analysis, the dried samples were reconstituted in 200 uL of methanol in the 96-well plate. The
by guest, on June 21, 2018w
ww
.jlr.orgD
ownloaded from
7
plate was vortexed for 2 min and centrifuged for 10 min. 120 uL of the supernatant were transferred to a
new 96-well plate for LC-MS analysis. The LC-MS analysis was performed on a Thermo Acella uHPLC
system interfaced with a Thermo Exactive mass spectrometer. The uHPLC column used was a Waters
BEH C18 2.1, 1.7u, 150mm and the detection was performed in ESI negative ion mode at 25K
resolution and data collection between 200 and 1000 Da.
Liver mRNA extraction and RT-PCR assay. At 12 wks in the mouse study, whole liver was processed
for RNA isolation as follows. Tissue samples were immediately placed in RNAlater reagent and kept at
4C for 24 hrs, then removed and placed at -80 C in cassettes. To prepare RNA, ~30 mg tissue samples
were added to Biopur tubes with stainless steel bead on dry ice, followed by addition of 1.1 mL TRIzol
and lysing by TissueLyser at 30 Hz for 3 min. Samples then received 0.4 mL chloroform, were mixed
and incubated for 5 min at 20 C, and centrifuged for 25 min at 12,000 x G at 4 C. Supernatants (0.35
mL) from each sample were extracted in QIAcubes, and the extracted mRNA samples were stored -80 C
in 96-well plates with 1 µL of Protector RNase Inhibitor added.
For real-time qPCR measurements, total RNA was quantitated on a NanoDrop ND-1000 UV-Vis
spectrophotometer, and RNA quality was assessed on an Agilent 2100 BioAnalyzer. Aliquots of 1.0 ug
of RNA from each sample were converted to cDNA using the Applied Biosystems (ABI) High-Capacity
cDNA Archive Kit. Quantitative real-time PCR was conducted in 384-well reaction plates on an
Applied Biosystems Prism 7900HT sequence detector. The mRNA levels for specific genes were
normalized to 18S ribosomal RNA expression (ABI primer-probe set Hs99999901_s1). Standard curves
for each mRNA as well as 18s rRNA were generated by serially diluting cDNA from saline treated
animals. All measurements were performed in duplicate and mRNA was averaged within treatment
groups (n = 10 mice per group), and unpaired 2-tailed t-tests were performed to evaluate statistical
difference; p-values ≤ 0.05 were considered significant.
by guest, on June 21, 2018w
ww
.jlr.orgD
ownloaded from
8
Results
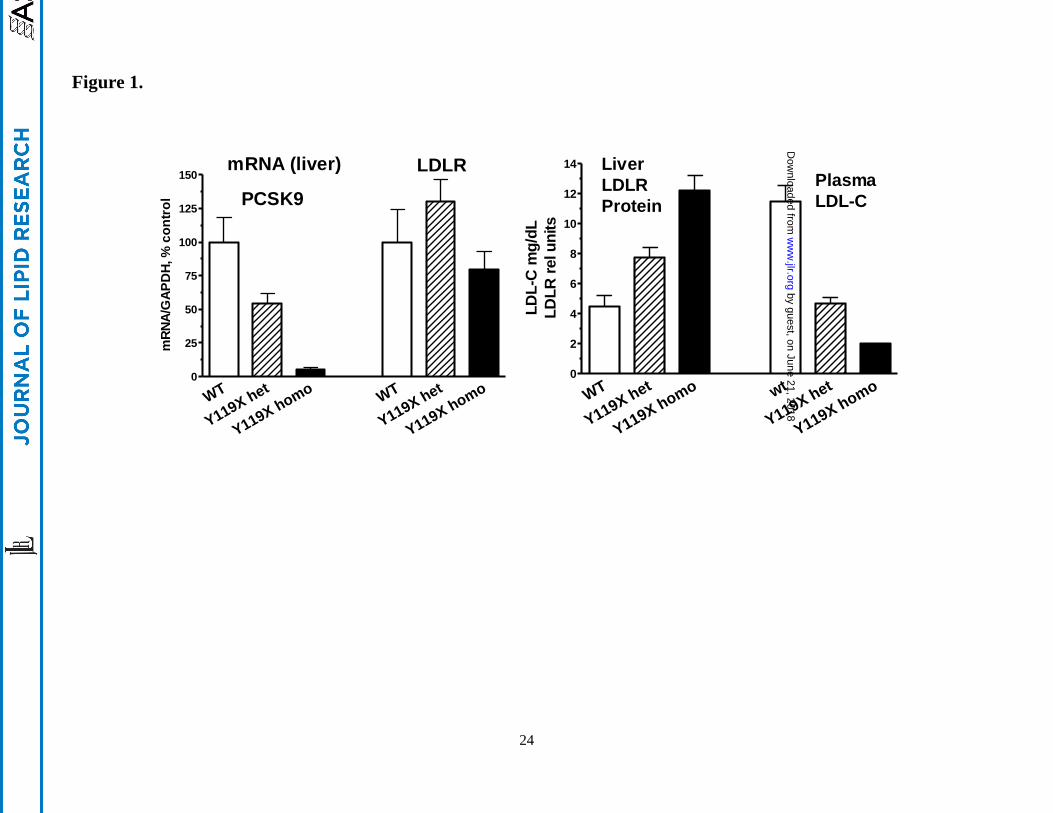
Phenotypic characterization. The Y119X point mutation in the PCSK9 coding sequence lies in the
prodomain of the protein, analogous to the human Y142X loss-of-function mutation.2 In initial studies
of the mutant mice, very low levels of PCSK9 mRNA for homozygous Y119X mice and ~50% lower
PCSK9 mRNA for the heterozygotes were measured by RT-PCR compared to wild type, suggesting
nonsense mediated decay of the point-mutant PCSK9 mRNA. LDLR mRNA levels in liver were not
significantly different between the mutant and wild type (Figure 1, left panel). PCSK9 protein was
undetectable in liver or plasma of the Y119X homozygous mice (not shown). In initial studies, wild-
type (C57BL/6J) mice, heterozygous Y119X, and homozygous Y119X mutant mice were studied at ~6
months age, maintained on a normal chow diet. Liver LDLR protein levels were increased ~2-fold in
the heterozygous and 3-fold in the homozygous mutants compared to wild type, and plasma LDL-C was
~50% lower in the heterozygous and ~80% lower in the Y119X homozygous mice compared to wild
type controls (Figure 1, right panel). For these endpoints, an intermediate phenotype in heterozygous
mutant mice was observed. These findings show that the Y119X mutation acts as a loss-of-function
mutation, and that loss of PCSK9 function leads to increased LDLR protein in liver and marked
decreases in circulating LDL-C levels as seen in humans with the Y142X mutation.
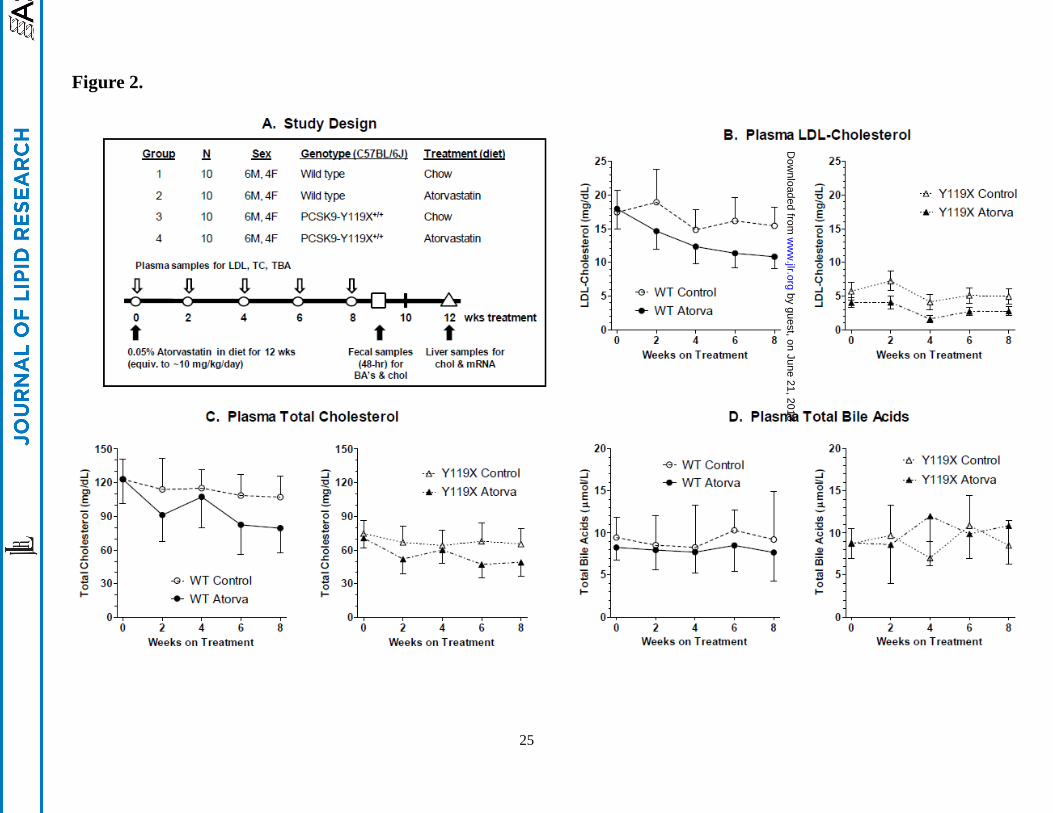
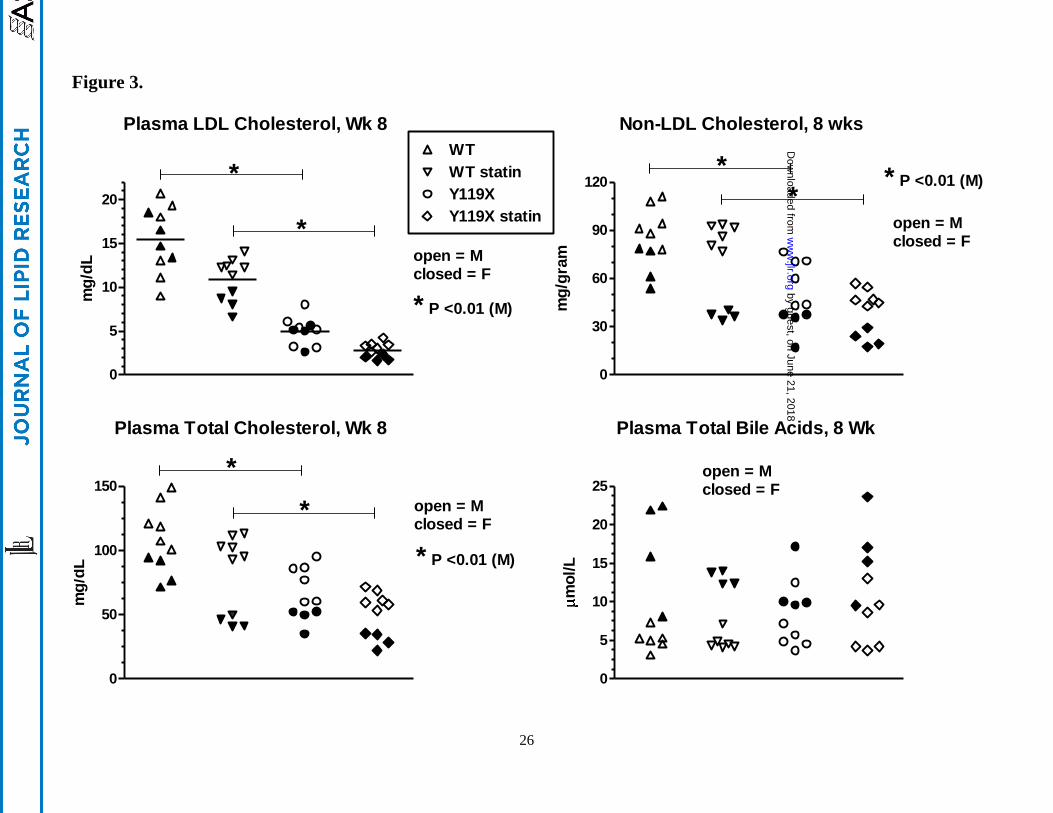
Statin treatment effects on plasma lipids. In the study design, age-matched cohorts of 20 C57BL/6J
(wild type) and 20 PCSK9-Y119X homozygous mice were randomized into groups of 10 mice each (6
males, 4 females) for atorvastatin treatment and sampling over time (Figure 2A). Plasma LDL-C
(Figure 2B) and total cholesterol (Figure 2C) tended to decrease progressively and approached plateau
values by 8 wks. Plasma total bile acids remained relatively constant in all groups (Figure 2D). At 8
wks treatment, atorvastatin significantly reduced LDL-C in homozygous PCSK9-Y119X mice and in
wild type mice (Figure 3), reaching levels near ~3 mg/dL in the mutant mice. Non-LDL cholesterol and
total cholesterol reflected similar atorvastatin effects although female mice showed greater apparent
by guest, on June 21, 2018w
ww
.jlr.orgD
ownloaded from
9
changes than males, whereas plasma total bile acids were not different between any groups despite wider
variability between animals (Figure 3), averaging ~8-10 µmoles/L for all time points. Furthermore
plasma ALT and AST were not different in any group (assayed at wk 6, not shown). These findings
suggest that bile acid enterohepatic recirculation and hepatocyte integrity were not significantly
disturbed with the combination of PCSK9 and HMGCoA reductase inhibition in mice despite strong
effects on LDL and total cholesterol.
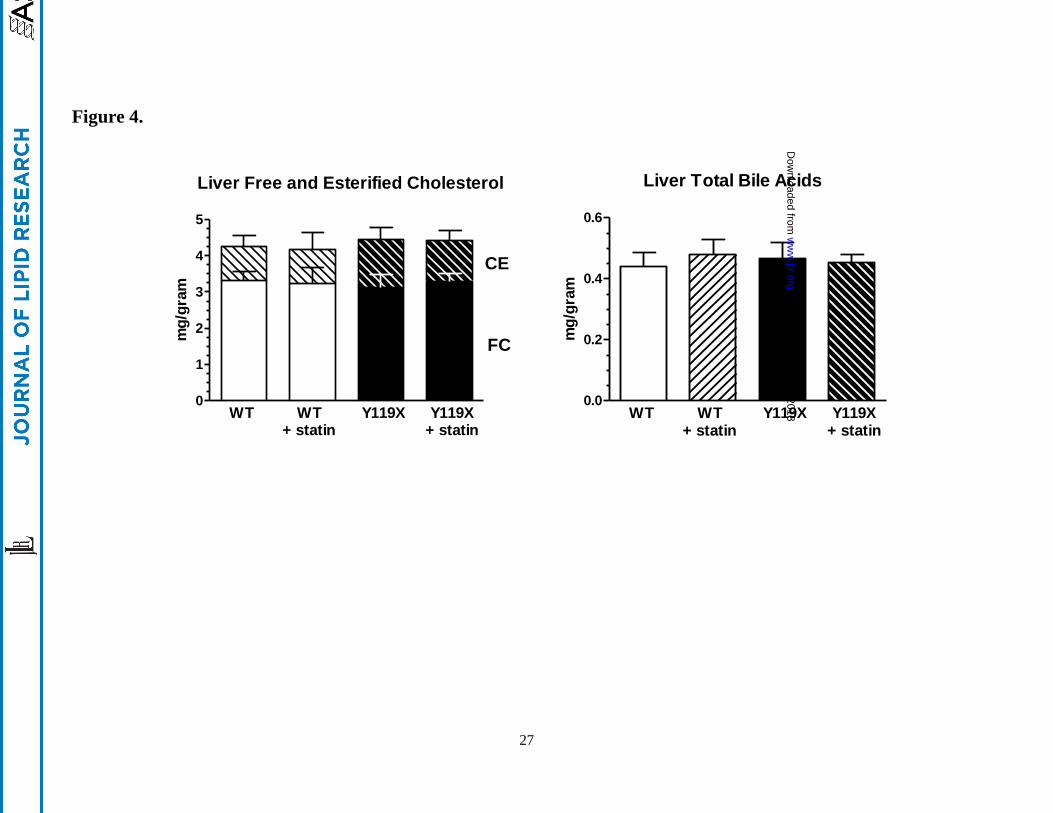
Liver cholesterol and total bile acids concentrations. We next examined whether the changes in plasma
cholesterol were associated with any differences in cholesterol accumulation in liver tissue. At 12 wks
treatment hepatic cholesterol and total bile acid concentrations were assayed by enzymatic method. No
differences in liver free cholesterol or esterified cholesterol mean concentrations were seen between any
of the 4 study groups (Figure 4, left panel). Male and female mice exhibited similar values.
Approximately 1/4 of total liver cholesterol was esterified in each group, and total levels observed were
consistent with previous studies in our laboratories. Similarly, liver total bile acids concentrations
measured enzymatically were essentially identical for all 4 groups in the study (Figure 4, right panel)
and similar levels were found in males and females. The levels of liver cholesterol relative to total bile
acids in liver were ~10:1 for all mice, and the liver total bile acid concentrations were similar to those
reported previously for normal mouse liver extracts using LC-MS/MS methodology.13
Overall the data
indicate that livers accumulated neither cholesterol nor bile acids despite the increased LDLR-mediated
hepatic uptake of plasma cholesterol stimulated by the combined mechanism of PCSK9 and HMGCoA
reductase inhibition. Liver cholesterol homeostasis was maintained throughout the study.
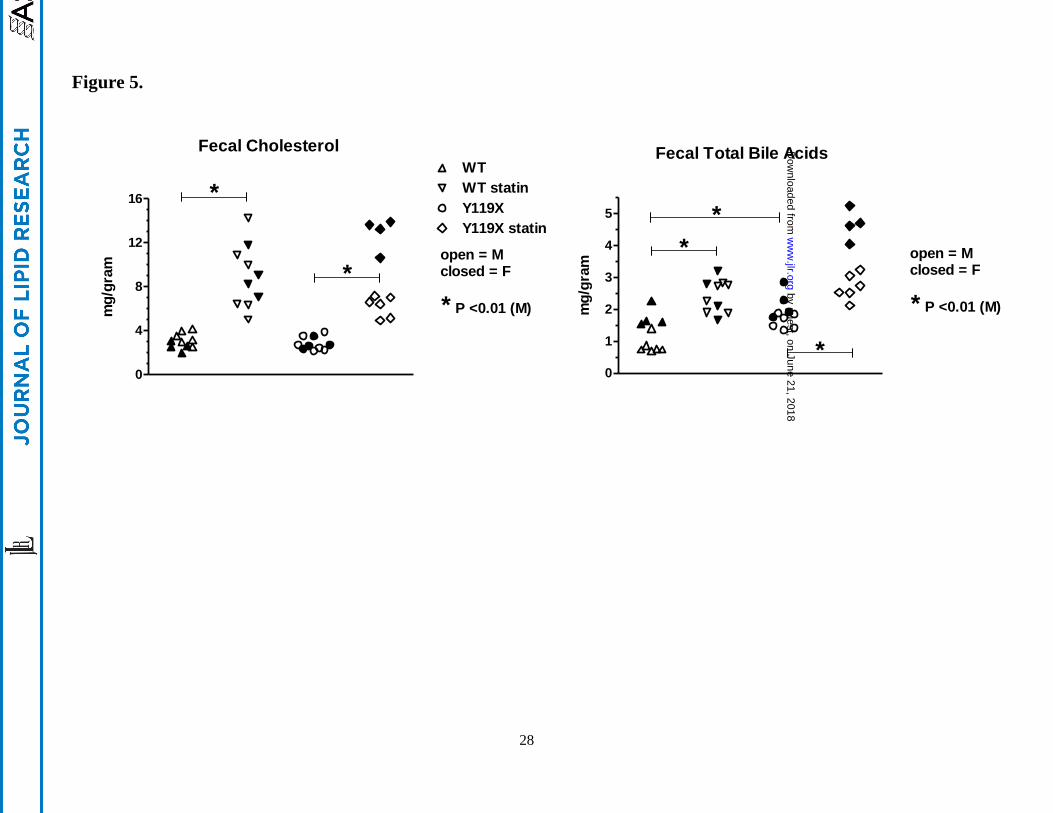
Fecal cholesterol. 48-hr accumulated fecal samples from each mouse were taken during the 9th week of
the study. The fecal samples were analyzed for free cholesterol by LC-MS, and for total bile acids by
both enzymatic method, as well as individual bile acids determined by LC-MS. Without statin
treatment, fecal cholesterol concentrations at 9 wks were the same for wild type and PCSK9-mutant
by guest, on June 21, 2018w
ww
.jlr.orgD
ownloaded from
10
mice, and males and females exhibited similar levels (Figure5). With atorvastatin treatment, the fecal
cholesterol concentrations were approximately 2-4-fold higher than statin-free controls for both wild-
type and PCSK9-Y119X mice (Figure 5, left panel; significance shown for male mice). Female
PCSK9-Y119X mice appeared to be more sensitive than males to the atorvastatin-induced increase in
fecal cholesterol concentrations. Since liver cholesterol concentrations were not affected by atorvastatin,
the data indicate that the statin-induced increase in flux of cholesterol from plasma into liver was
excreted via bile into the intestinal tract for elimination from the body. The finding that PCSK9-Y119X
mice (without statin) had lower plasma LDL-C but did not accumulate cholesterol or cholesterol esters
in liver, and had identical fecal cholesterol levels as wild type mice, suggested that genetic suppression
of PCSK9 may influence hepatic conversion of cholesterol into bile acids in mice.
Fecal bile acids. Total bile acids measured enzymatically in 48 hr fecal samples taken at wk 9 showed
significant effects of both statin treatment and genotype. Samples from PCSK9-Y119X mice had ~1.5-
2- fold higher total bile acids levels than wild type without statin treatment (P<0.01). Atorvastatin
increased fecal total bile acid concentrations approximately 2-fold over respective controls for both wild
type and PCSK9-Y119X mice (Figure 5, right panel; significance shown for male mice). Female
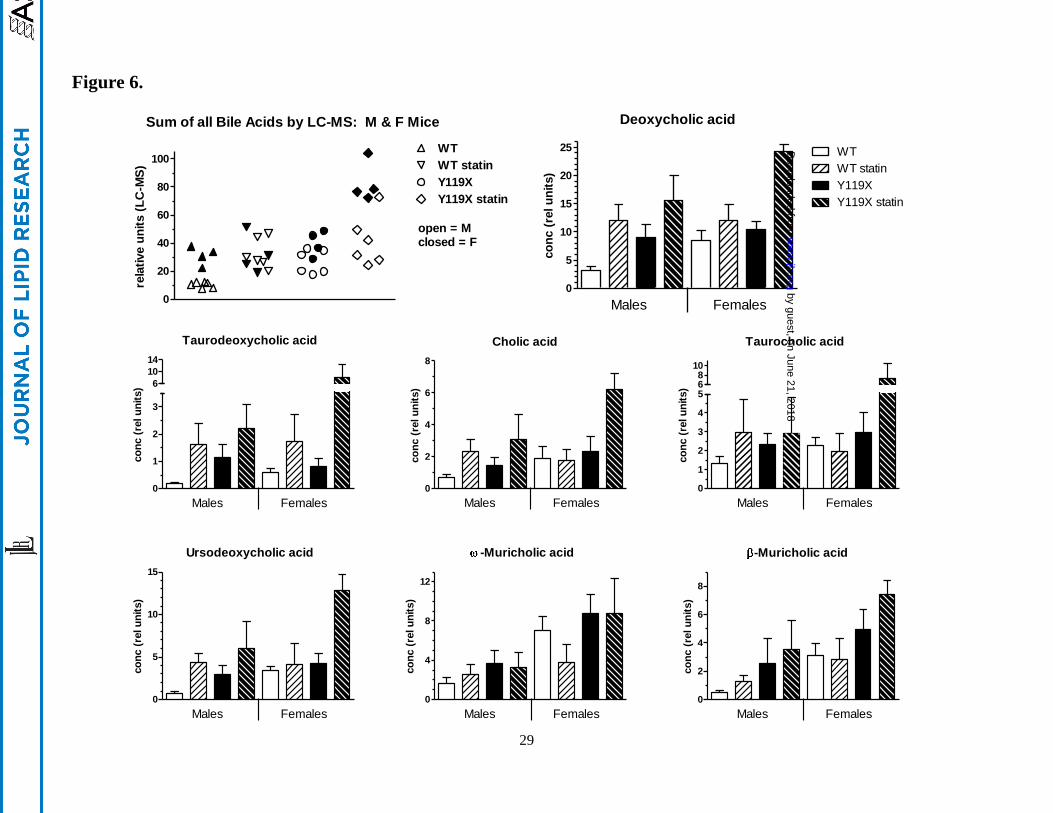
PCSK9 mutant mice appeared to be more sensitive to atorvastatin than males. Further analysis by LC-
MS of individual bile acids in the samples resolved 14 individual bile acid chemical species, including
primary and secondary bile acids in conjugated and unconjugated forms. This method provided high
resolution with relative quantification for the various species based on deuterated internal standard for
deoxycholate only (the highest abundance bile acid in the samples). The sum of all bile acids resolved
by LC-MS, as well as individual bile acids, were plotted by treatment group (Figure 6). These results
show patterns similar to those in the enzymatic total bile acids assay (Figure 5). Within each group,
female PCSK9-Y119X tended to be more sensitive than males to the inducing effect of atorvastatin,
including the primary cholic acid and secondary deoxycholic acid in both unconjugated and conjugated
by guest, on June 21, 2018w
ww
.jlr.orgD
ownloaded from
11
forms (Figure 6). Similar patterns between groups were seen for several other bile acids (not shown):
ursodeoxycholic acid and -muricholic acid, chenodeoxycholic acid, -muricholic acid, -muricholic
acid, glyco-deoxycholic acid, glyco-ursocholic acid, tauro-chenodeoxycholic acid, tauro-
ursodeoxycholic acid, and tauro-ursocholic acid.
Gene regulation in liver. Liver RNA samples were isolated at the end of the study (wk 12) for assay of
specific mRNAs for selected genes. Assays were conducted by RT-PCR using quantitative conditions
with standard curves. The genes were selected based on biological roles in respective pathways, the
statin mechanism, and data from a previous experiment using Affymetrix profiling to verify expression
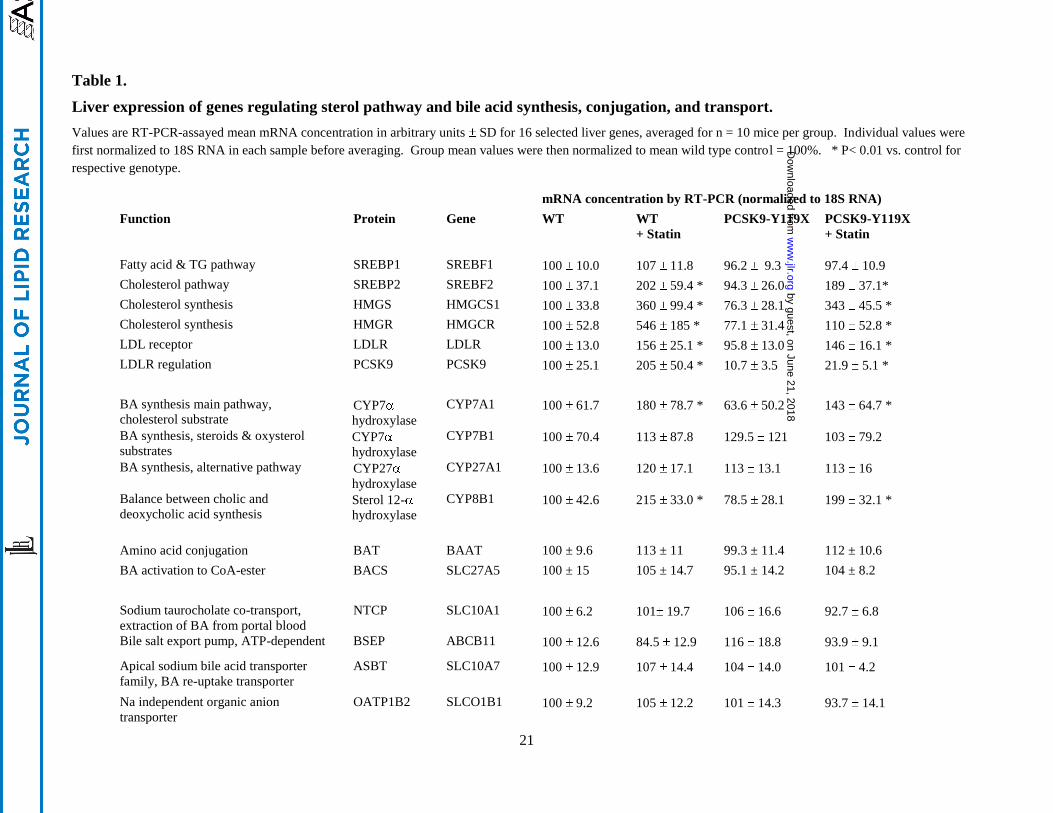
in the mouse model (Affymetrix genechip HT MG-430 PM, ~39,000 transcripts). Atorvastatin strongly
induced liver mRNA expression for the major regulatory genes in the sterol synthesis pathway in both
wild type and PCSK9-ko mice (Table 1). Expression of the sterol regulatory binding protein 2
(SREBP2) was increased 2-fold in both groups, while SRBEP1 was unaffected. Several SREBP2
response genes which control the cholesterol synthesis pathway were strongly upregulated by
atorvastatin to similar degrees in both wild type and PCSK9-Y119X mice. The LDL receptor gene was
also induced significantly in both groups. In PCSK9-Y119X mutant mice without statin treatment, no
differences in expression of any of these genes was found compared to wild type mice, with the
exception of PCSK9 mRNA which was 9-fold lower than in wild type, consistent with nonsense-
mediated decay of the mutant mRNA.
Atorvastatin treatment increased liver mRNA levels significantly by over 2-fold compared to statin-free
controls for the rate limiting enzymes of the main (neutral pH) bile acid pathway, CYP7A1 and
CYP8B1, in both wild type and PCSK9-Y119X mice (Table 1). No differences were seen in expression
of enzymes of the minor (acidic pH) pathway (CYP27A and 7B1). The enzymes regulating bile acid-
amino acid conjugation were unaffected. These findings suggest that liver cholesterol flux is diverted
into bile acid production and secretion into bile in liver of both wild-type and PCSK9 knockout mice
by guest, on June 21, 2018w
ww
.jlr.orgD
ownloaded from
12
through upregulation of key bile acid synthesis enzymes to similar degree. Without statin treatment,
PCSK9-Y119X mice showed little or no difference from wild type in the expression of these genes.
Expression of the bile acid transporter genes for export or reuptake were similar for both wild type and
mutants with or without atorvastatin, with only slight decreases (<20%) noted in the bile salt export
pump (BSEP) mRNA with atorvastatin for both genotypes (Table 1). Expression of an apical sodium
bile acid transporter (ASBT) family member (SLC10A7), the sodium taurocholate cotransporting
polypeptide (NTCP), and the sodium independent organic anion transporter (OATP1B2) were
unaffected in any of the groups. These data suggest that the capacity and rate of transhepatocellular
movement of bile acids across hepatocytes appears to be sufficient without further upregulation of the
transporter genes in the presence of combined PCSK9 and HMGCoA reductase inhibition. The
efficiency of both export from the hepatocyte and the extraction and reuptake of bile acids from blood
into the liver appears to be sufficient to accommodate the increased flux of bile acids encountered
following prolonged statin treatment of both wild type and PCSK9 knockout.
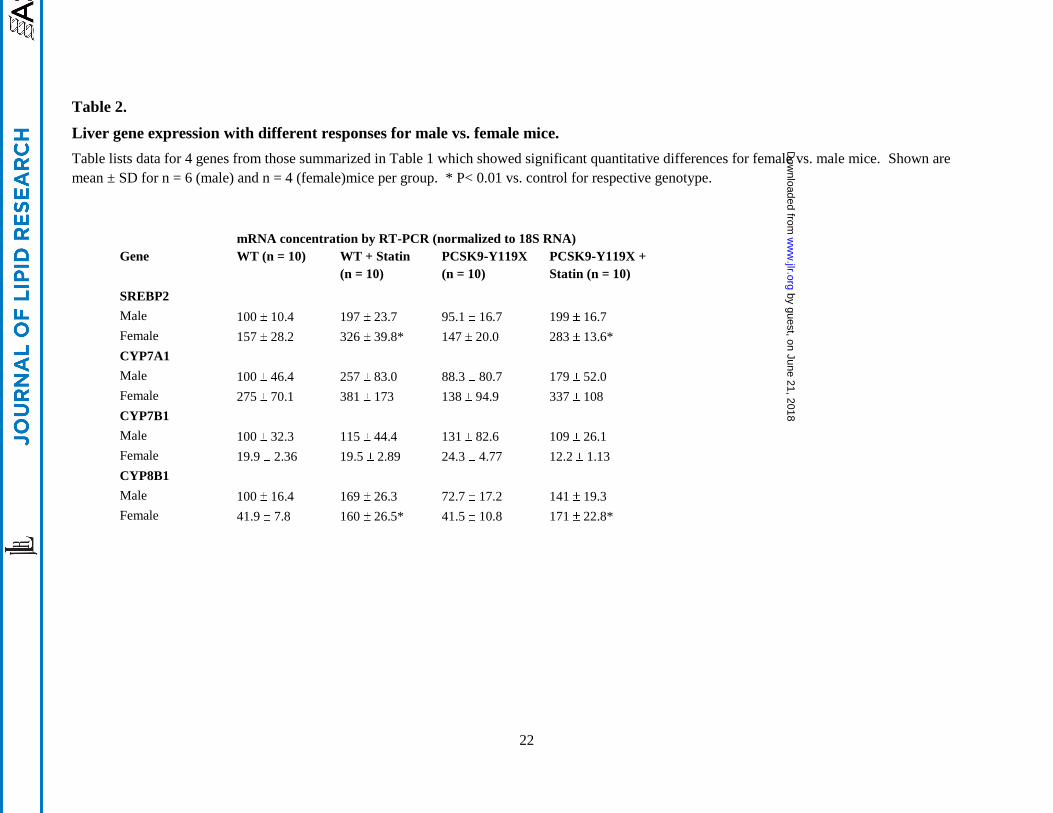
Four of the 16 liver genes assayed showed sex-dependent differences in expression: SREBP2, CYP7A1,
CYP7B1, and CYP8B1. In particular, SREBP2 and CYP7A1 baseline mRNA concentrations were
higher and were induced by statins to higher levels in females than males for both genotypes (Table 2).
These differences may at least partly explain the trends towards higher levels of fecal cholesterol and
bile acids in female PCSK9-Y119X mice treated with statins as shown in Figure 6.
by guest, on June 21, 2018w
ww
.jlr.orgD
ownloaded from
13
Discussion
The results described here show that PCSK9 inactivation through ENU-mutagenesis in mice, creating an
inactivating point mutation in PCSK9 and apparent destabilization of its mRNA, has a profound effect
on hepatic cholesterol metabolism. This is consistent with previous studies utilizing alternative knockout
technologies, PCSK9-inhibiting monoclonal antibodies, or antisense approaches.5 6 8
PCSK9 genetic
suppression and atorvastatin individually resulted in lower plasma LDL-C and total cholesterol levels,
and the combination decreased levels further compared to controls, to average levels as low as 3 mg/dL
(LDL-C) after statin treatment for 8 wks in the mutant mice. Though LDL-C is a minor component of
mouse plasma, the regulation through PCSK9 and LDLR were pronounced in the mouse, and changes in
non-LDL cholesterol were also observed. The latter may reflect clearance of apoE-containing high
density lipoproteins by the LDLR. The mice continued to thrive despite the very low LDL, and there
was no evidence of liver malfunction (ALT and AST were normal).
Statins potently suppress cholesterol synthesis, leading to feedback upregulation through the SREBP2
response mechanism, which includes increased expression of both LDLR and PCSK9. In our studies,
chronic treatment of mice with a high dosage of atorvastatin resulted in 4- to 7-fold increases in liver
expression of the key sterologenic genes HMGCoA synthase and HMGCoA reductase in both wild-type
and PCSK9-Y119X mice. Interestingly, SREBP2 mRNA levels also increased in liver, potentiating
expression of these genes. LDLR and PCSK9 expression were each induced ~2-fold by atorvastatin for
both genotypes, although the basal levels of PCSK9 mRNA were ~10-fold lower in the Y119X mutant
mice, consistent with nonsense-mediated decay of the mRNA.
The fundamental molecular physiology controlling cholesterol balance in mice and larger mammals
including humans is similar, although absolute rates of cholesterol synthesis and LDL-C clearance were
shown by Dietschy’s group to be much higher in mouse, typical of its high metabolic activity in many
pathways.14
In that comprehensive study, it was found that ~80% of whole body LDL-C clearance from
by guest, on June 21, 2018w
ww
.jlr.orgD
ownloaded from
14
circulation was directed into liver and ~90% of this was mediated by LDLR endocytosis in mice. They
concluded that extrahepatic tissues biosynthesize nearly all of their sterol requirements while most LDL-
C returns directly to the liver. Changes in LDLR activity profoundly alter plasma LDL-C, but have little
effect on cholesterol balance across the extrahepatic organs. In contrast the unique ability of liver to
catabolize cholesterol to bile acids and excrete both into bile constitutes the main mechanism for whole
body cholesterol homeostasis. Regulation of hepatic bile acid synthesis ensures this balance and also
provides critical emulsification activity in the intestine. When hepatocyte levels of bile acids are in
excess they repress their own biosynthesis, and when deficient their synthesis is increased. In mice,
increased hepatic cholesterol influx can drive activation of the bile acid biosynthetic pathway.15
Data
from studies in humans led to an understanding that the pool of cholesterol for liver bile acid synthesis
was primarily derived from LDL and VLDL and not de novo synthesis, while biliary cholesterol was
derived mainly from HDL, suggesting cholesterol pool compartmentalization within the liver.16
Our
findings that increased LDL uptake led to higher bile acid production are therefore not surprising but
consistent with this view.
Atorvastatin increased excreted cholesterol in wild type and in PCSK9-Y119X mice, while PCSK9
suppression alone had no effect vs. wild type. Atorvastatin had significant effects on fecal bile acid
concentrations in both normal and PCSK9 knockout mice, while PCSK9 genetic suppression alone had
only modest effects vs. wild type. LDL-derived cholesterol in liver appeared to be efficiently converted
and excreted as bile acids as well as being excreted as free cholesterol. Female PCSK9-Y119X mice
exhibited greater increases in excreted cholesterol and bile acids than males following atorvastatin.
Baseline fecal total bile acid concentrations in wild type mice in our study were similar to previously
reported values for normal mice.17
Importantly, liver concentrations of free and esterified cholesterol
and total bile acids were essentially identical in all four groups, indicating that hepatic homeostasis was
maintained for PCSK9 suppression both without or with maximal HMGCoA reductase inhibition. The
by guest, on June 21, 2018w
ww
.jlr.orgD
ownloaded from
15
observed metabolic changes were associated with significant upregulation of key bile acid synthesis
pathway gene expression in liver. However, both strains of mice expressed similar baseline levels of
these enzymes, and each increased to similar extent with statin treatment. Together these findings
suggest that in the absence of PCSK9, the intracellular cholesterol pool or flux providing substrate to
CYP7A is greater, or is more bioavailable or in closer kinetic proximity to the enzyme.
The overall pathway of bile acid synthesis includes up to 17 enzymes in liver.25
It has not been resolved
whether the intracellular pool of cholesterol substrate for the initial ring hydroxylation step mediated by
the CYP7A enzyme is preferentially derived from LDL endocytosis and hydrolysis, or endogenous
synthesis, or both. Intracellular trafficking of de novo synthesized cholesterol from the endoplasmic
reticulum to the plasma membrane appears to be distinct from movement of LDLR-endocytosed
cholesterol which is routed through the lysosomes and ultimately to intracellular membranes.18
Metabolic regulation through changes in expression levels and kinetic activity of key enzymes enable
the liver to accommodate the increased influx of cholesterol following the stimulated LDLR-dependent
cholesterol uptake seen with the treatment. In our study, the findings of increased mRNA expression of
the important liver bile acid synthesis gatekeeper genes, CYP7A1 and CYP8B119
, along with higher
fecal bile acid levels, and lack of liver cholesterol or bile acid accumulation suggests that the conversion
to bile acids in liver enabled liver cholesterol homeostasis in the combination treatment. The covariation
of CYP7A1 and CYP8B1 expression also is consistent with the observed increases in both cholic acid
and chenodeoxycholic acid. In other studies in mice the oxysterol nuclear, receptor liver X receptor
alpha (LXR ), was found to be the key driver of bile acid synthesis gene transcriptional activation.20
However, in our study mRNA for the sensitive LXR response gene SREBP121
22
was unchanged by
atorvastatin and the same in all groups, suggesting that the increased expression of CYP7A1 and
CYP8B1 may not be LXR-mediated in this study. While oxysterols activate CYP7A1 and other genes
through LXR, bile acids repress CYP7A1 through the farnesoid X receptor (FXR) mediated, forming a
by guest, on June 21, 2018w
ww
.jlr.orgD
ownloaded from
16
feedback control loop in liver. Other FXR response genes were not measured in our study, thus it is
presently unclear whether this feedback system contributes to the CYP7A1 and CYP8B1 expression
pattern observed. It is also possible that the bile acid response elements in the promoters of CYP7A and
CYP8B1 may respond to other transcription factors including hepatocyte nuclear factor 4 (HNF-4)
which were not assessed in this work.23
While plasma LDL-C and total cholesterol were affected we observed no differences in circulating total
bile acids or plasma ALT and AST in any group, suggesting that hepatocyte integrity and normal
metabolic functions were maintained. Bile acids synthesized in the liver are secreted into the small
intestine where they facilitate absorption of fat-soluble nutrients. Normally most (over 90%) of bile
acids are efficiently reabsorbed from the intestine and returned to the liver via portal vein, forming an
enterohepatic circuit, and a minor fraction is excreted in the feces.24
25
Bile acids are transported out of
hepatocytes at the canalicular membrane through the activity of the ATP-dependent bile salt export
pump (BSEP) and across the liver biliary epithelium mediated by members of the apical sodium bile
acid transporter (ASBT) SLC10 gene family.24
26
Changes in expression or activity can affect export or
extraction efficiency and affect circulating total bile acid concentrations, and the latter has been
considered a biomarker of altered hepatic function or potential metabolic or structural problems such as
cholestasis. The lack of changes in liver expression of BSEP or an ASBT family member in our study
suggests that normal liver export of bile acids was maintained throughout the study. Furthermore,
expression of the sodium taurocholate cotransporting polypeptide (NTCP), and the sodium independent
organic anion transporter (OATP1B2) were the same in all groups, suggesting that reuptake of bile acids
into liver was not impaired. These results along with the constancy of liver cholesterol and total bile
acid concentrations support the interpretation that efficient enterohepatic circulation of bile acids was
maintained throughout the study.
by guest, on June 21, 2018w
ww
.jlr.orgD
ownloaded from
17
Since species differences exist in the regulation of bile acid metabolism, it is presently not clear how
well these pharmacodynamic results in a mouse model predict human responses. Still, the data suggest
that metabolic regulation through enzyme pathway responses to increases in substrate concentration,
together with increased gene expression for the key regulatory enzymes in liver, accommodate the
increased flux of cholesterol into liver following stimulated LDL-C clearance with combined
statin/PCSK9 suppression in mice. The findings suggest that the liver handles its responsibilities very
well even when faced with the profound LDL lowering action of the combined PCSK9-statin
mechanism.
by guest, on June 21, 2018w
ww
.jlr.orgD
ownloaded from
18
Acknowledgements
We thank George Psaltis for breeding, Jinwen Huang for genotyping, and Daniel Meyers, Hossain
Monshizadegan, and Richard Yang for phenotyping the PCSK9-Y119X mouse model (BMS R & D).
by guest, on June 21, 2018w
ww
.jlr.orgD
ownloaded from
19
References
1 Abifadel, M., Varret, M., Rabes, J.P., Allard, D., Ouguerram, K., Devillers, M., Cruaud, C., Benjannet,
S., Wickham, L.,Erlich, D. 2003. Mutations in PCSK9 cause autosomal dominant hyper-
cholesterolemia. Nat. Genet. 34:154-156
2 Cohen, J.C., Boerwinkle, E., Mosley, T.H., Jr., and Hobbs, H.H. 2006. Sequence variations in PCSK9,
low LDL, and protection against coronary heart disease. N. Engl. J. Med. 354: 1264-1272.
3 Zhao, Z., Tuakli-Wosornu, Y., Lagace, T.A., Kinch, L., Grishin, N.V., Horton, J.D., Cohen, J.C., and
Hobbs, H.H. 2006. Molecular characterization of loss-of-function mutations in PCSK9 and
identification of a compound heterozygote. Am. J. Hum. Genet. 79: 514-523.
4 Chan J.C.Y., Piper, D.E. et al. 2009. A PCSK9 neutralizing antibody reduces serum cholesterol in
mice and nonhuman primates. Proc. Natl. Acad. Sci. USA. 106: 9820-9825.
5 Rashid, S., Curtis, D.E., Garuti, R., Anderson, N.N., Bashmakov, Y., Ho, Y.K., Hammer, R.E., Moon,
Y.A., and Horton, J.D. 2005. Decreased plasma cholesterol and hypersensitivity to statins in mice
lacking PCSK9. Proc. Natl. Acad. Sci. USA. 102:5374-5379
6 M Denis, J Marcinkiewicz, A Zaid, D Gauthier, S Poirier, C Lazure, N G Seidah, A Prat. 2012. Gene
inactivation of PCSK9 reduces atherosclerosis in mice. Circulation. 125: 894-901.
7 Maxwell, K.N., Fisher, E.A., and Breslow, J.L. 2005. Overexpression of PCSK9 accelerates the
degradation of the LDLR in a post-endoplasmic reticulum compartment. Proc. Natl. Acad. Sci. USA.
102: 2069-2074.
8 Seidah, NG and Prat, A. 2012 The biology and therapeutic targeting of the proprotein convertases.
Nat. Rev. Drug Discov. 11: 367-383.
9 Dias C, Shaywitz A, Wasserman S, Smith B, Gao B, Stolman D, Crispino CP, Smirnakis K, Emery
M, Colbert A, Gibbs J, Retter MW, Cooke B, Uy ST, Matson M, Stein E. 2012. Effects of AMG
145 on low-density lipoprotein cholesterol levels. J. Am. Coll. Cardiol. 60: 1888-98
10 Stein, E., Mellis, S., Yancopoulos, G., Stahl, N., Logan, D., Smith, W., Lisbon, E. Gutierrez, M.,
Webb, C., Wu, R., Du, Y., Kranz, T., Gasparino, E., Swergold, G. 2012. Effect of a monoclonal
antibody to PCSK9 on LDL cholesterol. N. Engl. J. Med. 366: 1108-1118.
11 Cordes, S. N-ethyl-N-nitrosourea mutagenesis: boarding the mouse mutant express. 2005. Microbiol.
Molec. Biol. Rev. 69: 426-439.
12 Gälman, C., A. M. Ostlund-Lindqvist, A. Björquist, S. Schreyer, L. Svensson, B. Angelin, and M.
Rudling. 2003. Pharmacological interference with intestinal bile acid transport reduces plasma
cholesterol in LDL receptor/apoE deficiency. FASEB J. 17: 265-277.
13 Y Alnouti1, I Csanaky, and C. Klaassen. 2008. Quantitative profiling of bile acids and their
conjugates in mouse liver, bile, plasma, and urine using LC-MS/MS. J. Chromatogr. B. Analyt.
Technol. Biomed. Life Sci. 873: 209–217.
14 Y Osono, L A Woollett, J Herz, J M Dietschy. 1995. Role of the low density lipoprotein receptor in
the flux of cholesterol through the plasma and across the tissues of the mouse. J Clin Invest. 95:
1124–1132
by guest, on June 21, 2018w
ww
.jlr.orgD
ownloaded from
20
15
D Russell. 2003. The enzymes, regulation, and genetics of bile acid synthesis. Ann. Rev. Biochem.
7: 137-174.
16 M Carey. 1997. Homing-in on the origin of biliary steroids. Gut 41: 721-722.
17 K Uchida, H Takase, Y Nomura, K Takeda, N Takeuchi, Y Ishikaw. 1984. Changes in biliary and
fecal bile acids in mice after treatments with diosgenin and beta-sitosterol. J. Lipid. Res. 25: 236-
245.
18 L. Liscum and N. Dahl. Intracellular cholesterol transport. 1992. J. Lipid Res. 33: 1239-1254.
19 D.F Jelinek, S Andersson, C.A Slaughter, D.W Russell. 1990. Cloning and regulation of cholesterol
7α-hydroxylase, the rate-limiting enzyme in bile acid synthesis. J. Biol. Chem. 265: 8190–8197.
20 D J Peet1, S D Turley, W Ma, B A Janowski, J-M Lobaccaro, R E Hammer, D J Mangelsdorf. 1998
Cholesterol and bile acid metabolism are impaired in mice lacking the nuclear oxysterol receptor
LXRα. Cell. 93: 693–704.
21 T Yoshikawa, H Shimano, M Amemiya-Kudo, N Yahagi, A Hasty. 2001. Identification of LXR-
RXR as an activator of the sterol regulatory element-binding protein 1c gene promoter. Mol. Cell
Biol. 21: 2991–3000.
22 J Schultz,, T Hua, A Luk, J Repa, J Medina, L Li, S Schwendner, S Wang, M Thoolen, D
Mangelsdorf, K Lustig, and B Shan. 2000. Role of LXRs in control of lipogenesis. Genes Dev 14:
2831-2837.
23 Crestani M, Sadeghpour A, Stroup D, Galli G, Chiang JY. 1998. Transcriptional activation of the
cholesterol 7alpha-hydroxylase gene (CYP7A) by nuclear hormone receptors. J. Lipid Res. 39:
2192-200.
24 P A Dawson , T Lan , and A Rao. 2009. Thematic review series, bile acids: bile acid transporters. J.
Lipid Res. 50: 2340-2357.
25 A F Hofmann, and L. R. Hagey. 2008. Bile acids: chemistry, pathochemistry, biology, pathobiology,
and therapeutics. Cell. Mol. Life Sci. 65: 2461-2483.
26 TC da Silva, JE Polli, P W Swaan. 2013. The solute carrier family 10 (SLC10): Beyond bile acid
transport. Mol. Aspects Med. 34: 252-269.
by guest, on June 21, 2018w
ww
.jlr.orgD
ownloaded from
21
Table 1.
Liver expression of genes regulating sterol pathway and bile acid synthesis, conjugation, and transport.
Values are RT-PCR-assayed mean mRNA concentration in arbitrary units SD for 16 selected liver genes, averaged for n = 10 mice per group. Individual values were
first normalized to 18S RNA in each sample before averaging. Group mean values were then normalized to mean wild type control = 100%. * P< 0.01 vs. control for
respective genotype.
mRNA concentration by RT-PCR (normalized to 18S RNA)
Function Protein Gene WT
WT
+ Statin
PCSK9-Y119X PCSK9-Y119X
+ Statin
Fatty acid & TG pathway SREBP1 SREBF1 100 10.0 107 11.8 96.2 9.3 97.4 10.9
Cholesterol pathway SREBP2 SREBF2 100 37.1 202 59.4 * 94.3 26.0 189 37.1*
Cholesterol synthesis HMGS HMGCS1 100 33.8 360 99.4 * 76.3 28.1 343 45.5 *
Cholesterol synthesis HMGR HMGCR 100 52.8 546 185 * 77.1 31.4 110 52.8 *
LDL receptor LDLR LDLR 100 13.0 156 25.1 * 95.8 13.0 146 16.1 *
LDLR regulation PCSK9 PCSK9 100 25.1 205 50.4 * 10.7 3.5 21.9 5.1 *
BA synthesis main pathway,
cholesterol substrate CYP7
hydroxylase
CYP7A1 100 61.7 180 78.7 * 63.6 50.2 143 64.7 *
BA synthesis, steroids & oxysterol
substrates CYP7
hydroxylase
CYP7B1 100 70.4 113 87.8 129.5 121 103 79.2
BA synthesis, alternative pathway CYP27
hydroxylase
CYP27A1 100 13.6 120 17.1 113 13.1 113 16
Balance between cholic and
deoxycholic acid synthesis Sterol 12-
hydroxylase
CYP8B1 100 42.6 215 33.0 * 78.5 28.1 199 32.1 *
Amino acid conjugation BAT BAAT 100 ± 9.6 113 ± 11 99.3 ± 11.4 112 ± 10.6
BA activation to CoA-ester BACS SLC27A5 100 ± 15 105 ± 14.7 95.1 ± 14.2 104 ± 8.2
Sodium taurocholate co-transport,
extraction of BA from portal blood
NTCP SLC10A1 100 6.2 101 19.7 106 16.6 92.7 6.8
Bile salt export pump, ATP-dependent BSEP ABCB11 100 12.6 84.5 12.9 116 18.8 93.9 9.1
Apical sodium bile acid transporter
family, BA re-uptake transporter
ASBT SLC10A7 100 12.9 107 14.4 104 14.0 101 4.2
Na independent organic anion
transporter
OATP1B2 SLCO1B1 100 9.2 105 12.2 101 14.3 93.7 14.1
by guest, on June 21, 2018w
ww
.jlr.orgD
ownloaded from
22
Table 2.
Liver gene expression with different responses for male vs. female mice.
Table lists data for 4 genes from those summarized in Table 1 which showed significant quantitative differences for female vs. male mice. Shown are
mean ± SD for n = 6 (male) and n = 4 (female)mice per group. * P< 0.01 vs. control for respective genotype.
mRNA concentration by RT-PCR (normalized to 18S RNA)
Gene WT (n = 10) WT + Statin
(n = 10)
PCSK9-Y119X
(n = 10)
PCSK9-Y119X +
Statin (n = 10)
SREBP2
Male 100 10.4 197 23.7 95.1 16.7 199 16.7
Female 157 28.2 326 39.8* 147 20.0 283 13.6*
CYP7A1
Male 100 46.4 257 83.0 88.3 80.7 179 52.0
Female 275 70.1 381 173 138 94.9 337 108
CYP7B1
Male 100 32.3 115 44.4 131 82.6 109 26.1
Female 19.9 2.36 19.5 2.89 24.3 4.77 12.2 1.13
CYP8B1
Male 100 16.4 169 26.3 72.7 17.2 141 19.3
Female 41.9 7.8 160 26.5* 41.5 10.8 171 22.8*
by guest, on June 21, 2018w
ww
.jlr.orgD
ownloaded from
23
Figure Legends
Figure 1.
Biochemical phenotype of PCSK9-Y119X mice. (left panel) Liver mRNA for PCSK9 and LDLR in
PCSK9-Y119X heterozygous and homozygous mutant vs. wild type mice. (right panel) PCSK9-Y119X
homozygous and heterozygous mice exhibit increased liver LDLR protein and reduced circulating LDL-
C levels vs. wild-type. Mean values (n=6 male mice) and 95% confidence interval are shown.
Figure 2.
Time course of plasma lipid responses to atorvastatin for wild type vs. PCSK9-Y119X mice.
A. Study design. B. Plasma LDL-C levels at biweekly intervals over 8 wks treatment. C. Plasma total
cholesterol at intervals over 8 wks. D. Plasma total bile acids at intervals over 8 wks. Mean values
(n=10 mice; 6 males, 4 females) and 95% confidence intervals are shown.
Figure 3.
Plasma LDL-C, HDL-C, total cholesterol, and total bile acids after 8 wks atorvastatin. Values for
each lipid measured (indicated in titles for each panel) are shown as scatterplots of individual animal
data for male mice (closed symbols, n=6 per group) and female mice (open symbols, n=4 per group).
Bars with asterisk (*) indicate significance for means of male group data analyzed by one-way ANOVA
with Bonferroni’s test for multiple comparisons.
Figure 4.
Liver free and esterified cholesterol and total bile acids concentrations at 12 wks. (left panel) Bars
indicate mean liver tissue concentrations of free cholesterol (lower bars) and esterified cholesterol
(upper hatched bars) by enzymatic assay. (right panel) Liver tissue concentrations of total bile acids
determined by enzymatic assay. Combined male and female data are plotted as bars for clarity, as no
sex dependency was observed in these data. For both panels, mean values (n=10 per group; mg analyte
per gram liver wet weight) and 95% confidence intervals are shown.
Figure 5.
Fecal cholesterol and total bile acids at 9 wks treatment. (left panel) Free cholesterol concentration
determined by LC-MS from 48-hr fecal samples of wild type and PCSK9-Y119X homozygous mice.
(right panel) Fecal total bile acids determined by enzymatic assay method. Values are shown as
scatterplots of individual animal data for male mice (closed symbols, n=6 per group) and female mice
(open symbols, n=4 per group). Bars with asterisk (*) indicate significance for means of male group
data analyzed by one-way ANOVA with Bonferroni’s test for multiple comparisons.
Figure 6.
Individual fecal bile acids by LC-MS for male and female mice at 9 wks. Data represent the
individual bile acids assayed by LC-MS from 48-hr fecal samples of mice. The scatterplot (first panel)
shows individual animal data for males (open symbols) and females mice (closed symbols) for the sum
of all 14 bile acid species resolved by the method. The other panels show each of the 7 highest
abundance bile acids with separate bars for male (n=6) and female (n=4) mice. Bars represent mean and
SD for relative concentrations normalized to deuterated deoxycholic acid internal standard.
by guest, on June 21, 2018w
ww
.jlr.orgD
ownloaded from
24
Figure 1.
WT
Y119X het
Y119X homoW
T
Y119X het
Y119X homo0
25
50
75
100
125
150
PCSK9
LDLRmRNA (liver)m
RN
A/G
AP
DH
, %
co
ntr
ol
WT
Y119X het
Y119X homo wt
Y119X het
Y119X homo0
2
4
6
8
10
12
14 Liver
LDLR
Protein
Plasma
LDL-C
LD
L-C
mg
/dL
LD
LR
rel u
nits
by guest, on June 21, 2018w
ww
.jlr.orgD
ownloaded from
26
Figure 3.
Plasma LDL Cholesterol, Wk 8
0
5
10
15
20
WT
WT statin
Y119X
Y119X statin
open = Mclosed = F
*
*
* P <0.01 (M)
mg
/dL
Non-LDL Cholesterol, 8 wks
0
30
60
90
120
open = Mclosed = F
** * P <0.01 (M)
mg
/gra
m
Plasma Total Cholesterol, Wk 8
0
50
100
150
*
*
open = Mclosed = F
* P <0.01 (M)
mg
/dL
Plasma Total Bile Acids, 8 Wk
0
5
10
15
20
25open = Mclosed = F
mo
l/L
by guest, on June 21, 2018w
ww
.jlr.orgD
ownloaded from
27
Figure 4.
Liver Total Bile Acids
0.0
0.2
0.4
0.6
Y119X Y119X+ statin
WT WT+ statin
mg
/gra
m
Liver Free and Esterified Cholesterol
0
1
2
3
4
5
Y119X Y119X+ statin
WT WT+ statin
CE
FC
mg
/gra
m by guest, on June 21, 2018w
ww
.jlr.orgD
ownloaded from
28
Figure 5.
Fecal Cholesterol
0
4
8
12
16
WT
WT statin
Y119X
Y119X statin
open = Mclosed = F*
*
* P <0.01 (M)mg
/gra
m
Fecal Total Bile Acids
0
1
2
3
4
5
open = Mclosed = F
* P <0.01 (M)
*
*
*
mg
/gra
m
by guest, on June 21, 2018w
ww
.jlr.orgD
ownloaded from
29
Figure 6.
Deoxycholic acid
0
5
10
15
20
25
Males Females
WT
WT statin
Y119X
Y119X statin
co
nc (
rel u
nit
s)
Cholic acid
0
2
4
6
8
Males Females
co
nc (
rel u
nit
s)
Taurodeoxycholic acid
0
1
2
3
6
10
14
Males Females
co
nc (
rel u
nit
s)
Taurocholic acid
0
1
2
3
4
568
10
Males Females
co
nc (
rel u
nit
s)
Ursodeoxycholic acid
0
5
10
15
Males Females
co
nc (
rel u
nit
s)
-Muricholic acid
0
4
8
12
Males Females
co
nc (
rel u
nit
s)
-Muricholic acid
0
2
4
6
8
Males Females
co
nc (
rel u
nit
s)
Sum of all Bile Acids by LC-MS: M & F Mice
0
20
40
60
80
100WT
WT statin
Y119X
Y119X statin
open = Mclosed = F
rela
tive u
nit
s (
LC
-MS
)
by guest, on June 21, 2018w
ww
.jlr.orgD
ownloaded from