Embed Size (px)
Citation preview
Shumaila Khalid (Senior R&D Officer)
Bilateral Trade
Between Pakistan and India
Compiled By
Research and Development Department
The Rawalpindi Chamber of Commerce & Industry
39-Civil Lines Mayo Road Rawalpindi
Ph: 051-5111051-54 Fax: 051-5111055 E-mail: [email protected]
Shumaila Khalid (Senior R&D Officer)
Contents
INTRODUCTION ........................................................................................................................................ 3
INDIA BREIF ECONOMIC OVERVIEW .................................................................................................. 4
MAJOR INDUSTRIES OF INDIA .......................................................................................................... 4
MAJOR SERVICE SECTOR ................................................................................................................... 4
INDIA TOP 5 COMMODITIES OF EXPORTS ...................................................................................... 4
TOP COMMODITIES OF INDIAN IMPORTS .................................................................................... 4
INDIA REGIONAL EXPORTS ............................................................................................................... 5
INTERNATIONAL AGREEMENTS (CONCLUDED) .......................................................................... 6
CURRENT ENGAGEMENTS AND NEGOTIATIONS ......................................................................... 6
TRADE BETWEEN PAKISTAN AND INDIA .......................................................................................... 7
CURRENT VOLUME OF TRADE: ............................................................................................................ 9
MAJOR EXPORTS OF PAKISTAN TO INDIA (1.3% OF PAKISTAN TOTAL EXPORTS TO
INDIA) ...................................................................................................................................................... 9
IMPORTS FROM INDIA (SHARE IN PAKISTAN IMPORTS ----4.2%) ............................................. 9
WHY TRADE WITH INDIA ..................................................................................................................... 11
NON-TARIFF BARRIERS ........................................................................................................................ 12
RECOMMENDATIONS ............................................................................................................................ 15
Shumaila Khalid (Senior R&D Officer)
Introduction
The Economy of India is the ninth largest in the world by nominal GDP and is known for being
the fourth largest in terms of Purchasing Power Parity (PPP) listed after United States, China and
Japan with 4,057,787 Million USD, (IMF 2010) (Pakistan is 27th
with 467,197 Million USD,
IMF 2010) The country's per capita GDP (PPP) is $ 3,408 (IMF ranked 129th) in 2010.
Following strong economic reforms from the post-independence, the country's economic growth
progressed at a rapid pace.
China and India are projected to be the two fastest growing economies of the world over the next
several decades. Pakistan is blessed by its location being neighbor to both these large economies.
Our national economic interests dictate that we should expand our trading relations with both
these countries and penetrate their markets.
Shumaila Khalid (Senior R&D Officer)
INDIA BREIF ECONOMIC OVERVIEW
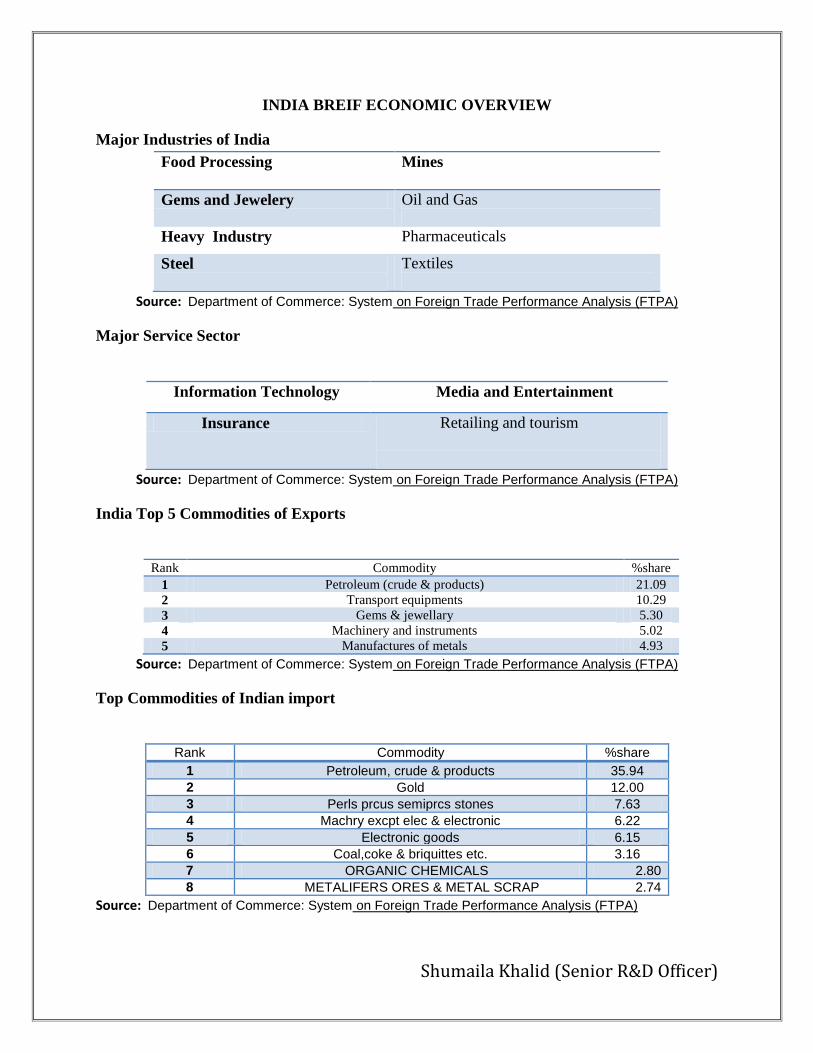
Major Industries of India
Food Processing
Mines
Gems and Jewelery Oil and Gas
Heavy Industry Pharmaceuticals
Steel
Textiles
Source: Department of Commerce: System on Foreign Trade Performance Analysis (FTPA)
Major Service Sector
Information Technology Media and Entertainment
Insurance Retailing and tourism
Source: Department of Commerce: System on Foreign Trade Performance Analysis (FTPA)
India Top 5 Commodities of Exports
Rank Commodity %share 1 Petroleum (crude & products) 21.09 2 Transport equipments 10.29 3 Gems & jewellary 5.30 4 Machinery and instruments 5.02 5 Manufactures of metals 4.93
Source: Department of Commerce: System on Foreign Trade Performance Analysis (FTPA)
Top Commodities of Indian import
Rank Commodity %share
1 Petroleum, crude & products 35.94 2 Gold 12.00 3 Perls prcus semiprcs stones 7.63 4 Machry excpt elec & electronic 6.22 5 Electronic goods 6.15 6 Coal,coke & briquittes etc. 3.16
7 ORGANIC CHEMICALS 2.80 8 METALIFERS ORES & METAL SCRAP 2.74
Source: Department of Commerce: System on Foreign Trade Performance Analysis (FTPA)
Shumaila Khalid (Senior R&D Officer)
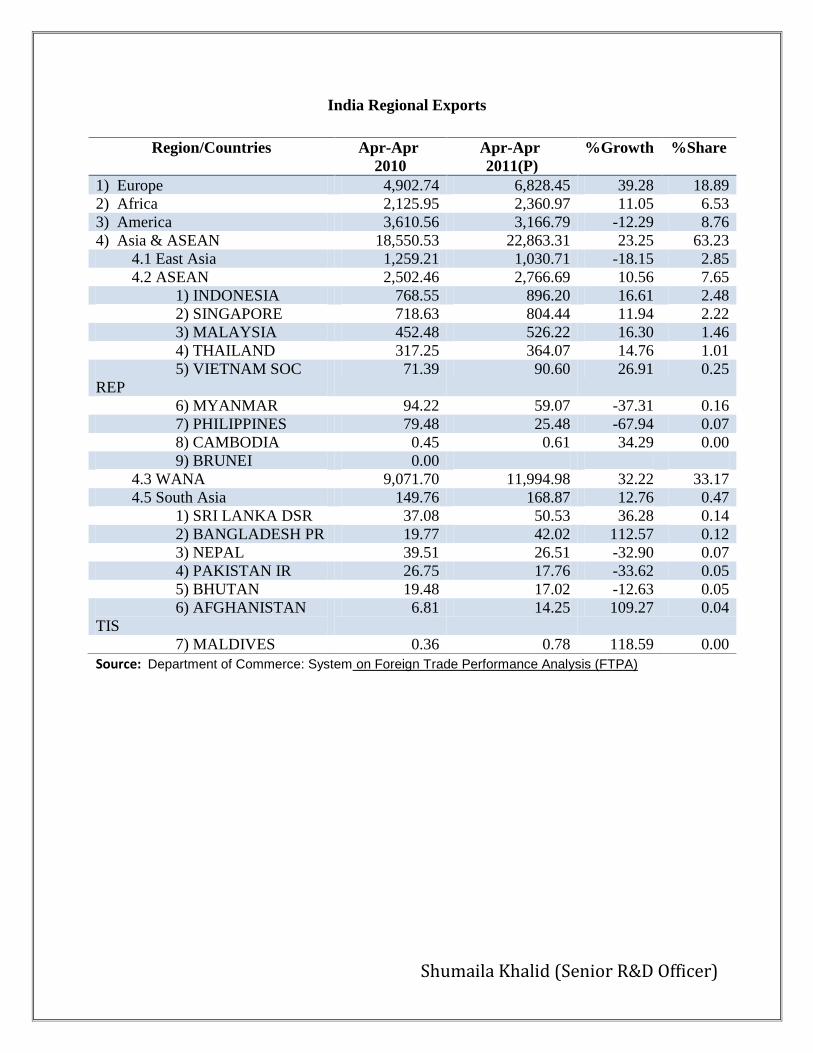
India Regional Exports
Source: Department of Commerce: System on Foreign Trade Performance Analysis (FTPA)
Region/Countries Apr-Apr
2010
Apr-Apr
2011(P)
%Growth %Share
1) Europe 4,902.74 6,828.45 39.28 18.89
2) Africa 2,125.95 2,360.97 11.05 6.53
3) America 3,610.56 3,166.79 -12.29 8.76
4) Asia & ASEAN 18,550.53 22,863.31 23.25 63.23
4.1 East Asia 1,259.21 1,030.71 -18.15 2.85
4.2 ASEAN 2,502.46 2,766.69 10.56 7.65
1) INDONESIA 768.55 896.20 16.61 2.48
2) SINGAPORE 718.63 804.44 11.94 2.22
3) MALAYSIA 452.48 526.22 16.30 1.46
4) THAILAND 317.25 364.07 14.76 1.01
5) VIETNAM SOC
REP
71.39 90.60 26.91 0.25
6) MYANMAR 94.22 59.07 -37.31 0.16
7) PHILIPPINES 79.48 25.48 -67.94 0.07
8) CAMBODIA 0.45 0.61 34.29 0.00
9) BRUNEI 0.00
4.3 WANA 9,071.70 11,994.98 32.22 33.17
4.5 South Asia 149.76 168.87 12.76 0.47
1) SRI LANKA DSR 37.08 50.53 36.28 0.14
2) BANGLADESH PR 19.77 42.02 112.57 0.12
3) NEPAL 39.51 26.51 -32.90 0.07
4) PAKISTAN IR 26.75 17.76 -33.62 0.05
5) BHUTAN 19.48 17.02 -12.63 0.05
6) AFGHANISTAN
TIS
6.81 14.25 109.27 0.04
7) MALDIVES 0.36 0.78 118.59 0.00
Shumaila Khalid (Senior R&D Officer)
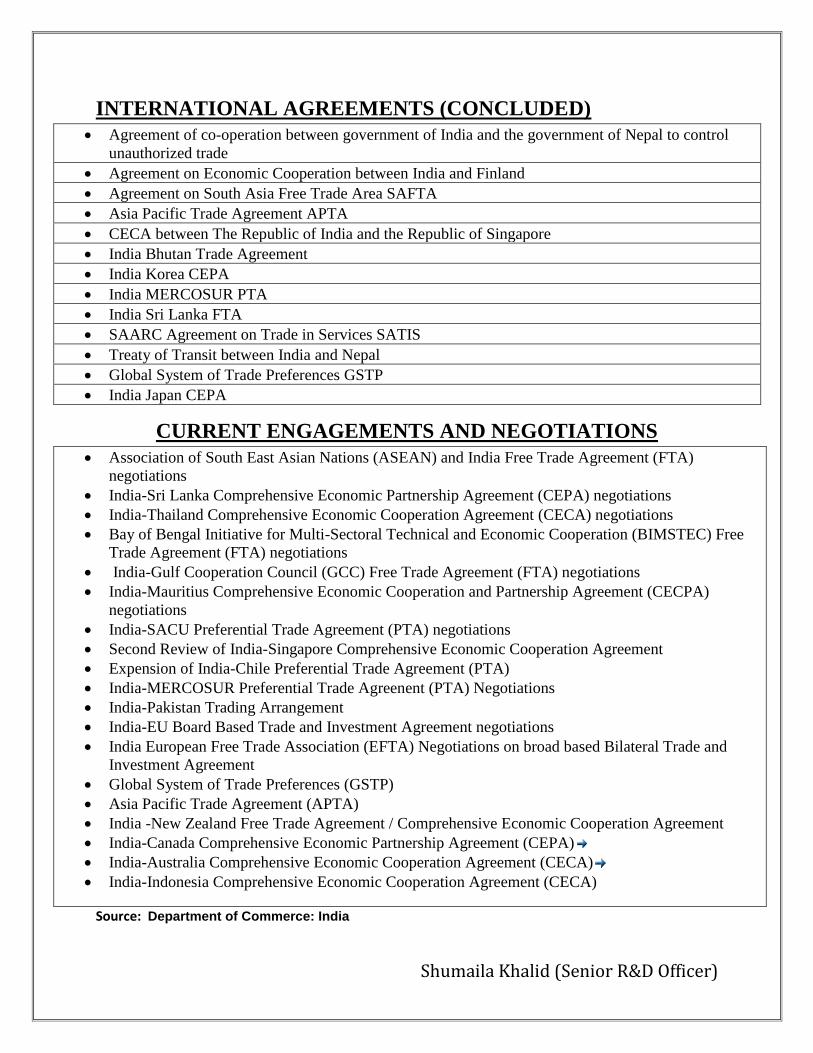
INTERNATIONAL AGREEMENTS (CONCLUDED)
Agreement of co-operation between government of India and the government of Nepal to control
unauthorized trade
Agreement on Economic Cooperation between India and Finland
Agreement on South Asia Free Trade Area SAFTA
Asia Pacific Trade Agreement APTA
CECA between The Republic of India and the Republic of Singapore
India Bhutan Trade Agreement
India Korea CEPA
India MERCOSUR PTA
India Sri Lanka FTA
SAARC Agreement on Trade in Services SATIS
Treaty of Transit between India and Nepal
Global System of Trade Preferences GSTP
India Japan CEPA
CURRENT ENGAGEMENTS AND NEGOTIATIONS
Association of South East Asian Nations (ASEAN) and India Free Trade Agreement (FTA)
negotiations
India-Sri Lanka Comprehensive Economic Partnership Agreement (CEPA) negotiations
India-Thailand Comprehensive Economic Cooperation Agreement (CECA) negotiations
Bay of Bengal Initiative for Multi-Sectoral Technical and Economic Cooperation (BIMSTEC) Free
Trade Agreement (FTA) negotiations
India-Gulf Cooperation Council (GCC) Free Trade Agreement (FTA) negotiations
India-Mauritius Comprehensive Economic Cooperation and Partnership Agreement (CECPA)
negotiations
India-SACU Preferential Trade Agreement (PTA) negotiations
Second Review of India-Singapore Comprehensive Economic Cooperation Agreement
Expension of India-Chile Preferential Trade Agreement (PTA)
India-MERCOSUR Preferential Trade Agreenent (PTA) Negotiations
India-Pakistan Trading Arrangement
India-EU Board Based Trade and Investment Agreement negotiations
India European Free Trade Association (EFTA) Negotiations on broad based Bilateral Trade and
Investment Agreement
Global System of Trade Preferences (GSTP)
Asia Pacific Trade Agreement (APTA)
India -New Zealand Free Trade Agreement / Comprehensive Economic Cooperation Agreement
India-Canada Comprehensive Economic Partnership Agreement (CEPA)
India-Australia Comprehensive Economic Cooperation Agreement (CECA)
India-Indonesia Comprehensive Economic Cooperation Agreement (CECA)
Source: Department of Commerce: India
Shumaila Khalid (Senior R&D Officer)
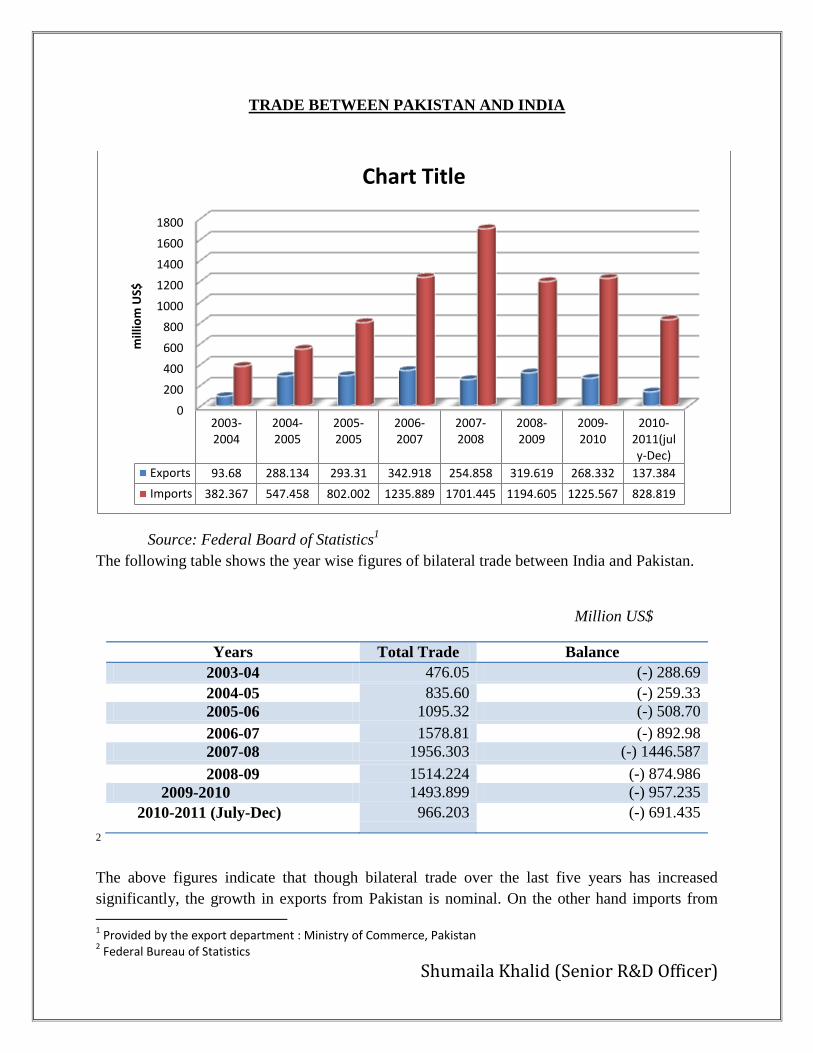
TRADE BETWEEN PAKISTAN AND INDIA
Source: Federal Board of Statistics1
The following table shows the year wise figures of bilateral trade between India and Pakistan.
Million US$
Years Total Trade Balance
2003-04 476.05 (-) 288.69
2004-05 835.60 (-) 259.33
2005-06 1095.32 (-) 508.70
2006-07 1578.81 (-) 892.98
2007-08 1956.303 (-) 1446.587
2008-09 1514.224 (-) 874.986
2009-2010 1493.899 (-) 957.235
2010-2011 (July-Dec) 966.203 (-) 691.435
2
The above figures indicate that though bilateral trade over the last five years has increased
significantly, the growth in exports from Pakistan is nominal. On the other hand imports from
1 Provided by the export department : Ministry of Commerce, Pakistan
2 Federal Bureau of Statistics
0
200
400
600
800
1000
1200
1400
1600
1800
2003-2004
2004-2005
2005-2005
2006-2007
2007-2008
2008-2009
2009-2010
2010-2011(july-Dec)
Exports 93.68 288.134 293.31 342.918 254.858 319.619 268.332 137.384
Imports 382.367 547.458 802.002 1235.889 1701.445 1194.605 1225.567 828.819
mill
iom
US$
Chart Title
Shumaila Khalid (Senior R&D Officer)
India have increased substantially during this period. The trade balance is tilted largely in India’s
favor.
Imports from India have increased primarily due to expansion in the List of importable items,
which currently consists of 1946 items (Appendix ‘G’ of Import Policy Order 2009-10). On
the other hand our exports are stagnating because India is maintaining a number of Non-Tariff
and Para-Tariff Barriers and the continuance of high tariffs in areas of our export interest,
mainly, textiles and fresh fruits.
While we may continue to agitate on this imbalance with the Indian government as a bargaining
tool, it is also important to analyze the composition of our imports in order to view the matter in
its true perspective. The major imports from India comprise intermediate goods that being
cheaper than alternate sources of imports enhance the competitiveness of our industry and have
been included in the List of importable items on their demand (Ministry of Commerce, Pakistan)
The need is to see that list of importable item must be analyzed to see and compared how it is
affecting our domestic industry.
A small number of items having export potential from India are on the positive list adopted by
Pakistan. At the same time there are several items that India is importing from other countries
but not from Pakistan. This indicates that there is a huge information gap on both sides on items
that can be imported by India from Pakistan.
Almost 1,9003 Indian items allowed by Pakistan are imported regularly. Pakistan’s exports are
still restricted to a few items as the non-tariff barriers discourage imports. India’s tariff rates
remain high, especially for goods of particular interest to Pakistan, such as textiles, leather, and
the mineral onyx, and nontariff barriers are substantial. Non-Tariff Barriers include all
measures, other than tariffs, that are used to protect domestic industry and discourage imports.
According to official data, Pakistan’s exports to India were 30 per cent of what India exported to
Pakistan in 2009 which fell to 24 per cent in 2010 and further shrank to 20 per cent in 2011.
In terms of dollar, exports to India stood at $313 million, $260 million and $286 million in 2009,
2010 and 2011 respectively while Indian exports to Pakistan stood at $1.032 billion, $1.061
billion and $1.445 billion in 2009, 2010 and 20114
3 Import policy 2009-10: Ministry of Commerce ,Pakistan
4 http://www.dawn.com/2011/09/30/pakistans-exports-to-india-declining.html
Shumaila Khalid (Senior R&D Officer)
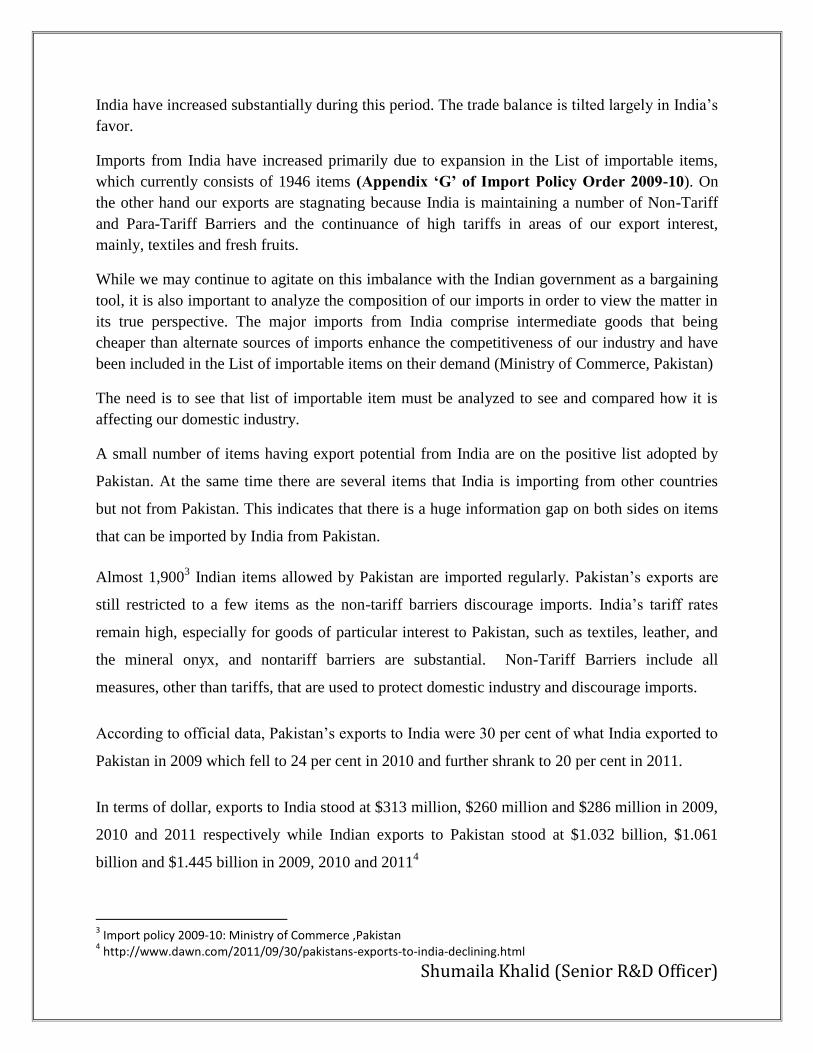
Current Volume of Trade:
Pakistan and India agreed to boost bilateral trade to $6 billion, more than double of current
volume of $2.7 billion, during the next three years. (Source: Based on Makhodoom Amin Fahim
statement)
Year 2010
Import Range: 268.332- 274.988 million USD
Exports Range: 1225.567- 1559.921
Major Exports of Pakistan to India (1.3% of Pakistan Total Exports to India)
Item of export
Share in
Pakistan
export %
Item of export Share in
Pakistan
exports
Edible fruit, nuts, peel of citrus fruit,
melons
16.4% of our exports to India
17.8
Organic chemicals
9.36% of our exports to India 61.4
Cotton
13.9% of our exports to India 1
Plastics and articles thereof
6.77% of our exports to India
4.6
Salt, sulphur, earth, stone, plaster, lime
and
Cement
11.74% of our exports to India
6.3
Raw hides and skins (other
than furskins) and leather
4.68% of our exports to India
3.1
Mineral fuels, oils, distillation products,
etc
9.58% of our exports to India 2.2
Inorganic chemicals, precious
metal compound, isotopes
4.13% of our exports to India
37.9
Source: World Trade Map
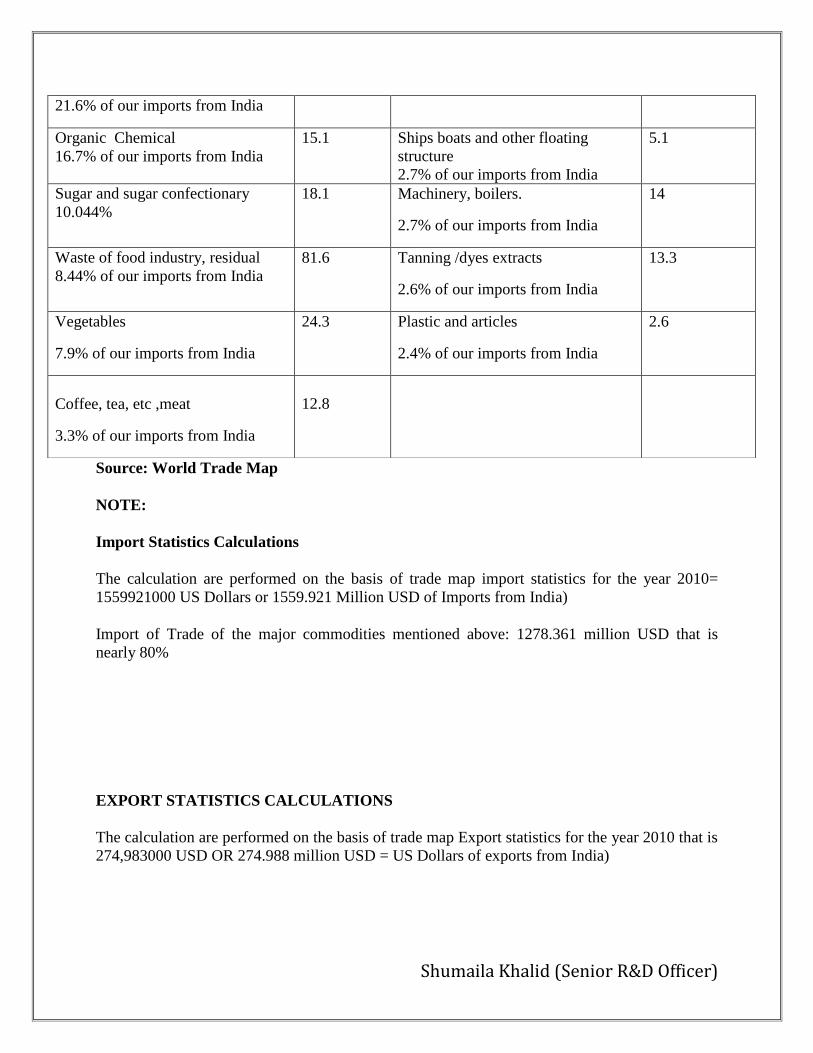
Imports from India (Share in Pakistan Imports ----4.2%)
Source: World Trade Map
Commodities Share In
Pakistan
Imports %
Commodities Share in
Pakistan
imports %
Cotton 40.7 Miscellaneous Chemical products
3.26% of our imports from India
9.2
Shumaila Khalid (Senior R&D Officer)
Source: World Trade Map
NOTE:
Import Statistics Calculations
The calculation are performed on the basis of trade map import statistics for the year 2010=
1559921000 US Dollars or 1559.921 Million USD of Imports from India)
Import of Trade of the major commodities mentioned above: 1278.361 million USD that is
nearly 80%
EXPORT STATISTICS CALCULATIONS
The calculation are performed on the basis of trade map Export statistics for the year 2010 that is
274,983000 USD OR 274.988 million USD = US Dollars of exports from India)
21.6% of our imports from India
Organic Chemical
16.7% of our imports from India
15.1 Ships boats and other floating
structure
2.7% of our imports from India
5.1
Sugar and sugar confectionary
10.044%
18.1 Machinery, boilers.
2.7% of our imports from India
14
Waste of food industry, residual
8.44% of our imports from India
81.6 Tanning /dyes extracts
2.6% of our imports from India
13.3
Vegetables
7.9% of our imports from India
24.3 Plastic and articles
2.4% of our imports from India
2.6
Coffee, tea, etc ,meat
3.3% of our imports from India
12.8
Shumaila Khalid (Senior R&D Officer)
WHY TRADE WITH INDIA
At a highly disaggregated level it was found that there are 2,646 common items of Pakistan’s
imports that India exports worth over $15 billion. For half of these items, the unit value of
Pakistani imports is more than the unit value of Indian exports. Pakistan can import these items
cheaply from India. At the same time 1,181 items worth $3.9 billion are common between
India’s imports and Pakistan’s exports. About 70 percent of these common items have unit
values less or equal to the Indian import unit value. This suggests that these exports from
Pakistan can be supplied to India at a lower cost than what they are getting from other countries
(Dr Ishrat Husain, 2011)
It should also be kept in mind that bilateral trade balance with any particular country does not
have to be positive. There would be no trade in that case. Pakistan would run a trade deficit with
India just as it does with China and surpluses with others. India is a larger, more diversified
economy and also produces goods that Pakistan exports. The determining factor is whether the
cost of imports from India is less than comparable quality imports from other sources.. (Dr Ishrat
Husain, 2011)
Shumaila Khalid (Senior R&D Officer)
NON-TARIFF BARRIERS
Regardless of the fact that both countries having liberalized their import regimes, Pakistan
continues to follow a positive list approach towards Indian imports
Following is a brief description of non-tariff barriers faced by Pakistani traders towards India5.
1. Lack of Land Trade Facilitation
a) Unavailability of infrastructure such as rail wagons, sheds, X-rays machines etc.
b) Restrictions on cargo train through Sindh route increases huge amounts to be paid as ocean
Freight to the shipping lines. It also takes almost 10 days of loading and unloading. Using
Sindh route can reduce the handling cost as well as time up to 24 hours.
c) Limited no of items are traded via road route and lack of warehousing and cold storage
facility at on either side of the boarder.
2. Technical Barriers To Trade
a. Strict Indian certification requirements by the bureau of Indian standards especially for
textile vegetables and cement
b. Multiplicity of standard setting bodies (24, for example export inspection council, Indian
institute of foreign trade, Indian institute of packaging, commodity boards etc.) creates
confusion.
c. Multiplicity of rules and regulations
d. No single publication that cover information on tariffs , fees, taxes and legislation making
whole system time consuming, cumbersome and ambiguous.
e. Applicant of BIS license have to pay processing charges expenses of the inspection visit,
testing cost, annual marking fee for the license and license fee have to be paid separately
f. License issued for any product valid for 1 year.
5 Federation of All Pakistan Chambers of Commerce and Industry
Shumaila Khalid (Senior R&D Officer)
Non Transparent and cumbersome Administrative Procedures and Government
Policies and Regulations
Lack of transparency, market imperfections and information asymmetries on both sides raise
transaction costs and restrict market access for several other aspiring traders. Even the Indian
importers are haunted by the law-enforcement agencies for their trade ties with Pakistan.
Pakistan has an export interest in textiles, cement, food, jute, and other agricultural products
which also happen to be sectors where import restrictions/standards are most rigorously applied
by India.
For Example:
Pakistan is in a position to market its textiles in India but the strict conditions laid down under the
Textiles (Consumer Protection) Regulation of 1988, are a major barrier.
Pakistani fabric exporters are required to obtain a pre-shipment certificate from a textile testing
laboratory in Pakistan certifying non-use of hazardous dyes. In some cases even the EU accredited
labs have been rejected by Indian customs making zero rate exports impossible.
Cement exports to India from Pakistan have decreased from 60,000 tones monthly average to
a mere 15,000 tones mainly due to the delay in renewal of quality certification by BIS.
Pakistan jute has potential in India but Indian government tenders are restricted to local
manufacturers.
Trade in energy and IT and service is heavily restricted
No foreign direct investment between the two countries.
.
Lack of Adequate Banking Relations:
Some Indian banks do not recognize L/Cs from all Pakistani banks and the confirmation of L/C’s
may take a month. There is no formal mechanism for the settlement of disputes.
Indians banks are not allowed to have branches in India as well Pakistan has no branches in
India.i
Visa Restrictions:
Shumaila Khalid (Senior R&D Officer)
It is also found that due to a restrictive visa regime only selected traders have access to trade-
related information; Visas are to be obtained only for specific cities prior to entry into Pakistan.
Trade Logistics:
Road routes for trade are nearly non-existent, rail and air connectivity between the two countries
has been inconsistent that is still a barrier in bilateral trade.
Strict Security Checks
Pakistani consignments are subject to more stringent checking and detailed security checks in
India (e.g. Pakistani Molasses is allowed in 1 ton packs only because of security reasons). The
Indians this year took Pakistan-specific measures to deprive its industry of one million cotton
bales.
Strict Customs Clearance and Customs Valuation
Excessive checks on security grounds. Goods may be held up for several days before they are
cleared.
Food Product has to be referred to port health officers, the unavailability of at various ports
requires test from food central laboratories. Delays in such may affect the perishable food items
and are usually common. Earlier packed food materials were released on the basis of health
certificates issued by the countries of origin. The goods detained for long time leads to heavy
damages as well as port charges.
Shumaila Khalid (Senior R&D Officer)
Recommendations
Following are the recommendations/suggestions for improving trade between Pakistan and India;
The most important recommendation pertains to easing visa restrictions so that trade can be
carried out in a freer environment. A liberal visa regime would serve as an effective channel
for information exchange on trade related matters between the two countries.
More rail and road routes should be opened up while the existing capacities on operational routes
need to be expanded.
Allowing branches of Indian and Pakistani banks to operate in the other country. Banking facilities
need to be improved and facilitated in both countries through appropriate institutional
mechanisms.
Land routes for trade should be opened. Pakistan & India Should Encourage bilateral trade
through road and sea routes to save huge transportation charges that they bear on imported
from other countries.
Custom and Police Inquiries are a big hurdle that waste valuable time, it should be made
easier and exempted for business delegations.
One window operations should be implemented in both countries for trade visits facilitation.
There should be an effective collaboration between Chamber of commerce of countries and
visits/delegations as well as trade fairs should be encouraged by both countries.
India and Pakistan should create adequate testing facilities at the land borders so that no trade
restrictions are imposed on the ground that testing facilities are not available.
i Federation of All Pakistan Chambers of Commerce and Industry


![THIRD QUARTER REPORT - Honda Pakistan · THIRD QUARTER REPORT DECEMBER 2017 "Makes all the difference" ((\\]fll ... 5.5t.%against USD and closod at 11 0.5. Agriculture Agricutture](https://img.pdfslide.us/doc/110x75/5f06dc5a7e708231d41a1987/third-quarter-report-honda-pakistan-third-quarter-report-december-2017-makes.jpg)