Embed Size (px)
Citation preview
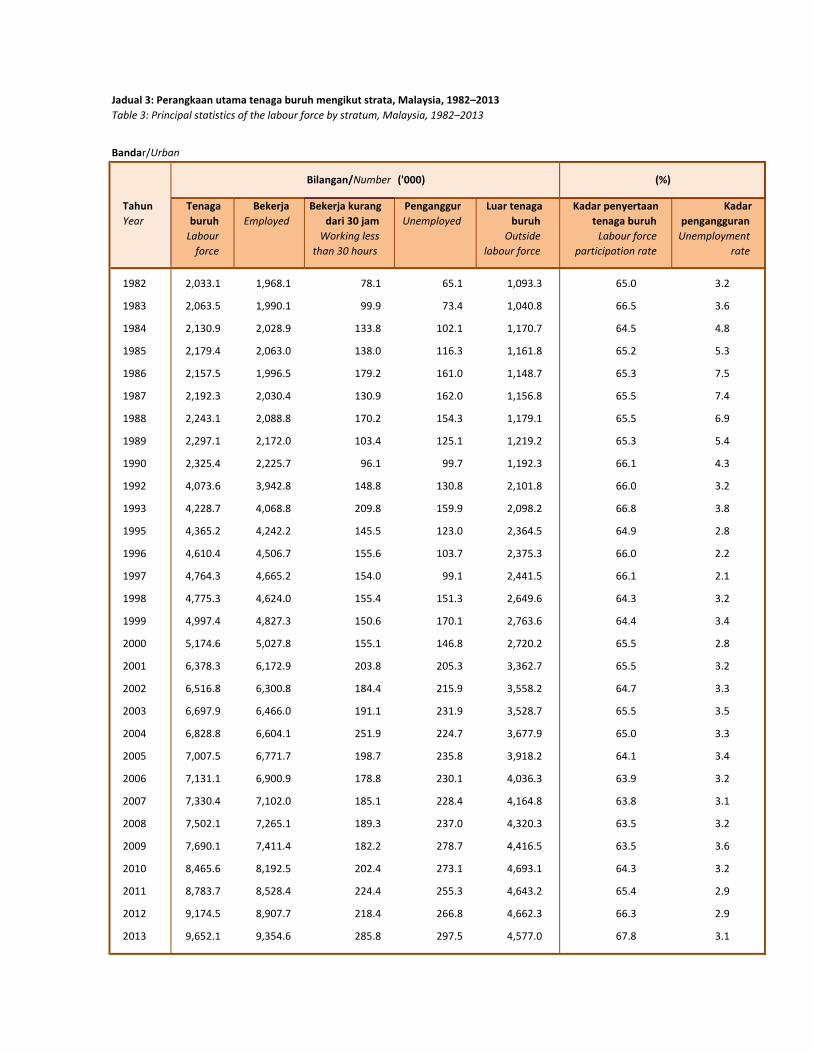
Bandar/Urban
Tahun
Year
Tenaga
buruh
Labour
force
Bekerja
Employed
Bekerja kurang
dari 30 jam
Working less
than 30 hours
Penganggur
Unemployed
Luar tenaga
buruh
Outside
labour force
Kadar penyertaan
tenaga buruh
Labour force
participation rate
Kadar
pengangguran
Unemployment
rate
1982 2,033.1 1,968.1 78.1 65.1 1,093.3 65.0 3.2
1983 2,063.5 1,990.1 99.9 73.4 1,040.8 66.5 3.6
1984 2,130.9 2,028.9 133.8 102.1 1,170.7 64.5 4.8
1985 2,179.4 2,063.0 138.0 116.3 1,161.8 65.2 5.3
1986 2,157.5 1,996.5 179.2 161.0 1,148.7 65.3 7.5
1987 2,192.3 2,030.4 130.9 162.0 1,156.8 65.5 7.4
1988 2,243.1 2,088.8 170.2 154.3 1,179.1 65.5 6.9
1989 2,297.1 2,172.0 103.4 125.1 1,219.2 65.3 5.4
1990 2,325.4 2,225.7 96.1 99.7 1,192.3 66.1 4.3
1992 4,073.6 3,942.8 148.8 130.8 2,101.8 66.0 3.2
1993 4,228.7 4,068.8 209.8 159.9 2,098.2 66.8 3.8
1995 4,365.2 4,242.2 145.5 123.0 2,364.5 64.9 2.8
1996 4,610.4 4,506.7 155.6 103.7 2,375.3 66.0 2.2
1997 4,764.3 4,665.2 154.0 99.1 2,441.5 66.1 2.1
1998 4,775.3 4,624.0 155.4 151.3 2,649.6 64.3 3.2
1999 4,997.4 4,827.3 150.6 170.1 2,763.6 64.4 3.4
2000 5,174.6 5,027.8 155.1 146.8 2,720.2 65.5 2.8
2001 6,378.3 6,172.9 203.8 205.3 3,362.7 65.5 3.2
2002 6,516.8 6,300.8 184.4 215.9 3,558.2 64.7 3.3
2003 6,697.9 6,466.0 191.1 231.9 3,528.7 65.5 3.5
2004 6,828.8 6,604.1 251.9 224.7 3,677.9 65.0 3.3
2005 7,007.5 6,771.7 198.7 235.8 3,918.2 64.1 3.4
2006 7,131.1 6,900.9 178.8 230.1 4,036.3 63.9 3.2
2007 7,330.4 7,102.0 185.1 228.4 4,164.8 63.8 3.1
2008 7,502.1 7,265.1 189.3 237.0 4,320.3 63.5 3.2
2009 7,690.1 7,411.4 182.2 278.7 4,416.5 63.5 3.6
2010 8,465.6 8,192.5 202.4 273.1 4,693.1 64.3 3.2
2011 8,783.7 8,528.4 224.4 255.3 4,643.2 65.4 2.9
2012 9,174.5 8,907.7 218.4 266.8 4,662.3 66.3 2.9
2013 9,652.1 9,354.6 285.8 297.5 4,577.0 67.8 3.1
Jadual 3: Perangkaan utama tenaga buruh mengikut strata, Malaysia, 1982–2013
Table 3: Principal statistics of the labour force by stratum, Malaysia, 1982–2013
Bilangan/Number ('000) (%)
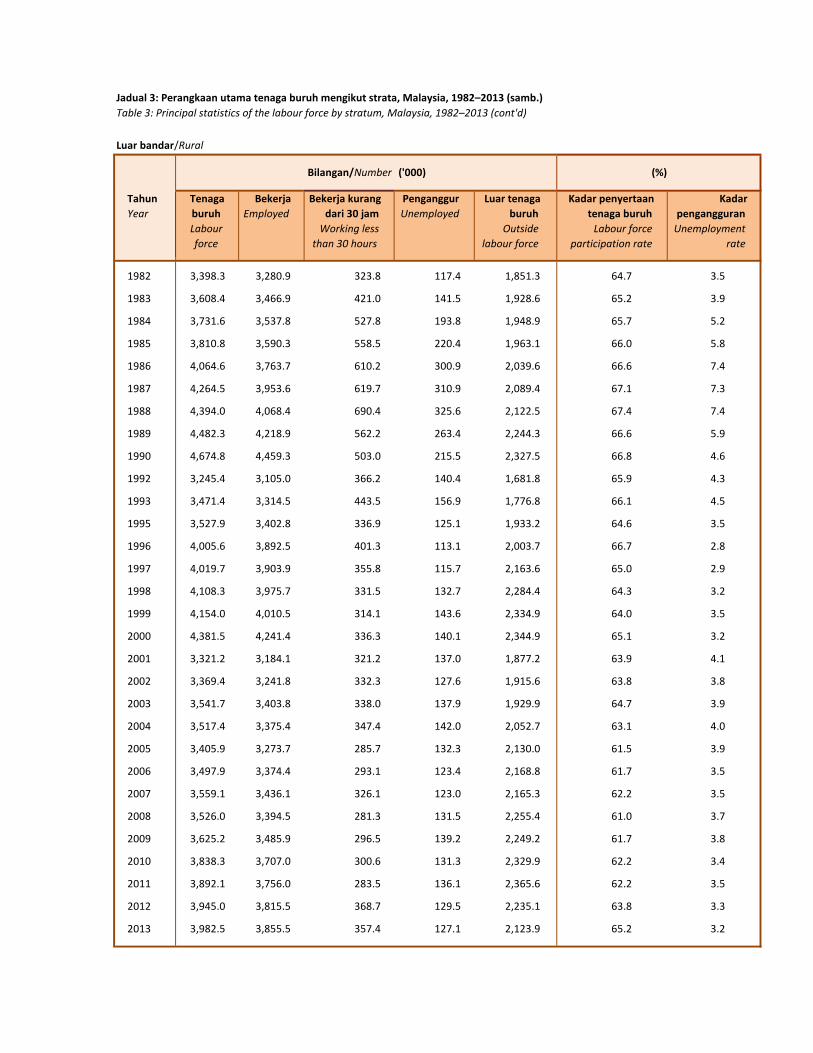
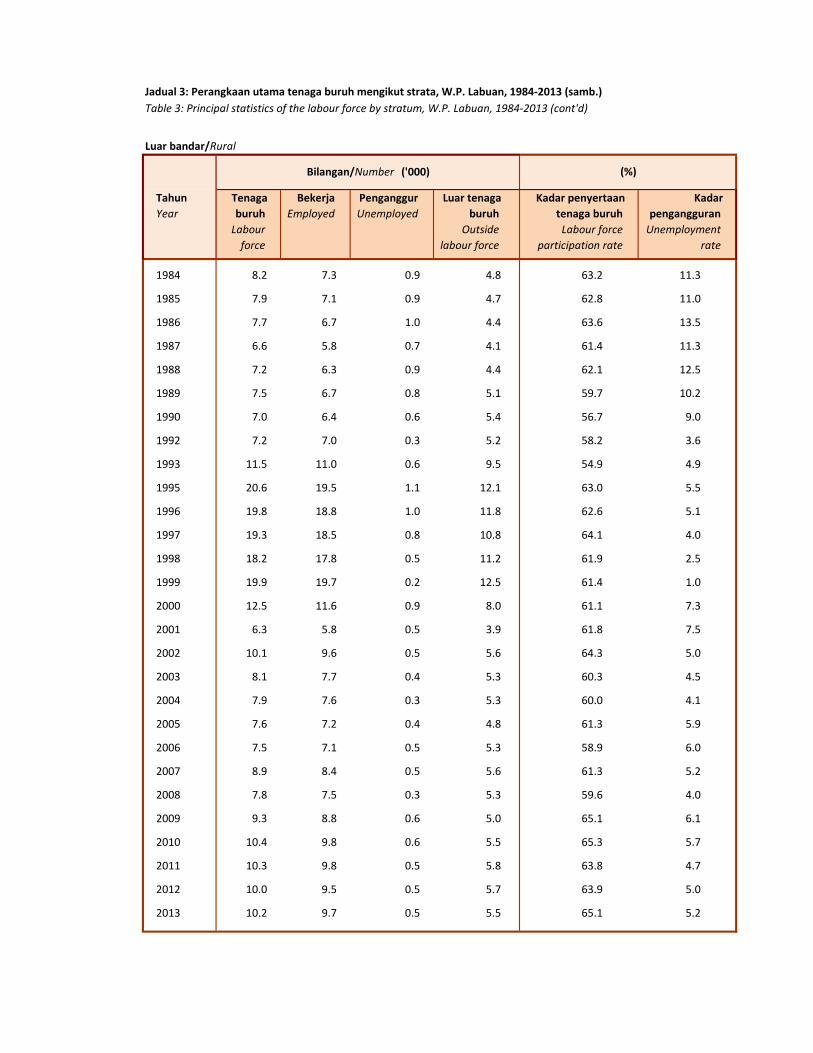
Luar bandar/Rural
Tahun
Year
Tenaga
buruh
Labour
force
Bekerja
Employed
Bekerja kurang
dari 30 jam
Working less
than 30 hours
Penganggur
Unemployed
Luar tenaga
buruh
Outside
labour force
Kadar penyertaan
tenaga buruh
Labour force
participation rate
Kadar
pengangguran
Unemployment
rate
1982 3,398.3 3,280.9 323.8 117.4 1,851.3 64.7 3.5
1983 3,608.4 3,466.9 421.0 141.5 1,928.6 65.2 3.9
1984 3,731.6 3,537.8 527.8 193.8 1,948.9 65.7 5.2
1985 3,810.8 3,590.3 558.5 220.4 1,963.1 66.0 5.8
1986 4,064.6 3,763.7 610.2 300.9 2,039.6 66.6 7.4
1987 4,264.5 3,953.6 619.7 310.9 2,089.4 67.1 7.3
1988 4,394.0 4,068.4 690.4 325.6 2,122.5 67.4 7.4
1989 4,482.3 4,218.9 562.2 263.4 2,244.3 66.6 5.9
1990 4,674.8 4,459.3 503.0 215.5 2,327.5 66.8 4.6
1992 3,245.4 3,105.0 366.2 140.4 1,681.8 65.9 4.3
1993 3,471.4 3,314.5 443.5 156.9 1,776.8 66.1 4.5
1995 3,527.9 3,402.8 336.9 125.1 1,933.2 64.6 3.5
1996 4,005.6 3,892.5 401.3 113.1 2,003.7 66.7 2.8
1997 4,019.7 3,903.9 355.8 115.7 2,163.6 65.0 2.9
1998 4,108.3 3,975.7 331.5 132.7 2,284.4 64.3 3.2
1999 4,154.0 4,010.5 314.1 143.6 2,334.9 64.0 3.5
2000 4,381.5 4,241.4 336.3 140.1 2,344.9 65.1 3.2
2001 3,321.2 3,184.1 321.2 137.0 1,877.2 63.9 4.1
2002 3,369.4 3,241.8 332.3 127.6 1,915.6 63.8 3.8
2003 3,541.7 3,403.8 338.0 137.9 1,929.9 64.7 3.9
2004 3,517.4 3,375.4 347.4 142.0 2,052.7 63.1 4.0
2005 3,405.9 3,273.7 285.7 132.3 2,130.0 61.5 3.9
2006 3,497.9 3,374.4 293.1 123.4 2,168.8 61.7 3.5
2007 3,559.1 3,436.1 326.1 123.0 2,165.3 62.2 3.5
2008 3,526.0 3,394.5 281.3 131.5 2,255.4 61.0 3.7
2009 3,625.2 3,485.9 296.5 139.2 2,249.2 61.7 3.8
2010 3,838.3 3,707.0 300.6 131.3 2,329.9 62.2 3.4
2011 3,892.1 3,756.0 283.5 136.1 2,365.6 62.2 3.5
2012 3,945.0 3,815.5 368.7 129.5 2,235.1 63.8 3.3
2013 3,982.5 3,855.5 357.4 127.1 2,123.9 65.2 3.2
Jadual 3: Perangkaan utama tenaga buruh mengikut strata, Malaysia, 1982–2013 (samb.)
Table 3: Principal statistics of the labour force by stratum, Malaysia, 1982–2013 (cont'd)
Bilangan/Number ('000) (%)
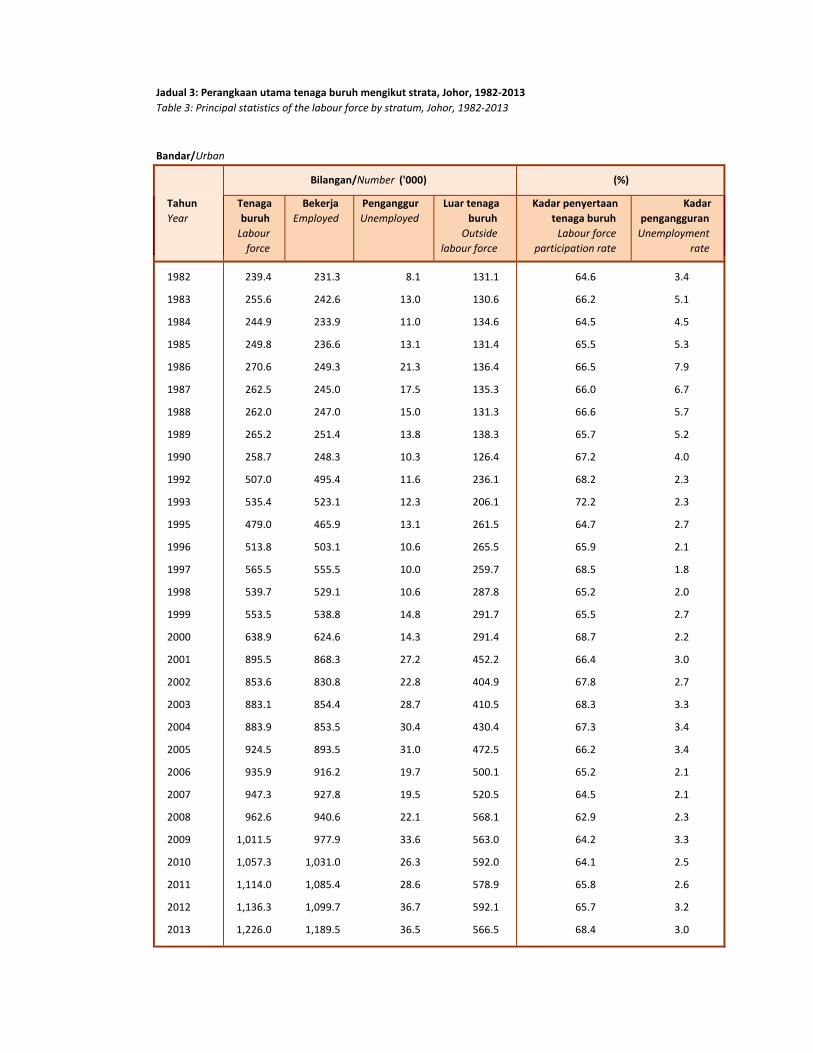
Table 3: Principal statistics of the labour force by stratum, Johor, 1982-2013
Bandar/Urban
Tahun
Year
Tenaga
buruh
Labour
force
Bekerja
Employed
Penganggur
Unemployed
Luar tenaga
buruh
Outside
labour force
Kadar penyertaan
tenaga buruh
Labour force
participation rate
Kadar
pengangguran
Unemployment
rate
1982 239.4 231.3 8.1 131.1 64.6 3.4
1983 255.6 242.6 13.0 130.6 66.2 5.1
1984 244.9 233.9 11.0 134.6 64.5 4.5
1985 249.8 236.6 13.1 131.4 65.5 5.3
1986 270.6 249.3 21.3 136.4 66.5 7.9
1987 262.5 245.0 17.5 135.3 66.0 6.7
1988 262.0 247.0 15.0 131.3 66.6 5.7
1989 265.2 251.4 13.8 138.3 65.7 5.2
1990 258.7 248.3 10.3 126.4 67.2 4.0
1992 507.0 495.4 11.6 236.1 68.2 2.3
1993 535.4 523.1 12.3 206.1 72.2 2.3
1995 479.0 465.9 13.1 261.5 64.7 2.7
1996 513.8 503.1 10.6 265.5 65.9 2.1
1997 565.5 555.5 10.0 259.7 68.5 1.8
1998 539.7 529.1 10.6 287.8 65.2 2.0
1999 553.5 538.8 14.8 291.7 65.5 2.7
2000 638.9 624.6 14.3 291.4 68.7 2.2
2001 895.5 868.3 27.2 452.2 66.4 3.0
2002 853.6 830.8 22.8 404.9 67.8 2.7
2003 883.1 854.4 28.7 410.5 68.3 3.3
2004 883.9 853.5 30.4 430.4 67.3 3.4
2005 924.5 893.5 31.0 472.5 66.2 3.4
2006 935.9 916.2 19.7 500.1 65.2 2.1
2007 947.3 927.8 19.5 520.5 64.5 2.1
2008 962.6 940.6 22.1 568.1 62.9 2.3
2009 1,011.5 977.9 33.6 563.0 64.2 3.3
2010 1,057.3 1,031.0 26.3 592.0 64.1 2.5
2011 1,114.0 1,085.4 28.6 578.9 65.8 2.6
2012 1,136.3 1,099.7 36.7 592.1 65.7 3.2
2013 1,226.0 1,189.5 36.5 566.5 68.4 3.0
Jadual 3: Perangkaan utama tenaga buruh mengikut strata, Johor, 1982-2013
Bilangan/Number ('000) (%)
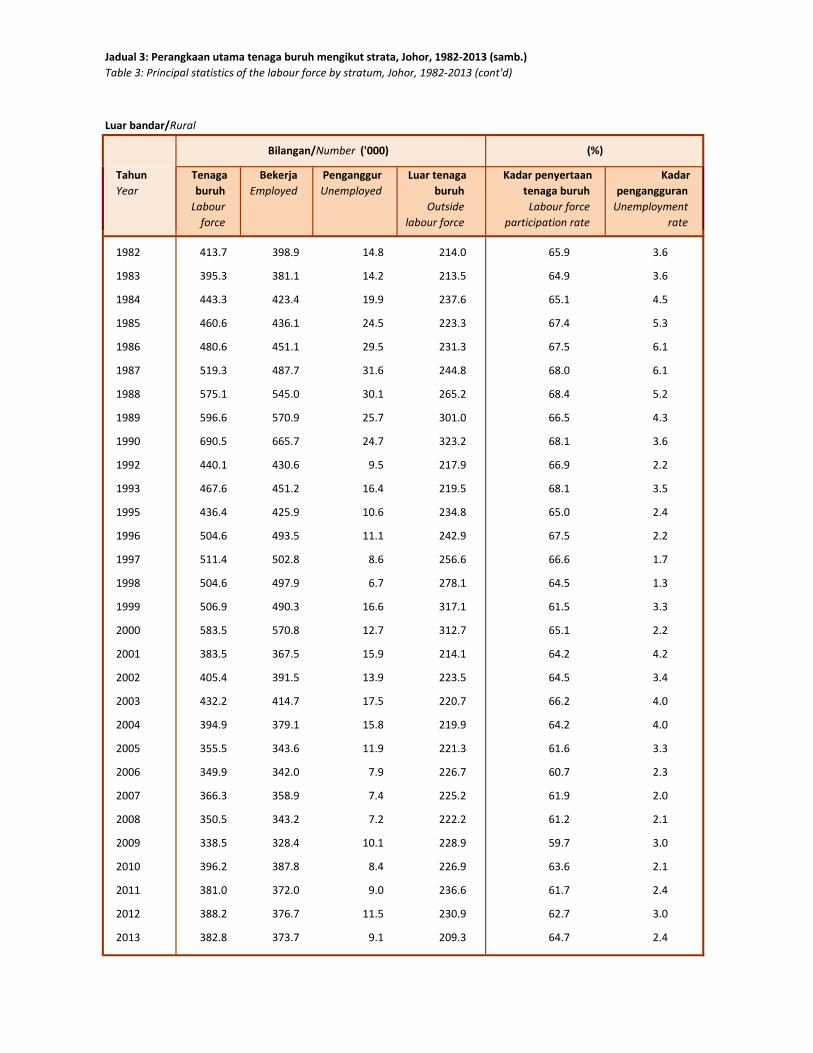
Table 3: Principal statistics of the labour force by stratum, Johor, 1982-2013 (cont'd)
Luar bandar/Rural
Tahun
Year
Tenaga
buruh
Labour
force
Bekerja
Employed
Penganggur
Unemployed
Luar tenaga
buruh
Outside
labour force
Kadar penyertaan
tenaga buruh
Labour force
participation rate
Kadar
pengangguran
Unemployment
rate
1982 413.7 398.9 14.8 214.0 65.9 3.6
1983 395.3 381.1 14.2 213.5 64.9 3.6
1984 443.3 423.4 19.9 237.6 65.1 4.5
1985 460.6 436.1 24.5 223.3 67.4 5.3
1986 480.6 451.1 29.5 231.3 67.5 6.1
1987 519.3 487.7 31.6 244.8 68.0 6.1
1988 575.1 545.0 30.1 265.2 68.4 5.2
1989 596.6 570.9 25.7 301.0 66.5 4.3
1990 690.5 665.7 24.7 323.2 68.1 3.6
1992 440.1 430.6 9.5 217.9 66.9 2.2
1993 467.6 451.2 16.4 219.5 68.1 3.5
1995 436.4 425.9 10.6 234.8 65.0 2.4
1996 504.6 493.5 11.1 242.9 67.5 2.2
1997 511.4 502.8 8.6 256.6 66.6 1.7
1998 504.6 497.9 6.7 278.1 64.5 1.3
1999 506.9 490.3 16.6 317.1 61.5 3.3
2000 583.5 570.8 12.7 312.7 65.1 2.2
2001 383.5 367.5 15.9 214.1 64.2 4.2
2002 405.4 391.5 13.9 223.5 64.5 3.4
2003 432.2 414.7 17.5 220.7 66.2 4.0
2004 394.9 379.1 15.8 219.9 64.2 4.0
2005 355.5 343.6 11.9 221.3 61.6 3.3
2006 349.9 342.0 7.9 226.7 60.7 2.3
2007 366.3 358.9 7.4 225.2 61.9 2.0
2008 350.5 343.2 7.2 222.2 61.2 2.1
2009 338.5 328.4 10.1 228.9 59.7 3.0
2010 396.2 387.8 8.4 226.9 63.6 2.1
2011 381.0 372.0 9.0 236.6 61.7 2.4
2012 388.2 376.7 11.5 230.9 62.7 3.0
2013 382.8 373.7 9.1 209.3 64.7 2.4
Jadual 3: Perangkaan utama tenaga buruh mengikut strata, Johor, 1982-2013 (samb.)
Bilangan/Number ('000) (%)

Bandar/Urban
Tahun
Year
Tenaga
buruh
Labour
force
Bekerja
Employed
Penganggur
Unemployed
Luar tenaga
buruh
Outside
labour force
Kadar penyertaan
tenaga buruh
Labour force
participation rate
Kadar
pengangguran
Unemployment
rate
1982 53.8 51.2 2.5 37.5 58.9 4.7
1983 54.8 53.0 1.8 34.6 61.3 3.3
1984 55.9 52.5 3.3 39.0 58.9 6.0
1985 63.8 59.8 4.0 42.4 60.1 6.3
1986 64.2 59.3 4.9 44.0 59.3 7.6
1987 67.9 63.1 4.8 40.8 62.5 7.1
1988 65.2 61.5 3.8 38.7 62.8 5.8
1989 60.3 56.5 3.8 38.0 61.4 6.3
1990 56.9 54.7 2.2 34.1 62.5 3.8
1992 185.0 180.6 4.4 101.6 64.6 2.4
1993 174.2 169.4 4.9 98.8 63.8 2.8
1995 193.7 189.1 4.6 126.0 60.6 2.4
1996 183.5 179.5 4.0 130.3 58.5 2.2
1997 201.9 197.6 4.3 122.0 62.3 2.1
1998 209.2 201.7 7.5 122.9 63.0 3.6
1999 230.5 223.9 6.6 142.7 61.8 2.8
2000 235.8 229.1 6.7 145.3 61.9 2.9
2001 322.4 313.1 9.3 198.3 61.9 2.9
2002 267.9 258.6 9.3 176.6 60.3 3.5
2003 283.1 274.9 8.2 164.9 63.2 2.9
2004 282.5 272.4 10.1 177.9 61.4 3.6
2005 294.1 284.5 9.6 188.3 61.0 3.2
2006 293.4 281.8 11.6 206.1 58.7 4.0
2007 294.8 286.5 8.3 218.3 57.5 2.8
2008 306.3 295.5 10.7 221.3 58.1 3.5
2009 327.3 313.7 13.7 214.8 60.4 4.2
2010 338.0 327.2 10.8 222.0 60.4 3.2
2011 341.2 331.0 10.1 229.6 59.8 3.0
2012 377.0 368.4 8.6 231.0 62.0 2.3
2013 398.3 389.2 9.1 235.2 62.9 2.3
Jadual 3: Perangkaan utama tenaga buruh mengikut strata, Kedah, 1982-2013
Table 3: Principal statistics of the labour force by stratum, Kedah, 1982-2013
Bilangan/Number ('000) (%)
Tahun
Year
Tenaga
buruh
Labour
force
Bekerja
Employed
Penganggur
Unemployed
Luar tenaga
buruh
Outside
labour force
Kadar penyertaan
tenaga buruh
Labour force
participation rate
Kadar
pengangguran
Unemployment
rate
1982 350.2 337.7 12.4 221.7 61.2 3.6
1983 333.4 320.6 12.8 192.0 63.5 3.8
1984 386.7 365.1 21.6 237.3 62.0 5.6
1985 381.6 354.1 27.5 233.6 62.0 7.2
1986 390.8 358.7 32.1 252.2 60.8 8.2
1987 388.6 357.0 31.6 250.4 60.8 8.1
1988 430.9 397.8 33.1 257.1 62.6 7.7
1989 409.7 386.8 22.9 250.8 62.0 5.6
1990 432.4 413.0 19.4 266.9 61.8 4.5
1992 329.0 314.4 14.5 204.0 61.7 4.4
1993 318.6 305.7 12.9 196.1 61.9 4.0
1995 338.0 332.0 5.9 209.4 61.7 1.8
1996 366.3 356.5 9.8 231.3 61.3 2.7
1997 414.7 403.7 11.0 256.7 61.8 2.7
1998 378.0 365.6 12.3 249.1 60.3 3.3
1999 470.9 454.8 16.2 279.7 62.7 3.4
2000 409.4 397.4 11.9 246.0 62.5 2.9
2001 405.0 388.0 17.1 262.0 60.7 4.2
2002 398.6 386.5 12.1 249.2 61.5 3.0
2003 397.1 382.8 14.2 243.1 62.0 3.6
2004 397.9 382.1 15.8 237.4 62.6 4.0
2005 383.8 368.3 15.5 257.3 59.9 4.0
2006 389.0 375.0 14.0 261.1 59.8 3.6
2007 398.2 383.9 14.4 263.3 60.2 3.6
2008 396.7 380.5 16.2 276.3 58.9 4.1
2009 405.3 387.9 17.4 281.2 59.0 4.3
2010 408.9 398.5 10.4 287.0 58.8 2.5
2011 429.0 412.3 16.7 283.6 60.2 3.9
2012 432.0 417.0 15.1 271.2 61.4 3.5
2013 451.0 439.5 11.5 251.8 64.2 2.5
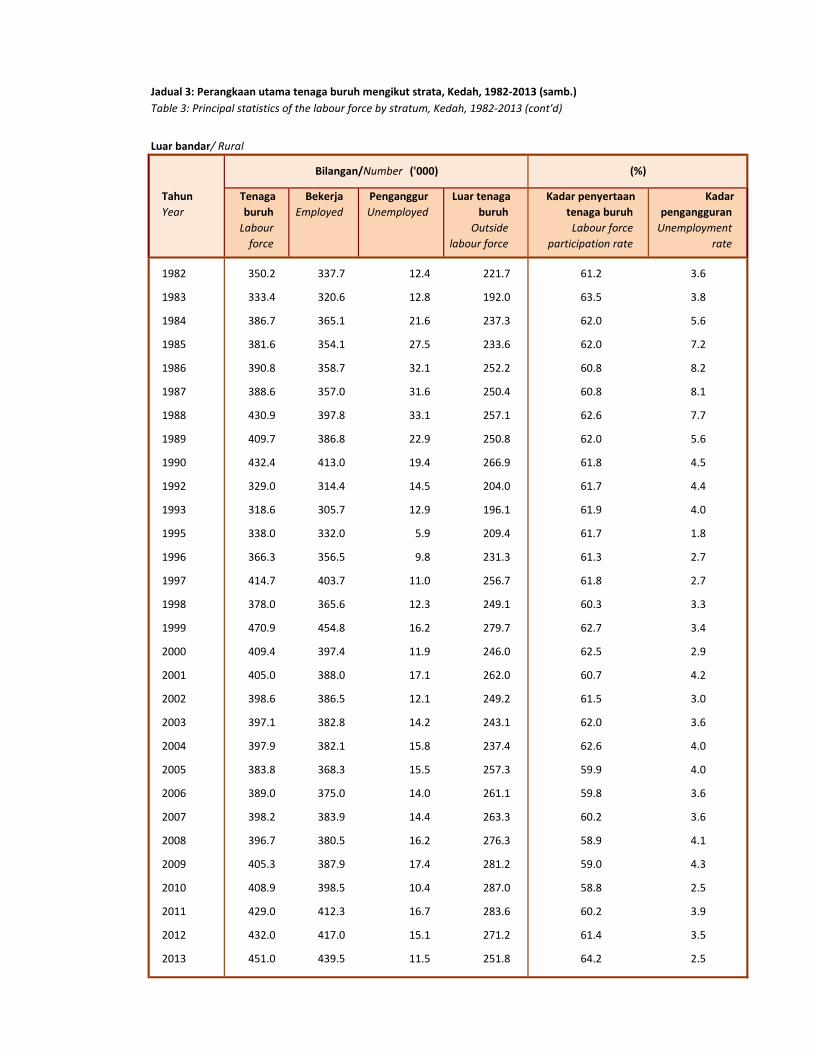
Jadual 3: Perangkaan utama tenaga buruh mengikut strata, Kedah, 1982-2013 (samb.)
Table 3: Principal statistics of the labour force by stratum, Kedah, 1982-2013 (cont'd)
Luar bandar/ Rural
Bilangan/Number ('000) (%)
Bandar/Urban
Tahun
Year
Tenaga
buruh
Labour
force
Bekerja
Employed
Penganggur
Unemployed
Luar tenaga
buruh
Outside labour
force
Kadar penyertaan
tenaga buruh
Labour force
participation rate
Kadar
pengangguran
Unemployment
rate
1982 87.0 81.7 5.3 60.0 59.2 6.1
1983 83.3 77.1 6.2 62.2 57.2 7.4
1984 93.0 88.0 4.9 63.1 59.6 5.3
1985 88.8 83.6 5.2 60.7 59.4 5.8
1986 96.7 90.3 6.4 65.9 59.5 6.6
1987 100.4 91.7 8.7 66.7 60.1 8.7
1988 110.4 102.0 8.4 64.8 63.0 7.6
1989 105.6 97.7 7.9 64.5 62.1 7.4
1990 104.9 100.4 4.5 66.7 61.1 4.3
1992 140.2 134.0 6.2 77.7 64.3 4.4
1993 138.8 133.6 5.2 86.6 61.6 3.7
1995 143.6 138.3 5.3 85.9 62.6 3.7
1996 154.8 149.3 5.5 91.1 63.0 3.6
1997 146.7 142.6 4.2 91.5 61.6 2.8
1998 144.5 137.7 6.8 91.1 61.3 4.7
1999 149.9 144.8 5.1 102.1 59.5 3.4
2000 145.7 141.5 4.2 101.1 59.0 2.9
2001 152.5 148.5 4.0 107.2 58.7 2.6
2002 144.1 139.1 5.0 97.6 59.6 3.5
2003 170.7 165.1 5.6 109.0 61.0 3.3
2004 162.9 156.6 6.3 124.4 56.7 3.9
2005 163.1 157.5 5.6 134.1 54.9 3.4
2006 169.5 164.9 4.5 142.2 54.4 2.7
2007 171.2 166.5 4.6 146.7 53.8 2.7
2008 182.5 177.2 5.3 151.5 54.6 2.9
2009 188.3 183.2 5.0 156.9 54.5 2.7
2010 192.4 187.7 4.7 141.9 57.5 2.4
2011 195.9 191.7 4.2 150.3 56.6 2.1
2012 210.4 205.5 4.9 148.6 58.6 2.3
2013 216.6 210.9 5.7 148.2 59.4 2.6
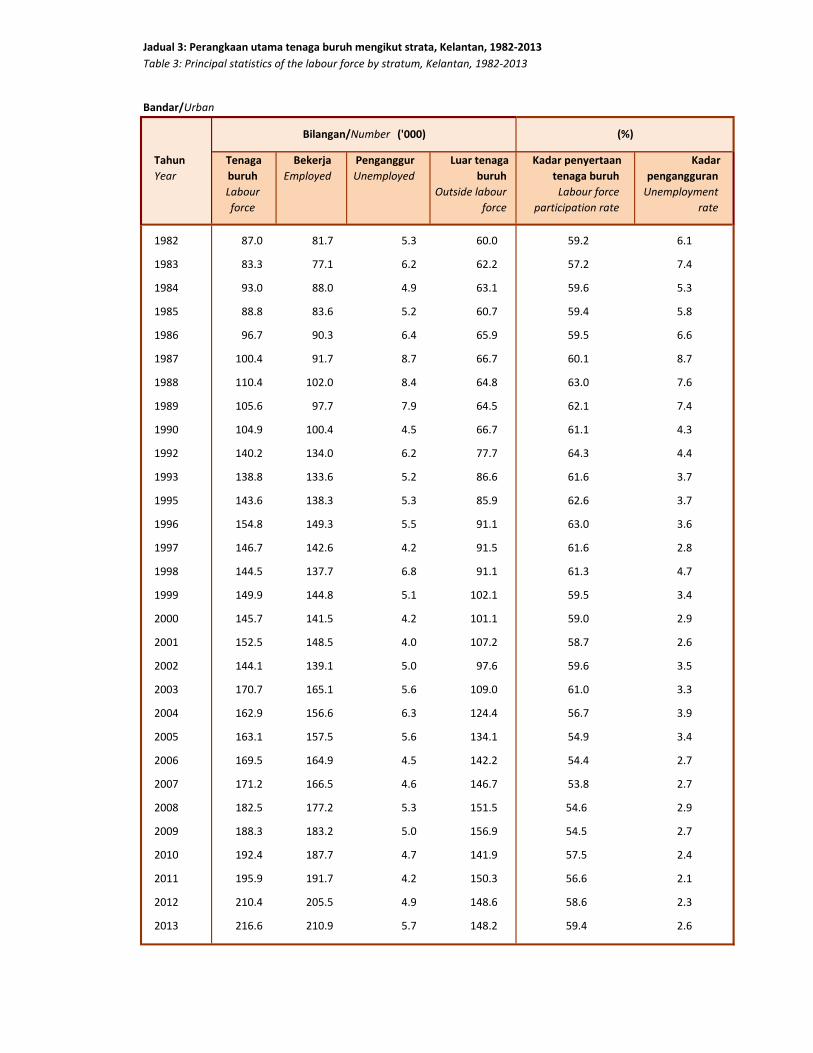
Jadual 3: Perangkaan utama tenaga buruh mengikut strata, Kelantan, 1982-2013
Table 3: Principal statistics of the labour force by stratum, Kelantan, 1982-2013
Bilangan/Number ('000) (%)
Tahun
Year
Tenaga
buruh
Labour
force
Bekerja
Employed
Penganggur
Unemployed
Luar tenaga
buruh
Outside labour
force
Kadar penyertaan
tenaga buruh
Labour force
participation rate
Kadar
pengangguran
Unemployment
rate
1982 232.4 222.5 9.9 128.9 64.3 4.3
1983 218.0 205.4 12.6 154.2 58.6 5.8
1984 248.0 234.3 13.7 150.0 62.3 5.5
1985 255.5 240.0 15.5 152.2 62.7 6.1
1986 268.5 250.0 18.5 155.3 63.3 6.9
1987 274.5 258.8 15.8 151.1 64.5 5.7
1988 283.6 261.4 22.2 126.4 69.2 7.8
1989 282.8 266.1 16.7 159.1 64.0 5.9
1990 285.8 277.3 8.5 153.4 65.1 3.0
1992 263.9 248.5 15.4 150.5 63.7 5.8
1993 274.9 260.8 14.1 169.5 61.9 5.1
1995 284.0 274.3 9.7 164.7 63.3 3.4
1996 306.0 296.2 9.8 174.8 63.6 3.2
1997 282.6 271.1 11.5 184.7 60.5 4.1
1998 304.5 293.0 11.6 190.3 61.5 3.8
1999 301.2 292.0 9.2 192.1 61.1 3.1
2000 291.5 284.2 7.3 187.9 60.8 2.5
2001 295.4 285.7 9.7 216.1 57.8 3.3
2002 295.6 283.6 12.0 207.5 58.8 4.1
2003 320.8 310.6 10.3 211.2 60.3 3.2
2004 292.3 280.0 12.2 231.1 55.8 4.2
2005 291.1 281.3 9.8 250.2 53.8 3.4
2006 300.3 293.4 6.9 254.4 54.1 2.3
2007 315.0 306.5 8.5 263.6 54.4 2.7
2008 318.4 309.3 9.2 267.1 54.4 2.9
2009 329.6 322.0 7.6 275.8 54.4 2.3
2010 354.9 346.5 8.4 270.2 56.8 2.4
2011 358.4 351.8 6.6 281.3 56.0 1.8
2012 378.8 370.1 8.6 274.3 58.0 2.3
2013 398.6 387.2 11.4 274.1 59.3 2.9
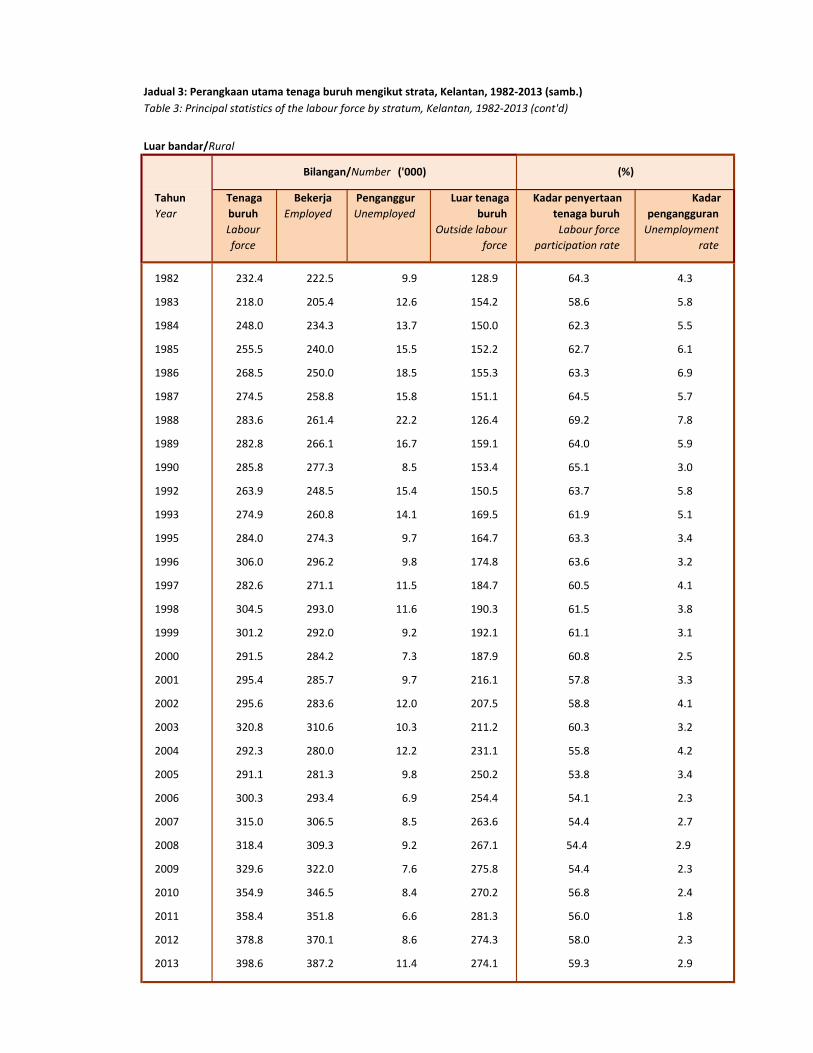
Jadual 3: Perangkaan utama tenaga buruh mengikut strata, Kelantan, 1982-2013 (samb.)
Table 3: Principal statistics of the labour force by stratum, Kelantan, 1982-2013 (cont'd)
Luar bandar/Rural
Bilangan/Number ('000) (%)
Bandar/Urban
Tahun
Year
Tenaga
buruh
Labour
force
Bekerja
Employed
Penganggur
Unemployed
Luar tenaga
buruh
Outside
labour force
Kadar penyertaan
tenaga buruh
Labour force
participation rate
Kadar
pengangguran
Unemployment
rate
1982 43.8 42.2 1.6 26.1 62.6 3.6
1983 38.4 37.5 0.9 27.4 58.3 2.3
1984 37.4 35.8 1.6 21.8 63.1 4.3
1985 39.9 37.5 2.4 21.1 65.4 6.0
1986 37.4 34.5 2.9 23.1 61.9 7.8
1987 39.9 36.8 3.1 24.0 62.4 7.7
1988 38.6 35.5 3.2 22.3 63.4 8.2
1989 42.7 40.3 2.4 23.8 64.2 5.7
1990 42.6 40.4 2.2 21.5 66.5 5.1
1992 89.9 87.2 2.7 47.1 65.6 3.0
1993 93.3 90.2 3.0 42.6 68.6 3.3
1995 107.0 104.5 2.4 61.3 63.6 2.3
1996 108.9 107.6 1.2 53.0 67.3 1.1
1997 123.0 120.9 2.1 52.8 70.0 1.7
1998 116.0 113.4 2.7 66.9 63.4 2.3
1999 111.9 109.7 2.2 64.7 63.4 2.0
2000 110.9 109.4 1.5 56.5 66.2 1.4
2001 201.3 198.0 3.2 118.8 62.9 1.6
2002 159.0 154.3 4.6 104.4 60.3 2.9
2003 195.3 190.0 5.3 116.8 62.6 2.7
2004 191.4 188.0 3.3 117.0 62.1 1.7
2005 202.9 200.5 2.4 121.8 62.5 1.2
2006 202.7 200.3 2.4 124.6 61.9 1.2
2007 223.0 218.4 4.6 130.4 63.1 2.1
2008 230.4 227.9 2.6 141.1 62.0 1.1
2009 230.1 224.7 5.4 147.7 60.9 2.4
2010 269.9 267.2 2.7 170.7 61.3 1.0
2011 275.5 273.6 1.9 177.2 60.9 0.7
2012 296.2 294.8 1.4 178.8 62.4 0.5
2013 316.2 313.9 2.2 174.3 64.5 0.7
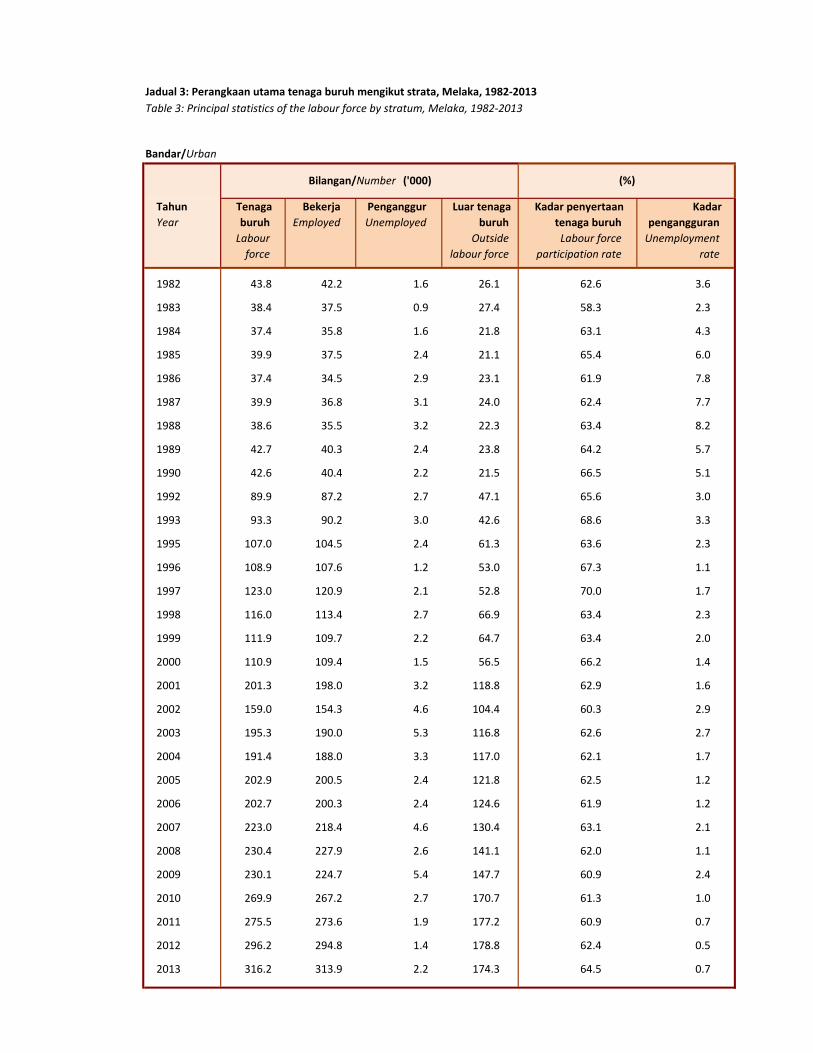
Jadual 3: Perangkaan utama tenaga buruh mengikut strata, Melaka, 1982-2013
Table 3: Principal statistics of the labour force by stratum, Melaka, 1982-2013
Bilangan/Number ('000) (%)
Tahun
Year
Tenaga
buruh
Labour
force
Bekerja
Employed
Penganggur
Unemployed
Luar tenaga
buruh
Outside
labour force
Kadar penyertaan
tenaga buruh
Labour force
participation rate
Kadar
pengangguran
Unemployment
rate
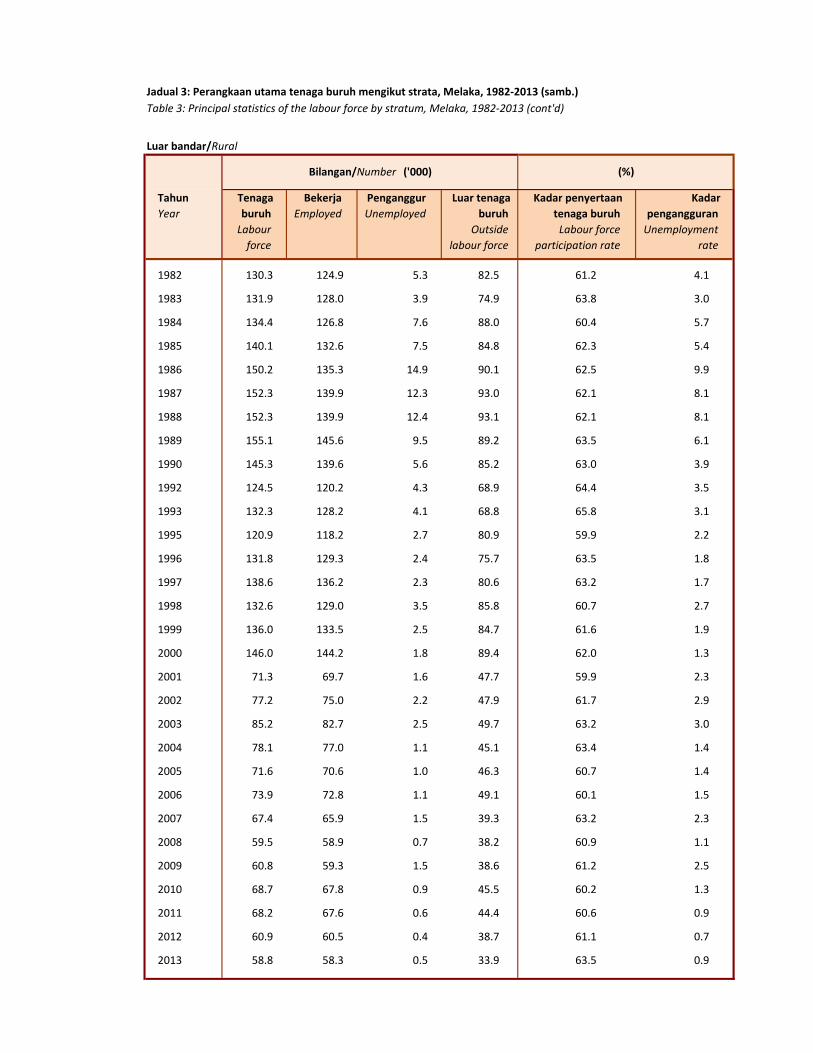
1982 130.3 124.9 5.3 82.5 61.2 4.1
1983 131.9 128.0 3.9 74.9 63.8 3.0
1984 134.4 126.8 7.6 88.0 60.4 5.7
1985 140.1 132.6 7.5 84.8 62.3 5.4
1986 150.2 135.3 14.9 90.1 62.5 9.9
1987 152.3 139.9 12.3 93.0 62.1 8.1
1988 152.3 139.9 12.4 93.1 62.1 8.1
1989 155.1 145.6 9.5 89.2 63.5 6.1
1990 145.3 139.6 5.6 85.2 63.0 3.9
1992 124.5 120.2 4.3 68.9 64.4 3.5
1993 132.3 128.2 4.1 68.8 65.8 3.1
1995 120.9 118.2 2.7 80.9 59.9 2.2
1996 131.8 129.3 2.4 75.7 63.5 1.8
1997 138.6 136.2 2.3 80.6 63.2 1.7
1998 132.6 129.0 3.5 85.8 60.7 2.7
1999 136.0 133.5 2.5 84.7 61.6 1.9
2000 146.0 144.2 1.8 89.4 62.0 1.3
2001 71.3 69.7 1.6 47.7 59.9 2.3
2002 77.2 75.0 2.2 47.9 61.7 2.9
2003 85.2 82.7 2.5 49.7 63.2 3.0
2004 78.1 77.0 1.1 45.1 63.4 1.4
2005 71.6 70.6 1.0 46.3 60.7 1.4
2006 73.9 72.8 1.1 49.1 60.1 1.5
2007 67.4 65.9 1.5 39.3 63.2 2.3
2008 59.5 58.9 0.7 38.2 60.9 1.1
2009 60.8 59.3 1.5 38.6 61.2 2.5
2010 68.7 67.8 0.9 45.5 60.2 1.3
2011 68.2 67.6 0.6 44.4 60.6 0.9
2012 60.9 60.5 0.4 38.7 61.1 0.7
2013 58.8 58.3 0.5 33.9 63.5 0.9
Jadual 3: Perangkaan utama tenaga buruh mengikut strata, Melaka, 1982-2013 (samb.)
Table 3: Principal statistics of the labour force by stratum, Melaka, 1982-2013 (cont'd)
Luar bandar/Rural
Bilangan/Number ('000) (%)

Bandar/Urban
Tahun
Year
Tenaga
buruh
Labour
force
Bekerja
Employed
Penganggur
Unemployed
Luar tenaga
buruh
Outside
labour force
Kadar penyertaan
tenaga buruh
Labour force
participation rate
Kadar
pengangguran
Unemployment
rate
1982 70.3 68.6 1.7 43.0 62.1 2.4
1983 78.5 76.6 1.8 41.8 65.2 2.3
1984 86.8 83.0 3.8 53.2 62.0 4.4
1985 83.3 79.6 3.7 55.0 60.2 4.5
1986 80.5 74.3 6.2 48.4 62.4 7.7
1987 73.3 67.9 5.4 44.8 62.1 7.3
1988 79.5 73.9 5.6 42.3 65.3 7.0
1989 83.0 80.0 3.0 43.7 65.5 3.6
1990 72.2 69.8 2.4 38.3 65.3 3.4
1992 117.5 113.3 4.2 66.6 63.8 3.6
1993 138.9 135.0 3.9 63.3 68.7 2.8
1995 140.2 136.2 4.0 74.4 65.3 2.9
1996 157.9 154.4 3.5 77.2 67.2 2.2
1997 157.8 155.4 2.4 85.1 65.0 1.5
1998 151.0 146.0 5.1 81.4 65.0 3.4
1999 142.6 137.9 4.6 91.7 60.9 3.3
2000 165.4 159.4 6.0 94.5 63.6 3.6
2001 209.9 203.6 6.3 108.5 65.9 3.0
2002 177.3 171.2 6.1 98.2 64.4 3.4
2003 200.6 194.4 6.2 103.5 66.0 3.1
2004 214.6 206.9 7.6 128.0 62.6 3.6
2005 237.5 230.0 7.5 127.6 65.1 3.1
2006 238.4 230.3 8.1 131.8 64.4 3.4
2007 240.6 232.0 8.6 136.5 63.8 3.6
2008 242.5 235.1 7.5 145.3 62.5 3.1
2009 248.9 239.5 9.3 147.1 62.8 3.8
2010 262.4 255.2 7.3 168.4 60.9 2.8
2011 255.5 247.1 8.4 171.6 59.8 3.3
2012 291.7 283.4 8.3 161.9 64.3 2.9
2013 299.9 290.6 9.3 163.8 64.7 3.1
Jadual 3: Perangkaan utama tenaga buruh mengikut strata, Negeri Sembilan, 1982-2013
Table 3: Principal statistics of the labour force by stratum, Negeri Sembilan, 1982-2013
Bilangan/Number ('000) (%)
Tahun
Year
Tenaga
buruh
Labour
force
Bekerja
Employed
Penganggur
Unemployed
Luar tenaga
buruh
Outside
labour force
Kadar penyertaan
tenaga buruh
Labour force
participation rate
Kadar
pengangguran
Unemployment
rate
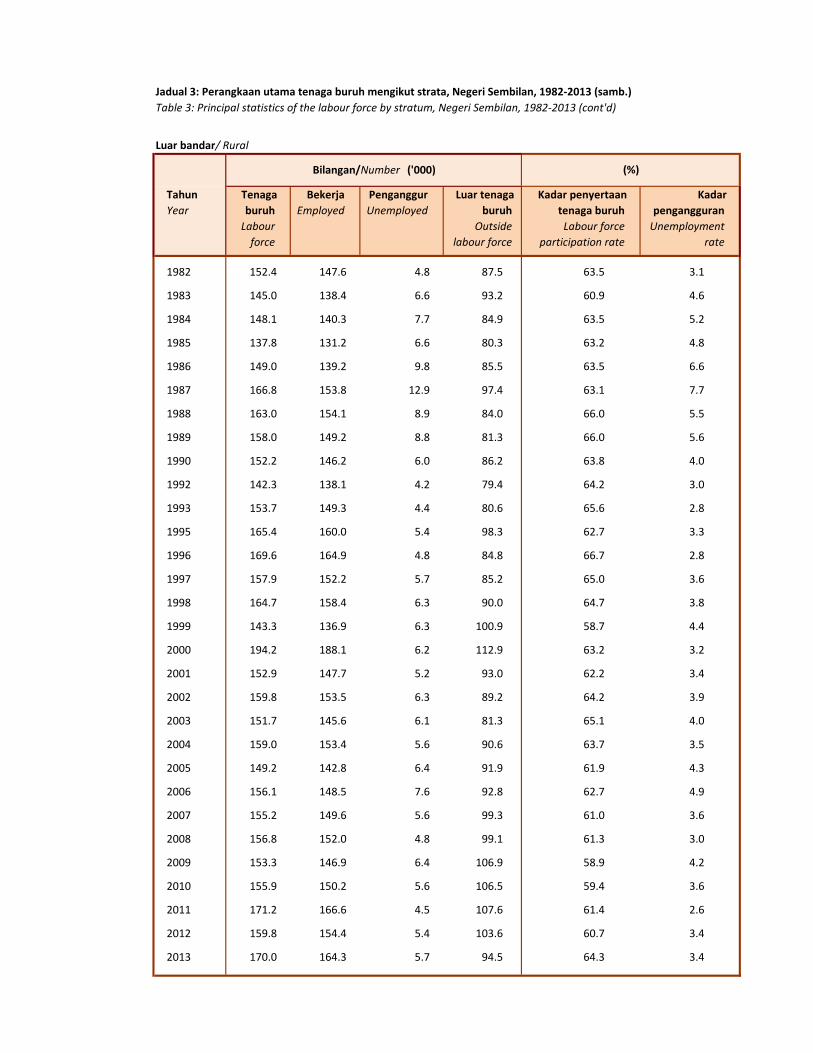
1982 152.4 147.6 4.8 87.5 63.5 3.1
1983 145.0 138.4 6.6 93.2 60.9 4.6
1984 148.1 140.3 7.7 84.9 63.5 5.2
1985 137.8 131.2 6.6 80.3 63.2 4.8
1986 149.0 139.2 9.8 85.5 63.5 6.6
1987 166.8 153.8 12.9 97.4 63.1 7.7
1988 163.0 154.1 8.9 84.0 66.0 5.5
1989 158.0 149.2 8.8 81.3 66.0 5.6
1990 152.2 146.2 6.0 86.2 63.8 4.0
1992 142.3 138.1 4.2 79.4 64.2 3.0
1993 153.7 149.3 4.4 80.6 65.6 2.8
1995 165.4 160.0 5.4 98.3 62.7 3.3
1996 169.6 164.9 4.8 84.8 66.7 2.8
1997 157.9 152.2 5.7 85.2 65.0 3.6
1998 164.7 158.4 6.3 90.0 64.7 3.8
1999 143.3 136.9 6.3 100.9 58.7 4.4
2000 194.2 188.1 6.2 112.9 63.2 3.2
2001 152.9 147.7 5.2 93.0 62.2 3.4
2002 159.8 153.5 6.3 89.2 64.2 3.9
2003 151.7 145.6 6.1 81.3 65.1 4.0
2004 159.0 153.4 5.6 90.6 63.7 3.5
2005 149.2 142.8 6.4 91.9 61.9 4.3
2006 156.1 148.5 7.6 92.8 62.7 4.9
2007 155.2 149.6 5.6 99.3 61.0 3.6
2008 156.8 152.0 4.8 99.1 61.3 3.0
2009 153.3 146.9 6.4 106.9 58.9 4.2
2010 155.9 150.2 5.6 106.5 59.4 3.6
2011 171.2 166.6 4.5 107.6 61.4 2.6
2012 159.8 154.4 5.4 103.6 60.7 3.4
2013 170.0 164.3 5.7 94.5 64.3 3.4
Jadual 3: Perangkaan utama tenaga buruh mengikut strata, Negeri Sembilan, 1982-2013 (samb.)
Table 3: Principal statistics of the labour force by stratum, Negeri Sembilan, 1982-2013 (cont'd)
Luar bandar/ Rural
Bilangan/Number ('000) (%)
Bandar/Urban
Tahun
Year
Tenaga
buruh
Labour
force
Bekerja
Employed
Penganggur
Unemployed
Luar tenaga
buruh
Outside
labour force
Kadar penyertaan
tenaga buruh
Labour force
participation rate
Kadar
pengangguran
Unemployment
rate
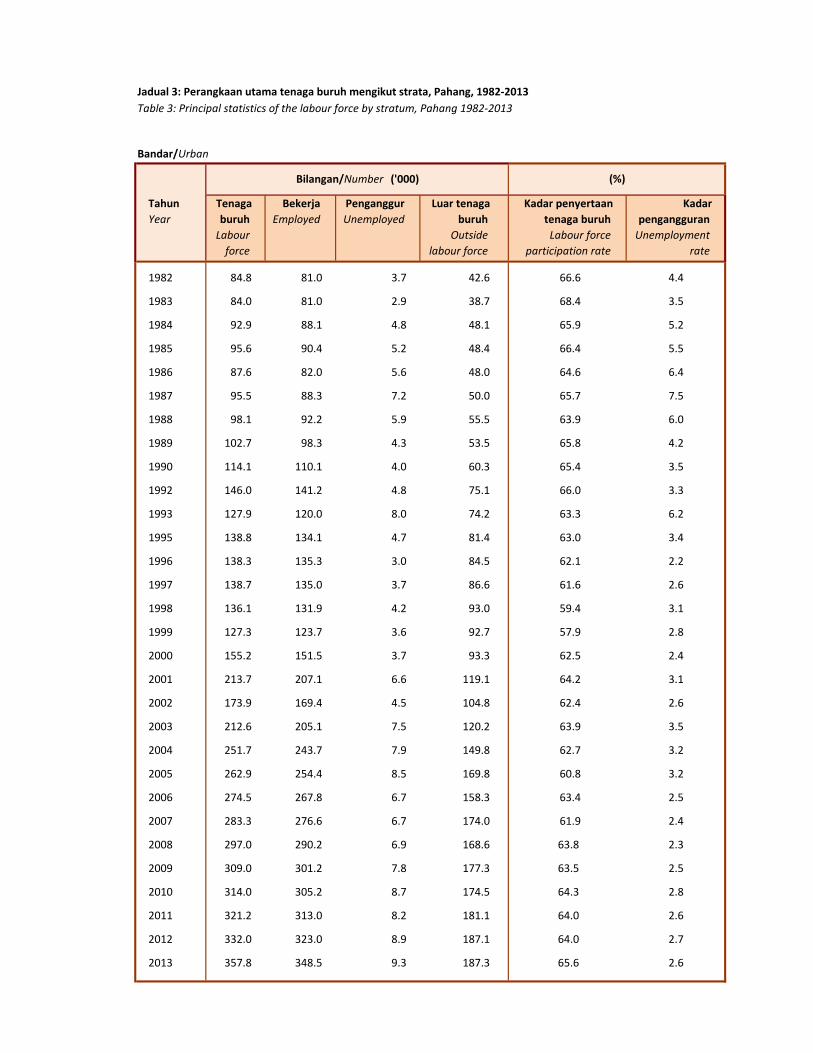
1982 84.8 81.0 3.7 42.6 66.6 4.4
1983 84.0 81.0 2.9 38.7 68.4 3.5
1984 92.9 88.1 4.8 48.1 65.9 5.2
1985 95.6 90.4 5.2 48.4 66.4 5.5
1986 87.6 82.0 5.6 48.0 64.6 6.4
1987 95.5 88.3 7.2 50.0 65.7 7.5
1988 98.1 92.2 5.9 55.5 63.9 6.0
1989 102.7 98.3 4.3 53.5 65.8 4.2
1990 114.1 110.1 4.0 60.3 65.4 3.5
1992 146.0 141.2 4.8 75.1 66.0 3.3
1993 127.9 120.0 8.0 74.2 63.3 6.2
1995 138.8 134.1 4.7 81.4 63.0 3.4
1996 138.3 135.3 3.0 84.5 62.1 2.2
1997 138.7 135.0 3.7 86.6 61.6 2.6
1998 136.1 131.9 4.2 93.0 59.4 3.1
1999 127.3 123.7 3.6 92.7 57.9 2.8
2000 155.2 151.5 3.7 93.3 62.5 2.4
2001 213.7 207.1 6.6 119.1 64.2 3.1
2002 173.9 169.4 4.5 104.8 62.4 2.6
2003 212.6 205.1 7.5 120.2 63.9 3.5
2004 251.7 243.7 7.9 149.8 62.7 3.2
2005 262.9 254.4 8.5 169.8 60.8 3.2
2006 274.5 267.8 6.7 158.3 63.4 2.5
2007 283.3 276.6 6.7 174.0 61.9 2.4
2008 297.0 290.2 6.9 168.6 63.8 2.3
2009 309.0 301.2 7.8 177.3 63.5 2.5
2010 314.0 305.2 8.7 174.5 64.3 2.8
2011 321.2 313.0 8.2 181.1 64.0 2.6
2012 332.0 323.0 8.9 187.1 64.0 2.7
2013 357.8 348.5 9.3 187.3 65.6 2.6
Jadual 3: Perangkaan utama tenaga buruh mengikut strata, Pahang, 1982-2013
Table 3: Principal statistics of the labour force by stratum, Pahang 1982-2013
Bilangan/Number ('000) (%)

Tahun
Year
Tenaga
buruh
Labour
force
Bekerja
Employed
Penganggur
Unemployed
Luar tenaga
buruh
Outside
labour force
Kadar penyertaan
tenaga buruh
Labour force
participation rate
Kadar
pengangguran
Unemployment
rate
1982 194.9 189.2 5.7 96.1 67.0 2.9
1983 258.6 252.5 6.2 127.6 67.0 2.4
1984 228.8 218.8 10.0 114.9 66.6 4.4
1985 247.1 237.5 9.6 118.1 67.7 3.9
1986 244.0 233.4 10.6 117.3 67.5 4.3
1987 258.5 247.5 11.0 122.8 67.8 4.3
1988 276.7 259.3 17.4 130.4 68.0 6.3
1989 291.2 280.8 10.4 157.1 65.0 3.6
1990 328.5 318.7 9.7 185.0 64.0 3.0
1992 282.9 275.8 7.1 160.4 63.8 2.5
1993 265.3 258.7 6.6 157.2 62.8 2.5
1995 246.2 237.3 9.0 165.5 59.8 3.6
1996 278.7 270.9 7.8 174.8 61.5 2.8
1997 268.9 260.4 8.5 177.2 60.3 3.2
1998 238.7 233.0 5.7 194.3 55.1 2.4
1999 268.9 260.7 8.1 188.0 58.9 3.0
2000 303.9 295.3 8.6 186.2 62.0 2.8
2001 237.9 230.6 7.3 147.0 61.8 3.1
2002 245.1 237.6 7.5 152.9 61.6 3.1
2003 264.5 254.9 9.6 160.1 62.3 3.6
2004 292.3 282.4 9.8 199.5 59.4 3.4
2005 279.9 270.3 9.5 198.0 58.6 3.4
2006 296.8 289.6 7.2 205.0 59.1 2.4
2007 296.9 285.3 11.5 202.8 59.4 3.9
2008 308.6 299.7 9.0 205.7 60.0 2.9
2009 313.2 302.4 10.8 200.5 61.0 3.4
2010 294.5 285.8 8.7 194.1 60.3 3.0
2011 300.2 292.2 8.0 195.2 60.6 2.7
2012 313.9 304.8 9.1 184.2 63.0 2.9
2013 312.9 302.7 10.2 176.1 64.0 3.2
Jadual 3: Perangkaan utama tenaga buruh mengikut strata, Pahang, 1982-2013 (samb.)
Table 3: Principal statistics of the labour force by stratum, Pahang, 1982-2013 (cont'd)
Luar bandar/Rural
Bilangan/Number ('000) (%)
Bandar/Urban
Tahun
Year
Tenaga
buruh
Labour
force
Bekerja
Employed
Penganggur
Unemployed
Luar tenaga
buruh
Outside
labour force
Kadar penyertaan
tenaga buruh
Labour force
participation rate
Kadar
pengangguran
Unemployment
rate
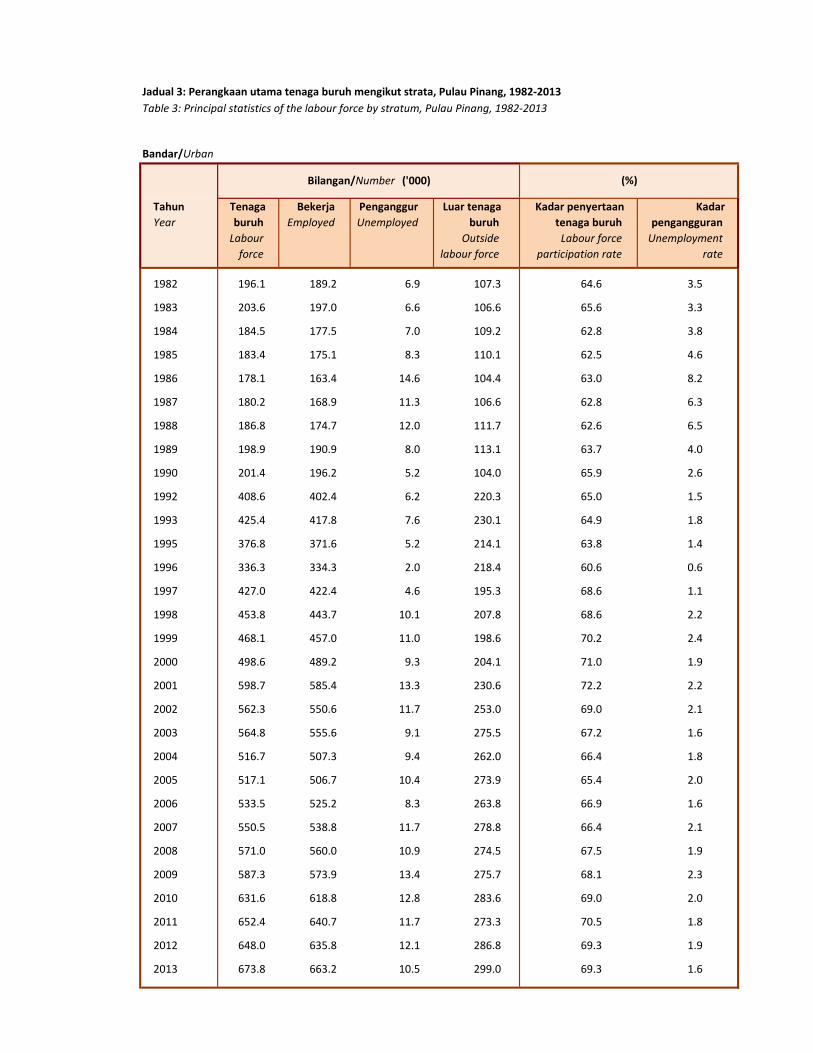
1982 196.1 189.2 6.9 107.3 64.6 3.5
1983 203.6 197.0 6.6 106.6 65.6 3.3
1984 184.5 177.5 7.0 109.2 62.8 3.8
1985 183.4 175.1 8.3 110.1 62.5 4.6
1986 178.1 163.4 14.6 104.4 63.0 8.2
1987 180.2 168.9 11.3 106.6 62.8 6.3
1988 186.8 174.7 12.0 111.7 62.6 6.5
1989 198.9 190.9 8.0 113.1 63.7 4.0
1990 201.4 196.2 5.2 104.0 65.9 2.6
1992 408.6 402.4 6.2 220.3 65.0 1.5
1993 425.4 417.8 7.6 230.1 64.9 1.8
1995 376.8 371.6 5.2 214.1 63.8 1.4
1996 336.3 334.3 2.0 218.4 60.6 0.6
1997 427.0 422.4 4.6 195.3 68.6 1.1
1998 453.8 443.7 10.1 207.8 68.6 2.2
1999 468.1 457.0 11.0 198.6 70.2 2.4
2000 498.6 489.2 9.3 204.1 71.0 1.9
2001 598.7 585.4 13.3 230.6 72.2 2.2
2002 562.3 550.6 11.7 253.0 69.0 2.1
2003 564.8 555.6 9.1 275.5 67.2 1.6
2004 516.7 507.3 9.4 262.0 66.4 1.8
2005 517.1 506.7 10.4 273.9 65.4 2.0
2006 533.5 525.2 8.3 263.8 66.9 1.6
2007 550.5 538.8 11.7 278.8 66.4 2.1
2008 571.0 560.0 10.9 274.5 67.5 1.9
2009 587.3 573.9 13.4 275.7 68.1 2.3
2010 631.6 618.8 12.8 283.6 69.0 2.0
2011 652.4 640.7 11.7 273.3 70.5 1.8
2012 648.0 635.8 12.1 286.8 69.3 1.9
2013 673.8 663.2 10.5 299.0 69.3 1.6
Jadual 3: Perangkaan utama tenaga buruh mengikut strata, Pulau Pinang, 1982-2013
Table 3: Principal statistics of the labour force by stratum, Pulau Pinang, 1982-2013
Bilangan/Number ('000) (%)
Tahun
Year
Tenaga
buruh
Labour
force
Bekerja
Employed
Penganggur
Unemployed
Luar tenaga
buruh
Outside
labour force
Kadar penyertaan
tenaga buruh
Labour force
participation rate
Kadar
pengangguran
Unemployment
rate
1982 199.8 193.1 6.7 115.2 63.4 3.4
1983 217.3 207.8 9.5 127.1 63.1 4.4
1984 213.3 206.2 7.1 136.6 61.0 3.3
1985 225.1 213.0 12.1 148.3 60.3 5.4
1986 249.2 228.0 21.1 150.9 62.3 8.5
1987 252.7 235.9 16.7 161.6 61.0 6.6
1988 241.0 224.2 16.8 148.9 61.8 7.0
1989 255.0 245.3 9.6 139.2 64.7 3.8
1990 268.9 261.0 7.9 135.9 66.4 2.9
1992 112.9 110.3 2.6 73.3 60.6 2.3
1993 117.8 113.2 4.6 62.5 65.3 3.9
1995 115.9 114.2 1.7 73.8 61.1 1.5
1996 116.2 115.1 1.0 75.9 60.5 0.9
1997 130.9 129.5 1.4 64.5 67.0 1.1
1998 145.5 141.5 4.0 70.9 67.2 2.7
1999 149.4 145.9 3.5 75.4 66.5 2.3
2000 183.7 180.0 3.7 76.8 70.5 2.0
2001 134.6 129.6 5.1 64.9 67.5 3.8
2002 95.0 92.5 2.4 50.0 65.5 2.6
2003 121.6 118.7 2.8 66.8 64.5 2.3
2004 120.0 117.7 2.4 64.9 64.9 2.0
2005 117.9 114.8 3.1 71.3 62.3 2.6
2006 125.4 122.5 2.9 75.6 62.4 2.3
2007 117.0 114.7 2.4 69.8 62.6 2.0
2008 117.4 114.9 2.5 68.7 63.1 2.1
2009 119.8 115.9 4.0 68.6 63.6 3.3
2010 127.4 123.5 3.9 68.7 65.0 3.0
2011 129.1 126.4 2.7 73.2 63.8 2.1
2012 138.2 134.6 3.6 69.8 66.4 2.6
2013 124.0 121.0 2.9 58.5 67.9 2.4
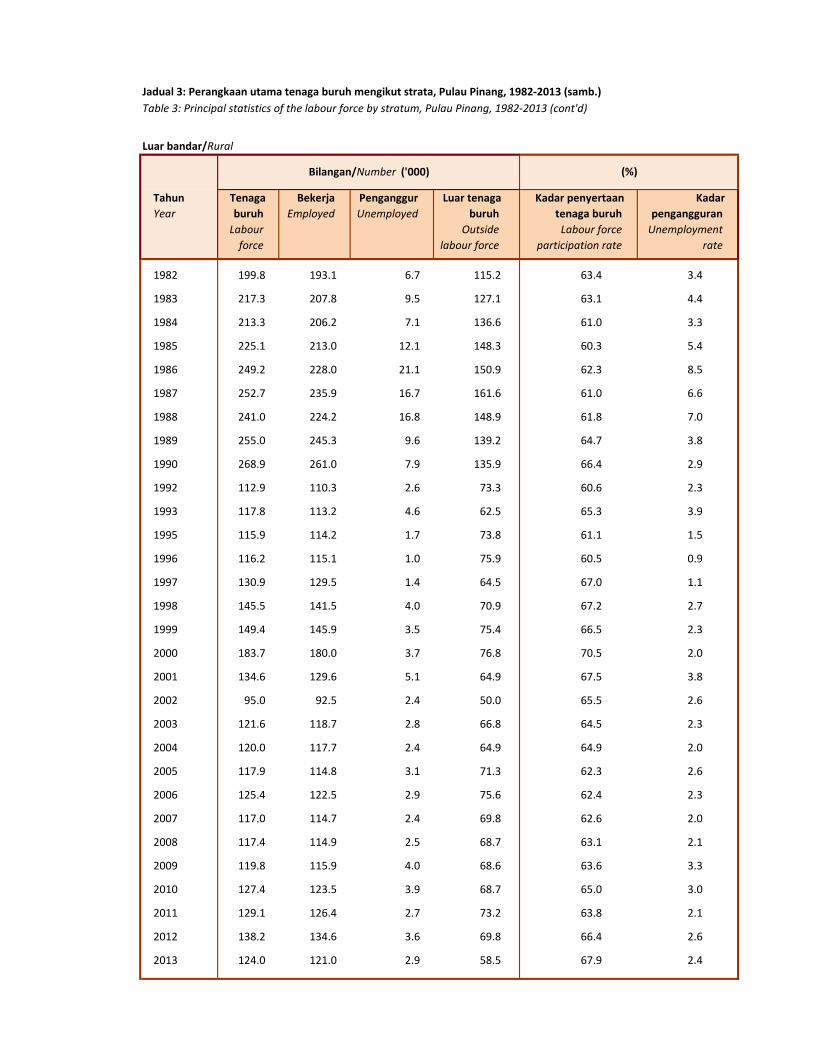
Jadual 3: Perangkaan utama tenaga buruh mengikut strata, Pulau Pinang, 1982-2013 (samb.)
Table 3: Principal statistics of the labour force by stratum, Pulau Pinang, 1982-2013 (cont'd)
Luar bandar/Rural
Bilangan/Number ('000) (%)
Bandar/Urban
Tahun
Year
Tenaga
buruh
Labour
force
Bekerja
Employed
Penganggur
Unemployed
Luar tenaga
buruh
Outside
labour force
Kadar penyertaan
tenaga buruh
Labour force
participation rate
Kadar
pengangguran
Unemployment
rate
1982 222.5 212.0 10.5 125.3 64.0 4.7
1983 258.9 247.3 11.6 125.9 67.3 4.5
1984 247.6 234.7 12.9 139.8 63.9 5.2
1985 259.6 242.4 17.2 136.1 65.6 6.6
1986 250.0 227.3 22.6 128.9 66.0 9.1
1987 257.2 235.8 21.4 132.8 66.0 8.3
1988 252.6 232.3 20.3 136.8 64.9 8.0
1989 246.6 232.8 13.9 142.2 63.4 5.6
1990 230.8 222.6 8.2 130.0 64.0 3.6
1992 411.6 397.8 13.8 262.2 61.1 3.4
1993 384.1 369.6 14.6 246.3 60.9 3.8
1995 367.2 354.1 13.1 267.3 57.9 3.6
1996 434.3 422.6 11.8 251.9 63.3 2.7
1997 422.4 414.5 7.9 274.7 60.6 1.9
1998 391.6 376.3 15.3 256.0 60.5 3.9
1999 397.4 380.3 17.1 271.0 59.5 4.3
2000 432.2 418.3 13.8 265.1 62.0 3.2
2001 484.7 467.5 17.1 317.2 60.4 3.5
2002 530.7 509.7 21.1 371.2 58.8 4.0
2003 484.5 464.5 20.0 324.5 59.9 4.1
2004 510.2 495.4 14.8 340.9 59.9 2.9
2005 531.5 516.3 15.2 351.2 60.2 2.9
2006 525.6 510.0 15.5 372.9 58.5 3.0
2007 572.5 555.8 16.7 368.5 60.8 2.9
2008 563.7 542.5 21.1 368.5 60.5 3.7
2009 589.9 568.4 21.5 366.0 61.7 3.6
2010 568.1 550.8 17.3 396.1 58.9 3.0
2011 594.4 579.9 14.6 393.0 60.2 2.5
2012 608.7 590.3 18.4 414.8 59.5 3.0
2013 650.4 622.5 27.9 418.0 60.9 4.3
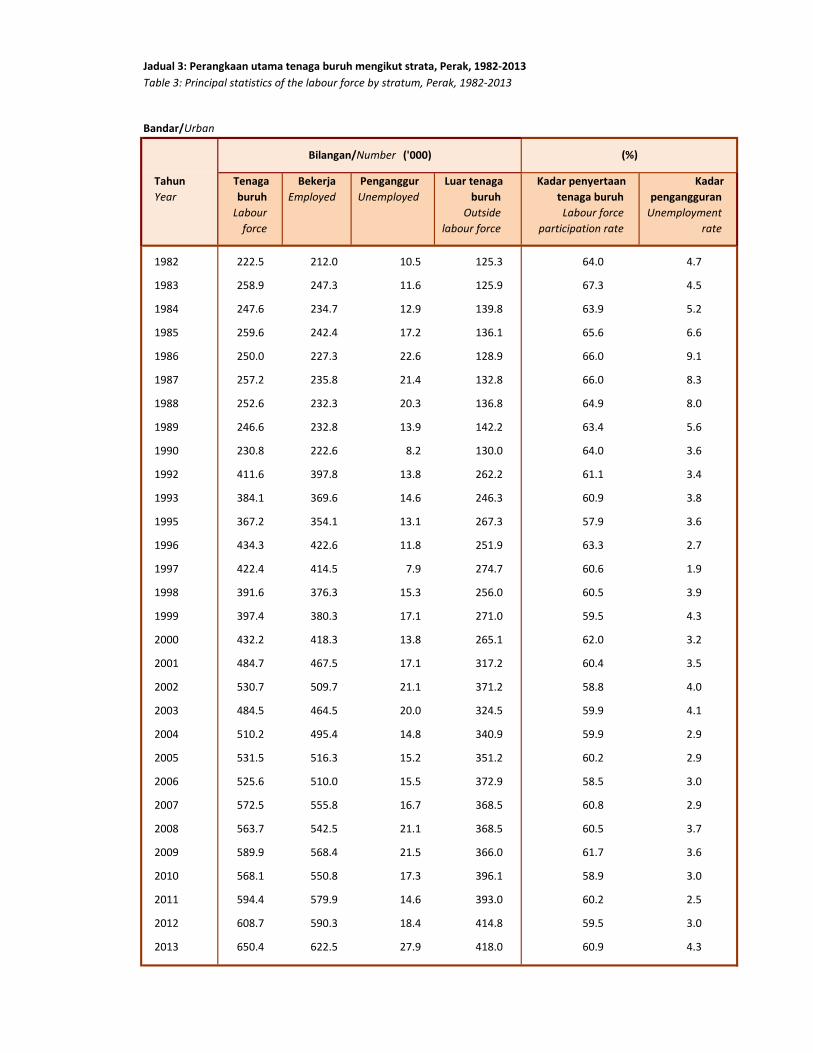
Jadual 3: Perangkaan utama tenaga buruh mengikut strata, Perak, 1982-2013
Table 3: Principal statistics of the labour force by stratum, Perak, 1982-2013
Bilangan/Number ('000) (%)

Tahun
Year
Tenaga
buruh
Labour
force
Bekerja
Employed
Penganggur
Unemployed
Luar tenaga
buruh
Outside
labour force
Kadar penyertaan
tenaga buruh
Labour force
participation rate
Kadar
pengangguran
Unemployment
rate
1982 416.1 392.0 24.1 234.8 63.9 5.8
1983 446.0 421.9 24.1 233.9 65.6 5.4
1984 449.7 424.9 24.8 237.3 65.5 5.5
1985 453.5 427.2 26.3 254.8 64.0 5.8
1986 484.2 442.6 41.6 261.9 64.9 8.6
1987 471.6 434.7 36.9 250.2 65.3 7.8
1988 462.4 424.5 37.9 262.4 63.8 8.2
1989 479.9 454.0 25.9 282.9 62.9 5.4
1990 476.0 455.6 20.4 273.6 63.5 4.3
1992 308.0 295.1 12.9 177.4 63.5 4.2
1993 315.4 300.2 15.2 186.6 62.8 4.8
1995 292.8 280.2 12.6 206.8 58.6 4.3
1996 312.5 300.5 12.1 191.5 62.0 3.9
1997 338.1 329.7 8.5 216.1 61.0 2.5
1998 321.1 308.6 12.5 207.0 60.8 3.9
1999 317.9 304.2 13.7 210.4 60.2 4.3
2000 339.1 325.7 13.4 216.8 61.0 3.9
2001 276.6 263.1 13.5 196.3 58.5 4.9
2002 289.9 278.6 11.2 205.9 58.5 3.9
2003 286.9 270.1 16.7 200.3 58.9 5.8
2004 308.2 295.6 12.5 213.1 59.1 4.1
2005 297.3 284.9 12.3 222.7 57.2 4.2
2006 319.9 305.8 14.1 210.3 60.3 4.4
2007 305.3 296.4 8.9 210.5 59.2 2.9
2008 328.9 316.4 12.5 220.4 59.9 3.8
2009 333.8 323.1 10.7 217.4 60.6 3.2
2010 337.9 327.9 10.0 246.1 57.9 3.0
2011 348.8 338.4 10.4 237.2 59.5 3.0
2012 344.0 334.0 10.0 231.8 59.7 2.9
2013 325.8 315.8 10.0 226.0 59.0 3.1
Jadual 3: Perangkaan utama tenaga buruh mengikut strata, Perak, 1982-2013 (samb.)
Table 3: Principal statistics of the labour force by stratum, Perak, 1982-2013 (cont'd)
Luar bandar/Rural
Bilangan/Number ('000) (%)
Bandar/Urban
Tahun
Year
Tenaga
buruh
Labour
force
Bekerja
Employed
Penganggur
Unemployed
Luar tenaga
buruh
Outside
labour force
Kadar penyertaan
tenaga buruh
Labour force
participation rate
Kadar
pengangguran
Unemployment
rate
1982 6.5 6.1 0.4 3.3 66.4 6.5
1983 13.7 13.0 0.6 8.2 62.5 4.6
1984 4.9 4.7 0.2 3.3 59.9 5.0
1985 6.7 6.6 0.2 3.0 69.3 2.7
1986 5.4 5.1 0.3 3.3 61.9 5.4
1987 6.5 6.1 0.4 3.8 63.1 6.0
1988 7.2 7.0 0.2 3.7 65.9 2.8
1989 6.1 5.8 0.3 3.3 65.0 5.1
1990 5.1 4.9 0.1 2.1 70.5 2.6
1992 19.4 19.2 0.2 10.7 64.4 0.9
1993 17.9 17.9 - 14.7 55.0 -
1995 18.2 18.1 0.1 12.9 58.6 0.8
1996 18.1 17.8 0.4 12.7 58.8 2.0
1997 20.7 20.4 0.3 12.1 63.1 1.4
1998 22.4 21.1 1.3 15.2 59.6 5.7
1999 23.0 22.1 0.9 14.6 61.2 3.8
2000 21.5 20.6 0.9 13.0 62.4 4.2
2001 26.5 25.6 0.8 18.3 59.2 3.1
2002 20.7 20.1 0.6 13.2 61.0 2.8
2003 27.9 26.8 1.1 19.3 59.1 3.8
2004 29.3 28.4 0.9 20.5 58.8 3.2
2005 29.5 28.8 0.7 21.8 57.5 2.4
2006 28.3 27.5 0.7 23.3 54.8 2.6
2007 30.9 30.1 0.8 22.5 57.9 2.6
2008 32.9 31.9 1.0 22.4 59.5 3.0
2009 33.3 32.2 1.0 24.6 57.5 3.1
2010 32.3 31.3 1.0 27.7 53.9 3.0
2011 33.9 32.7 1.2 27.3 55.4 3.5
2012 35.7 34.4 1.3 28.4 55.7 3.7
2013 39.7 38.3 1.4 25.9 60.5 3.5
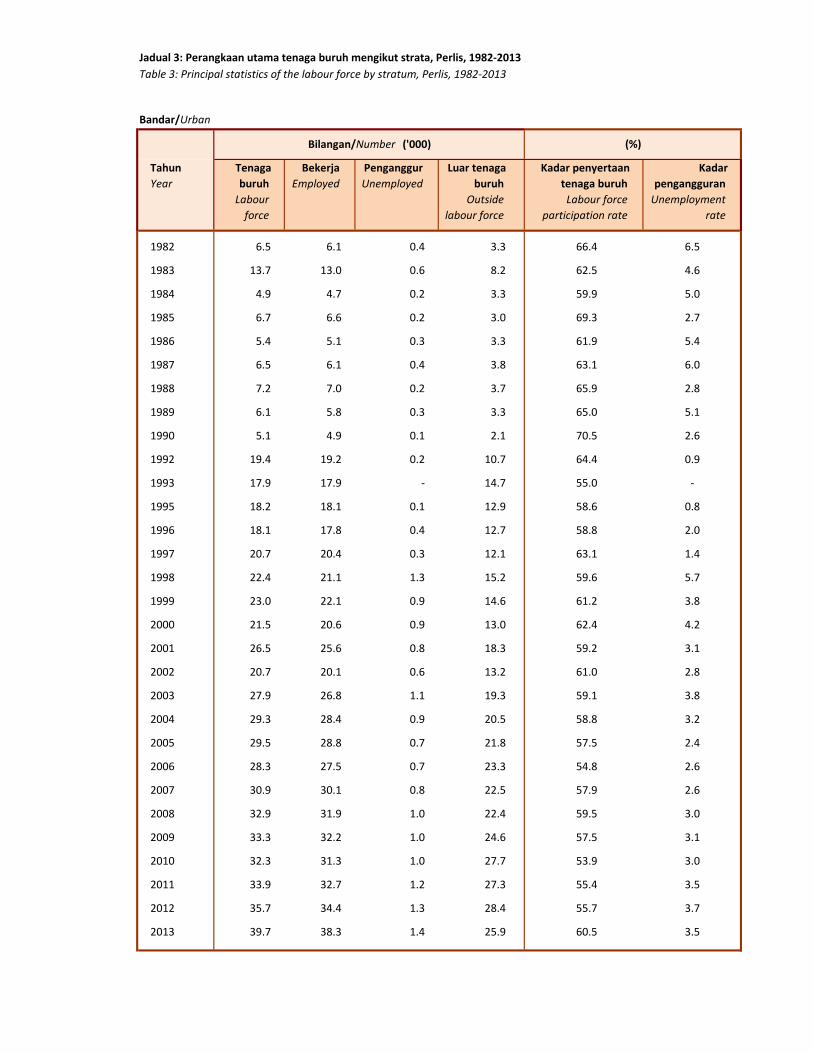
Jadual 3: Perangkaan utama tenaga buruh mengikut strata, Perlis, 1982-2013
Table 3: Principal statistics of the labour force by stratum, Perlis, 1982-2013
Bilangan/Number ('000) (%)
Tahun
Year
Tenaga
buruh
Labour
force
Bekerja
Employed
Penganggur
Unemployed
Luar tenaga
buruh
Outside
labour force
Kadar penyertaan
tenaga buruh
Labour force
participation rate
Kadar
pengangguran
Unemployment
rate
1982 51.6 49.6 2.0 34.5 59.9 3.8
1983 52.3 50.8 1.5 37.5 58.2 2.9
1984 59.9 57.1 2.7 36.8 62.0 4.5
1985 58.7 54.0 4.8 30.8 65.6 8.1
1986 57.2 52.4 4.7 34.0 62.7 8.3
1987 58.4 54.5 3.9 37.4 60.9 6.7
1988 63.7 58.5 5.2 46.2 58.0 8.1
1989 64.8 60.6 4.2 42.8 60.2 6.5
1990 54.6 52.2 2.4 40.1 57.6 4.4
1992 49.4 47.7 1.7 32.8 60.1 3.4
1993 53.8 52.8 1.0 35.5 60.2 1.9
1995 53.6 52.7 0.9 37.3 59.0 1.6
1996 53.4 52.3 1.1 34.7 60.6 2.0
1997 51.1 49.7 1.4 36.3 58.4 2.7
1998 51.8 49.9 1.9 38.5 57.3 3.7
1999 58.2 56.4 1.9 39.9 59.3 3.2
2000 55.5 54.2 1.3 36.6 60.2 2.4
2001 59.4 57.2 2.2 41.9 58.7 3.7
2002 38.1 36.8 1.2 29.4 56.4 3.3
2003 52.2 49.7 2.4 36.6 58.8 4.7
2004 47.0 45.4 1.6 36.3 56.4 3.4
2005 46.8 45.3 1.5 37.8 55.3 3.2
2006 48.7 47.0 1.7 38.6 55.7 3.5
2007 51.6 49.9 1.7 36.9 58.3 3.3
2008 51.1 49.6 1.5 38.4 57.1 2.9
2009 51.0 49.3 1.8 38.4 57.1 3.5
2010 51.3 49.6 1.8 44.9 53.3 3.5
2011 52.9 50.7 2.3 44.8 54.2 4.3
2012 54.8 52.6 2.2 41.7 56.8 4.1
2013 58.0 55.8 2.3 38.5 60.1 3.9
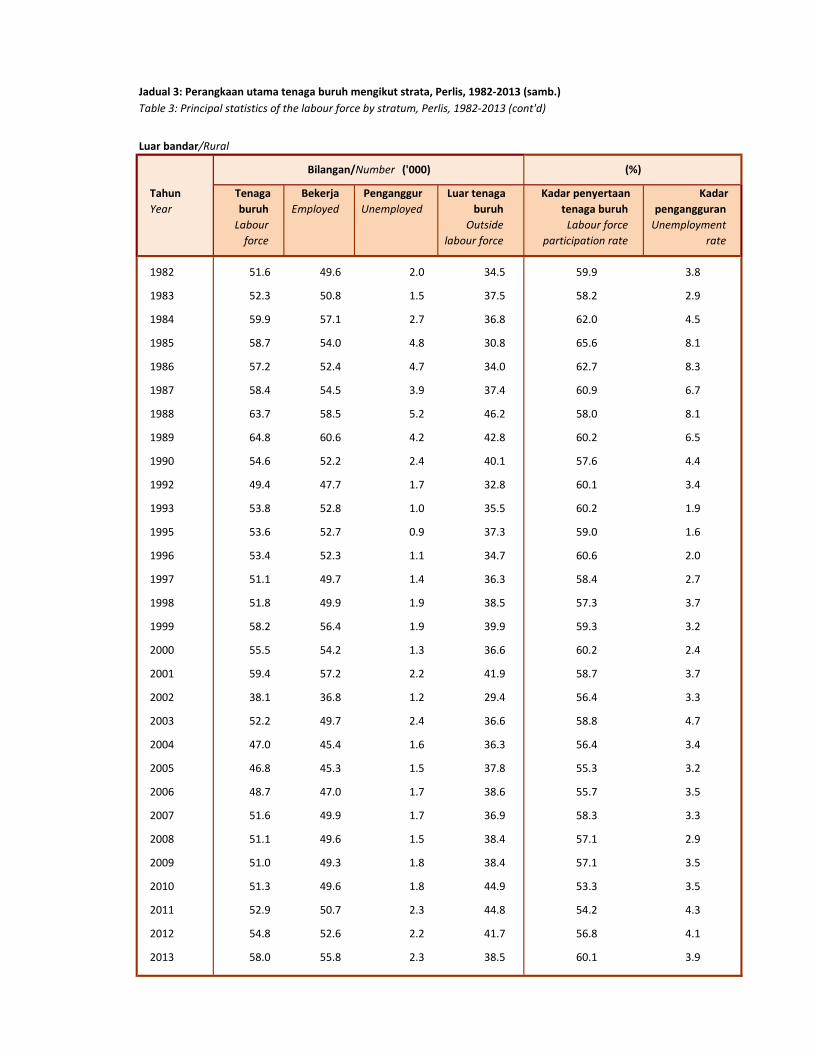
Jadual 3: Perangkaan utama tenaga buruh mengikut strata, Perlis, 1982-2013 (samb.)
Table 3: Principal statistics of the labour force by stratum, Perlis, 1982-2013 (cont'd)
Luar bandar/Rural
Bilangan/Number ('000) (%)
Bandar/Urban
Tahun
Year
Tenaga
buruh
Labour
force
Bekerja
Employed
Penganggur
Unemployed
Luar tenaga
buruh
Outside
labour force
Kadar penyertaan
tenaga buruh
Labour force
participation rate
Kadar
pengangguran
Unemployment
rate
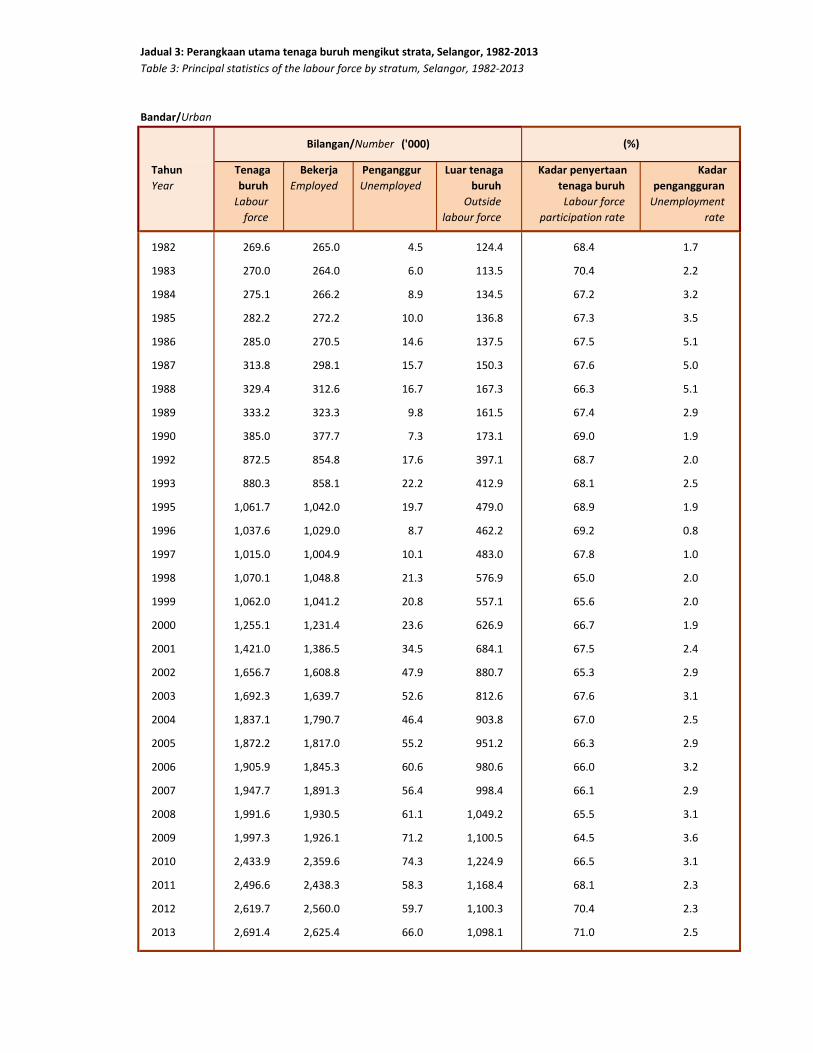
1982 269.6 265.0 4.5 124.4 68.4 1.7
1983 270.0 264.0 6.0 113.5 70.4 2.2
1984 275.1 266.2 8.9 134.5 67.2 3.2
1985 282.2 272.2 10.0 136.8 67.3 3.5
1986 285.0 270.5 14.6 137.5 67.5 5.1
1987 313.8 298.1 15.7 150.3 67.6 5.0
1988 329.4 312.6 16.7 167.3 66.3 5.1
1989 333.2 323.3 9.8 161.5 67.4 2.9
1990 385.0 377.7 7.3 173.1 69.0 1.9
1992 872.5 854.8 17.6 397.1 68.7 2.0
1993 880.3 858.1 22.2 412.9 68.1 2.5
1995 1,061.7 1,042.0 19.7 479.0 68.9 1.9
1996 1,037.6 1,029.0 8.7 462.2 69.2 0.8
1997 1,015.0 1,004.9 10.1 483.0 67.8 1.0
1998 1,070.1 1,048.8 21.3 576.9 65.0 2.0
1999 1,062.0 1,041.2 20.8 557.1 65.6 2.0
2000 1,255.1 1,231.4 23.6 626.9 66.7 1.9
2001 1,421.0 1,386.5 34.5 684.1 67.5 2.4
2002 1,656.7 1,608.8 47.9 880.7 65.3 2.9
2003 1,692.3 1,639.7 52.6 812.6 67.6 3.1
2004 1,837.1 1,790.7 46.4 903.8 67.0 2.5
2005 1,872.2 1,817.0 55.2 951.2 66.3 2.9
2006 1,905.9 1,845.3 60.6 980.6 66.0 3.2
2007 1,947.7 1,891.3 56.4 998.4 66.1 2.9
2008 1,991.6 1,930.5 61.1 1,049.2 65.5 3.1
2009 1,997.3 1,926.1 71.2 1,100.5 64.5 3.6
2010 2,433.9 2,359.6 74.3 1,224.9 66.5 3.1
2011 2,496.6 2,438.3 58.3 1,168.4 68.1 2.3
2012 2,619.7 2,560.0 59.7 1,100.3 70.4 2.3
2013 2,691.4 2,625.4 66.0 1,098.1 71.0 2.5
Jadual 3: Perangkaan utama tenaga buruh mengikut strata, Selangor, 1982-2013
Table 3: Principal statistics of the labour force by stratum, Selangor, 1982-2013
Bilangan/Number ('000) (%)
Tahun
Year
Tenaga
buruh
Labour
force
Bekerja
Employed
Penganggur
Unemployed
Luar tenaga
buruh
Outside
labour force
Kadar penyertaan
tenaga buruh
Labour force
participation rate
Kadar
pengangguran
Unemployment
rate
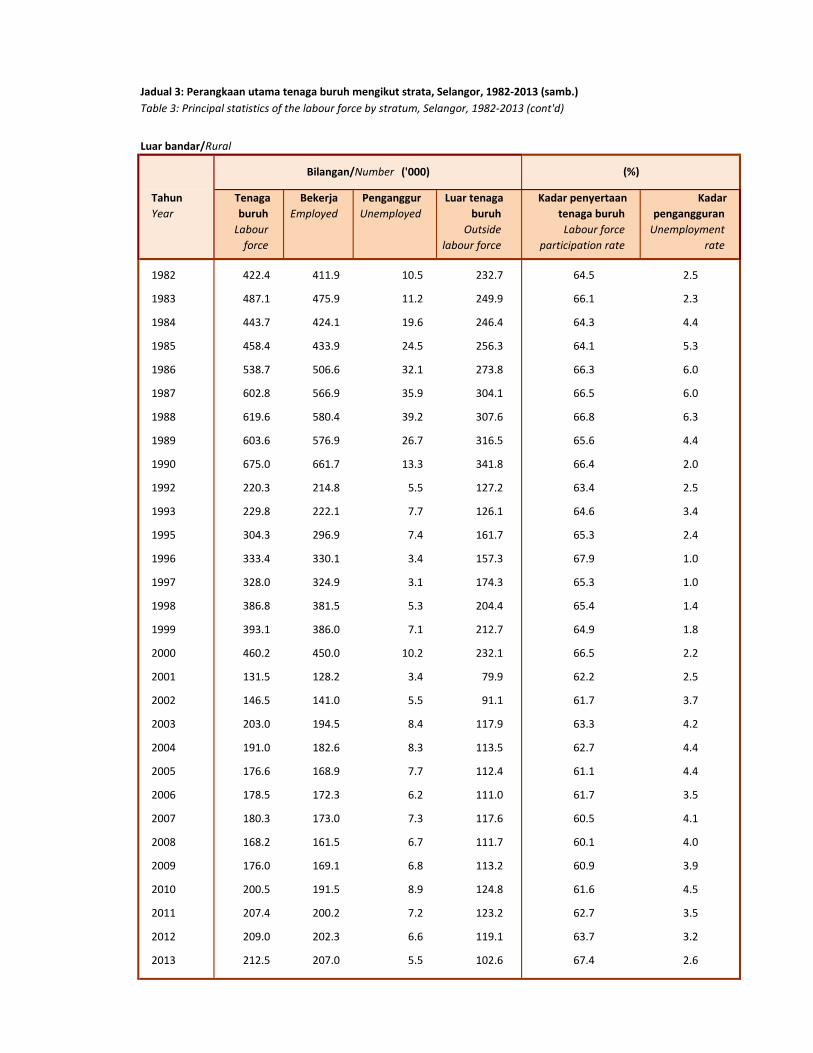
1982 422.4 411.9 10.5 232.7 64.5 2.5
1983 487.1 475.9 11.2 249.9 66.1 2.3
1984 443.7 424.1 19.6 246.4 64.3 4.4
1985 458.4 433.9 24.5 256.3 64.1 5.3
1986 538.7 506.6 32.1 273.8 66.3 6.0
1987 602.8 566.9 35.9 304.1 66.5 6.0
1988 619.6 580.4 39.2 307.6 66.8 6.3
1989 603.6 576.9 26.7 316.5 65.6 4.4
1990 675.0 661.7 13.3 341.8 66.4 2.0
1992 220.3 214.8 5.5 127.2 63.4 2.5
1993 229.8 222.1 7.7 126.1 64.6 3.4
1995 304.3 296.9 7.4 161.7 65.3 2.4
1996 333.4 330.1 3.4 157.3 67.9 1.0
1997 328.0 324.9 3.1 174.3 65.3 1.0
1998 386.8 381.5 5.3 204.4 65.4 1.4
1999 393.1 386.0 7.1 212.7 64.9 1.8
2000 460.2 450.0 10.2 232.1 66.5 2.2
2001 131.5 128.2 3.4 79.9 62.2 2.5
2002 146.5 141.0 5.5 91.1 61.7 3.7
2003 203.0 194.5 8.4 117.9 63.3 4.2
2004 191.0 182.6 8.3 113.5 62.7 4.4
2005 176.6 168.9 7.7 112.4 61.1 4.4
2006 178.5 172.3 6.2 111.0 61.7 3.5
2007 180.3 173.0 7.3 117.6 60.5 4.1
2008 168.2 161.5 6.7 111.7 60.1 4.0
2009 176.0 169.1 6.8 113.2 60.9 3.9
2010 200.5 191.5 8.9 124.8 61.6 4.5
2011 207.4 200.2 7.2 123.2 62.7 3.5
2012 209.0 202.3 6.6 119.1 63.7 3.2
2013 212.5 207.0 5.5 102.6 67.4 2.6
Jadual 3: Perangkaan utama tenaga buruh mengikut strata, Selangor, 1982-2013 (samb.)
Table 3: Principal statistics of the labour force by stratum, Selangor, 1982-2013 (cont'd)
Luar bandar/Rural
Bilangan/Number ('000) (%)

Bandar/Urban
Tahun
Year
Tenaga
buruh
Labour
force
Bekerja
Employed
Penganggur
Unemployed
Luar tenaga
buruh
Outside
labour force
Kadar penyertaan
tenaga buruh
Labour force
participation rate
Kadar
pengangguran
Unemployment
rate
1982 92.6 89.5 3.1 59.3 61.0 3.4
1983 83.8 81.1 2.7 53.2 61.2 3.3
1984 92.6 85.3 7.3 56.5 62.1 7.9
1985 96.5 88.4 8.1 57.3 62.7 8.4
1986 94.7 84.3 10.4 55.4 63.1 11.0
1987 94.4 80.9 13.5 54.8 63.3 14.3
1988 105.6 94.1 11.5 53.2 66.5 10.9
1989 101.4 88.2 13.2 55.8 64.5 13.0
1990 104.0 95.2 8.9 56.5 64.8 8.5
1992 120.2 113.0 7.2 70.1 63.2 6.0
1993 134.3 123.4 10.8 77.7 63.3 8.1
1995 133.0 124.9 8.1 82.8 61.6 6.1
1996 135.5 131.0 4.5 75.7 64.1 3.3
1997 133.8 128.3 5.5 86.3 60.8 4.1
1998 130.9 124.7 6.2 80.4 62.0 4.8
1999 134.7 128.8 6.0 89.4 60.1 4.4
2000 145.1 140.0 5.1 89.1 61.9 3.5
2001 159.9 155.7 4.2 101.1 61.3 2.6
2002 138.5 134.2 4.3 88.0 61.2 3.1
2003 178.0 172.3 5.7 116.1 60.5 3.2
2004 174.8 169.0 5.8 123.5 58.6 3.3
2005 182.7 177.3 5.4 133.3 57.8 2.9
2006 191.8 184.8 7.0 140.9 57.6 3.6
2007 195.7 190.6 5.1 139.8 58.3 2.6
2008 207.7 200.7 7.0 147.7 58.4 3.4
2009 213.4 205.7 7.7 148.3 59.0 3.6
2010 195.7 187.6 8.1 147.1 57.1 4.1
2011 212.1 204.5 7.6 146.3 59.2 3.6
2012 216.2 209.6 6.6 154.6 58.3 3.1
2013 227.8 219.7 8.1 148.4 60.6 3.6
Jadual 3: Perangkaan utama tenaga buruh mengikut strata, Terengganu, 1982-2013
Table 3: Principal statistics of the labour force by stratum, Terengganu 1982-2013
Bilangan/Number ('000) (%)
Tahun
Year
Tenaga
buruh
Labour
force
Bekerja
Employed
Penganggur
Unemployed
Luar tenaga
buruh
Outside
labour force
Kadar penyertaan
tenaga buruh
Labour force
participation rate
Kadar
pengangguran
Unemployment
rate
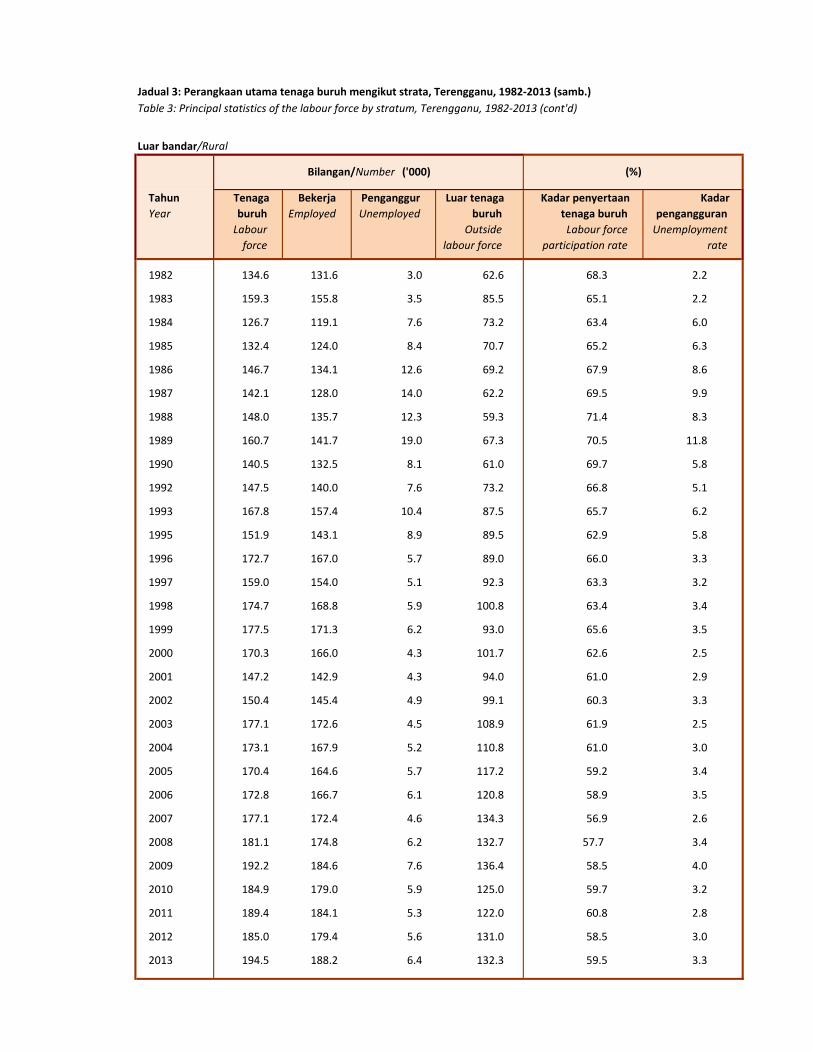
1982 134.6 131.6 3.0 62.6 68.3 2.2
1983 159.3 155.8 3.5 85.5 65.1 2.2
1984 126.7 119.1 7.6 73.2 63.4 6.0
1985 132.4 124.0 8.4 70.7 65.2 6.3
1986 146.7 134.1 12.6 69.2 67.9 8.6
1987 142.1 128.0 14.0 62.2 69.5 9.9
1988 148.0 135.7 12.3 59.3 71.4 8.3
1989 160.7 141.7 19.0 67.3 70.5 11.8
1990 140.5 132.5 8.1 61.0 69.7 5.8
1992 147.5 140.0 7.6 73.2 66.8 5.1
1993 167.8 157.4 10.4 87.5 65.7 6.2
1995 151.9 143.1 8.9 89.5 62.9 5.8
1996 172.7 167.0 5.7 89.0 66.0 3.3
1997 159.0 154.0 5.1 92.3 63.3 3.2
1998 174.7 168.8 5.9 100.8 63.4 3.4
1999 177.5 171.3 6.2 93.0 65.6 3.5
2000 170.3 166.0 4.3 101.7 62.6 2.5
2001 147.2 142.9 4.3 94.0 61.0 2.9
2002 150.4 145.4 4.9 99.1 60.3 3.3
2003 177.1 172.6 4.5 108.9 61.9 2.5
2004 173.1 167.9 5.2 110.8 61.0 3.0
2005 170.4 164.6 5.7 117.2 59.2 3.4
2006 172.8 166.7 6.1 120.8 58.9 3.5
2007 177.1 172.4 4.6 134.3 56.9 2.6
2008 181.1 174.8 6.2 132.7 57.7 3.4
2009 192.2 184.6 7.6 136.4 58.5 4.0
2010 184.9 179.0 5.9 125.0 59.7 3.2
2011 189.4 184.1 5.3 122.0 60.8 2.8
2012 185.0 179.4 5.6 131.0 58.5 3.0
2013 194.5 188.2 6.4 132.3 59.5 3.3
Jadual 3: Perangkaan utama tenaga buruh mengikut strata, Terengganu, 1982-2013 (samb.)
Table 3: Principal statistics of the labour force by stratum, Terengganu, 1982-2013 (cont'd)
Luar bandar/Rural
Bilangan/Number ('000) (%)
Bandar/Urban
Tahun
Year
Tenaga
buruh
Labour
force
Bekerja
Employed
Penganggur
Unemployed
Luar tenaga
buruh
Outside
labour force
Kadar penyertaan
tenaga buruh
Labour force
participation rate
Kadar
pengangguran
Unemployment
rate
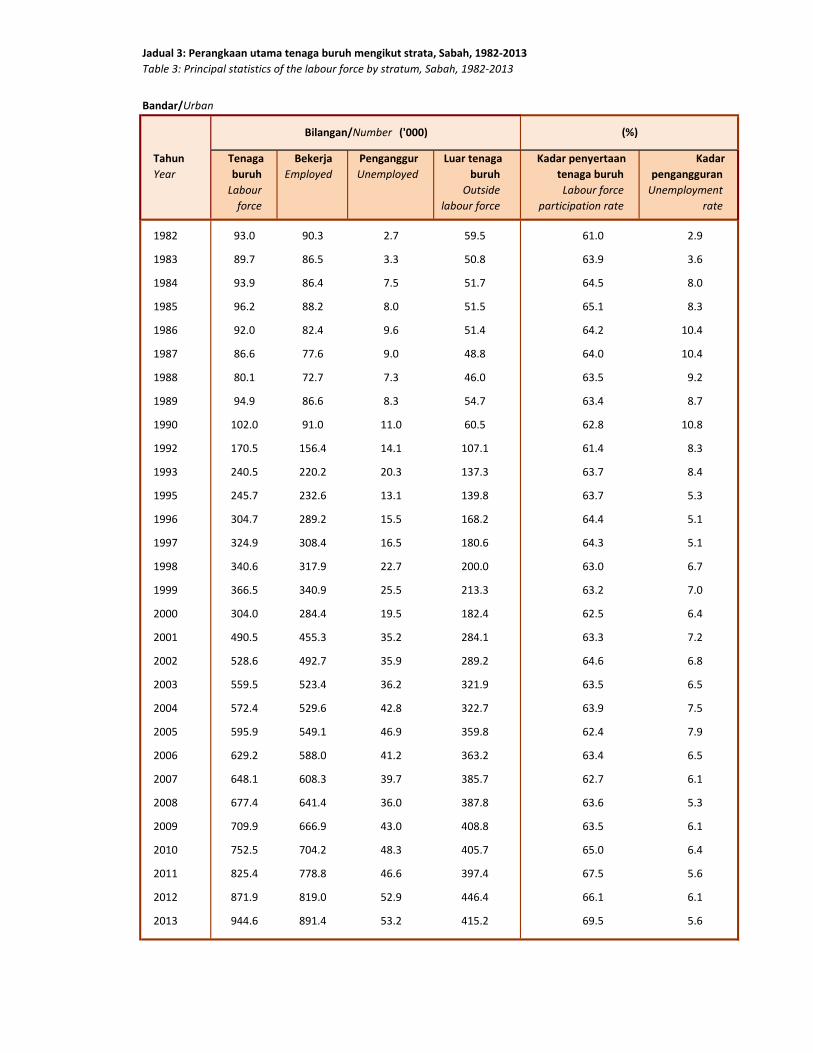
1982 93.0 90.3 2.7 59.5 61.0 2.9
1983 89.7 86.5 3.3 50.8 63.9 3.6
1984 93.9 86.4 7.5 51.7 64.5 8.0
1985 96.2 88.2 8.0 51.5 65.1 8.3
1986 92.0 82.4 9.6 51.4 64.2 10.4
1987 86.6 77.6 9.0 48.8 64.0 10.4
1988 80.1 72.7 7.3 46.0 63.5 9.2
1989 94.9 86.6 8.3 54.7 63.4 8.7
1990 102.0 91.0 11.0 60.5 62.8 10.8
1992 170.5 156.4 14.1 107.1 61.4 8.3
1993 240.5 220.2 20.3 137.3 63.7 8.4
1995 245.7 232.6 13.1 139.8 63.7 5.3
1996 304.7 289.2 15.5 168.2 64.4 5.1
1997 324.9 308.4 16.5 180.6 64.3 5.1
1998 340.6 317.9 22.7 200.0 63.0 6.7
1999 366.5 340.9 25.5 213.3 63.2 7.0
2000 304.0 284.4 19.5 182.4 62.5 6.4
2001 490.5 455.3 35.2 284.1 63.3 7.2
2002 528.6 492.7 35.9 289.2 64.6 6.8
2003 559.5 523.4 36.2 321.9 63.5 6.5
2004 572.4 529.6 42.8 322.7 63.9 7.5
2005 595.9 549.1 46.9 359.8 62.4 7.9
2006 629.2 588.0 41.2 363.2 63.4 6.5
2007 648.1 608.3 39.7 385.7 62.7 6.1
2008 677.4 641.4 36.0 387.8 63.6 5.3
2009 709.9 666.9 43.0 408.8 63.5 6.1
2010 752.5 704.2 48.3 405.7 65.0 6.4
2011 825.4 778.8 46.6 397.4 67.5 5.6
2012 871.9 819.0 52.9 446.4 66.1 6.1
2013 944.6 891.4 53.2 415.2 69.5 5.6
Jadual 3: Perangkaan utama tenaga buruh mengikut strata, Sabah, 1982-2013
Table 3: Principal statistics of the labour force by stratum, Sabah, 1982-2013
Bilangan/Number ('000) (%)
Tahun
Year
Tenaga
buruh
Labour
force
Bekerja
Employed
Penganggur
Unemployed
Luar tenaga
buruh
Outside
labour force
Kadar penyertaan
tenaga buruh
Labour force
participation rate
Kadar
pengangguran
Unemployment
rate
1982 261.2 253.2 8.0 177.9 59.5 3.1
1983 304.1 291.2 12.9 173.8 63.6 4.2
1984 332.1 314.0 18.1 142.7 69.9 5.5
1985 334.8 315.2 19.7 148.0 69.4 5.9
1986 349.5 323.1 26.5 163.0 68.2 7.6
1987 379.9 346.7 33.2 166.2 69.6 8.7
1988 382.5 351.9 30.6 195.8 66.1 8.0
1989 382.6 355.7 26.9 194.8 66.3 7.0
1990 377.9 345.9 32.0 210.2 64.3 8.5
1992 353.8 335.1 18.7 173.9 67.0 5.3
1993 484.8 453.8 31.0 251.7 65.8 6.4
1995 519.0 490.1 28.9 255.1 67.0 5.6
1996 727.6 703.3 24.3 298.7 70.9 3.3
1997 723.7 691.7 32.0 365.2 66.5 4.4
1998 783.1 750.3 32.7 380.4 67.3 4.2
1999 800.7 760.8 39.8 407.2 66.3 5.0
2000 687.6 649.4 38.2 362.7 65.5 5.6
2001 557.5 523.7 33.8 262.6 68.0 6.1
2002 564.5 536.1 28.5 267.7 67.8 5.0
2003 575.0 549.7 25.3 249.1 69.8 4.4
2004 584.5 552.1 32.4 283.2 67.4 5.5
2005 585.9 557.7 28.2 280.9 67.6 4.8
2006 601.2 572.1 29.1 288.6 67.6 4.8
2007 619.7 590.2 29.4 288.6 68.2 4.7
2008 616.8 589.0 27.8 323.5 65.6 4.5
2009 635.4 603.8 31.6 313.1 67.0 5.0
2010 728.2 694.4 33.8 359.7 66.9 4.6
2011 713.4 673.9 39.5 360.1 66.5 5.5
2012 707.9 675.5 32.4 317.0 69.1 4.6
2013 724.8 692.0 32.8 305.0 70.4 4.5
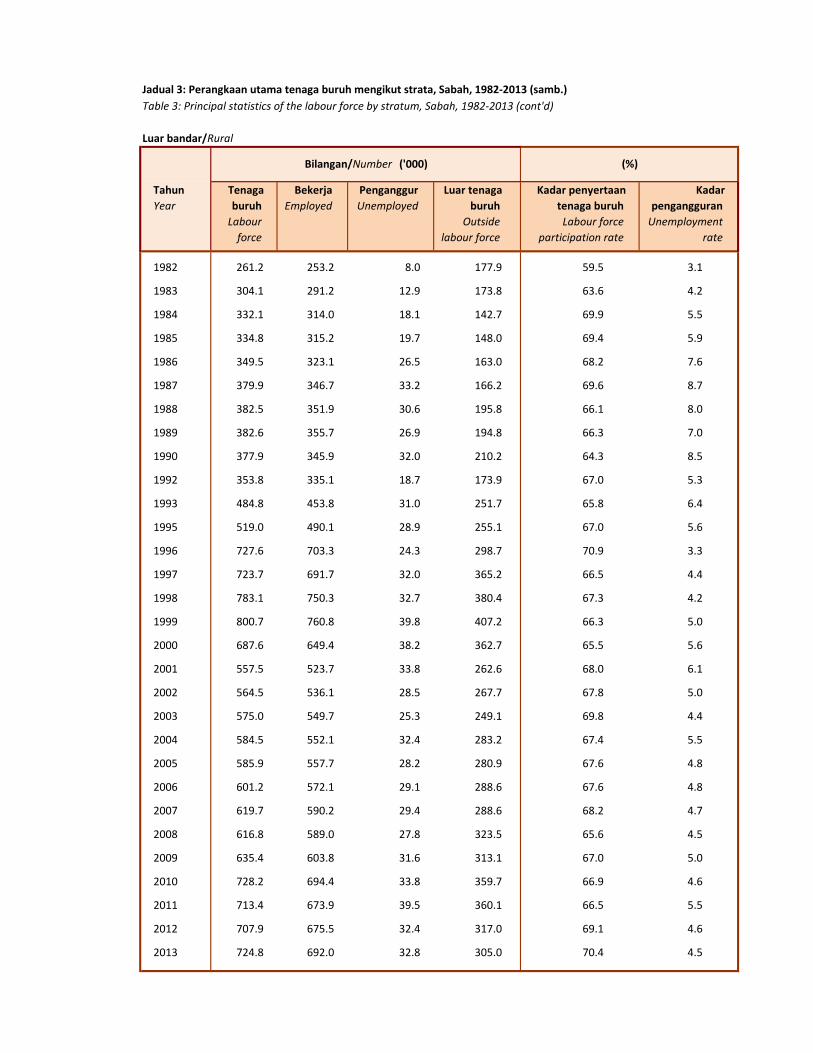
Jadual 3: Perangkaan utama tenaga buruh mengikut strata, Sabah, 1982-2013 (samb.)
Table 3: Principal statistics of the labour force by stratum, Sabah, 1982-2013 (cont'd)
Luar bandar/Rural
Bilangan/Number ('000) (%)
Bandar/Urban
Tahun
Year
Tenaga
buruh
Labour
force
Bekerja
Employed
Penganggur
Unemployed
Luar tenaga
buruh
Outside
labour force
Kadar penyertaan
tenaga buruh
Labour force
participation rate
Kadar
pengangguran
Unemployment
rate
1982 101.0 96.1 4.9 67.8 59.8 4.8
1983 109.5 102.7 6.9 64.4 63.0 6.3
1984 108.0 98.9 9.1 58.3 64.9 8.4
1985 115.5 103.0 12.5 56.7 67.1 10.8
1986 126.4 111.8 14.7 55.1 69.7 11.6
1987 121.6 105.7 15.9 55.1 68.8 13.1
1988 122.4 107.8 14.6 59.7 67.2 11.9
1989 125.1 108.6 16.5 59.7 67.7 13.2
1990 135.2 115.2 19.9 67.4 66.7 14.8
1992 307.5 283.9 23.7 152.6 66.8 7.7
1993 332.2 303.7 28.5 147.1 69.3 8.6
1995 349.8 330.7 19.0 170.2 67.3 5.4
1996 356.4 337.4 19.0 152.4 70.1 5.3
1997 369.5 352.0 17.5 183.3 66.8 4.7
1998 364.0 344.1 19.9 189.9 65.7 5.5
1999 496.7 466.9 29.8 257.3 65.9 6.0
2000 371.6 351.7 19.9 181.4 67.2 5.4
2001 456.1 433.1 23.0 231.7 66.3 5.0
2002 462.6 443.8 18.8 246.8 65.2 4.1
2003 479.9 460.6 19.3 240.6 66.6 4.0
2004 484.0 466.2 17.8 240.9 66.8 3.7
2005 477.8 457.6 20.2 262.4 64.6 4.2
2006 480.1 458.6 21.5 272.7 63.8 4.5
2007 497.2 473.1 24.1 286.0 63.5 4.8
2008 508.8 484.4 24.4 304.6 62.6 4.8
2009 517.4 493.0 24.4 304.6 62.9 4.7
2010 575.0 550.9 24.1 309.9 65.0 4.2
2011 557.7 530.3 27.4 321.4 63.4 4.9
2012 611.3 588.9 22.3 302.6 66.9 3.7
2013 628.6 601.4 27.2 319.4 66.3 4.3
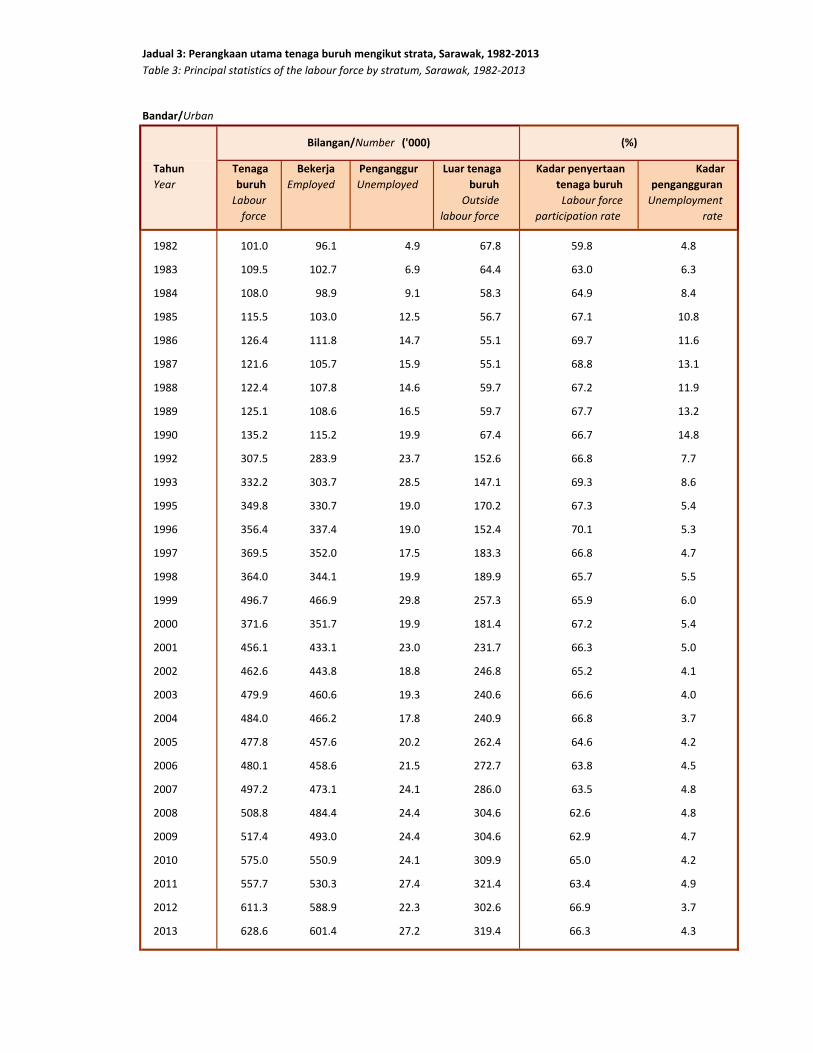
Jadual 3: Perangkaan utama tenaga buruh mengikut strata, Sarawak, 1982-2013
Table 3: Principal statistics of the labour force by stratum, Sarawak, 1982-2013
Bilangan/Number ('000) (%)

Tahun
Year
Tenaga
buruh
Labour
force
Bekerja
Employed
Penganggur
Unemployed
Luar tenaga
buruh
Outside
labour force
Kadar penyertaan
tenaga buruh
Labour force
participation rate
Kadar
pengangguran
Unemployment
rate
1982 438.7 428.6 10.1 162.8 72.9 2.3
1983 459.9 437.4 22.5 165.4 73.6 4.9
1984 508.7 476.4 32.3 158.6 76.2 6.4
1985 517.2 484.5 32.7 157.4 76.7 6.3
1986 548.3 502.6 45.8 150.6 78.4 8.3
1987 590.6 536.3 54.2 143.9 80.4 9.2
1988 588.0 529.4 58.6 141.7 80.6 10.0
1989 634.9 578.5 56.4 157.2 80.2 8.9
1990 640.2 583.6 56.6 159.6 80.0 8.8
1992 463.6 427.4 36.2 137.8 77.1 7.8
1993 478.0 450.1 27.9 125.8 79.2 5.8
1995 478.9 458.4 20.5 143.4 77.0 4.3
1996 513.1 494.2 18.9 160.5 76.2 3.7
1997 495.4 479.5 15.9 162.9 75.2 3.2
1998 504.1 480.3 23.9 183.4 73.1 4.7
1999 410.2 398.1 12.1 121.3 77.2 3.0
2000 544.1 524.6 19.6 175.1 75.7 3.6
2001 461.9 444.3 17.6 153.9 75.0 3.8
2002 493.2 473.9 19.3 196.5 71.5 3.9
2003 466.5 449.3 17.1 178.8 72.3 3.7
2004 471.2 452.4 18.8 201.9 70.0 4.0
2005 472.5 453.3 19.2 217.8 68.5 4.1
2006 477.9 459.7 18.2 229.5 67.6 3.8
2007 500.3 481.0 19.3 208.3 70.6 3.8
2008 464.2 437.3 27.0 246.2 65.3 5.8
2009 506.8 484.4 22.4 225.3 69.2 4.4
2010 518.7 494.7 24.0 224.9 69.8 4.6
2011 532.9 510.1 22.7 250.6 68.0 4.3
2012 562.5 544.1 18.5 216.1 72.2 3.3
2013 558.5 540.1 18.4 216.0 72.1 3.3
Jadual 3: Perangkaan utama tenaga buruh mengikut strata, Sarawak, 1982-2013 (samb.)
Table 3: Principal statistics of the labour force by stratum, Sarawak, 1982-2013 (cont'd)
Luar bandar/Rural
Bilangan/Number ('000) (%)
Bandar/Urban
Tahun
Year
Tenaga
buruh
Labour
force
Bekerja
Employed
Penganggur
Unemployed
Luar tenaga
buruh
Outside
labour force
Kadar penyertaan
tenaga buruh
Labour force
participation rate
Kadar
pengangguran
Unemployment
rate
1982 472.6 463.6 9.0 206.1 69.6 1.9
1983 439.6 430.7 8.9 182.9 70.6 2.0
1984 504.5 485.4 19.2 253.7 66.5 3.8
1985 509.7 491.7 18.0 247.3 67.3 3.5
1986 481.3 455.0 26.3 243.5 66.4 5.5
1987 485.5 457.9 27.6 239.6 67.0 5.7
1988 498.7 469.6 29.2 242.2 67.3 5.8
1989 524.3 504.7 19.6 263.1 66.6 3.7
1990 503.9 490.7 13.2 247.2 67.1 2.6
1992 569.6 555.8 13.7 273.3 67.6 2.4
1993 598.6 580.5 18.1 256.3 70.0 3.0
1995 598.4 588.4 10.1 301.2 66.5 1.7
1996 710.8 697.8 13.0 323.2 68.7 1.8
1997 700.7 691.0 9.7 321.0 68.6 1.4
1998 685.6 668.3 17.2 371.9 64.8 2.5
1999 710.4 689.7 20.7 363.6 66.1 2.9
2000 680.4 662.8 17.6 368.3 64.9 2.6
2001 723.2 703.7 19.5 378.5 65.6 2.7
2002 816.9 794.1 22.7 417.4 66.2 2.8
2003 740.3 715.1 25.2 383.9 65.9 3.4
2004 691.6 671.7 19.9 325.1 68.0 2.9
2005 691.4 675.2 16.1 336.8 67.2 2.3
2006 696.1 676.6 19.5 342.6 67.0 2.8
2007 702.4 682.1 20.3 344.8 67.1 2.9
2008 701.0 682.2 18.8 354.0 66.4 2.7
2009 698.3 678.1 20.2 366.6 65.6 2.9
2010 812.9 788.0 24.9 414.3 66.2 3.1
2011 836.7 811.8 24.9 403.9 67.4 3.0
2012 846.5 823.9 22.6 404.4 67.7 2.7
2013 906.5 877.2 29.3 353.2 72.0 3.2
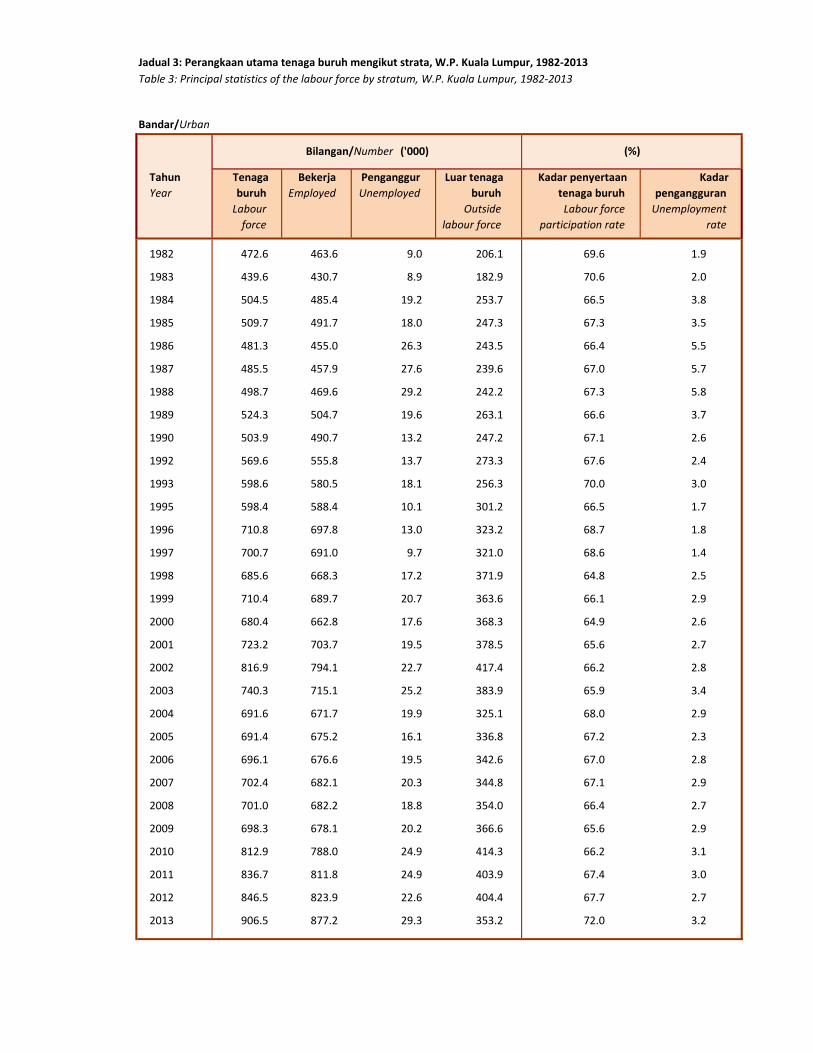
Jadual 3: Perangkaan utama tenaga buruh mengikut strata, W.P. Kuala Lumpur, 1982-2013
Table 3: Principal statistics of the labour force by stratum, W.P. Kuala Lumpur, 1982-2013
Bilangan/Number ('000) (%)
Bandar/Urban
Tahun
Year
Tenaga
buruh
Labour
force
Bekerja
Employed
Penganggur
Unemployed
Luar tenaga
buruh
Outside
labour force
Kadar penyertaan
tenaga buruh
Labour force
participation rate
Kadar
pengangguran
Unemployment
rate
1984 9.0 8.6 0.4 3.9 69.8 4.3
1985 8.3 8.0 0.4 3.9 68.1 4.5
1986 7.6 6.9 0.6 3.4 69.0 8.3
1987 7.1 6.5 0.6 3.3 68.3 8.3
1988 6.6 6.0 0.6 3.5 65.4 9.1
1989 7.2 6.7 0.5 4.0 64.0 6.8
1990 8.7 8.4 0.3 3.9 68.8 3.0
1992 8.2 7.9 0.2 4.3 65.7 3.0
1993 6.9 6.4 0.5 4.2 61.9 7.7
1995 12.0 11.6 0.4 6.8 63.8 3.4
1996 19.6 18.6 1.0 9.1 68.3 5.1
1997 16.7 16.2 0.4 7.7 68.5 2.6
1998 19.7 19.2 0.5 8.5 69.8 2.5
1999 23.0 21.6 1.5 12.9 64.2 6.5
2000 14.1 13.8 0.4 7.8 64.4 2.6
2001 22.4 21.3 1.1 13.0 63.2 4.8
2002 23.9 23.3 0.6 12.0 66.6 2.4
2003 25.2 24.1 1.1 9.5 72.7 4.5
2004 26.0 24.7 1.4 10.9 70.4 5.3
2005 24.5 23.3 1.2 13.8 64.0 4.9
2006 26.2 23.5 2.7 13.4 66.2 10.3
2007 25.3 24.2 1.1 14.0 64.4 4.3
2008 26.6 25.0 1.6 15.8 62.7 6.1
2009 28.3 26.7 1.5 14.5 66.0 5.4
2010 29.7 27.9 1.8 14.2 67.6 6.1
2011 30.2 28.9 1.2 14.6 67.4 4.1
2012 31.7 30.3 1.4 14.7 68.4 4.4
2013 32.3 31.1 1.2 15.1 68.2 3.6
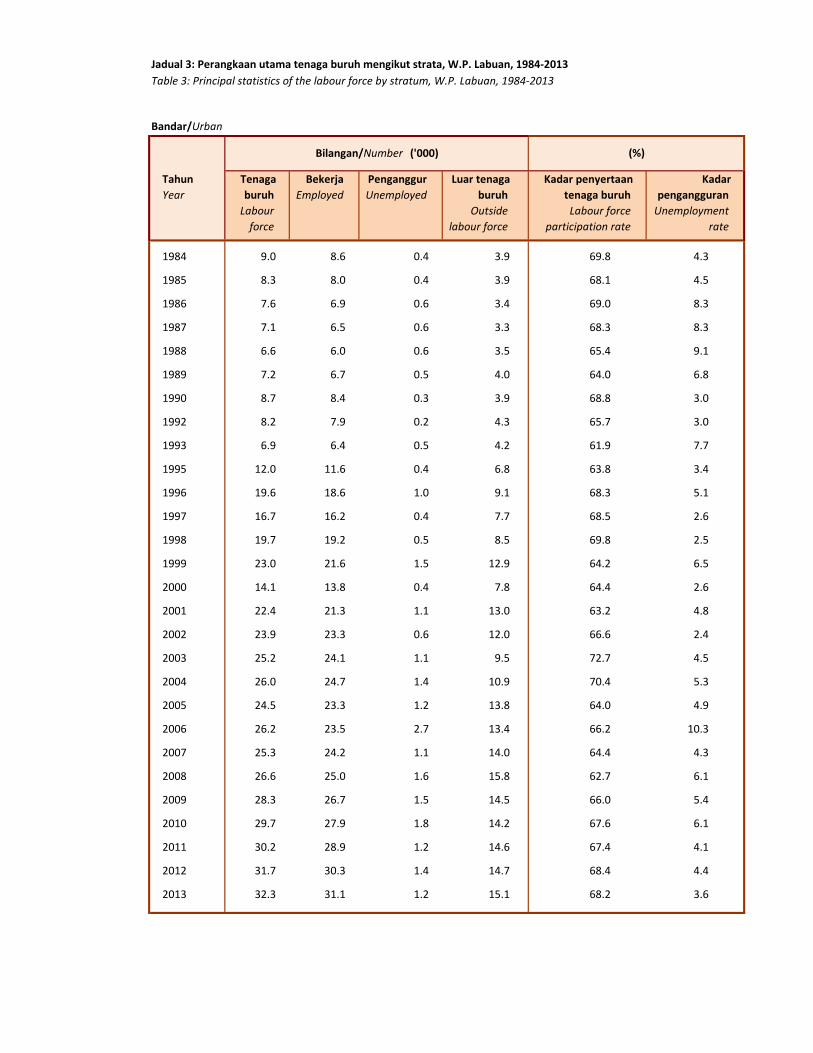
Jadual 3: Perangkaan utama tenaga buruh mengikut strata, W.P. Labuan, 1984-2013
Table 3: Principal statistics of the labour force by stratum, W.P. Labuan, 1984-2013
Bilangan/Number ('000) (%)
Tahun
Year
Tenaga
buruh
Labour
force
Bekerja
Employed
Penganggur
Unemployed
Luar tenaga
buruh
Outside
labour force
Kadar penyertaan
tenaga buruh
Labour force
participation rate
Kadar
pengangguran
Unemployment
rate
1984 8.2 7.3 0.9 4.8 63.2 11.3
1985 7.9 7.1 0.9 4.7 62.8 11.0
1986 7.7 6.7 1.0 4.4 63.6 13.5
1987 6.6 5.8 0.7 4.1 61.4 11.3
1988 7.2 6.3 0.9 4.4 62.1 12.5
1989 7.5 6.7 0.8 5.1 59.7 10.2
1990 7.0 6.4 0.6 5.4 56.7 9.0
1992 7.2 7.0 0.3 5.2 58.2 3.6
1993 11.5 11.0 0.6 9.5 54.9 4.9
1995 20.6 19.5 1.1 12.1 63.0 5.5
1996 19.8 18.8 1.0 11.8 62.6 5.1
1997 19.3 18.5 0.8 10.8 64.1 4.0
1998 18.2 17.8 0.5 11.2 61.9 2.5
1999 19.9 19.7 0.2 12.5 61.4 1.0
2000 12.5 11.6 0.9 8.0 61.1 7.3
2001 6.3 5.8 0.5 3.9 61.8 7.5
2002 10.1 9.6 0.5 5.6 64.3 5.0
2003 8.1 7.7 0.4 5.3 60.3 4.5
2004 7.9 7.6 0.3 5.3 60.0 4.1
2005 7.6 7.2 0.4 4.8 61.3 5.9
2006 7.5 7.1 0.5 5.3 58.9 6.0
2007 8.9 8.4 0.5 5.6 61.3 5.2
2008 7.8 7.5 0.3 5.3 59.6 4.0
2009 9.3 8.8 0.6 5.0 65.1 6.1
2010 10.4 9.8 0.6 5.5 65.3 5.7
2011 10.3 9.8 0.5 5.8 63.8 4.7
2012 10.0 9.5 0.5 5.7 63.9 5.0
2013 10.2 9.7 0.5 5.5 65.1 5.2
Jadual 3: Perangkaan utama tenaga buruh mengikut strata, W.P. Labuan, 1984-2013 (samb.)
Table 3: Principal statistics of the labour force by stratum, W.P. Labuan, 1984-2013 (cont'd)
Luar bandar/Rural
Bilangan/Number ('000) (%)
Bandar/Urban
Tahun
Year
Tenaga
buruh
Labour
force
Bekerja
Employed
Penganggur
Unemployed
Luar tenaga
buruh
Outside
labour force
Kadar penyertaan
tenaga buruh
Labour force
participation rate
Kadar
pengangguran
Unemployment
rate
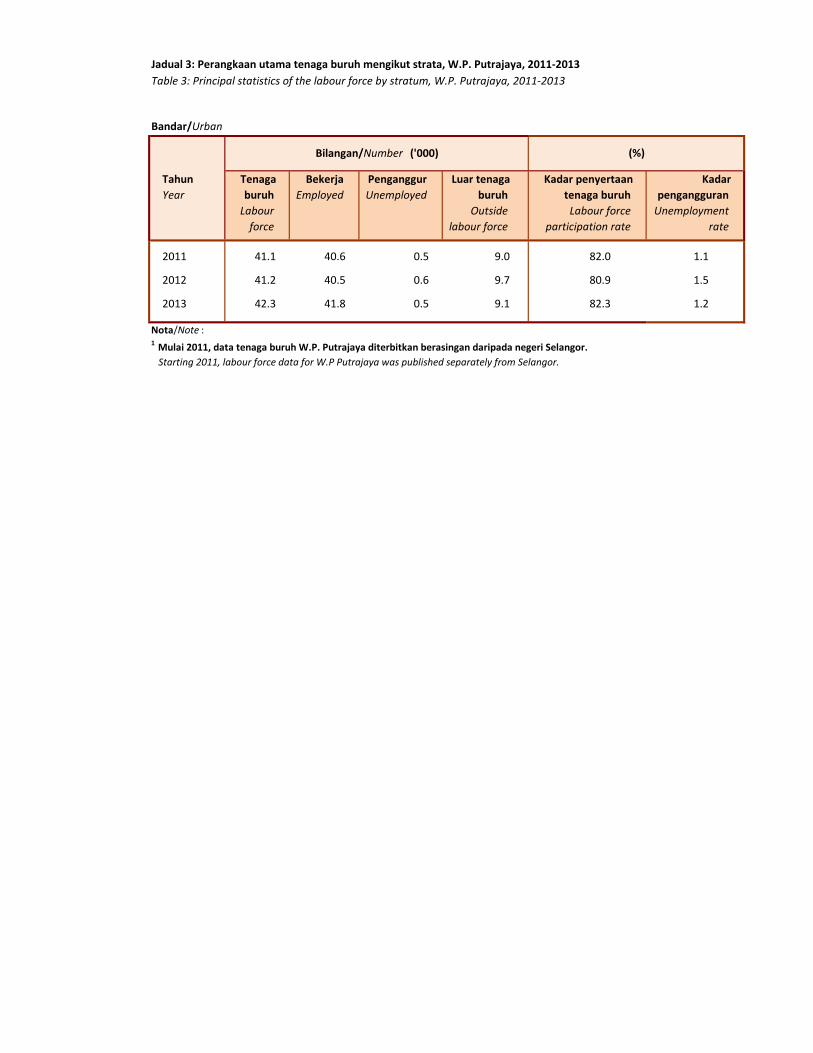
2011 41.1 40.6 0.5 9.0 82.0 1.1
2012 41.2 40.5 0.6 9.7 80.9 1.5
2013 42.3 41.8 0.5 9.1 82.3 1.2
Nota/Note :1
Mulai 2011, data tenaga buruh W.P. Putrajaya diterbitkan berasingan daripada negeri Selangor.
Starting 2011, labour force data for W.P Putrajaya was published separately from Selangor.
Jadual 3: Perangkaan utama tenaga buruh mengikut strata, W.P. Putrajaya, 2011-2013
Table 3: Principal statistics of the labour force by stratum, W.P. Putrajaya, 2011-2013
Bilangan/Number ('000) (%)


![Implementation of Public Facilities and Disability ... · Kurang Upaya (OKU) Bekerja di JARO (Johor Area Rehabilitation Organisation)[2]” In her research, disabled person need some](https://img.pdfslide.us/doc/110x75/60e06ee85346404ba74e488d/implementation-of-public-facilities-and-disability-kurang-upaya-oku-bekerja.jpg)