Embed Size (px)
Citation preview
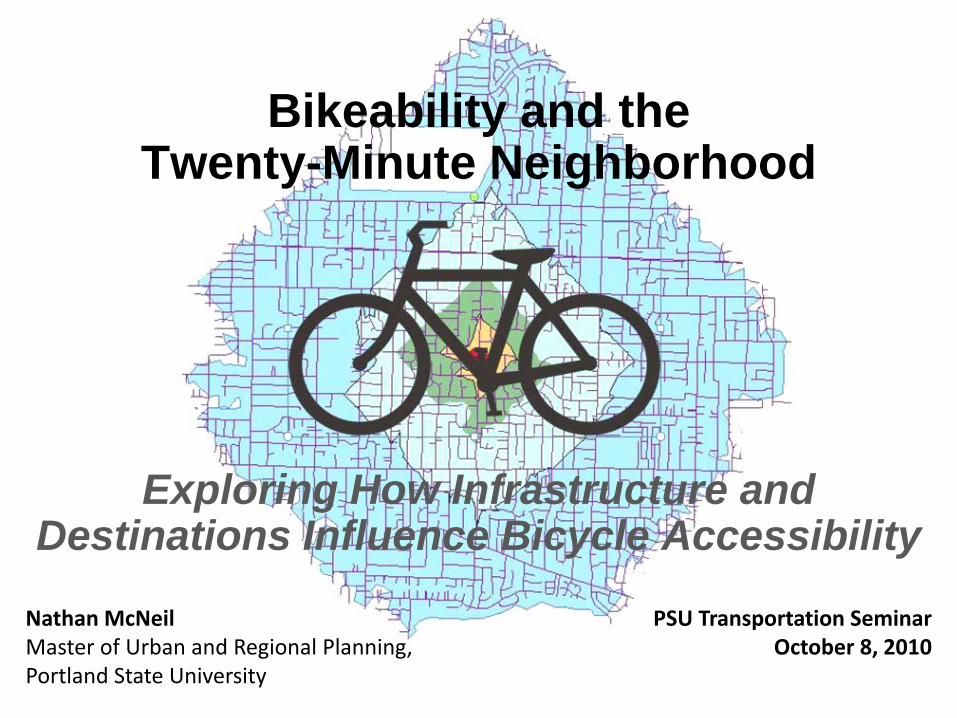
Bikeability and the Twenty-Minute Neighborhood
Exploring How Infrastructure and Destinations Influence Bicycle Accessibility
Nathan McNeil Master of Urban and Regional Planning, Portland State University
PSU Transportation SeminarOctober 8, 2010
Agenda
Background/ContextPrior Work and StudiesIdentifying and Mapping DestinationsIdentifying a Bikeable AreaCreating a “Bikeability” ScoreFindings and Next Steps
Background/Context
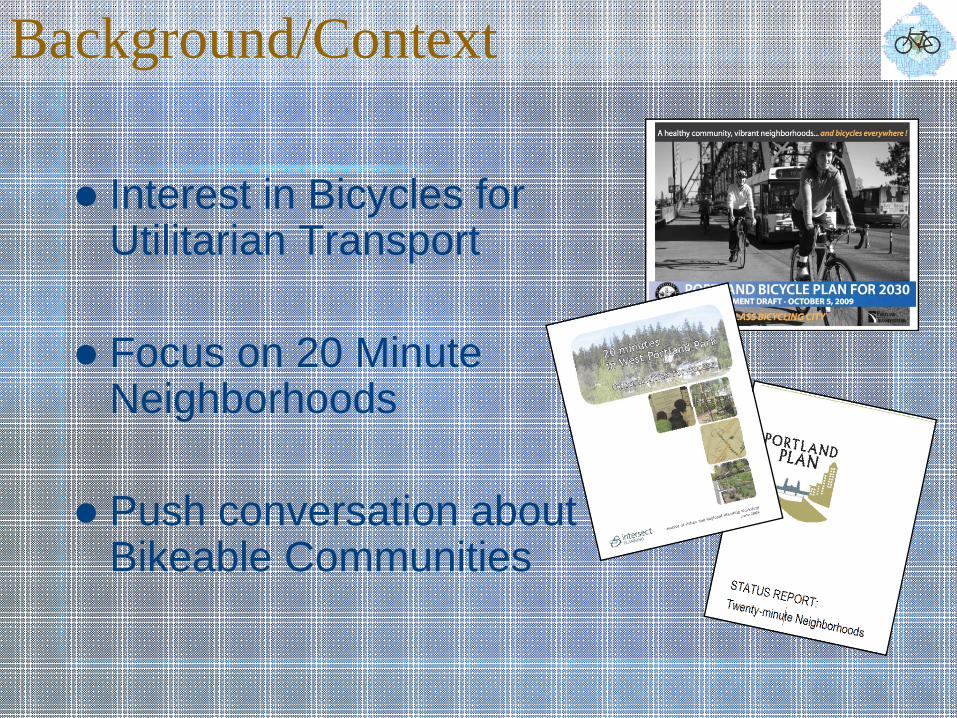
Interest in Bicycles for Utilitarian Transport
Focus on 20 Minute Neighborhoods
Push conversation about Bikeable Communities
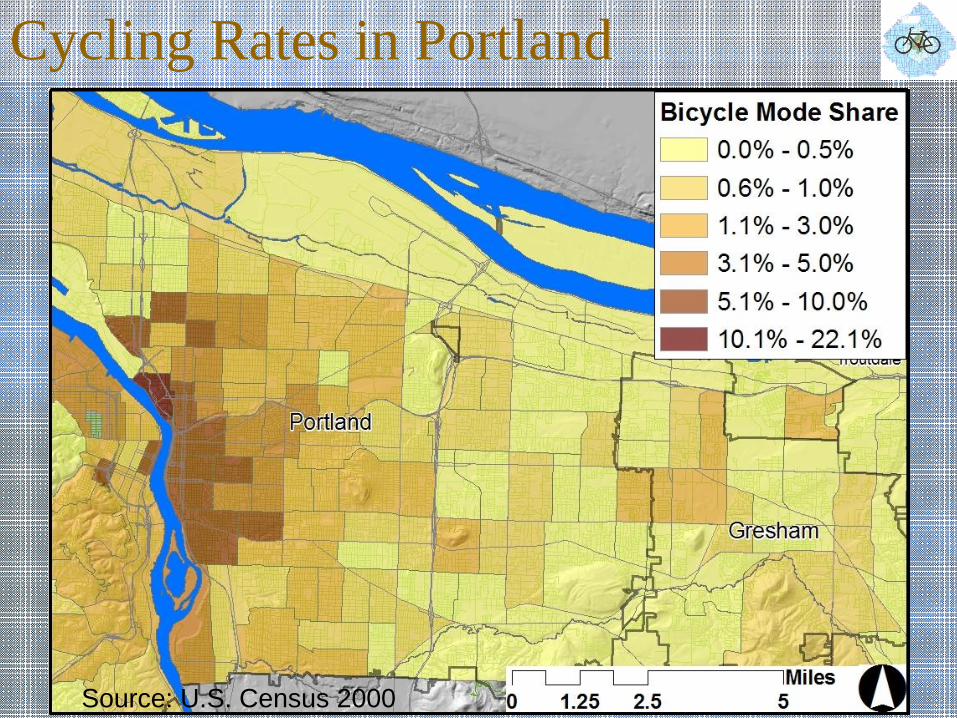
Cycling Rates in Portland
Source: U.S. Census 2000
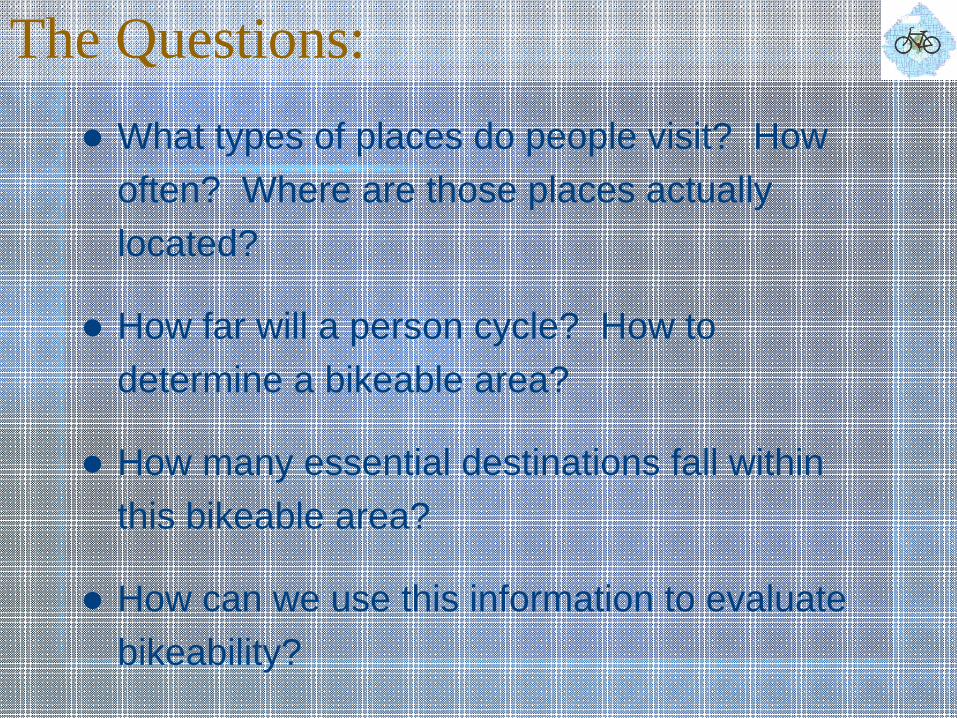
The Questions:What types of places do people visit? How often? Where are those places actually located?
How far will a person cycle? How to determine a bikeable area?
How many essential destinations fall within this bikeable area?
How can we use this information to evaluate bikeability?

Prior Work and Studies
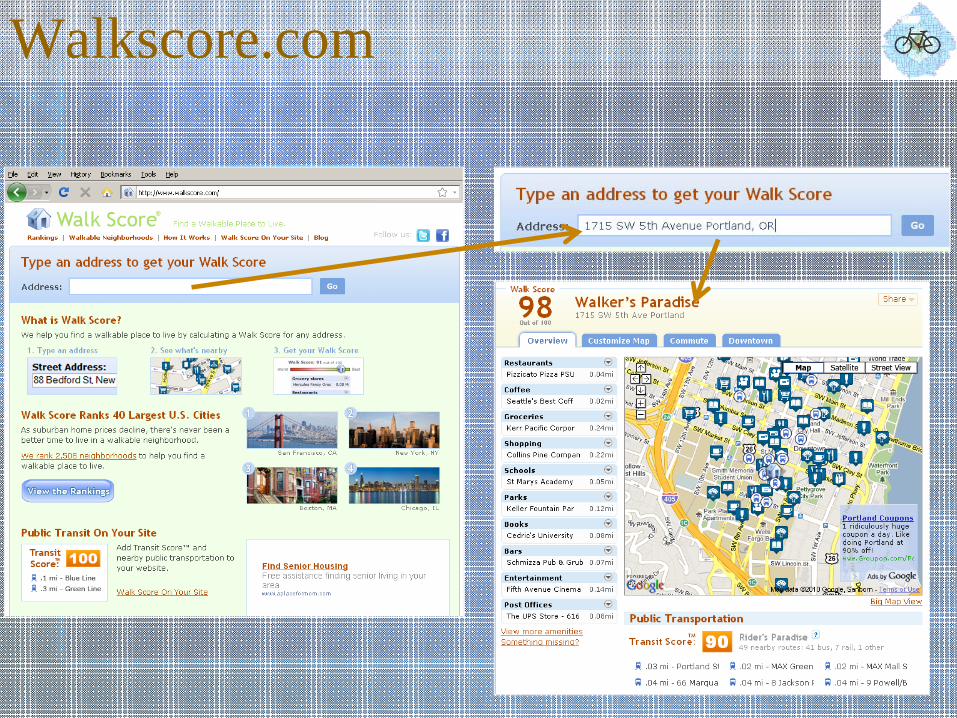
Walkscore.com

Portland Bikeway Quality Index
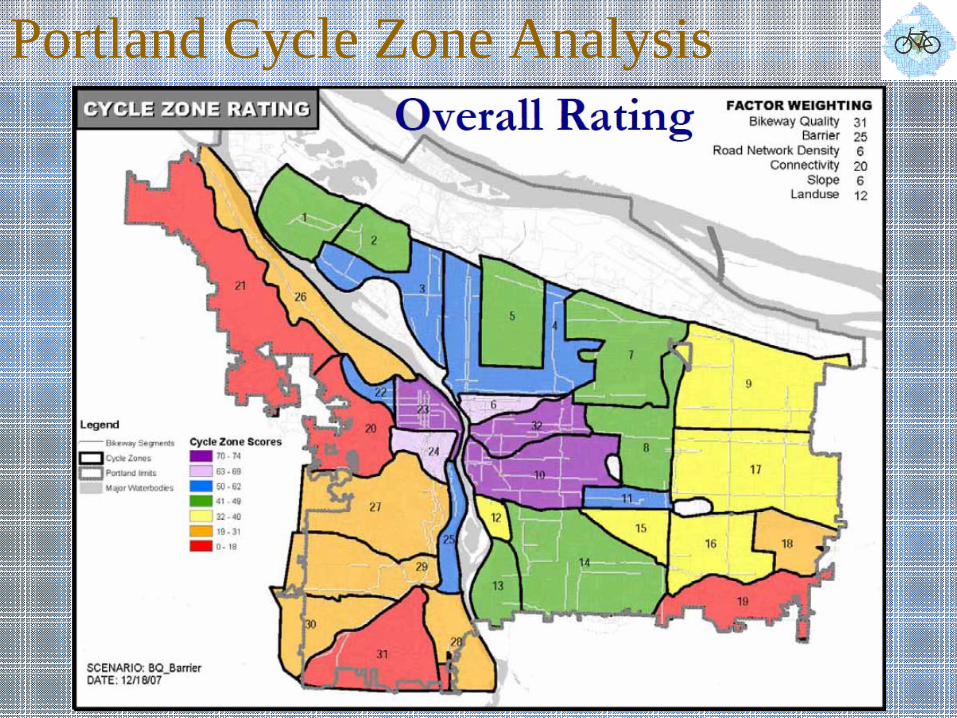
Portland Cycle Zone Analysis

Where are the Places we Visit?
Identifying and Mapping Destinations
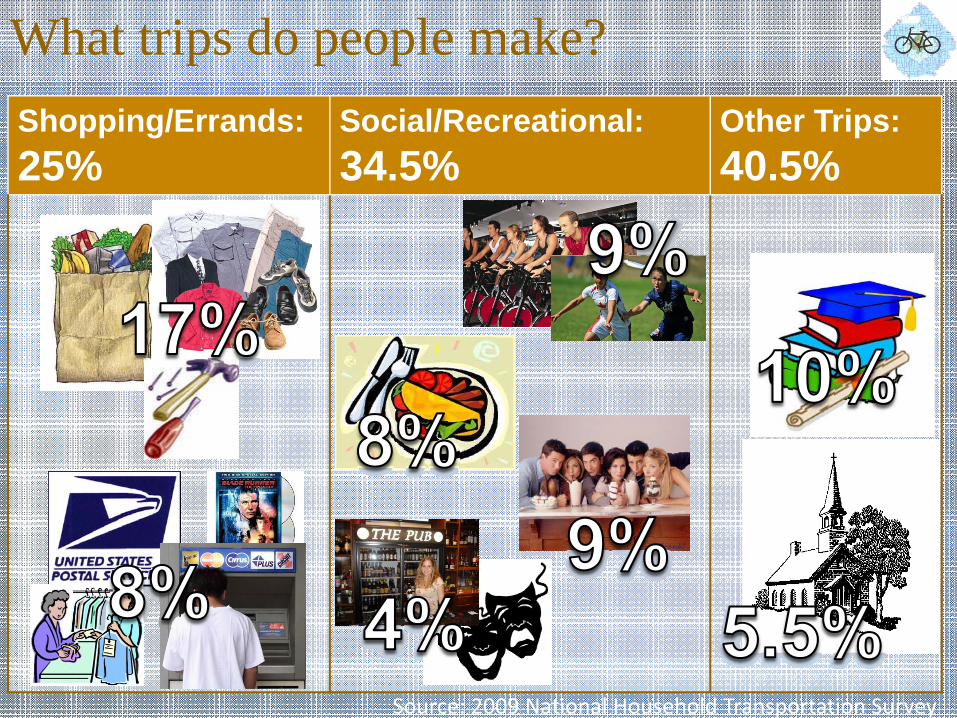
Shopping/Errands: 25%
Social/Recreational: 34.5%
Other Trips: 40.5%
What trips do people make?
Source: 2009 National Household Transportation Survey
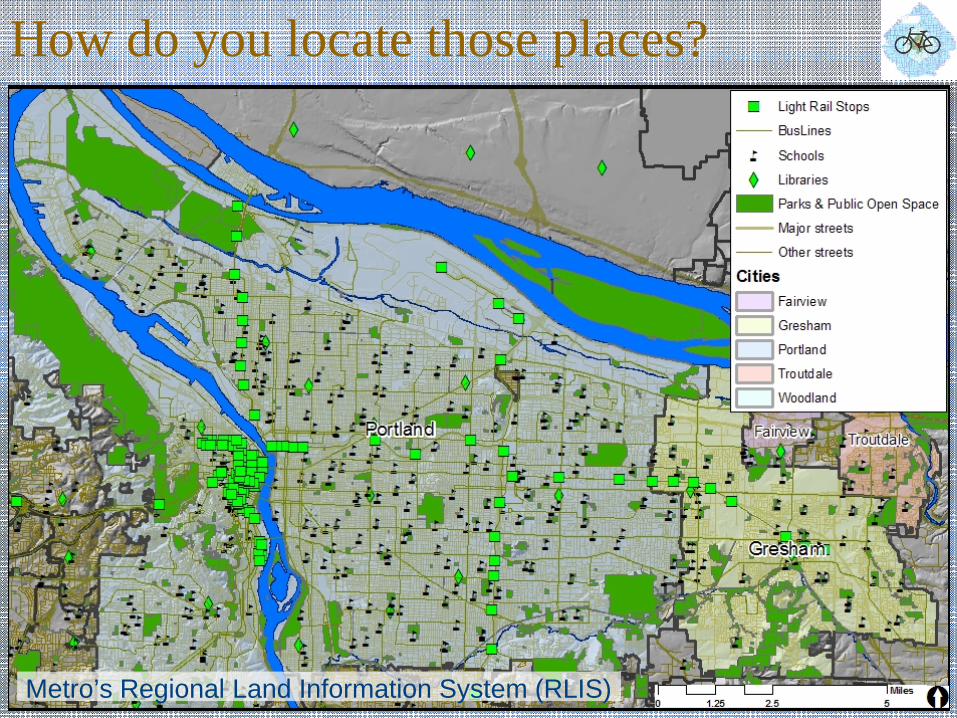
How do you locate those places?
Metro’s Regional Land Information System (RLIS)
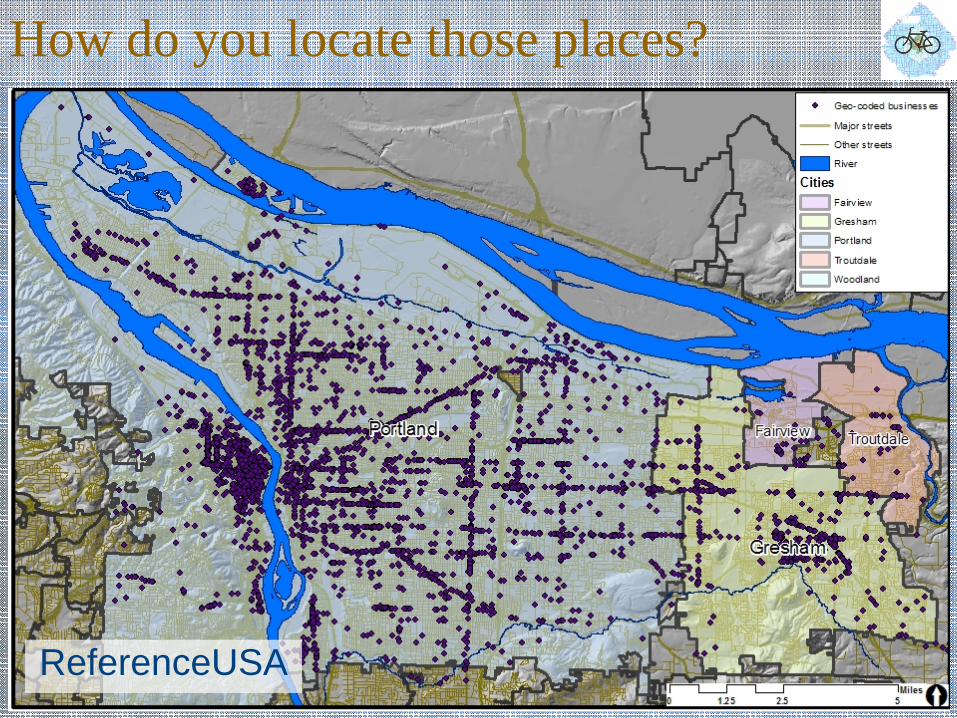
How do you locate those places?
ReferenceUSA

How Far Will a Cyclist Travel?
Identifying a Bikeable area
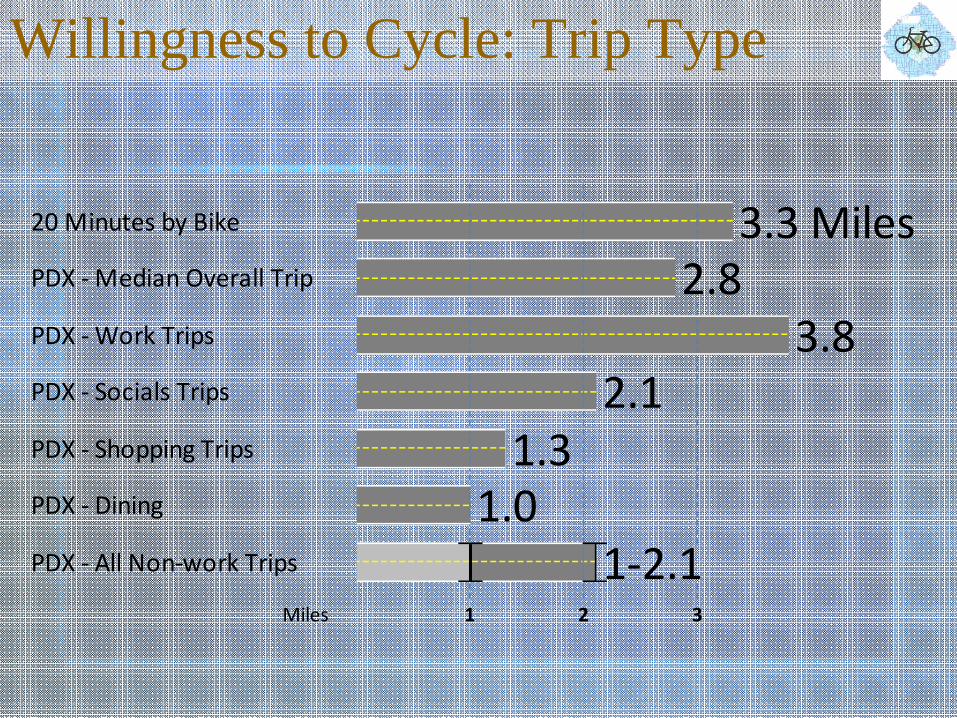
Willingness to Cycle: Trip Type
Miles
1‐2.1
2.11.3
1.0
20 Minutes by Bike
1 2 3
3.3 Miles2.8
3.8
PDX ‐ All Non‐work Trips
PDX ‐ Dining
PDX ‐ Shopping Trips
PDX ‐ Socials Trips
PDX ‐ Median Overall Trip
PDX ‐ Work Trips
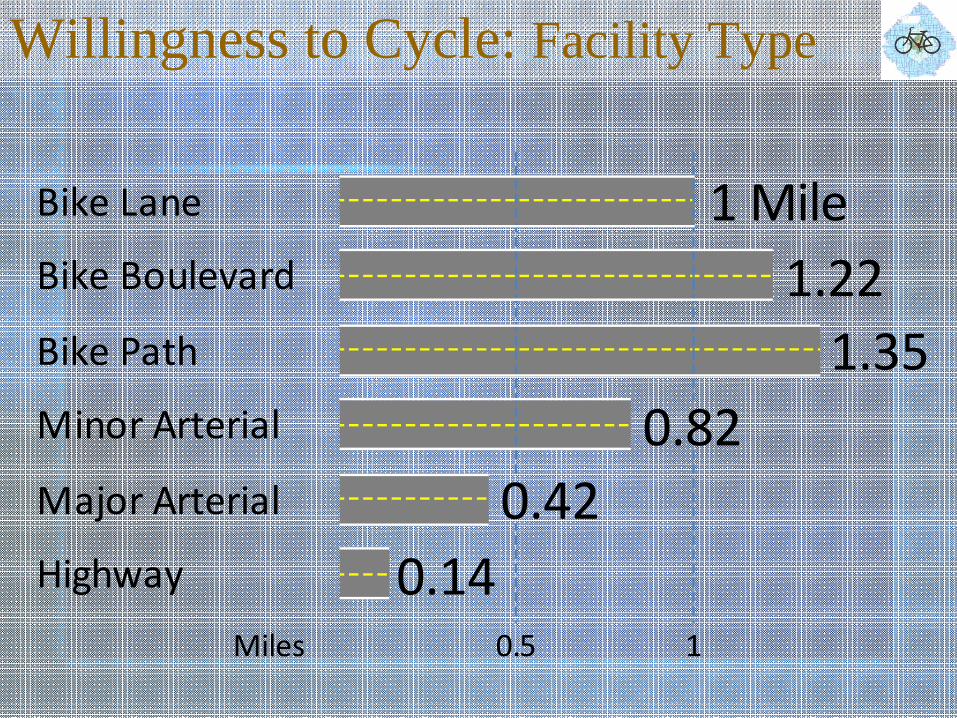
Willingness to Cycle: Facility Type
Miles
0.420.14
10.5
1 Mile1.221.35
0.82
Highway
Major Arterial
Minor Arterial
Bike Path
Bike Boulevard
Bike Lane
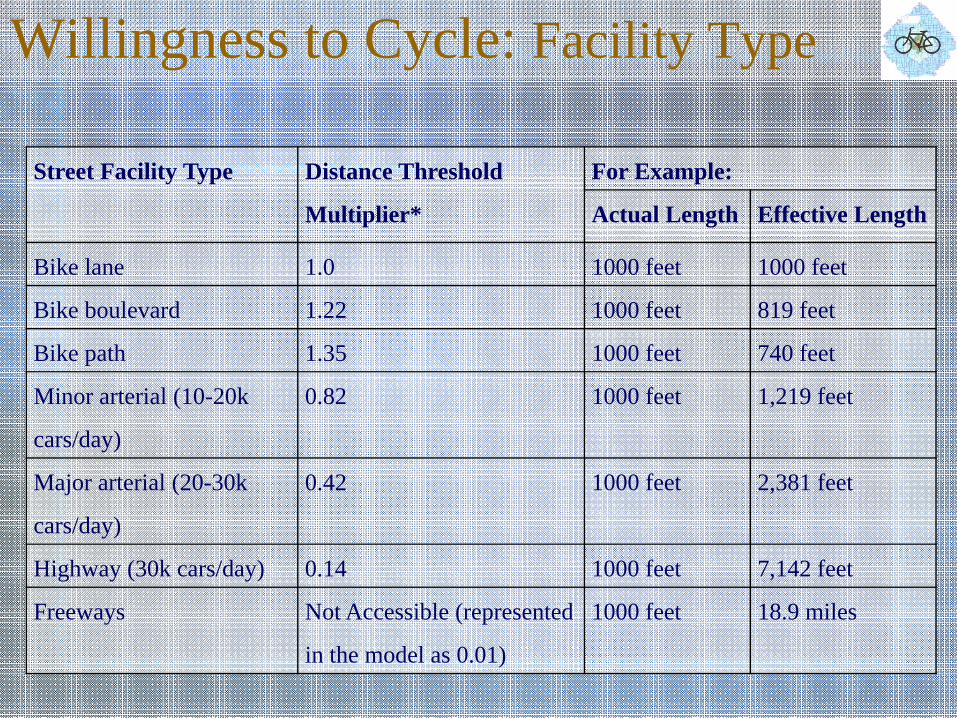
Willingness to Cycle: Facility Type
Street Facility Type Distance Threshold
Multiplier*
For Example:
Actual Length Effective Length
Bike lane 1.0 1000 feet 1000 feet
Bike boulevard 1.22 1000 feet 819 feet
Bike path 1.35 1000 feet 740 feet
Minor arterial (10-20k
cars/day)
0.82 1000 feet 1,219 feet
Major arterial (20-30k
cars/day)
0.42 1000 feet 2,381 feet
Highway (30k cars/day) 0.14 1000 feet 7,142 feet
Freeways Not Accessible (represented
in the model as 0.01)
1000 feet 18.9 miles
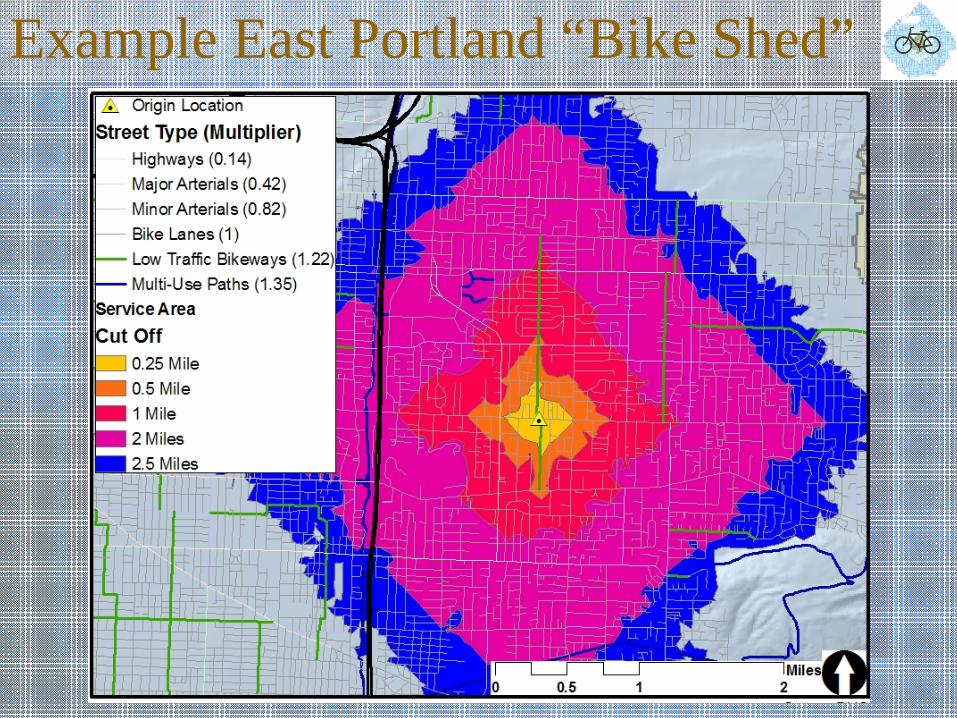
Example East Portland “Bike Shed”
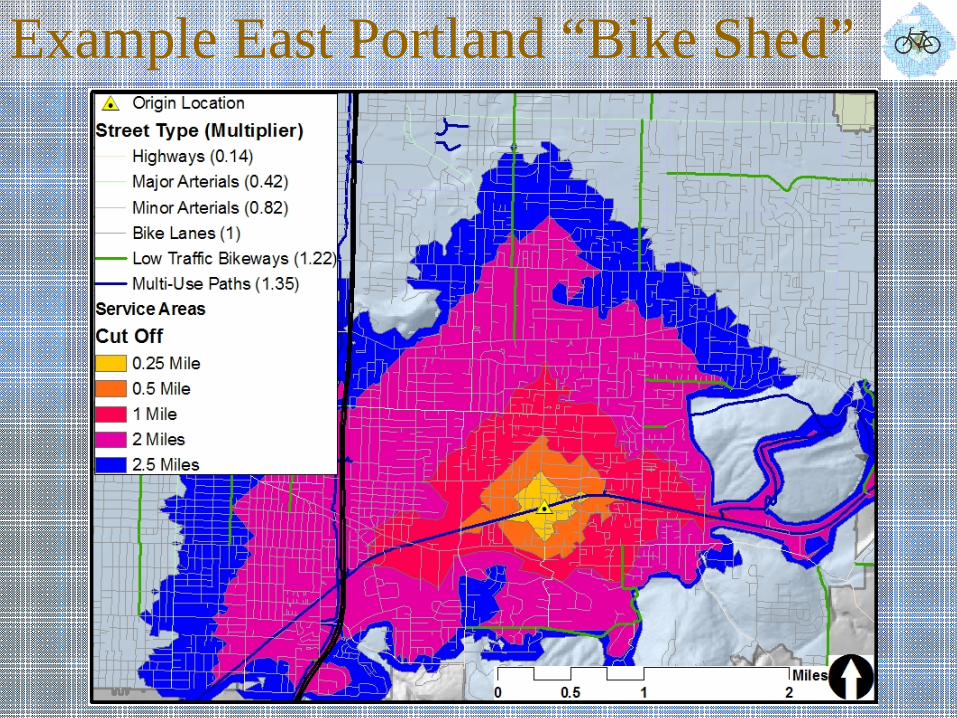
Example East Portland “Bike Shed”
How to evaluate bikeability?
Creating an objective score
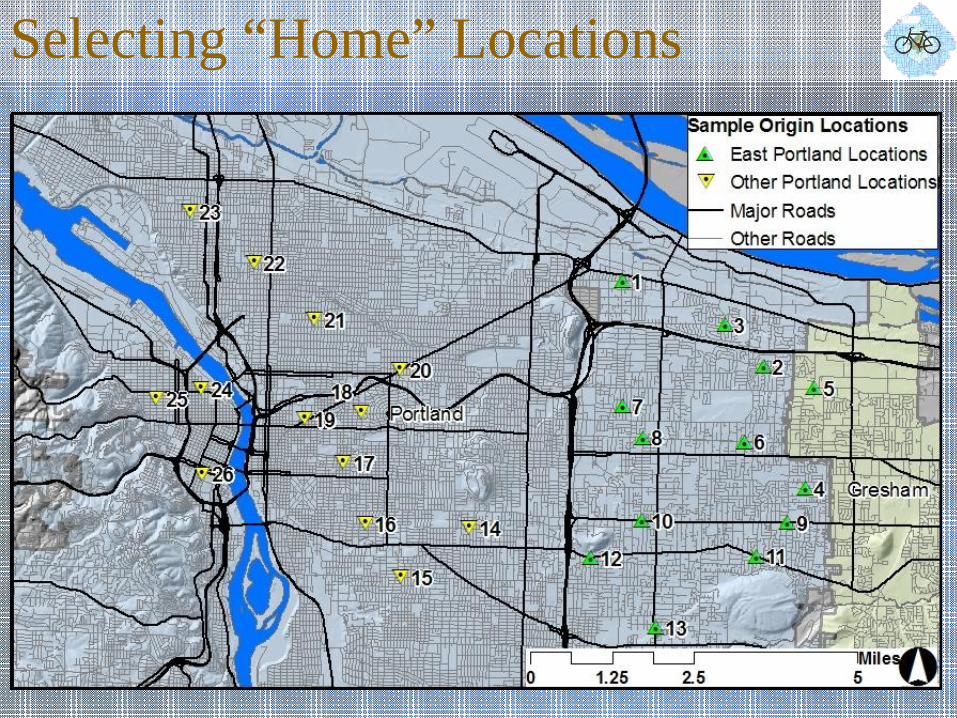
Selecting “Home” Locations
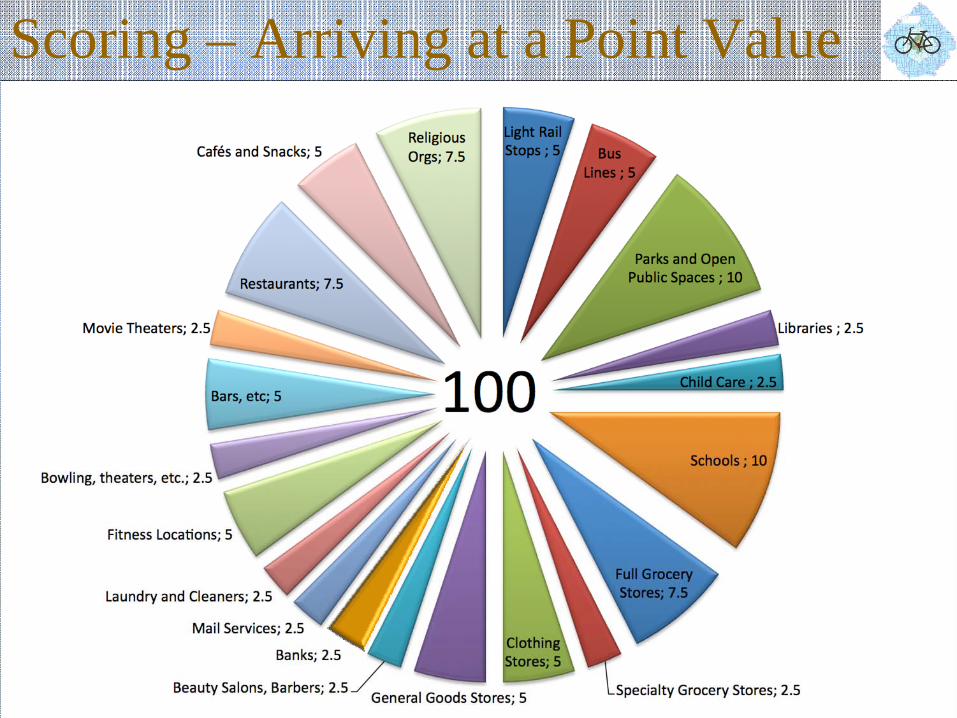
Scoring – Arriving at a Point Value
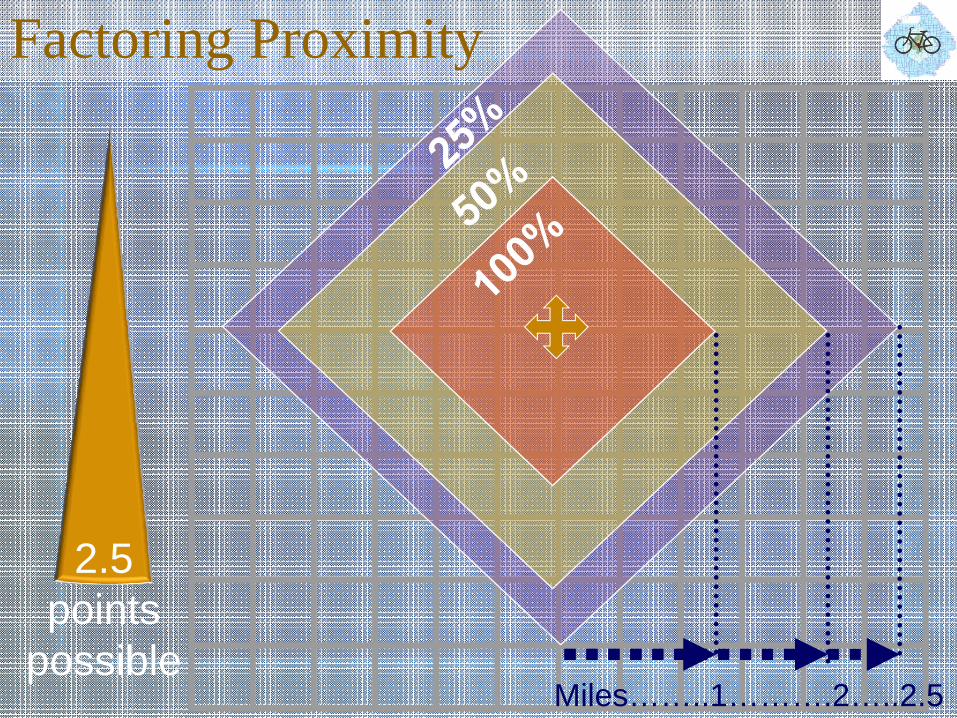
Factoring Proximity
Miles……..1……….2…..2.5
2.5 points
possible

Destination Type Max
Points
Scoring Criteria
Bus Lines 5 1.25 for each occurrence up to full points (4 occurrences)Schools 10 2.5 points for a Preschool; 2.5 points for an Elem. School; 2.5
points for a middle schools; and 2.5 points for a high school.Full Grocery Stores 7.5 3.75 for each occurrence up to full points (2 occurrences). No
points beyond first break (0.25 miles for pedestrian or 1 mile for cyclists)
Specialty Grocery Stores 2.5 0.625 for each occurrence up to full points (4 occurrences). Clothing Stores 5.0 1.25 for each occurrence up to full points (4 occurrences). General Goods Stores 5.0 1.25 for each occurrence up to full points (4 occurrences). No
points beyond first break (0.25 miles for pedestrian or 1 mile for cyclists)
Beauty Salons, Barbers, etc 2.5 0.625 for each occurrence up to full points (4 occurrences). Banks 2.5 1.25 for each occurrence up to full points (2 occurrences). Laundry and Cleaners 2.5 1.25 for each occurrence up to full points (2 occurrences). No
points beyond first break (0.25 miles for pedestrian or 1 mile for cyclists)
Fitness Locations 5.0 2.5 for each occurrence up to full points (2 occurrences). General Entertainment (bowling, theaters, etc)
2.5 1.25 for each occurrence up to full points (2 occurrences).
Drinking Establishments 5.0 1.25 for each occurrence up to full points (4 occurrences). Movie Theaters 2.5 1.25 for each occurrence up to full points (2 occurrences). Restaurants 7.5 0.625 for each occurrence up to full points (12 occurrences). Cafés and Snacks 5.0 1.25 for each occurrence up to full points (4 occurrences). Religious Organizations 7.5 1.5 for each occurrence up to full points (5 occurrences).
Factoring Variety
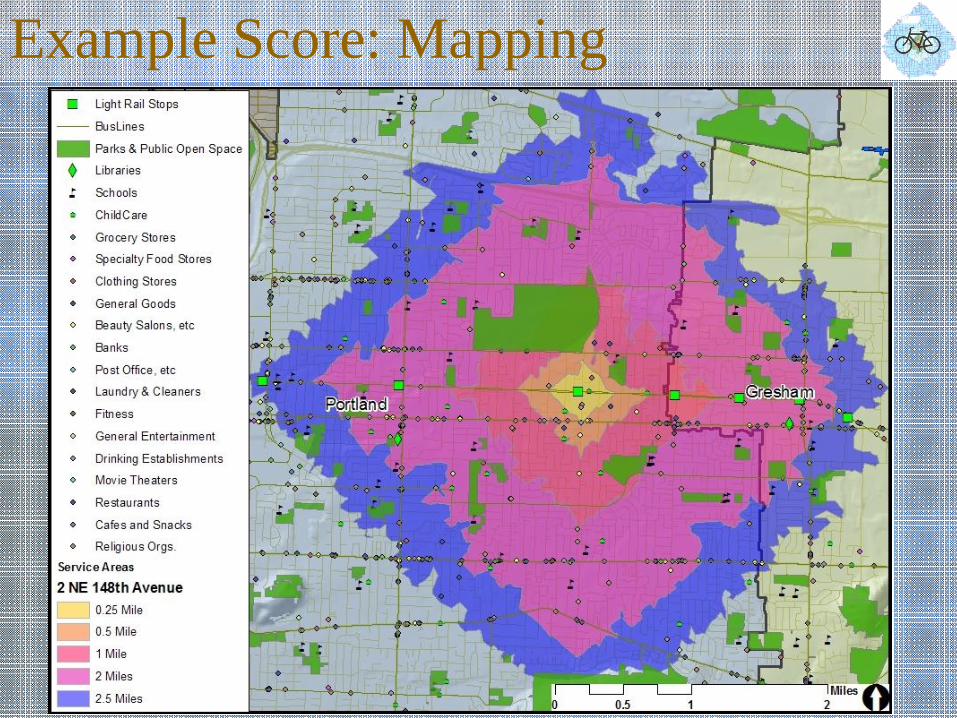
Example Score: Mapping
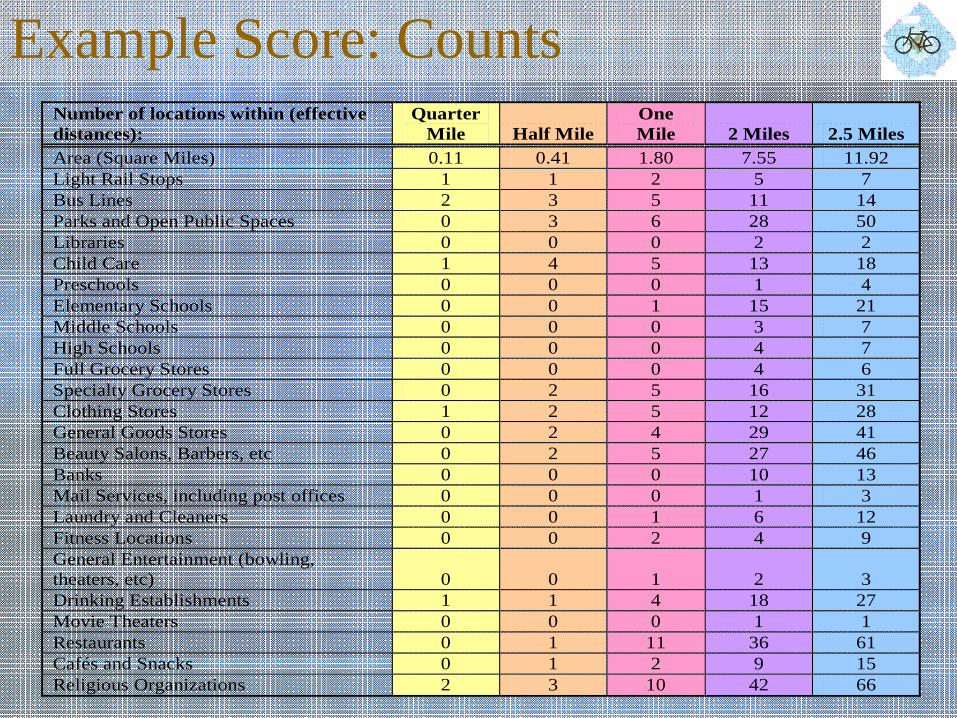
Example Score: CountsNumber of locations within (effective distances):
Quarter Mile Half Mile
One Mile 2 Miles 2.5 Miles
Area (Square Miles) 0.11 0.41 1.80 7.55 11.92 Light Rail Stops 1 1 2 5 7 Bus Lines 2 3 5 11 14 Parks and Open Public Spaces 0 3 6 28 50 Libraries 0 0 0 2 2 Child Care 1 4 5 13 18 Preschools 0 0 0 1 4 Elementary Schools 0 0 1 15 21 Middle Schools 0 0 0 3 7 High Schools 0 0 0 4 7 Full Grocery Stores 0 0 0 4 6 Specialty Grocery Stores 0 2 5 16 31 Clothing Stores 1 2 5 12 28 General Goods Stores 0 2 4 29 41 Beauty Salons, Barbers, etc 0 2 5 27 46 Banks 0 0 0 10 13 Mail Services, including post offices 0 0 0 1 3 Laundry and Cleaners 0 0 1 6 12 Fitness Locations 0 0 2 4 9 General Entertainment (bowling, theaters, etc) 0 0 1 2 3 Drinking Establishments 1 1 4 18 27 Movie Theaters 0 0 0 1 1 Restaurants 0 1 11 36 61 Cafés and Snacks 0 1 2 9 15 Religious Organizations 2 3 10 42 66
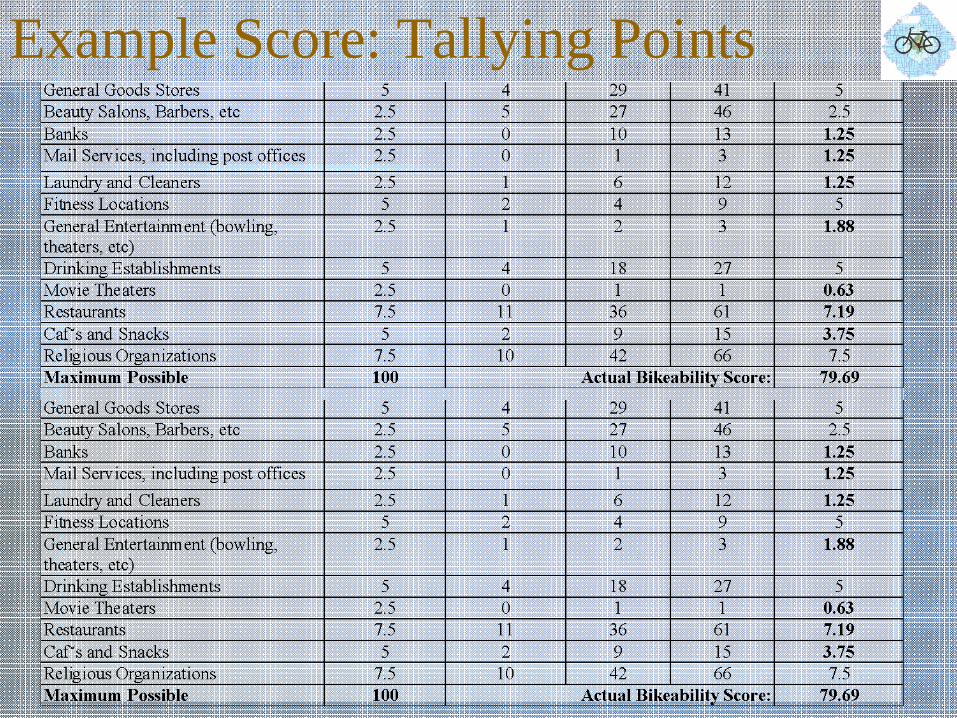
Example Score: Tallying Points

What are the scores?
What can we do with them?
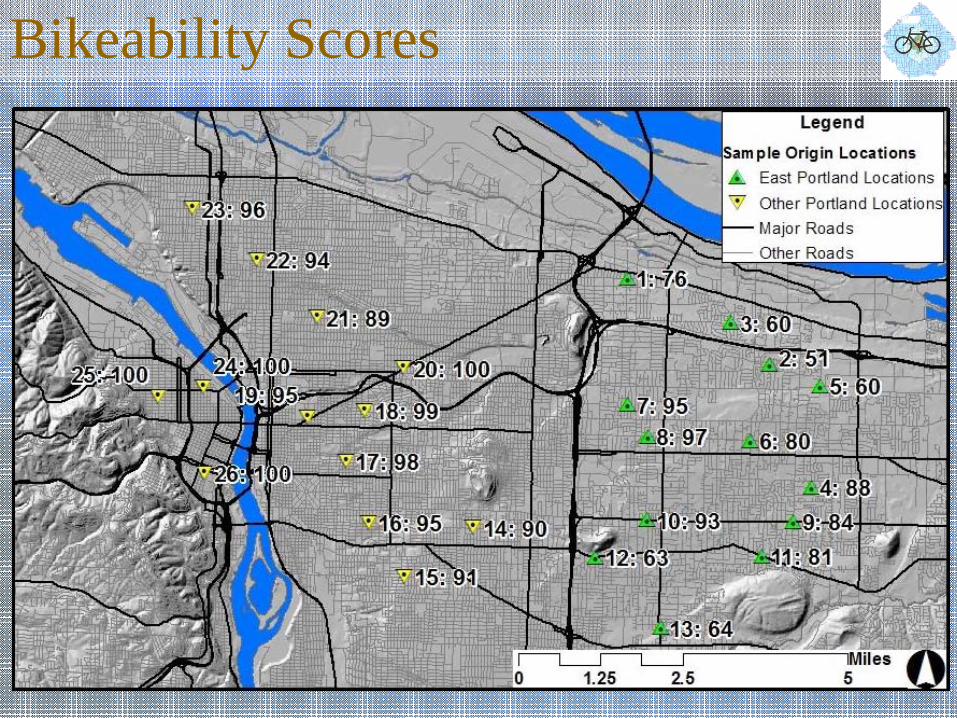
Bikeability Scores
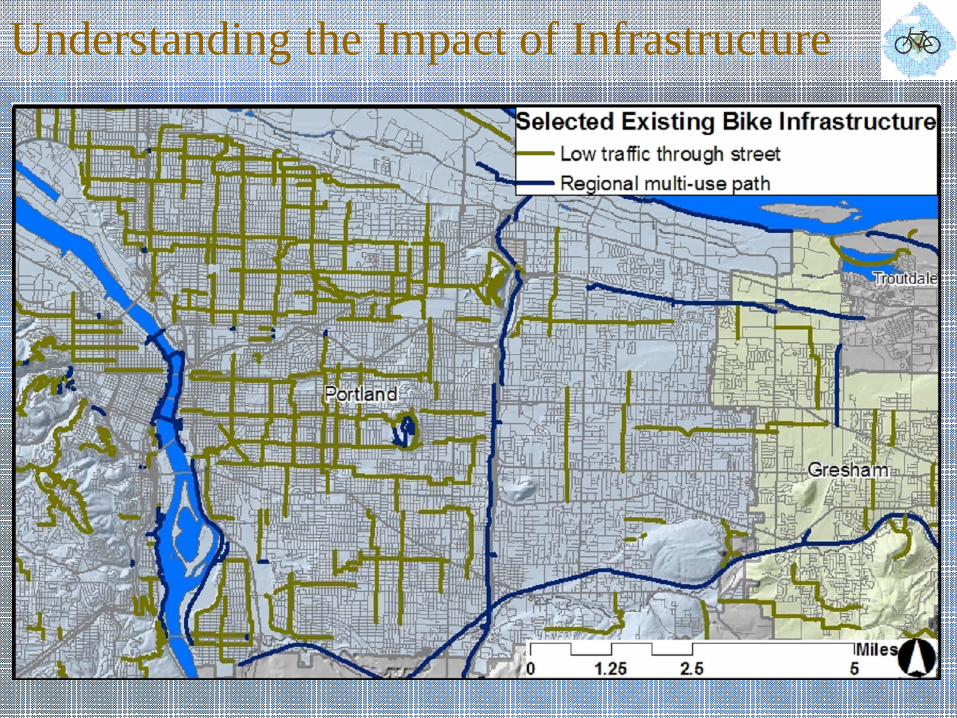
Understanding the Impact of Infrastructure
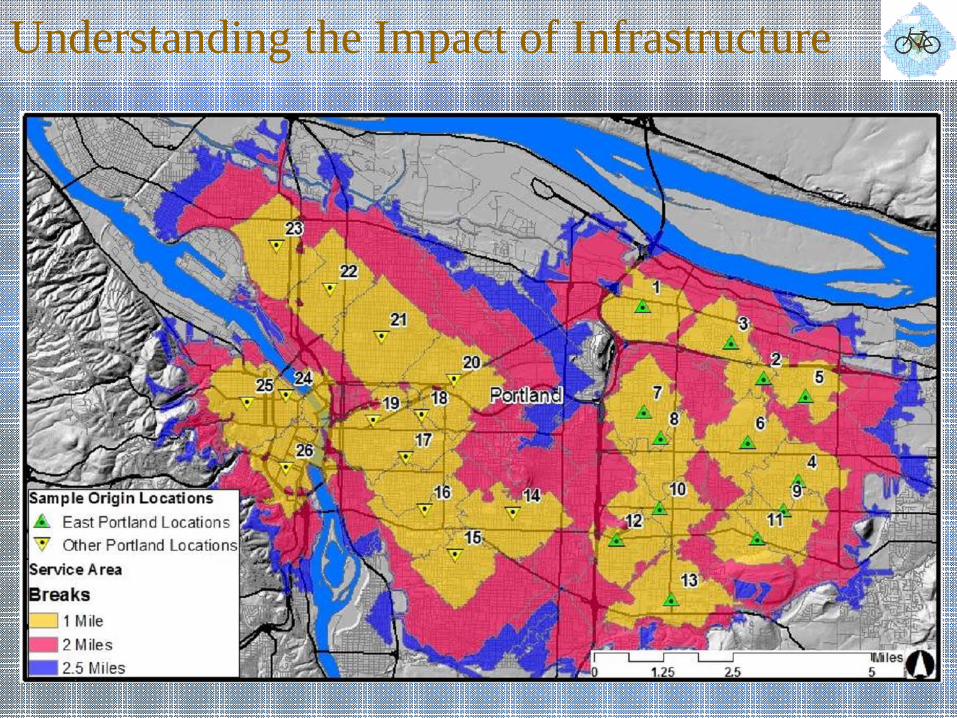
Understanding the Impact of Infrastructure
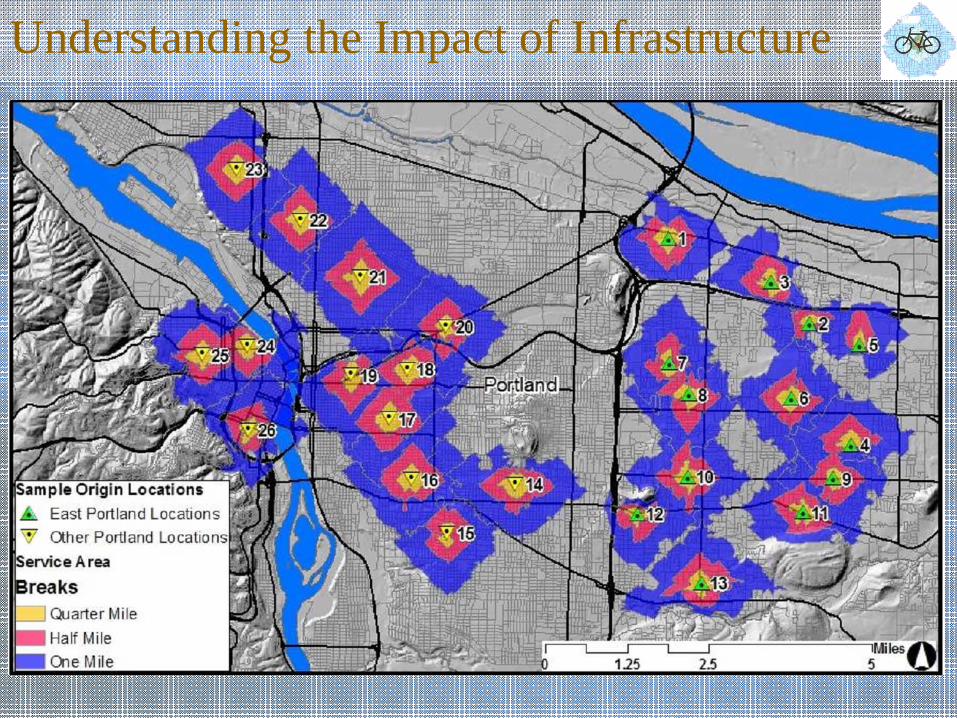
Understanding the Impact of Infrastructure
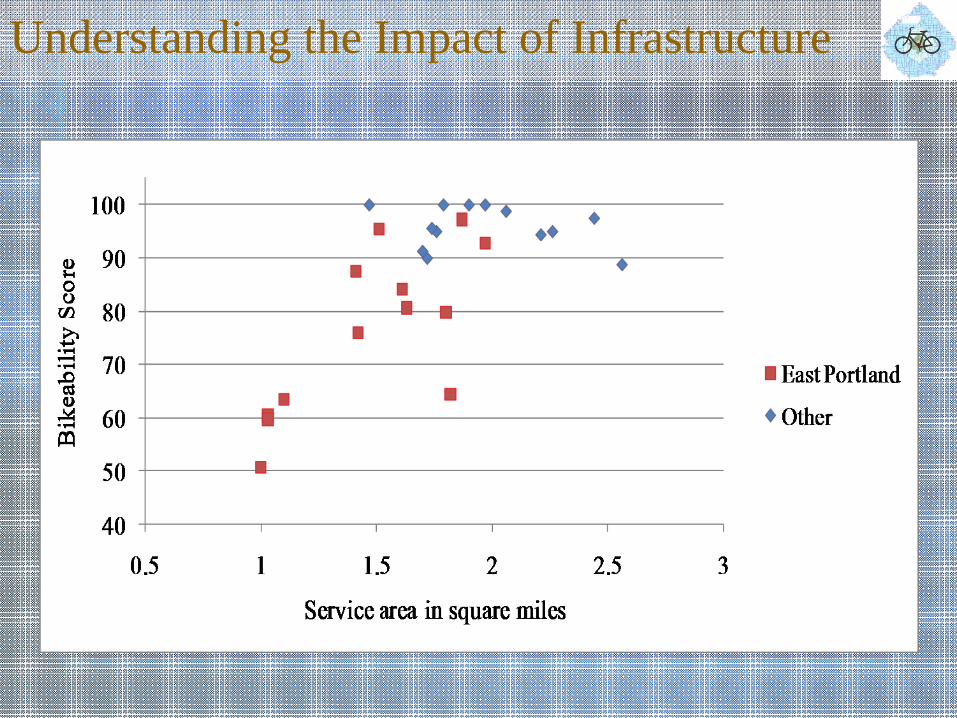
Understanding the Impact of Infrastructure
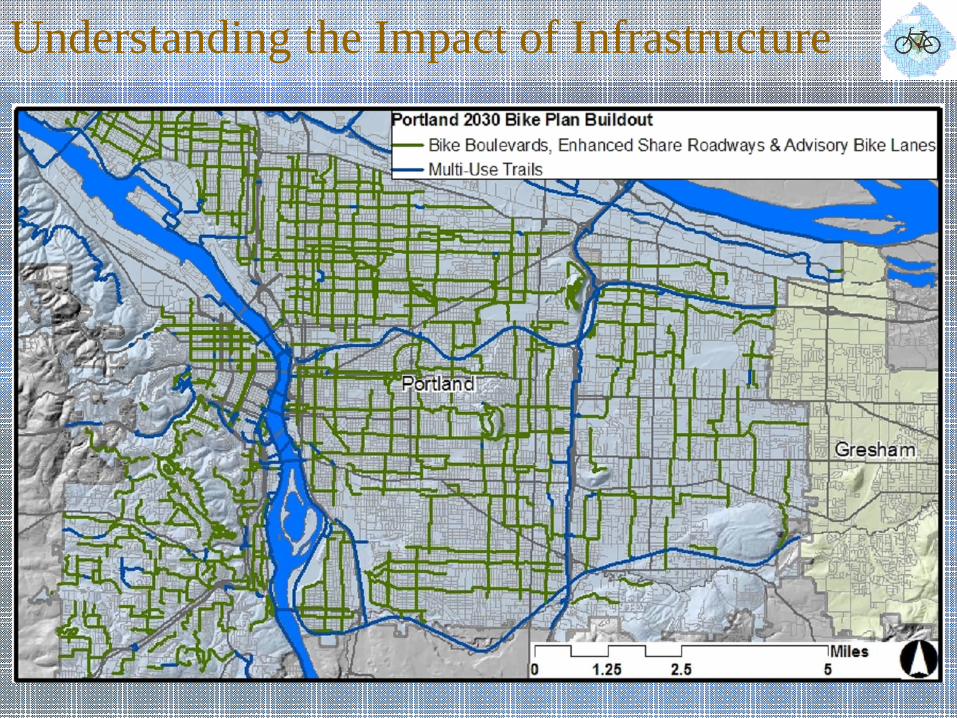
Understanding the Impact of Infrastructure
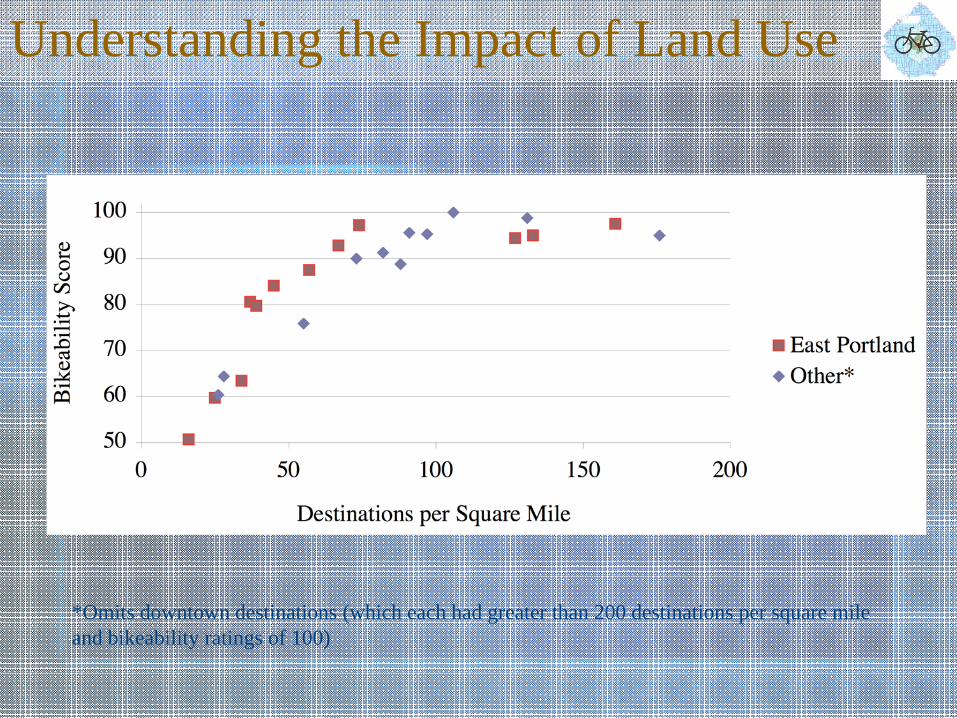
Understanding the Impact of Land Use
*Omits downtown destinations (which each had greater than 200 destinations per square mile and bikeability ratings of 100)
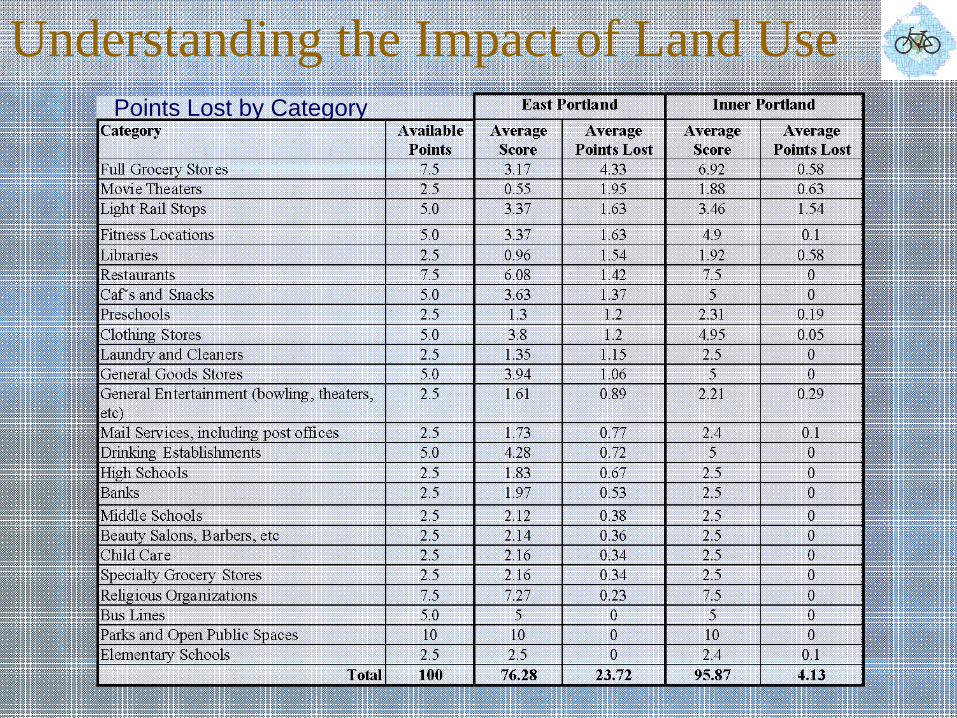
Understanding the Impact of Land UsePoints Lost by Category
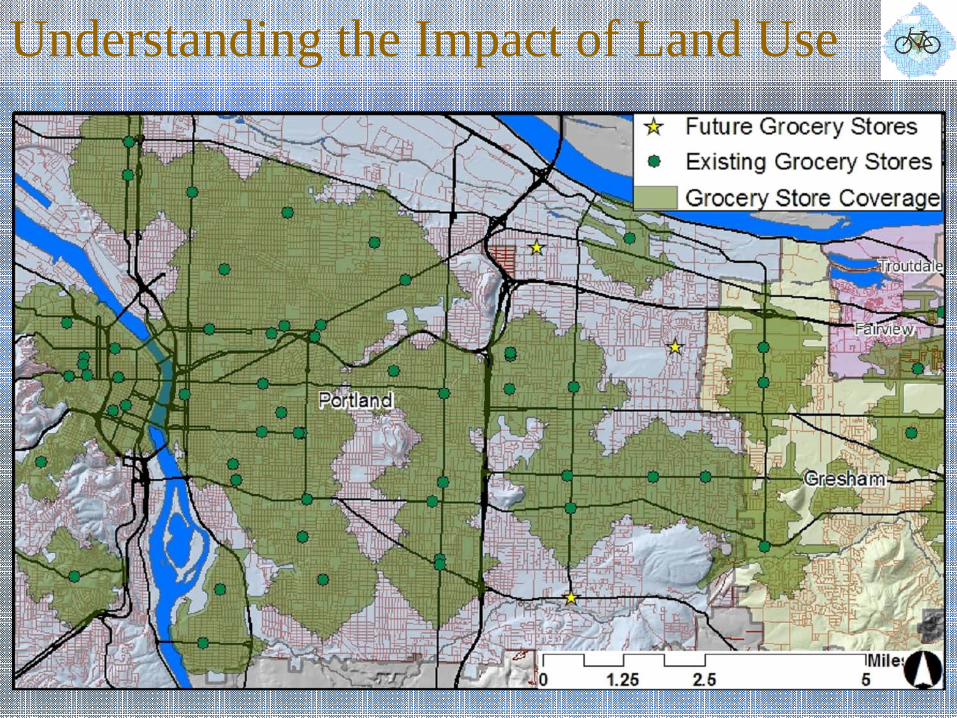
Understanding the Impact of Land Use
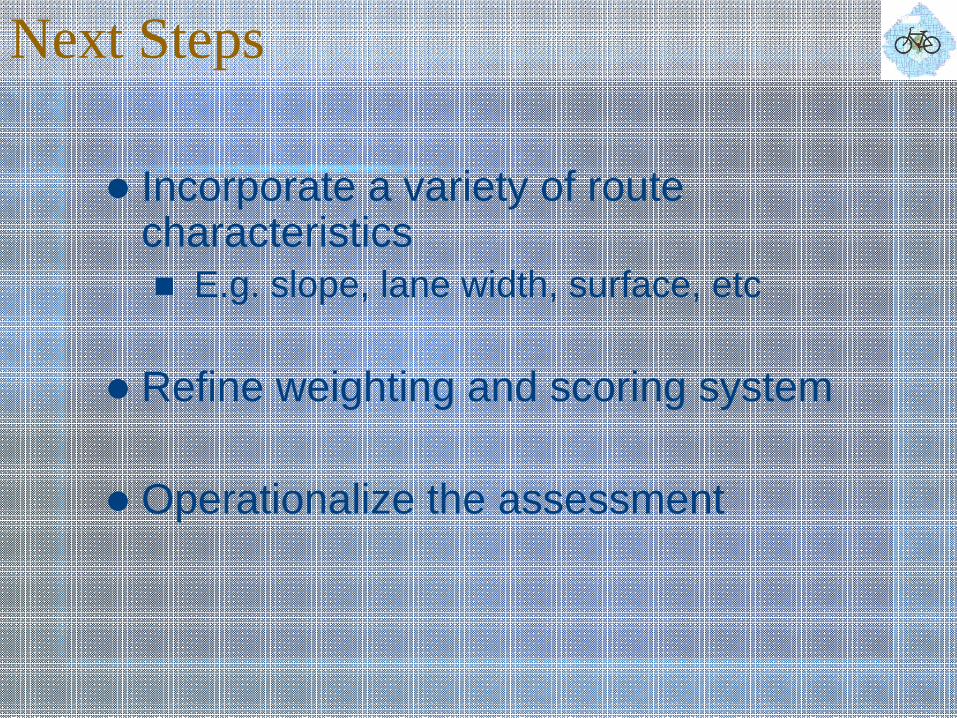
Next Steps
Incorporate a variety of route characteristics
E.g. slope, lane width, surface, etc
Refine weighting and scoring system
Operationalize the assessment
Thank You!
Full Paper at http://www.ibpi.usp.pdx.edu/neighborhoods.php
Contact: [email protected]
Questions