Embed Size (px)
Citation preview

Bike Share: Council Briefing #2
Council Transportation Committee
Scott Kubly, Nicole Freedman
February 19, 2016
Our mission, vision, and core values
Committed to 5 core values to create a city that is:
• Safe
• Interconnected
• Affordable
• Vibrant
• Innovative
For all
Mission: deliver a high-quality
transportation system for Seattle
Vision: connected people,
places, and products
2
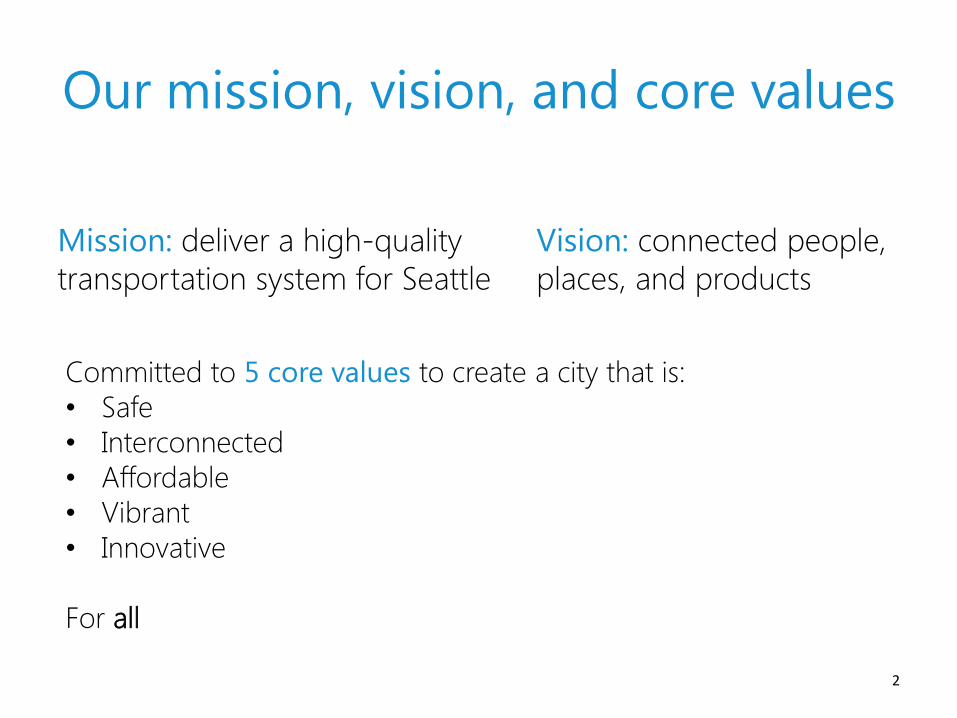
Presentation goal
3
1. Recap
2. Council options
3. Future expansion
4. Council questions
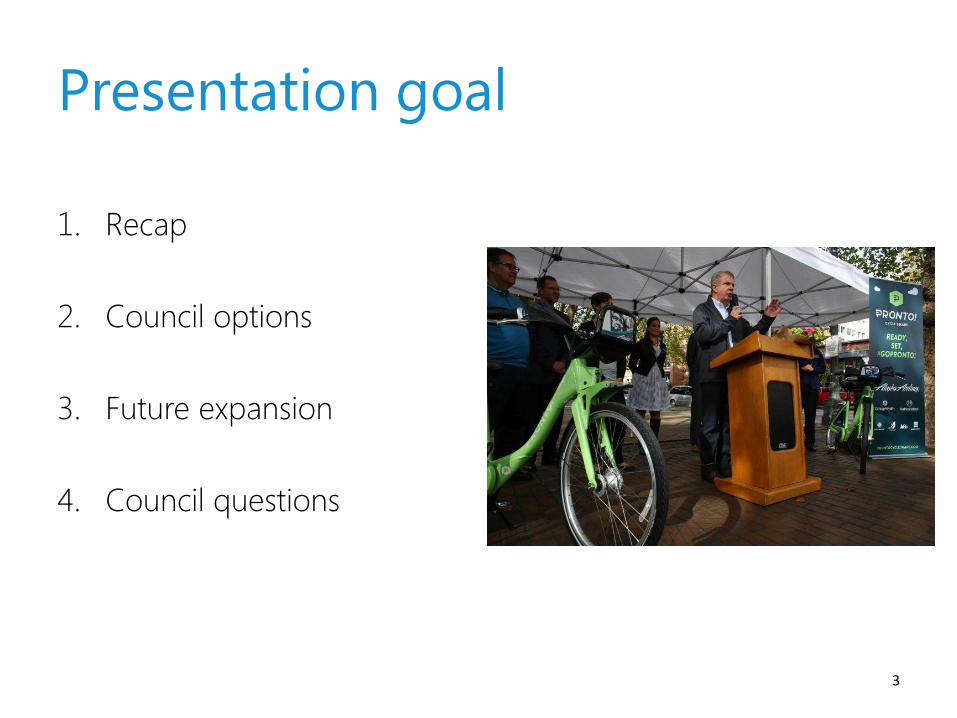
Partially lift proviso - $1.4M
Outcomes
1. City purchases Pronto bike
share assets
2. City becomes owner of system
3. City contracts/oversees
operator
4. Bike share stabilized and well-
positioned to expand
4

500 cities
5 continents
90 US municipalities
20 million US trips, 2015
Worldwide
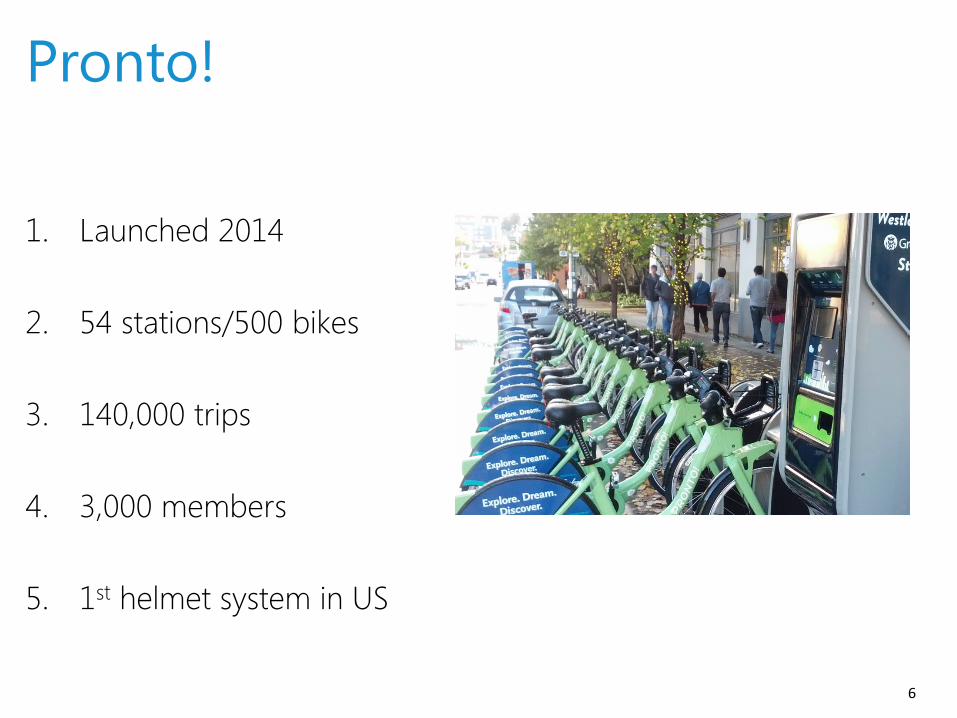
Pronto!
1. Launched 2014
2. 54 stations/500 bikes
3. 140,000 trips
4. 3,000 members
5. 1st helmet system in US
6

3-phase process
7
Phase I - Start-up
Original launch, 54
stations
2014-Present
Phase II - Stabilize
City assumes ownership
City oversees interim
operations
Feb-Dec 2016
Phase III - Expansion
Pending RFP and further
Executive and Council
approval
Summer 2017

Governance structure
8
Recommendation - Consistent with peer cities, adopt a public governance model.
The City will own the bike share equipment and contract with a third party for operations.
Public
(Government Owns &
3rd Party Operates)
•Cities - Boston, Chicago, London, Los
Angeles, Philadelphia, Washington DC
•Pros - City controls system and
oversees operator. City determines
station locations, prices, SLA's. City can
drive expansion to make bike share a
true extension of transit. Public systems
tend to be largest
•Cons - City responsible for some or all
of finances
•Best for - Larger cities invested in
making bike share part of the public
transportation system
Non-Profit
(Non-Profit Owns &
Operates)
•Cities - Aspen, Buffalo, Boulder,
Denver, Honolulu, Memphis,
Minneapolis
•Pros - City not responsible for finances.
Local operations can achieve lower
costs
•Cons - City minimal control or input.
City cannot drive expansion; systems
tend to be smaller
•Best for- Small and mid-sized cities
and systems where local operations
are feasible and cost-effective
Private
(For-Profit Owns &
Operates)
•Cities - NYC, Miami Beach
•Pros - City not responsible for finances
or management
•Cons - City minimal control or input.
For-profit goals not always aligned
with city’s
•Best for - Cities with exceptional
private revenue potential from
sponsorship, advertisements or tourists

Pronto needed to borrow funds to launch and therefore incurred debt
payments that require diverting revenue away from operations in out years
2016 Annual Operating and CIP Costs and Revenues: Pronto vs City-Owned
With Pronto Without Pronto/City Owned
Annual Costs - Total 2,081,545 1,426,545
Operator Contract 1,307,945 1,307,945
Other (primarily helmets) 83,600 83,600
Pronto Overhead 190,000 0
Pronto Debt Service Payments 500,000 0
SDOT Overhead $35,000 $35,000
Operating Revenues - Total 1,556,048 1,556,048
User Revenue 613,348 613,348
Annual Sponsorship 702,700 702,700
One-Time City Funding 240,000 240,000
Annual Net -525,497 129,503
Pronto vs City-Owned
9
10
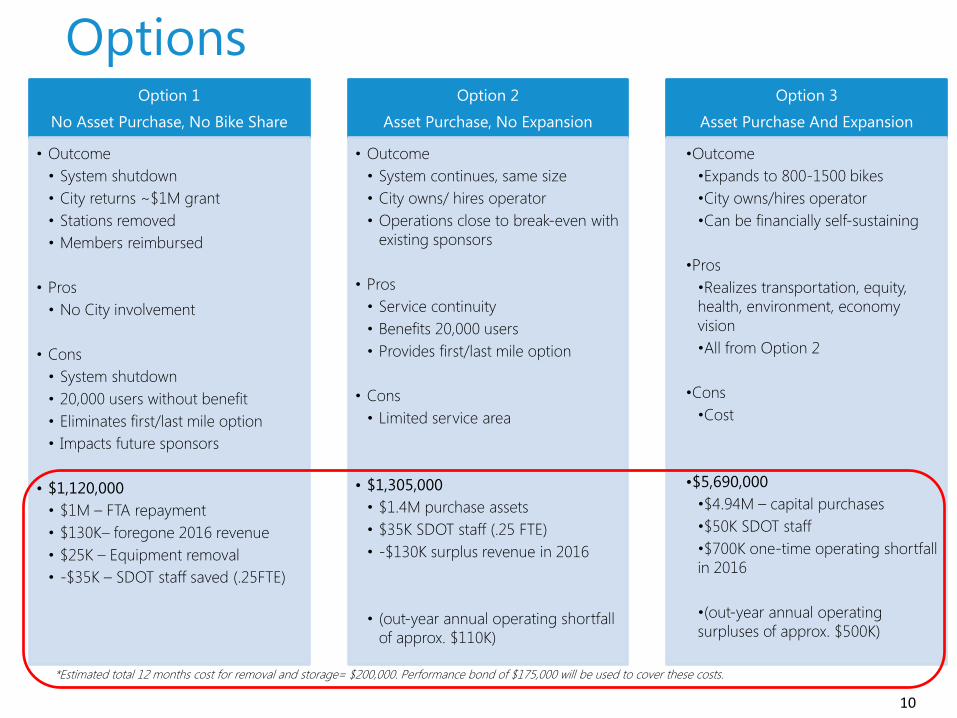
Option 1
No Asset Purchase, No Bike Share
• Outcome
• System shutdown
• City returns ~$1M grant
• Stations removed
• Members reimbursed
• Pros
• No City involvement
• Cons
• System shutdown
• 20,000 users without benefit
• Eliminates first/last mile option
• Impacts future sponsors
• $1,120,000
• $1M – FTA repayment
• $130K– foregone 2016 revenue
• $25K – Equipment removal
• -$35K – SDOT staff saved (.25FTE)
Option 2
Asset Purchase, No Expansion
• Outcome
• System continues, same size
• City owns/ hires operator
• Operations close to break-even with
existing sponsors
• Pros
• Service continuity
• Benefits 20,000 users
• Provides first/last mile option
• Cons
• Limited service area
• $1,305,000
• $1.4M purchase assets
• $35K SDOT staff (.25 FTE)
• -$130K surplus revenue in 2016
• (out-year annual operating shortfall
of approx. $110K)
Option 3
Asset Purchase And Expansion
•Outcome
•Expands to 800-1500 bikes
•City owns/hires operator
•Can be financially self-sustaining
•Pros
•Realizes transportation, equity,
health, environment, economy
vision
•All from Option 2
•Cons
•Cost
•$5,690,000
•$4.94M – capital purchases
•$50K SDOT staff
•$700K one-time operating shortfall
in 2016
•(out-year annual operating
surpluses of approx. $500K)
Options
*Estimated total 12 months cost for removal and storage= $200,000. Performance bond of $175,000 will be used to cover these costs.

Vision
City seeks to sustain and expand bike share
• Increases access to transportation
• Complements public transit
• Promotes active and healthy living
• Is environmentally friendly and equitable
• Supports the local economy
• Is financially sustainable
11
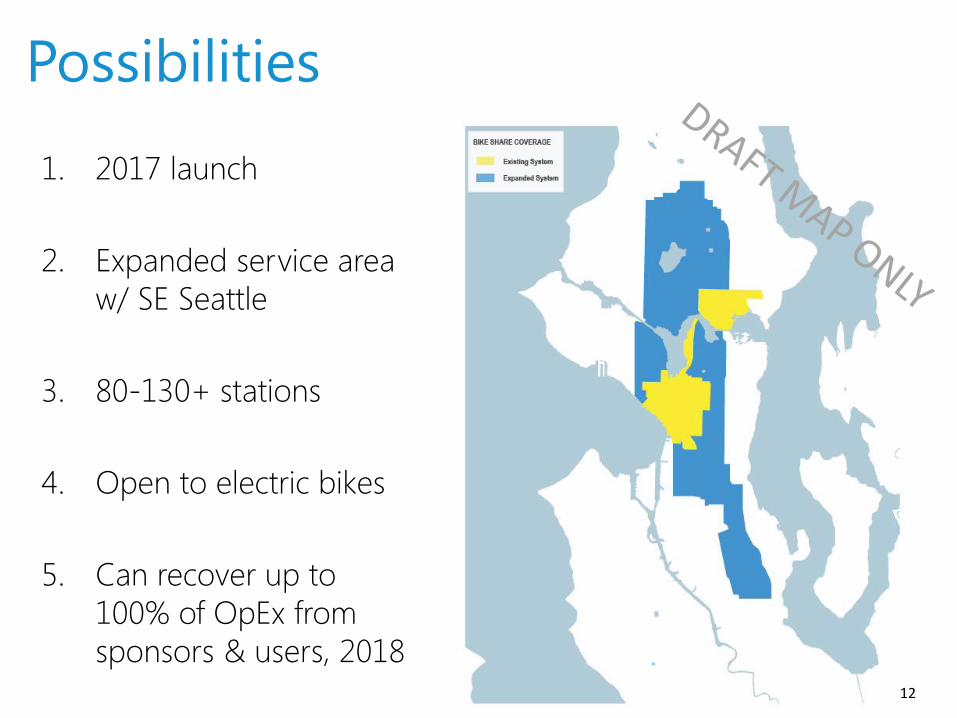
Possibilities
1. 2017 launch
2. Expanded service area
w/ SE Seattle
3. 80-130+ stations
4. Open to electric bikes
5. Can recover up to
100% of OpEx from
sponsors & users, 2018
12

Usage Projections
Expanded System (1,000 bikes)
1. 500,000+ trips
2. 8,000 members
3. $1.3M user revenue
Existing (500 bikes) 2015
1. 140,000 trips
2. 3,000 members
3. $675K user revenue
Ridership, Membership and Revenue
Projections
Annual
Total Trips 500,000
Annual Memberships Sold 8,000
Casual Memberships Sold 85,000
Revenue $1,300,000
13
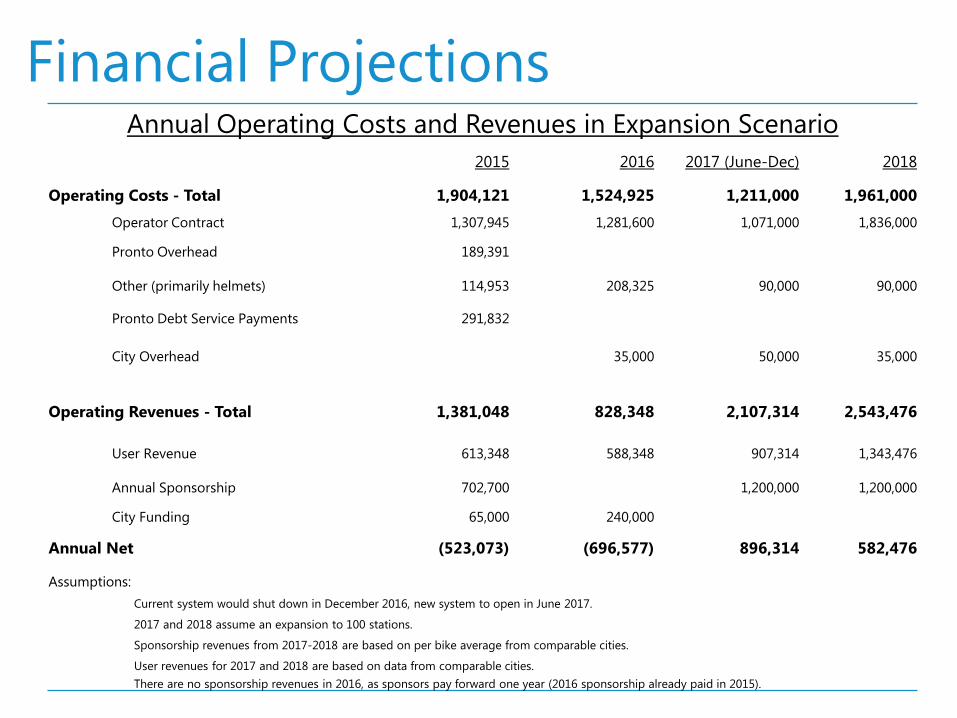
Annual Operating Costs and Revenues in Expansion Scenario
2015 2016 2017 (June-Dec) 2018
Operating Costs - Total 1,904,121 1,524,925 1,211,000 1,961,000
Operator Contract 1,307,945 1,281,600 1,071,000 1,836,000
Pronto Overhead 189,391
Other (primarily helmets) 114,953 208,325 90,000
90,000
Pronto Debt Service Payments 291,832
City Overhead 35,000 50,000
35,000
Operating Revenues - Total 1,381,048 828,348 2,107,314 2,543,476
User Revenue 613,348 588,348 907,314
1,343,476
Annual Sponsorship 702,700 1,200,000
1,200,000
City Funding 65,000 240,000
Annual Net (523,073) (696,577) 896,314 582,476
Assumptions:
Current system would shut down in December 2016, new system to open in June 2017.
2017 and 2018 assume an expansion to 100 stations.
Sponsorship revenues from 2017-2018 are based on per bike average from comparable cities.
User revenues for 2017 and 2018 are based on data from comparable cities.
There are no sponsorship revenues in 2016, as sponsors pay forward one year (2016 sponsorship already paid in 2015).
Financial Projections
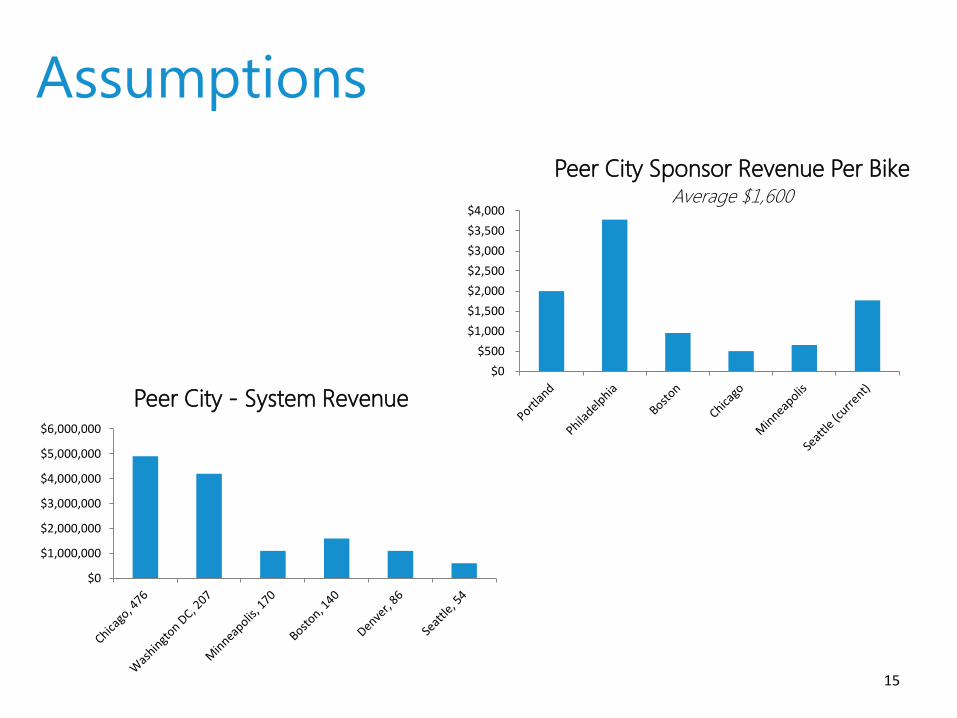
Assumptions
15
$0
$500
$1,000
$1,500
$2,000
$2,500
$3,000
$3,500
$4,000
Peer City Sponsor Revenue Per Bike Average $1,600
$0
$1,000,000
$2,000,000
$3,000,000
$4,000,000
$5,000,000
$6,000,000
Peer City - System Revenue
Financial Projections
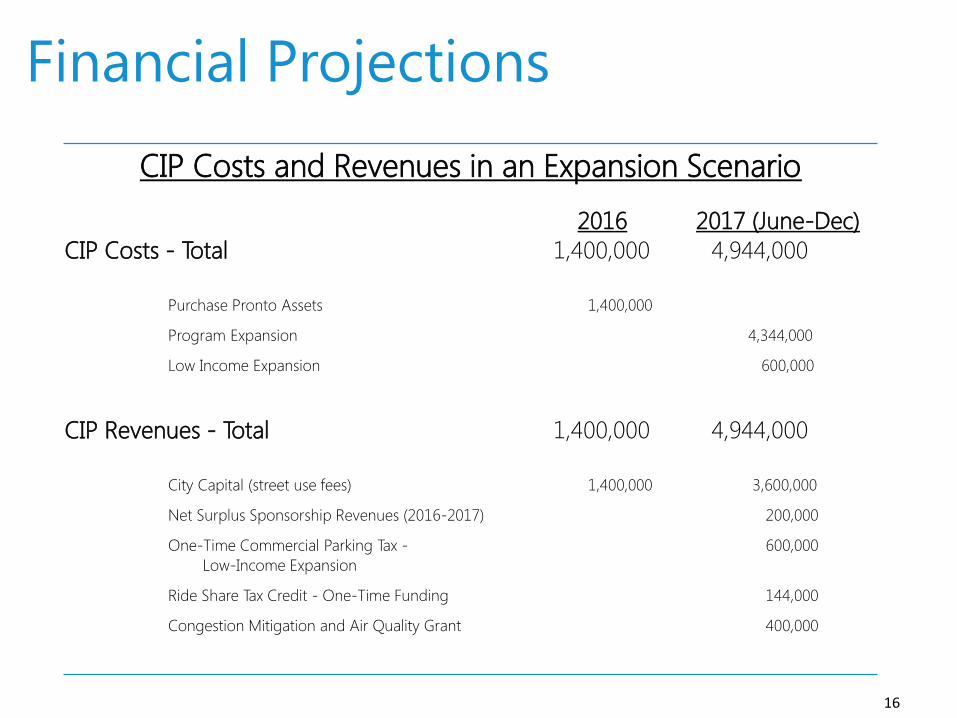
CIP Costs and Revenues in an Expansion Scenario
2016 2017 (June-Dec)
CIP Costs - Total 1,400,000 4,944,000
Purchase Pronto Assets 1,400,000
Program Expansion 4,344,000
Low Income Expansion 600,000
CIP Revenues - Total 1,400,000 4,944,000
City Capital (street use fees) 1,400,000 3,600,000
Net Surplus Sponsorship Revenues (2016-2017) 200,000
One-Time Commercial Parking Tax - 600,000
Low-Income Expansion
Ride Share Tax Credit - One-Time Funding 144,000
Congestion Mitigation and Air Quality Grant 400,000
16
Equipment
17
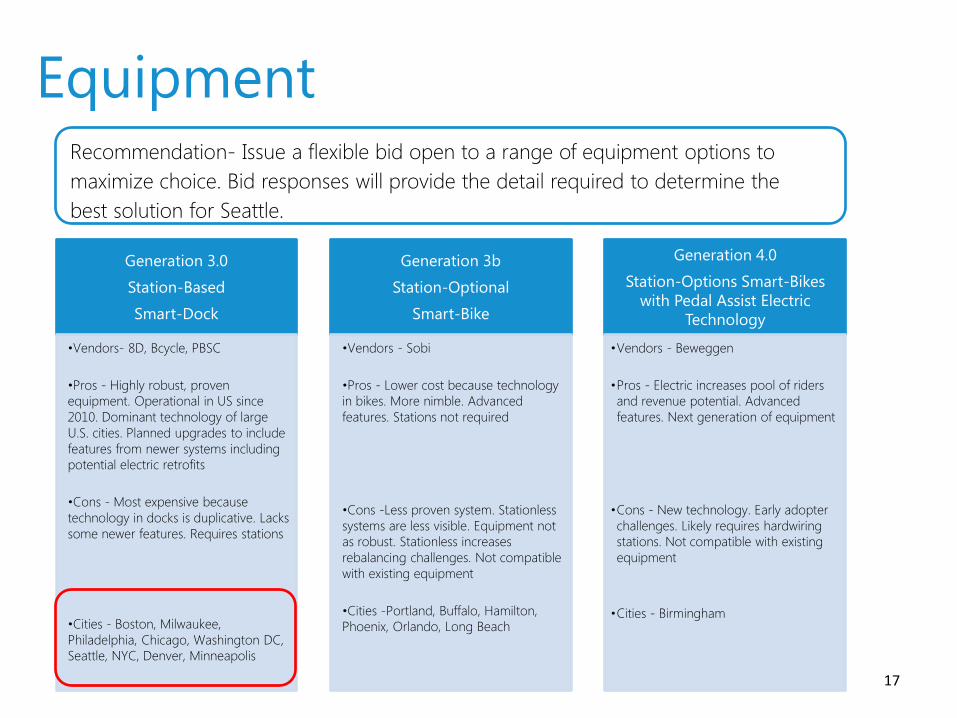
Generation 3.0
Station-Based
Smart-Dock
•Vendors- 8D, Bcycle, PBSC
•Pros - Highly robust, proven
equipment. Operational in US since
2010. Dominant technology of large
U.S. cities. Planned upgrades to include
features from newer systems including
potential electric retrofits
•Cons - Most expensive because
technology in docks is duplicative. Lacks
some newer features. Requires stations
•Cities - Boston, Milwaukee,
Philadelphia, Chicago, Washington DC,
Seattle, NYC, Denver, Minneapolis
Generation 3b
Station-Optional
Smart-Bike
•Vendors - Sobi
•Pros - Lower cost because technology
in bikes. More nimble. Advanced
features. Stations not required
•Cons -Less proven system. Stationless
systems are less visible. Equipment not
as robust. Stationless increases
rebalancing challenges. Not compatible
with existing equipment
•Cities -Portland, Buffalo, Hamilton,
Phoenix, Orlando, Long Beach
Generation 4.0
Station-Options Smart-Bikes
with Pedal Assist Electric
Technology
•Vendors - Beweggen
•Pros - Electric increases pool of riders
and revenue potential. Advanced
features. Next generation of equipment
•Cons - New technology. Early adopter
challenges. Likely requires hardwiring
stations. Not compatible with existing
equipment
•Cities - Birmingham
Recommendation- Issue a flexible bid open to a range of equipment options to
maximize choice. Bid responses will provide the detail required to determine the
best solution for Seattle.

Operations
18
•System owner pays flat fee for operations based on size
•Revenue remains with owner
•Owner has near full decision making authority Flat Fee
•System owner pays actual costs of operations plus
management fee
•Revenue remains with owner
•Owner retains full decision making authority
Time and
Management
•Owner and operator share revenue and risk
•Owner and operator share decisions Risk/Revenue
Share
•Operator takes full responsibility for operations costs
•Operator keeps majority of revenue
•Operator retains decision making authority beyond
contract terms
•Operator may own and/or be responsible for
equipment
Privatized
Operations
Recommendation- Combine operations and equipment into a single, flexible bid, open
to a range of financial models for operations.
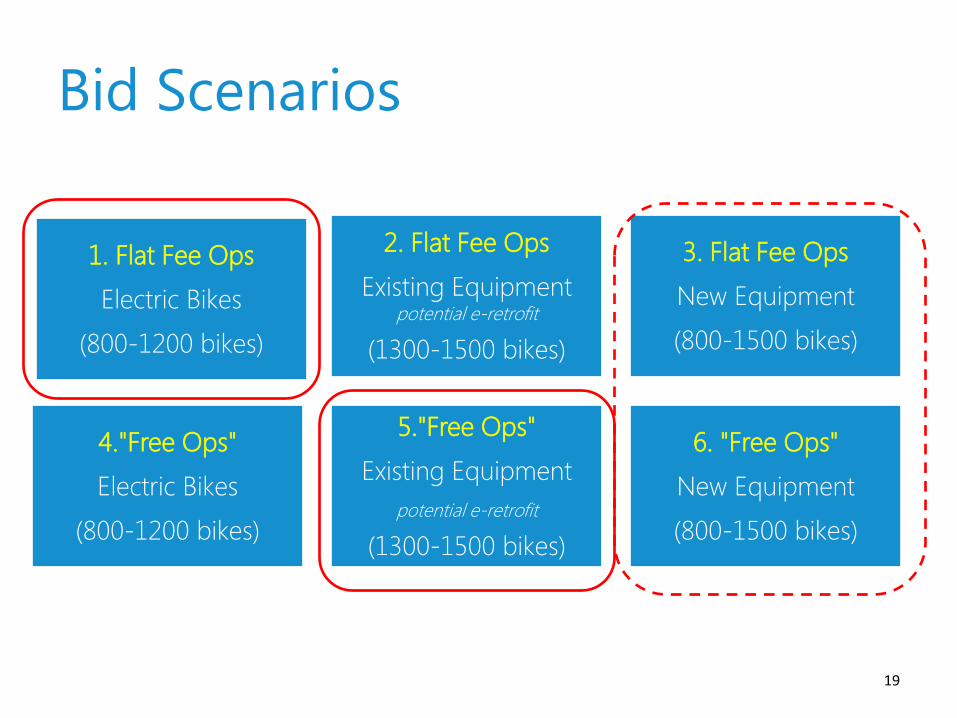
Bid Scenarios
19
1. Flat Fee Ops
Electric Bikes
(800-1200 bikes)
2. Flat Fee Ops
Existing Equipment potential e-retrofit
(1300-1500 bikes)
3. Flat Fee Ops
New Equipment
(800-1500 bikes)
4."Free Ops"
Electric Bikes
(800-1200 bikes)
5."Free Ops"
Existing Equipment
potential e-retrofit
(1300-1500 bikes)
6. "Free Ops"
New Equipment
(800-1500 bikes)
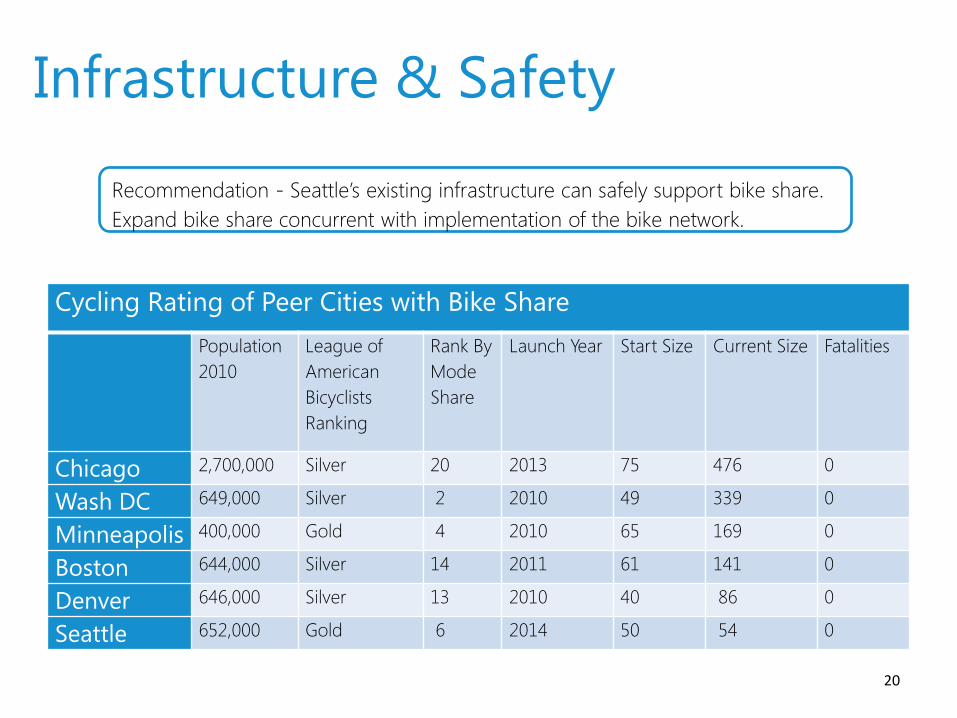
Infrastructure & Safety
20
Cycling Rating of Peer Cities with Bike Share
Population
2010
League of
American
Bicyclists
Ranking
Rank By
Mode
Share
Launch Year Start Size Current Size Fatalities
Chicago 2,700,000 Silver 20 2013 75 476 0
Wash DC 649,000 Silver 2 2010 49 339 0
Minneapolis 400,000 Gold 4 2010 65 169 0
Boston 644,000 Silver 14 2011 61 141 0
Denver 646,000 Silver 13 2010 40 86 0
Seattle 652,000 Gold 6 2014 50 54 0
Recommendation - Seattle’s existing infrastructure can safely support bike share.
Expand bike share concurrent with implementation of the bike network.
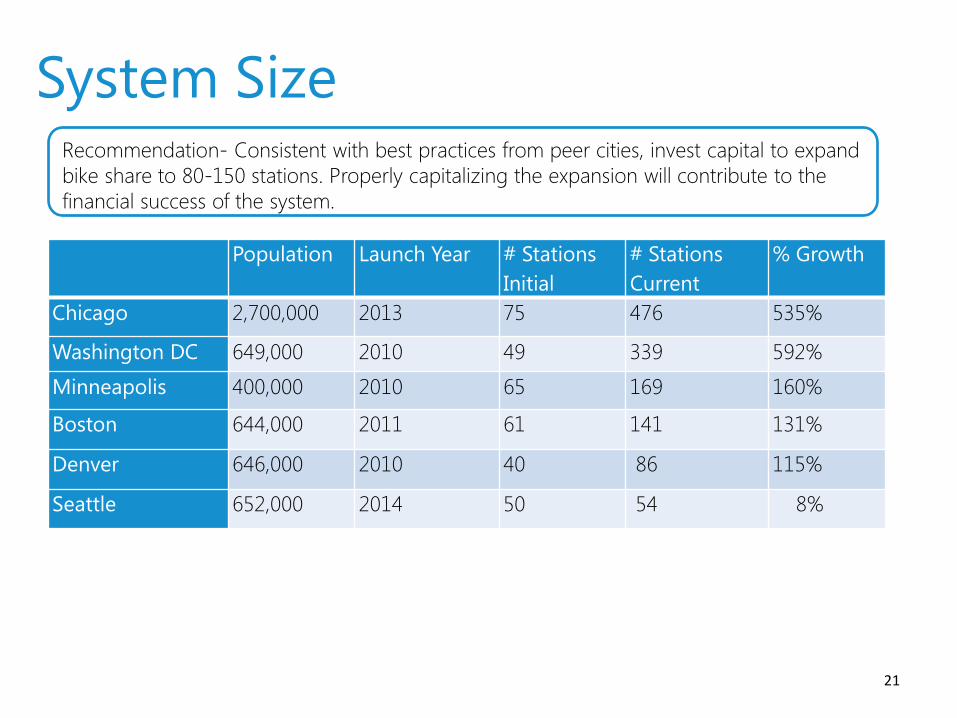
System Size
21
Recommendation- Consistent with best practices from peer cities, invest capital to expand
bike share to 80-150 stations. Properly capitalizing the expansion will contribute to the
financial success of the system.
Population Launch Year # Stations
Initial
# Stations
Current
% Growth
Chicago 2,700,000 2013 75 476 535%
Washington DC 649,000 2010 49 339 592%
Minneapolis 400,000 2010 65 169 160%
Boston 644,000 2011 61 141 131%
Denver 646,000 2010 40 86 115%
Seattle 652,000 2014 50 54 8%
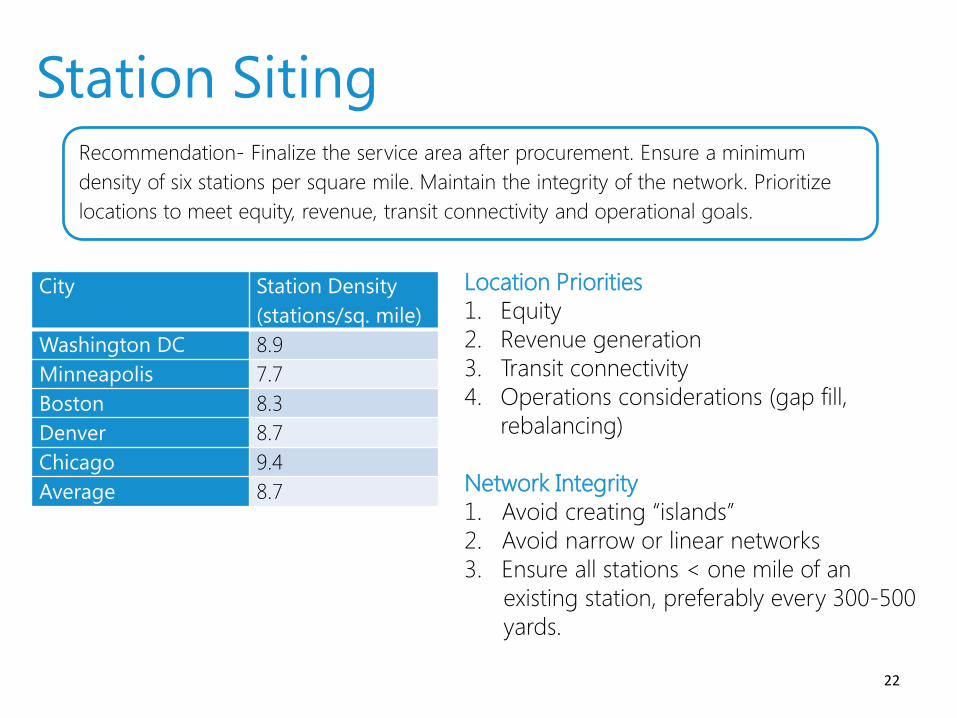
Station Siting
22
Recommendation- Finalize the service area after procurement. Ensure a minimum
density of six stations per square mile. Maintain the integrity of the network. Prioritize
locations to meet equity, revenue, transit connectivity and operational goals.
City Station Density
(stations/sq. mile)
Washington DC 8.9
Minneapolis 7.7
Boston 8.3
Denver 8.7
Chicago 9.4
Average 8.7
Location Priorities
1. Equity
2. Revenue generation
3. Transit connectivity
4. Operations considerations (gap fill,
rebalancing)
Network Integrity
1. Avoid creating “islands”
2. Avoid narrow or linear networks
3. Ensure all stations < one mile of an
existing station, preferably every 300-500
yards.

Marketing
23
Recommendation- Implement a comprehensive marketing program
emphasizing corporate memberships.
Recommendation- Locate a minimum 20% of stations in low-
income neighborhoods, extending into southeast Seattle, as
possible. Implement a suite of equity programs including a low-
income membership program.
Equity
24
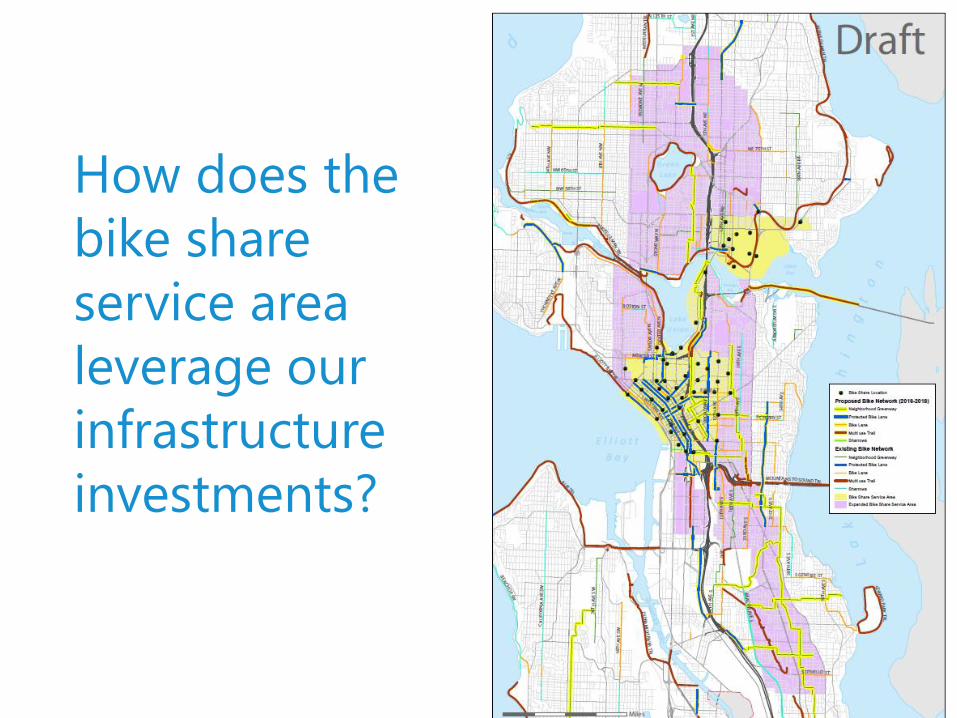
How does the
bike share
service area
leverage our
infrastructure
investments?

Summary
25
What are we getting for $1.4M
We will purchase 26 stations from Pronto as well as well as all remaining
assets including: spare parts, vehicles, tools, helmets and equipment.
Total Bike Share
Assets
Pronto Owned
Assets
On-street Station Equip $ 2,061,234 $ 1,061,234
Helmet Services $ 128,729 $ 128,729
Station Services $ 61,711 $ 61,711
Bike Department $ 602,081 $ 602,081
Deployment $ 8,258 $ 8,258
Rebalancing/Dispatch $ 110,341 $ 110,341
Spare Station Equipment $ 119,395 $ 119,395
$ 3,091,750 $ 2,091,750


![Bike Share: Council Briefing #2 · 2/19/2016 · Microsoft PowerPoint - Presentation - CC Briefing Bike Share Feasibility v5 FINAL 2016.02.19.pptx [Read-Only] Author: SheridR Created](https://img.pdfslide.us/doc/110x75/60573932baf76812b214ec3b/bike-share-council-briefing-2-2192016-microsoft-powerpoint-presentation.jpg)