Embed Size (px)
Citation preview
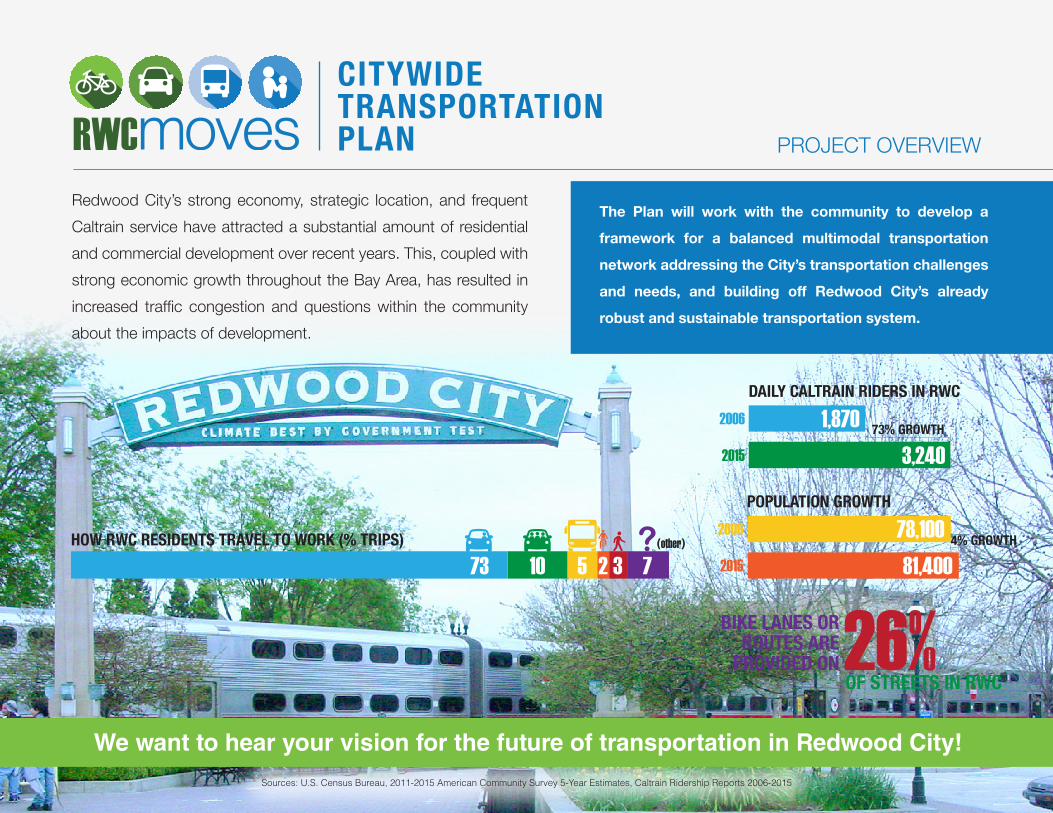
251073 3 7HOW RWC RESIDENTS TRAVEL TO WORK (% TRIPS)
CITYWIDE TRANSPORTATION PLAN PROJECT OVERVIEW
Redwood City’s strong economy, strategic location, and frequent
Caltrain service have attracted a substantial amount of residential
and commercial development over recent years. This, coupled with
strong economic growth throughout the Bay Area, has resulted in
increased traffic congestion and questions within the community
about the impacts of development.
Sources: U.S. Census Bureau, 2011-2015 American Community Survey 5-Year Estimates, Caltrain Ridership Reports 2006-2015
We want to hear your vision for the future of transportation in Redwood City!
POPULATION GROWTH
2006
2015
78,10081,400
DAILY CALTRAIN RIDERS IN RWC
73% GROWTH2006
2015
1,8703,240
4% GROWTH
The Plan will work with the community to develop a
framework for a balanced multimodal transportation
network addressing the City’s transportation challenges
and needs, and building off Redwood City’s already
robust and sustainable transportation system.
BIKE LANES OR ROUTES ARE
PROVIDED ONOF STREETS IN RWC26%
(other)
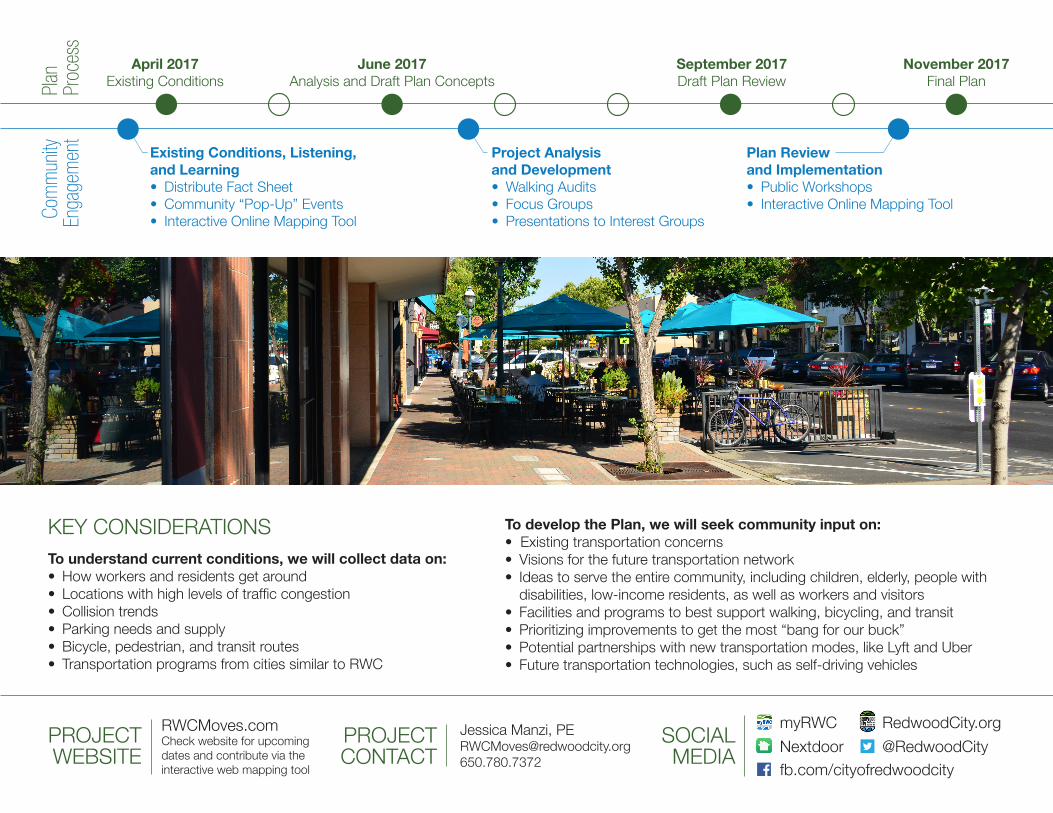
Existing Conditions, Listening, and Learning• Distribute Fact Sheet• Community “Pop-Up” Events• Interactive Online Mapping Tool
Plan Review and Implementation• Public Workshops• Interactive Online Mapping Tool
Project Analysis and Development• Walking Audits• Focus Groups• Presentations to Interest Groups
KEY CONSIDERATIONS
PROJECTWEBSITE
PROJECT CONTACT
SOCIALMEDIA
Plan
Proc
ess
RWCMoves.comCheck website for upcoming dates and contribute via the interactive web mapping tool
Jessica Manzi, [email protected]
myRWC
Nextdoor
To understand current conditions, we will collect data on:• How workers and residents get around• Locations with high levels of traffic congestion• Collision trends• Parking needs and supply• Bicycle, pedestrian, and transit routes• Transportation programs from cities similar to RWC
April 2017Existing Conditions
November 2017Final Plan
June 2017Analysis and Draft Plan Concepts
September 2017Draft Plan Review
Com
mun
ity
Enga
gem
ent
To develop the Plan, we will seek community input on: • Existing transportation concerns• Visions for the future transportation network• Ideas to serve the entire community, including children, elderly, people with
disabilities, low-income residents, as well as workers and visitors• Facilities and programs to best support walking, bicycling, and transit• Prioritizing improvements to get the most “bang for our buck”• Potential partnerships with new transportation modes, like Lyft and Uber• Future transportation technologies, such as self-driving vehicles
RedwoodCity.org
@RedwoodCity fb.com/cityofredwoodcity
![[moves] - Neo-Arcadia · moves, perform the motions of the moves using the buttons indicated to feint. Certain moves use alternate motions, they Certain moves use alternate motions,](https://img.pdfslide.us/doc/110x75/5e12441e05bfe76b6d1b9697/moves-neo-moves-perform-the-motions-of-the-moves-using-the-buttons-indicated.jpg)
![[moves] - Neo-Arcadianeo-arcadia.com/neoencyclopedia/3_count_bout_moves.pdf · 3 Count Bout [moves] ... Standing Moves Hell Stabs Low Hell Stab tap Knife Attack ... Grapple Moves](https://img.pdfslide.us/doc/110x75/5adf634d7f8b9ab4688c1265/moves-neo-arcadianeo-count-bout-moves-standing-moves-hell-stabs-low-hell.jpg)

![[moves] - SátiradeCamilo · Desperation Moves BariBari Vulcan Punch Umanori Vulcan Punch Super Desperation Moves BariBari Vulcan Punch Hidden Super Desperation Moves Umanori Ultimate](https://img.pdfslide.us/doc/110x75/5e62005b6841776ac4332d47/moves-stiradecamilo-desperation-moves-baribari-vulcan-punch-umanori-vulcan.jpg)