Embed Size (px)
Citation preview

BigIdea
Investigation 10 S125
Interactions 4INVESTIGATION 10
ENERGY DYNAMICSWhat factors govern energy capture, allocation, storage, and transfer between producers and consumers in a terrestrial ecosystem?
■ BACKGROUNDAlmost all life on this planet is powered, either directly or indirectly, by sunlight. Energy captured from sunlight drives the production of energy-rich organic compounds during the process of photosynthesis. These organic compounds create biomass. The net amount of energy captured and stored by the producers in a system is the system’s net productivity. Gross productivity is a measure of the total energy captured. In terrestrial systems, plants play the role of producers. Plants allocate that biomass (energy) to power their life processes or to store energy. Different plants have different strategies of energy allocation that reflect their role in various ecosystems. For example, annual weedy plants allocate a larger percentage of their biomass production to reproductive processes and seeds than do slower growing perennials. As plants, the producers are consumed or decomposed, and their stored chemical energy powers additional individuals, the consumers, or trophic levels of the biotic community. Biotic systems run on energy much as economic systems run on money. Energy is generally in limited supply in most communities. Energy dynamics in a biotic community is fundamental to understanding ecological interactions.
To model ecosystem energy dynamics, you will estimate the net primary productivity (NPP) of Wisconsin Fast Plants (the producers) growing under lights and the flow of energy from plants to cabbage white butterfly larvae (the consumers) as the larvae eat cabbage-family plants.
The following exercises describe skills and methods for estimating energy flow in a terrestrial ecosystem. Note and record any questions that occur to you as you work through this activity.
Questions might include the following:• What kinds of things affect plant productivity, the growth of cabbage white butterfly
larvae, or the interactions of these organisms? • How do you keep track of energy as it moves through the biological system? Can the
techniques used for tracking energy be improved?• What is the role of energy in ecosystems?
3p0
S126 Investigation 10
One or more of these questions will help guide you through the final part of this laboratory, where you are expected to carry out your own research project based on one of your questions.
■ Learning Objectives• To design and conduct an experiment to investigate a question about energy capture
and flow in an ecosystem• To explain community/ecosystem energy dynamics, including energy flow, NPP, and
primary and secondary producers/consumers• To predict interspecific ecological interactions and their effects• To use mathematical analyses in energy accounting and community modeling• To make the explicit connection between biological content and the investigative
experience
■ General Safety Precautions• Cabbage white butterflies (Pieris rapae) are listed as a pest species by the USDA.
Therefore, no butterflies or larvae raised in the laboratory should be released to the wild.
• Euthanize the butterflies or larvae by freezing them when your investigation is complete. The plants and soil can simply be discarded.
• Disease outbreaks are common in cultured populations of organisms. Although the diseases associated with the organisms in this investigation are not dangerous to humans, it is important to maintain cleanliness in the laboratory and of your experimental equipment to minimize possible impacts on the study caused by disease.
• Long-term culturing for plants or butterflies requires cleanliness. Be sure to clean all culturing chambers and wipe them down with dilute Clorox (and dry completely) before starting another generation of plants or butterflies. Use new materials if you have any doubts.
• Cultures involve artificial light sources and liquids; caution should be exercised to keep the two separate.

Investigation 10 S127
BIG IDEA 4: INTERACTIONS
■ THE INVESTIGATIONS
■ Getting StartedThese questions and tasks are designed to help you understand energy dynamics and prepare for your investigations.
1. The economy of a business or household is somewhat like the energetics of a biological community. A well-run household or business creates a budget based on a careful accounting of money coming in and money going out. Likewise, the energy dynamics of a biological community can be modeled by accounting for the energy coming in and going out through different members of the community. Keeping track of money is relatively straightforward — you count it. You count how much money is coming in and how much is going to various expenses and savings. How do you keep track of energy in living organisms? It is a challenge. Producers capture light energy and convert it into chemical energy stored in energy-rich molecules. These molecules have mass, so the energy in biological systems can be indirectly measured by mass — biomass. With your lab team, take a moment to brainstorm how you can account for energy use and, in a biological community, transfer it in a manner similar to the ways in which people account for money.
2. This investigation requires you to take care of and maintain healthy populations of living organisms — plants and animals. In fact, before you begin this investigation, you will need to start both plant and animal cultures. Wisconsin Fast Plants and cabbage white butterflies are both easily raised in the classroom or laboratory. Neither takes up much time or equipment, but they both need to be tended regularly. As a lab team, discuss the care and maintenance of the organisms you use in this lab. Prepare a schedule and divide up responsibilities for long-term care and maintenance. (This includes taking care of animal wastes.) Check out online information on care and maintenance of the organisms you and your teacher select for this investigation at http://fastplants.ning.com/video/2038532:Video:13 and http://fastplants.ning.com/video/juan-enriquez-wants-to-grow. See the butterfly life cycle in Figure 1.

S128 Investigation 10
Adult
Egg
Pupa
Growth of larva
Figure 1. Butterfly Life Cycle
■ Procedures
Estimating Net Primary Productivity (NPP) of Fast PlantsRemember as you work through the first part of this investigation to think about and record questions you ask while working with these organisms and the system.
Primary productivity is a rate — energy captured by photosynthetic organisms in a given area per unit of time. Based on the second law of thermodynamics, when energy is converted from one form to another, some energy will be lost as heat. When light energy is converted to chemical energy in photosynthesis or transferred from one organism (a plant or producer) to its consumer (e.g., an herbivorous insect), some energy will be lost as heat during each transfer.
In terrestrial ecosystems, productivity (or energy capture) is generally estimated by the change in biomass of plants produced over a specific time period. Measuring biomass or changes in biomass is relatively straightforward: simply mass the organism(s) on an appropriate scale and record the mass over various time intervals. The complicating factor is that a large percentage of the mass of a living organism is water — not the energy-rich organic compounds of biomass. Therefore, to determine the biomass at a particular point in time accurately, you must dry the organism. Obviously, this creates a problem if you wish to take multiple measurements on the same living organism. Another issue is that different organic compounds store different amounts of energy; in proteins and carbohydrates it is about 4 kcal/g dry weight and in fats it is 9 kcal/g of dry weight). As you plan your own investigation, take into consideration all the above information.
Investigation 10 S129
BIG IDEA 4: INTERACTIONS
You and your teacher will select a model organism for this lab depending on time of year, availability, and cost. The following steps assume that you and your lab team are culturing about 30 to 40 Wisconsin Fast Plants as a model organism. Other plants can be used instead, including wild or native plants, but check with your teacher first.
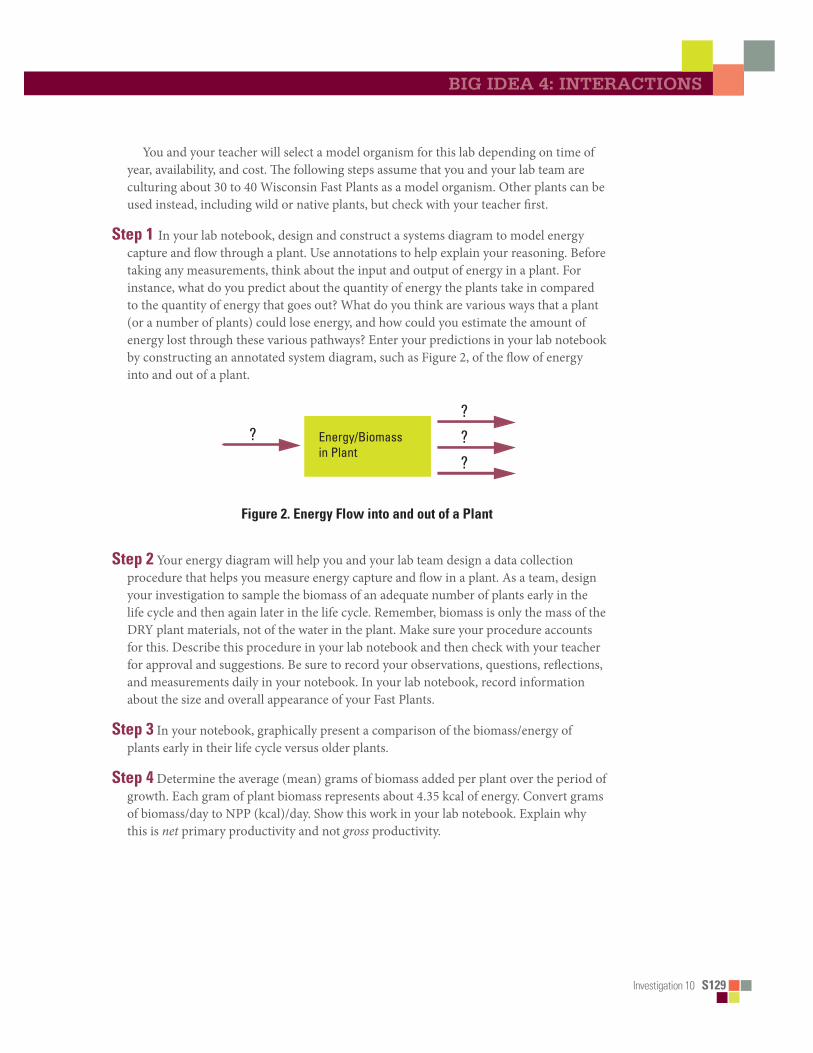
Step 1 In your lab notebook, design and construct a systems diagram to model energy capture and flow through a plant. Use annotations to help explain your reasoning. Before taking any measurements, think about the input and output of energy in a plant. For instance, what do you predict about the quantity of energy the plants take in compared to the quantity of energy that goes out? What do you think are various ways that a plant (or a number of plants) could lose energy, and how could you estimate the amount of energy lost through these various pathways? Enter your predictions in your lab notebook by constructing an annotated system diagram, such as Figure 2, of the flow of energy into and out of a plant.
Energy/Biomass in Plant
? ??
?
Energy/Biomass Butterfly Larvae
? ??
?
Figure 2. Energy Flow into and out of a Plant
Step 2 Your energy diagram will help you and your lab team design a data collection procedure that helps you measure energy capture and flow in a plant. As a team, design your investigation to sample the biomass of an adequate number of plants early in the life cycle and then again later in the life cycle. Remember, biomass is only the mass of the DRY plant materials, not of the water in the plant. Make sure your procedure accounts for this. Describe this procedure in your lab notebook and then check with your teacher for approval and suggestions. Be sure to record your observations, questions, reflections, and measurements daily in your notebook. In your lab notebook, record information about the size and overall appearance of your Fast Plants.
Step 3 In your notebook, graphically present a comparison of the biomass/energy of plants early in their life cycle versus older plants.
Step 4 Determine the average (mean) grams of biomass added per plant over the period of growth. Each gram of plant biomass represents about 4.35 kcal of energy. Convert grams of biomass/day to NPP (kcal)/day. Show this work in your lab notebook. Explain why this is net primary productivity and not gross productivity.

S130 Investigation 10
Step 5 Explain in your notebook why the mass of dry plants is a better measure of primary productivity and biomass than is the mass of living plants (containing water). What percentage of the living plants is biomass? (Use this calculation in Analyzing and Evaluating Results, Step 4.)
Step 6 Now reconstruct your energy flow diagram with actual data that you have collected in your notebook. Be sure to include an explanation, supported by evidence, as to why you feel your diagram represents energy flow in Fast Plants. Your explanation should also include a description of the uncertainties of your data and your conclusions; put boundaries on your conclusions (as you would insert error bars).
Estimating Energy Flow Between Fast Plants Producers and Cabbage Butterfly Larvae
Don’t forget to think of and record questions about these organisms and the system as you work through your investigation.
Step 1 Cabbage white butterfly larvae eat plants from the cabbage family. As with Fast Plants, accounting for energy flow into and out of these butterflies can be inferred from biomass gained and lost. In your lab notebook, develop a system diagram, such as Figure 3, to model energy flow from Fast Plants to cabbage butterfly larvae. Before taking any measurements, predict the input and the output of energy in the butterfly larvae you will be growing. Enter these predictions in your lab notebook.
Energy/Biomass in Butterfly Larvae
? ??
?
Figure 3. Energy Flow from Fast Plants to Cabbage Butterfly Larvae
Step 2 As butterfly larvae grow toward maturity, they pass through different developmental stages called instars. You will use larvae that are already well along their developmental path through the larval stages (4th or 5th instar). These larvae first grew on young Fast Plants, and they were later transferred to brussels sprouts (another member of the cabbage family) in a Brassica Barn (see Figure 4). For this part of the investigation, you and your lab team need to develop a procedure that will quantify the growth of butterfly larvae over three days. Start with freshly massed brussels sprouts in the Brassica Barn.

Investigation 10 S131
BIG IDEA 4: INTERACTIONS
Caterpillar feedingon brussels sprout
Frass
Paper towel frass pad
Figure 4. Brassica Barn
Step 3 Create a table in your lab notebook that helps you organize the data collected, including estimates of the energy/biomass flow from plants to butterfly larvae. Develop your procedure keeping in mind your end goal — to measure the biomass consumed by the larvae, the biomass gained by the larvae, and the biomass lost by the larvae. Likely, you’ll need to estimate some factors using data from a large sample. Don’t forget about the energy in the frass (wastes).
Step 4 Transfer the larvae to another Brassica Barn to finish out their life cycle.
■ Analyzing and Evaluating ResultsConvert biomass measurements (grams) to energy units in kilocalories. Work in small groups to determine how best to complete the following tasks. Make sure that all your units are comparable: per time, mass, and energy.
Step 1 For Fast Plants, assume that one gram of dried biomass contains 4.35 kilocalories of energy. This estimate was determined by burning similar plant material in a bomb calorimeter.
Step 2 You were investigating living butterfly larvae, so you could not dry them or their food supply. Assume that the biomass of 4th instar larvae is 40% of the wet mass. (This estimate may be inaccurate, so you should actually measure this quantity using extra butterfly larvae, if possible.) Calculate the biomass of the larvae. For butterfly larvae, use an average value of 5.5 kcal/g of biomass to calculate energy of each larva.

S132 Investigation 10
Step 3 To determine the energy content in the larval frass, use 4.76 kcal of energy/g of frass. Calculate the frass lost per individual larva.
Step 4 To determine the energy content of the brussels sprouts eaten by each larva, convert the wet mass of the sprout to dry mass and multiply by 4.35 kcal/g. Use the estimated percentage of biomass (dry mass) in fresh Fast Plants calculated in estimating the Fast Plants’ net primary productivity (NPP), Step 5 on page S130, to estimate the biomass of each brussels sprout.
Step 5 These procedures are similar to an energy audit. Because energy is neither created nor destroyed, you must account for all energy in the system. (That is why you need to determine frass mass.) Combine your two earlier energy flow diagrams into one, and now include all the information that you measured. For those energy pathways that you did not explicitly measure, provide an estimated energy quantity. For instance, the amount of light energy in the system is more difficult to estimate. What other parts of the energy flow diagram could you not actually measure?
Step 6 Graph your results. For the plants and for the butterfly larvae, design and construct appropriate graphs of your results. Enter sketches of these graphs in your lab notebook and prepare more finished copies for your mini-poster presentation when you complete this lab. If you use bar graphs for illustrating the means, standard error bars should be included to display the range of the data. In your notebook (and mini-poster presentation), describe the data and their presentation. Follow that with conclusions that you can support with your data about energy capture and flow in this artificial lab community.
■ Designing and Conducting Your InvestigationIn the previous procedures, you began to develop your skills by applying methods to the problem of energy capture and flow in an ecosystem. You were encouraged to note and record questions about this system as you worked through the investigation. Now it is time to select one of those questions, propose your hypothesis, design your investigation, and carry it out. Be sure to connect your work to your overall understanding of energy and ecosystems.
The following are questions that could be investigated; however, you should have developed your own question(s) and considered a possible investigation(s).• Do all plants have the same percentage of biomass? • Is the percentage of biomass the most important characteristic of a plant in terms of
its effect on the growth of an animal? • How do plants with different life strategies allocate biomass in different organs? • How much is allocated to reproduction? • How much energy is allocated to plant defense? • How much energy does it cost an animal to process different plant sources?

Investigation 10 S133
BIG IDEA 4: INTERACTIONS
Review and consolidate your questions into a list of possibilities. Consult with your teacher and other students. After choosing your question, hypothesis, and design, submit the plan (proposal) for your investigation to your teacher for approval. Be sure to refer to the rubric provided by your teacher that will be used to evaluate your work. Consider working as a team on a single question to reduce your overall workload.
Step 1 Conduct your investigation or construct and test your mathematical model.
Step 2 Prepare a mini-poster that addresses the requirements outlined in the rubric.
Step 3 Present your mini-poster to your peers and invited guests in class. Encourage your peers to review and critique your work based on the rubric guidelines. Use those reviews to improve your mini-poster after the presentation. Your teacher will use the same rubric, along with your lab notebook, to determine your final grade for this investigation.