Embed Size (px)
Citation preview

1
Bigger Than Life
1 MSFT Microsoft Corporation 273.4B 2 ORCL Oracle Corporation 62.9B 3 SAP SAP Aktiengesellschaft 32.0B 4 ERTS Electronic Arts Inc. 8.8B 5 CA Computer Associates International, Inc. 8.5B ─ ATVI Activision, Inc. 0.95B─ TTWO Take-Two Interactive Sft. 0.95B
Market Capitalization: Software Companies

2
Revenue Breakdown: Divisions
EA Sports, 35%
EA Sports Big, 7%The Sims, 8%Major Entertainment
Licenses, 16%
Other Major Titles, 12%
Other Titles, 2.50%
Affiliated Label, 15%EA.com, 4.50%
PS2, 37%
PC, 19%Xbox, 9%
Gamecube, 8%
PS1, 4%
GBA, 4%
Affiliated Label, 15%Other, 4%
Revenue Breakdown: Platforms

3
Survival TacticsBrand EquityEconomies of Scale– Portability– Marketing
Internal Development
EA SportsConsistent salesVery profitable– 8-20% royalty fees– $3-4MN development cost vs. $5-8MN standard– 75% of EA Sports developed in-house
Brand equity: It’s in the Game

4
The Power of the NameEA SPORTS SEGA
Sport Rating Sales Rating Sales
NFL Football 92.3% 2,525,161 91.6% 383,979
NCAA Football 90.5% 900,468 72.4% 106,027
NBA Basketball 83.6% 761,156 91.2% 304,414
NCAA Basketball 73.1% 158,197 83.0% 57,904
NHL Hockey 80.5% 262,589 89.4% 60,236
EA Sports Market Shares
0%
10%
20%
30%
40%
50%
60%
70%
80%
90%
CollegeFootball
Soccer Pro Football Golf Hockey ProBasketball
CollegeBasketball
Boxing Baseball
MVP Baseball: 83.5% / Currently #2 in Sales

5
EA Sport BigHigh margins– Internal development– Low royalty
NBA Street– 1.2MN in sales– NBA Street 2 expected to sell 1 – 1.5MN
SSX Franchise– 1.1MN in sales
Def Jam Vandetta– 84.8% Composite Score (GameRankings.com)
Blood & GutsMedal of Honor– 4.4MN Sold– Two new titles due out this year
Command & Conquer– 2.6MN Sold– C&C: Generals currently #2 in North America– Another title expected Q4 FY04
Need for Speed– 5.7MN Sold– End of franchise?
6
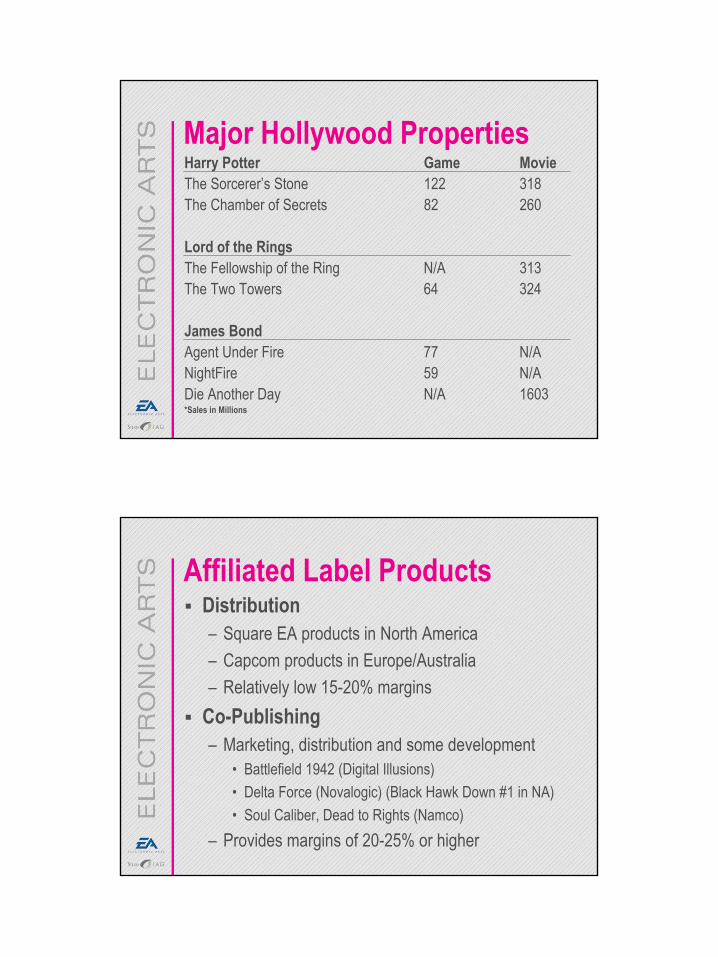
Major Hollywood PropertiesHarry Potter Game MovieThe Sorcerer’s Stone 122 318The Chamber of Secrets 82 260
Lord of the RingsThe Fellowship of the Ring N/A 313The Two Towers 64 324
James BondAgent Under Fire 77 N/ANightFire 59 N/ADie Another Day N/A 1603*Sales in Millions
Affiliated Label ProductsDistribution– Square EA products in North America– Capcom products in Europe/Australia– Relatively low 15-20% margins
Co-Publishing– Marketing, distribution and some development
• Battlefield 1942 (Digital Illusions)• Delta Force (Novalogic) (Black Hawk Down #1 in NA)• Soul Caliber, Dead to Rights (Namco)
– Provides margins of 20-25% or higher

7
Fun on the Small Screen
0
5
10
15
20
25
30
35
40
2000 2001 2002 2003E
Gamecube Xbox PS2

8
Living Another LifeSony Online Entertainment– Everquest / Everquest II– Planetside– Star Wars Galaxies
Vivendi Games– Dark Age of Camelot– World of Warcraft / Warcraft / Starcraft– Counter-Strike
The Online Adventures of EAEA.com Pro Forma EPS
$400MN in operating losses since inception$1.1BN in operating profit for EA’s core businessConsolidation of EA.com into core will boost profitsHas created experience and existing infrastructure
($0.44)FY03E
($0.34)($0.57)($0.75)($0.24)($0.05)($0.05)FY04EFY02`FY01FY00FY99FY98

9
Rolling in Greens1.4BN in cash expected by end FY03Absolutely no debt to pay downRecommendation: Acquire Vivendi Games– Creates online
presence tocombat Sony
– Subscription basedgaming is theway of the future
Other Possible TargetsEidos (British)– Once high-riding Tomb Raider publisher/developer– Tomb Raider: Angel of Darkness coincides with new Tomb
Raider film (starring Angelina Jolie)Take-Two– Grand Theft Auto franchise– Max Payne / Duke Nukem
Activision (Too large? Anti-trust?)Infogrames (French; Deep in debt)Ubi Soft (Canadian)– Tom Clancy franchise (Splinter Cell, Rainbow Six)

10
Success of Past Acquisitions
$156.8MNMedal of Honor, Jurassic Park
$10MN2/00DreamWorks
$107.2MNCommand & Conquer, Dune
$123MN11/98Westwood
$324.7MNThe Sims,Sim City
$125MN7/97Maxis
U.S. SalesTitlesPriceDateCompany
RisksSony/Microsoft may develop more in-houseNintendo slowly leaves marketLong-term uncertainties for product linesFuture entertainment licenses uncertainAffiliated Label deals uncertainOver 40% revenue is dependent on PS/PS2

11
Free Cash Flow to Equity
4.50%Assumed Stable Growth Rate
15.00%Assumed HyperGrowth Rate
14.04%Cost of Equity (Stable Growth)
12.07%Cost of Equity (HyperGrowth)
4.89%30 Year Bond
2.92%5 Year Note
1.83Beta (Industry via Damodaran)
5.00%Risk Premium
What’s It Worth?
4.83%Upside Potential$59.99Current Share Price$63.04Intrinsic Value

12
Questions?