Embed Size (px)
Citation preview

BioMed Central
ss
BMC Evolutionary Biology
Open AcceMethodology articleBigFoot: Bayesian alignment and phylogenetic footprinting with MCMCRahul Satija*1, Ádám Novák1, István Miklós1,2, Rune Lyngsø1 and Jotun Hein1
Address: 1Department of Statistics, University of Oxford, 1 South Parks Road, OX1 3TG Oxford, UK and 2Alfréd Rényi Institute of Mathematics, Hungarian Academy of Sciences, Reáltanoda u. 13-15, 1053 Budapest, Hungary
Email: Rahul Satija* - [email protected]; Ádám Novák - [email protected]; István Miklós - [email protected]; Rune Lyngsø - [email protected]; Jotun Hein - [email protected]
* Corresponding author
AbstractBackground: We have previously combined statistical alignment and phylogenetic footprinting todetect conserved functional elements without assuming a fixed alignment. Considering aprobability-weighted distribution of alignments removes sensitivity to alignment errors, properlyaccommodates regions of alignment uncertainty, and increases the accuracy of functional elementprediction. Our method utilized standard dynamic programming hidden markov model algorithmsto analyze up to four sequences.
Results: We present a novel approach, implemented in the software package BigFoot, forperforming phylogenetic footprinting on greater numbers of sequences. We have developed aMarkov chain Monte Carlo (MCMC) approach which samples both sequence alignments andlocations of slowly evolving regions. We implement our method as an extension of the existingStatAlign software package and test it on well-annotated regions controlling the expression of theeven-skipped gene in Drosophila and the α-globin gene in vertebrates. The results exhibit howadding additional sequences to the analysis has the potential to improve the accuracy of functionalpredictions, and demonstrate how BigFoot outperforms existing alignment-based phylogeneticfootprinting techniques.
Conclusion: BigFoot extends a combined alignment and phylogenetic footprinting approach toanalyze larger amounts of sequence data using MCMC. Our approach is robust to alignment errorand uncertainty and can be applied to a variety of biological datasets. The source code anddocumentation are publicly available for download from http://www.stats.ox.ac.uk/~satija/BigFoot/
BackgroundThe identification of conserved DNA sequences by com-parative genome sequence analysis has been widely usedto annotate both protein-coding and gene regulatory ele-
ments in a wide variety of taxa [1-5]. While searching forthese "phylogenetic footprints" [6] is a powerful tech-nique, traditional methods often make predictions from asingle DNA sequence alignment. By ignoring the possibil-
Published: 28 August 2009
BMC Evolutionary Biology 2009, 9:217 doi:10.1186/1471-2148-9-217
Received: 15 October 2008Accepted: 28 August 2009
This article is available from: http://www.biomedcentral.com/1471-2148/9/217
© 2009 Satija et al; licensee BioMed Central Ltd. This is an Open Access article distributed under the terms of the Creative Commons Attribution License (http://creativecommons.org/licenses/by/2.0), which permits unrestricted use, distribution, and reproduction in any medium, provided the original work is properly cited.
Page 1 of 14(page number not for citation purposes)

BMC Evolutionary Biology 2009, 9:217 http://www.biomedcentral.com/1471-2148/9/217
ity of alignment uncertainty, these predictions are highlysensitive to both alignment errors and regions where alter-nate alignments may describe the true evolutionary his-tory. A dependence on a single alignment may beparticularly harmful when searching for regulatory motifs,such as transcription factor binding sites (TFBS), whichare difficult to align reliably due to their short lengths (6-15 nucleotides) and tolerance of degenerate nucleotides[7]. Recent studies have noted that single-alignment phy-logenetic footprinting approaches often produce inaccu-rate or inconsistent results depending on the alignmentmethod used, and have called for new techniques capableof controlling for alignment error and uncertainty [1,8-11].
"Statistical alignment" [12] methods provide a frameworkfor performing comparative genomic analyses while con-sidering a probability-weighted distribution of align-ments. Probabilistic models of evolutionary events(insertions, deletions, and substitutions) are used to cal-culate the likelihoods of different evolutionary historiesand a probability-weighted distribution of sequencealignments. These models vary in complexity, rangingfrom the treatment of insertion and deletion events(indels) as single-nucleotide events [13] to the modelingof complex length distributions for indels [9,14,15], butall allow for evolutionary inference without assuming asingle alignment. Incorporating alignment uncertaintyinformation using statistical alignment can improve notonly the accuracy of sequence alignment, but also the esti-mation of the parameters specifying the length and fre-quency of evolutionary events as well as the estimation ofphylogenetic relationships between species [9,16-19].
Statistical alignment models can be modified to simulta-neously align sequences and detect functional elements.By doubling the number of states in a hidden markovmodel (HMM) aligner in order to model both quicklyevolving (neutral) and slowly evolving (functional) ele-ments, we recently introduced SAPF (a statistical alignerand phylogenetic footprinter), a software package whichanalyzes a probability-weighted distribution of align-ments in order to identify sequence elements that areevolving at a reduced rate [20]. Results on both simulateddatasets and Drosophila cis-regulatory modules demon-strate how removing the traditional dependence on a sin-gle alignment increases the accuracy of functional elementpredictions. The improvement was most prominent whenthere was alignment ambiguity in functional regions dueto binding sites that were not highly conserved. WhileSAPF is used to discover new motifs, the MORPH softwarepackage modifies a simple probabilistic aligner to detectand align instances of known motifs that have been previ-ously characterized as position state weight matrices [21].
Here too, the authors report higher accuracy when exam-ining all alignments between two species.
While these studies present strong evidence for the bene-fits of using statistical alignment to detect regulatory ele-ments, they are limited in the amount of sequence datathey can analyze. Both SAPF and MORPH use standardHMM algorithms [22] to compute likelihoods and poste-rior probabilities, and as the number of sequences underanalysis increases, the number of states in the HMMincreases exponentially. As a result, MORPH is restrictedto pairwise alignments and SAPF can analyze only up tofour sequences. While the potential benefit of addingmore sequence data is highly dependent on the evolution-ary distances between species in the dataset, recent simu-lation studies have demonstrated how greater numbers ofspecies can increase the sensitivity and specificity of func-tional element recognition [11,23]. Additionally, [23]proposed the simple rule that for a given evolutionary dis-tance, the number of genomes required to detect func-tional elements scales inversely with element length.Therefore, while two genomes may be sufficient fordetecting long conserved exons, three to fifteen genomesmay be needed to detect TFBS. The inability to analyzemore than four sequences puts SAPF at a disadvantage rel-ative to phastCons, the single-alignment based phyloge-netic footprinter used to create the 28-genomeconservation track in the University of California at Santa-Cruz (UCSC) genome browser [5,24].
Markov chain Monte Carlo sampling techniques[25,26]have been successfully applied to statistical align-ment methods in order to expand the numbers ofsequences that can be analyzed [17,18,27]. The StatAlignpackage - a Markov chain Monte Carlo (MCMC) samplerimplemented in Java - samples alignment parameters,sequence alignments, tree branch lengths and tree topolo-gies in order to infer both the alignment and the phyloge-netic tree relating the input sequences [28]. The samplerplaces a statistical alignment model on each branch of thetree, and represents internal node sequences as a collec-tion of gaps and Felsenstein wildcards [27]. To create Big-Foot, we extend this package to perform phylogeneticfootprinting as well. We alter the alignment framework tomodel both quickly and slowly evolving regions, anddevelop new MCMC transition kernels to infer the break-points between the slowly and quickly evolving regions.
Results and DiscussionAlgorithmModel SummaryWhile traditional alignment algorithms assume identicalmutation rates throughout the sequence, we introduce analternative evolutionary model allowing for rate heteroge-
Page 2 of 14(page number not for citation purposes)

BMC Evolutionary Biology 2009, 9:217 http://www.biomedcentral.com/1471-2148/9/217
neity by modeling the evolution of both quickly andslowly evolving regions. In our model, a two-state HMMemits a sequence of conserved (slow evolution) and non-conserved (fast evolution) states at the root of the tree.This defines an alternating series of conserved and non-conserved segments, allowing our model to representboth neutral sequences expected to exhibit higher muta-tion rates and functional sequences undergoing purifyingselection. Each segment evolves independently along aphylogenetic tree according to a pairwise alignmentmodel which allows for insertions, deletions, and substi-tutions on each branch of the tree. While the StatAlignpackage jointly estimates both the tree and the alignment,we condition the analysis on a user-inputted phylogenetictree in order to estimate the alignment and locations ofquickly and slowly evolving regions more efficiently.
Our model is a reformulation of the SAPF multiple HMMwith two main differences. As in [5], we model the differ-ence between fast and slow states by scaling down thebranch lengths of the phylogenetic tree in slow states,reducing the evolutionary time - and thus the expecteddivergence - in these regions. While SAPF models slowstates by modifying the rate parameters of the mutationmodels, BigFoot uses a branch scaling approach in orderto support multiple substitution models with differentnumbers of parameters. Two different scaling factors,both of which are model parameters endowed with user-defined priors and constrained to be less than one, areused for substitution and indel events.
Another minor difference is that the BigFoot model doesnot allow for insertions at the exact boundaries of func-tional regions. This modification was necessary to createunambigious and reversible MCMC proposals, and is abiologically relevant modification since an insertion eventin one sequence should not define the beginning (or end)of a conserved region.
Modeling molecular evolutionOur alignment model is expressed as a pairwise HMMtransducer [29,30], a conditionally normalized HMM rep-resenting the evolution of an ancestral sequence into adescendent sequence, and is similar to the transducermodel in [20]. More complete details describing the trans-ducer are presented in the Methods section and supple-mentary sections S1.1 and S1.2 [see Additional file 1].
We base our transducer on the 1992 approach of Thorne,Kishino, and Felstenstein (TKF92) [14]. TKF92 models thebirth and death of fragments with geometrically-distrib-uted lengths in order to represent long indel events. Ourmodel can be viewed as an extension of the TKF92approach, allowing these fragments to exist in either
quickly or slowly evolving regions. In our fast states, as inthe TKF92 model, the length of indel fragments is mod-eled by a geometric distribution with the same expectedlength as a fragment of matched bases, resulting in anexpectation of long indel events. In annotated functionalregions, however, we noticed that most indel events werevery short (1-3 bp). To represent this, we create a separateparameter to specify the expected lengths of indel events.Thus, we not only expect functional regions to have fewerindel events, we also predict that these events will beshorter.
We place a pairwise transducer on each branch of the phy-logenetic tree in order to model the evolution from eachancestor to each descendent. Transducer theory [29,30]shows how the concatenation of these transducers resultsin a multiple HMM describing the evolution from theancestral root node to all leaves in the tree. We place a sep-arate HMM on the root sequence, allowing it to switchbetween emitting slow-evolving characters and fast-evolv-ing characters with specific probabilities. This models fastand slow regions with geometric distributed lengths, setby model parameters.
One limitation of our approach is that our model doesnot allow for the creation or deletion of conserved regionsalong the tree. Since the annotation of fast or slow charac-ters emitted by the root is conserved in the descendentsequences, the model cannot detect the loss or gain ofbinding sites. For this reason, when testing BigFoot we dis-carded sequences with long deletions from analysis.
The full likelihood of a tree is equivalent to the full emis-sion probability of the multiple-HMM. Unfortunately,this likelihood cannot be calculated quickly, as the timecomplexity of the Forward algorithm for a multiple HMMgrows exponentially with the number of sequences.Instead of direct computation via dynamic programming,we apply a Bayesian MCMC method with data augmenta-tion.
Bayesian MCMCAll model parameter densities are estimated using MCMCsampling. Exponential priors with expectation 1 havebeen used as priors for insertion-deletion parameters inthe alignment transducer and for all free parameters insubstitution models provided with the software package.For parameters responsible for annotation (branch scal-ings and expected lengths for fast/slow regions, asdescribed above), we allow the user to input either Beta oruniform priors on these parameters. This allows the userto tailor the analysis to their specific needs. For example,the user can set an informative prior to search for longerweakly conserved regions, or for very short and highly
Page 3 of 14(page number not for citation purposes)

BMC Evolutionary Biology 2009, 9:217 http://www.biomedcentral.com/1471-2148/9/217
conserved regions. Alternatively, the user can set unin-formative priors and allow the MCMC to estimate param-eter distributions freely.
The joint posterior distribution of alignments, trees andevolutionary parameters forms a high dimensional andcomplex distribution from which efficient direct samplingis most likely impossible. Therefore, we applied Markovchain Monte Carlo to converge to this prescribed distribu-tion. After convergence, samples from the Markov chainprovide correlated samples from the posterior distribu-tion.
The likelihood of a tree under the multiple HMM can onlybe easily calculated when we augment the tree with addi-tional data known as extended alignments. This data con-tains information on how the observed sequences arealigned to ancestral sequences associated with internalnodes of the tree. We represent the unobserved ancestralsequences as a collection of gaps and Felsenstein wild-cards in order to sum over all possible nucleotide valueswhen calculating the total likelihood.
Our MCMC walks on the joint distribution of theextended alignments, locations of fast and slow regions,and model parameters. The random walk comprises thefollowing components:
• Changing model parameters
• Changing extended alignment
• Shifting the boundary of an existing fast or slowregion
• Creating a new (or deleting an old) fast or slowregion
The first two types of moves are described in [31], and thelast two are described in the Methods section. In eachMCMC iteration, we apply a Metropolis-Hastings move toalter one of these components, and select moves withfixed probabilities that were chosen to enhance mixing.
Postprocessing the samples from the Markov chainThe Markov chain provides correlated samples from theposterior distribution of alignments, locations of fast andslow regions, and evolutionary parameters. To report pos-terior probabilities for phylogenetic footprinting predic-tions we take the approach of [4,5,20], collapsing ourpredictions onto one axis and reporting posterior proba-bilities for a single species. Our results thus represent theposterior probability of each nucleotide having been gen-erated from a slow state. These probabilities are simply the
proportion of samples in which each nucleotide appearsinside the boundaries of a slow region.
Multiple sequence alignment samples can be summarizedin several ways. Unlike other authors [17], we found theMAP (Maximum a Posteriori) alignment estimationdrawn from MCMC samples to be very unstable, espe-cially when there is autocorrelation between samplesfrom the chain. We chose instead to estimate the MPD(Maximum Posterior Decoding) alignment [32], whichmaximizes the product of alignment column posteriorprobabilities. We found this estimation to be more stableas it allows the uncertainty in each alignment column tobe assessed independently. We present a complete algo-rithm for calculating the MPD alignment in supplemen-tary section S1.3 [see Additional file 1].
TestingAs a first test of the accuracy of the MCMC results, we ranBigFoot on a relatively small dataset to compare theresults with the exact dynamic programming predictionsof SAPF. The two methods were expected to return similar,though not identical, results. This is because SAPF andBigFoot use slightly different alignment HMMs on eachtree branch. We analyzed a cis-regulatory module in fourDrosophila species: D. melanogaster, D. erecta, D. pseudoob-scura, and D. willistoni. This 485 base pair region has beenfound to regulate the expression of the homeodomainencoding protein eve in the second stripe of the develop-ing Drosophila embryonic blastoderm [33]. The REDFlydatabase provided the sequence coordinates of the biolog-ically verified regulatory module in the D. melanogastersequence [34], and the FlyReg database provided loca-tions for 19 experimentally discovered binding sites [35].Figure 1 exhibits the close agreement between the MCMCand dynamic programming predictions, with the loca-tions of the known binding sites displayed above the pos-terior probabilities, and provides strong evidence thatBigFoot is sampling from and converging to the true jointdistribution. Both programs identify 14 of the 19 bindingknown binding sites with high posterior probabilities. Ofthe remaining five sites, none have homologous instancesin either D. melanogaster or D. pseudoobscura. Four werebiologically characterized as "weak-affinity" binding sites[36] which could indicate reduced functionality and a lossof evolutionary pressure, and the last was postulated to berecently evolved in D. melanogaster due to an absence oforthologous sequence in both closely and distantlyrelated Drosophila species [33,37].
The Drosophila 12 genome consortium has completed thesequencing of 12 Drosophila genome sequences exhibitinga large range of evolutionary distances [1,38]. For exam-ple, the evolutionary distance separating D. melanogaster
Page 4 of 14(page number not for citation purposes)

BMC Evolutionary Biology 2009, 9:217 http://www.biomedcentral.com/1471-2148/9/217
Page 5 of 14(page number not for citation purposes)
Dynamic programming (SAPF) and MCMC (BigFoot) predictions along with annotated binding sites for the eve stripe 2 enhancerFigure 1Dynamic programming (SAPF) and MCMC (BigFoot) predictions along with annotated binding sites for the eve stripe 2 enhancer. For each nucleotide in the D. melanogaster sequence, both programs output the probability that the nucleotide was generated by a functional (slow) state. Experimentally verified binding sites in D. melanogaster for the transcrip-tion factors, Bicoid (BC), Hunchback (HB), Kruppel (KR), Giant (GT), and Sloppy-paired 1 (Sl1) are shown above the posterior probabilities.
0 100 200 300 400 500
0.0
0.2
0.4
0.6
0.8
1.0
1.2
Eve stripe 2
Position in D. Melanogaster
P(r
egu
lato
ry e
lem
ent)
kr1 kr2 bcd1
kr3
gt1
bcd2
gt2
kr4
kr5
kr6
bcd3
kr7
kr8sl1
bcd4
gt3
hb1
bcd5
kr9
0
DPMCMC
BigFoot results for the eve stripe 2 enhancer when analyzing four sequences and ten sequencesFigure 2BigFoot results for the eve stripe 2 enhancer when analyzing four sequences and ten sequences. Increasing the number of species in the analysis results in higher posterior probabilities in many experimentally verified binding sites, and increases the nucleotide resoltion when identifying the precise locations for the TFBS.
0 100 200 300 400 500
0.0
0.2
0.4
0.6
0.8
1.0
1.2
Eve stripe 2
Position in D. Melanogaster
P(r
egu
lato
ry e
lem
ent)
kr1 kr2 bcd1
kr3
gt1
bcd2
gt2
kr4
kr5
kr6
bcd3
kr7
kr8sl1
bcd4
gt3
hb1
bcd5
kr9
0
TenFour

BMC Evolutionary Biology 2009, 9:217 http://www.biomedcentral.com/1471-2148/9/217
and D. grimshawi is greater than that between any pair ofmammals when generation time is taken into account [1],while other sequence pairs are very closely related. Thelarge number of sequenced genomes and the diversity intheir evolutionary distances make this an ideal dataset forimplementing phylogenetic footprinting techniques. Wetested the eve stripe 2 enhancer region using ten of the 12genomes in this dataset. We chose to remove two species,D. mojavensis and D. virilis, as both sequences containednumerous long deletions and were thus too divergent tobe informative. Sequence data for all species wereobtained from a set of pre-computed whole-genomealignments [39].
Figure 2 compares MCMC predictions generated by Big-Foot when analyzing either four sequences or tensequences. The predictions made when analyzing thelarger dataset correspond more closely to the locations ofexperimentally validated binding sites. The improvementscan be summarized in two main categories:
• Higher sensitivity to verified binding sites. WhileFigure 2 exhibits a close agreement between the twosets of analyses for many of the experimentally verifiedbinding sites, the addition of more species doesimprove the conservation signal in some TFBS. In par-ticular, peaks corresponding to a Kruppel binding site(kr7), a Bicoid binding site (bcd4), and a joint site(kr9/bcd5) are all more strongly identified as evolvingslowly when ten species are analyzed. Additionally,one Kruppel binding site (kr5) is only detected, albeitweakly, when using the larger dataset. This demon-strates that while imperfectly conserved regions maybe reasonably likely to occur by chance in neutralsequence when only a few species are analyzed, addi-tional sequences may provide stronger evidence ofpurifying selection. Heightened sensitivity is alsoobserved at previously unannotated peaks from bases137-148 and 227-232. Both regions are adjacent to averified TFBS and have a high posterior probability ofbeing emitted from a slow state, and thus should becandidate regions for future experimental study. Thisheightened sensitivity does not result in a general lossof specificity, as low probability peaks (bases 298-306and 383-421) in previously un-annotated regions dis-appear when using the larger dataset.
• Finer nucleotide resolution for TFBS start/stoppositions. When analyzing a small number of species,it may be difficult to identify the boundaries betweenquickly and slowly evolving regions, especially in aregion where TFBS may be grouped close together. Theresults shown in Figure 2 demonstrate how addingadditional sequence data can result in a clearer signalat the boundaries of binding sites. In the Kruppel site
kr7, the distance in bases from the limits of the pre-dicted conserved region (defined as the peak regionwith probability greater than 0.5) to the limits of thelaboratory-identified regulatory element decreases by3 bp when additional sequences are analyzed. Thoughthis difference is small, it corresponds to 27% of the11 bp binding site. A similar effect is observed in theKruppel site kr8, for which additional sequence datadecreases the boundary error by 4 bp.
Additionally, in a closely spaced group of functionalelements (bases 440-482) separated only by a smallnumber of neutral bases, the small dips in posteriorprobability correspond more closely to the neutralregions when more sequences are added to the analy-sis. While the agreement is not perfect, these results areconsistent with previous findings showing an increasein nucleotide resolution as more species are analyzed[23].
In order to quantify the predictive accuracy of our results,we calculated receiver operating characteristic (ROC)curves for both sets of BigFoot results. The area under thecurve (AUC), which has a maximum value of 100%, is asummary statistic that accounts for both the sensitivityand the specificity of the predictions. A value of 50%implies that the predictions are no better than randomguessing. The methodology used for creating the ROCcurves is described in [20]. The curves are displayed in Fig-ure 3, which exhibits the small but noticeable predictiveimprovement when additional sequences are added to thedataset.
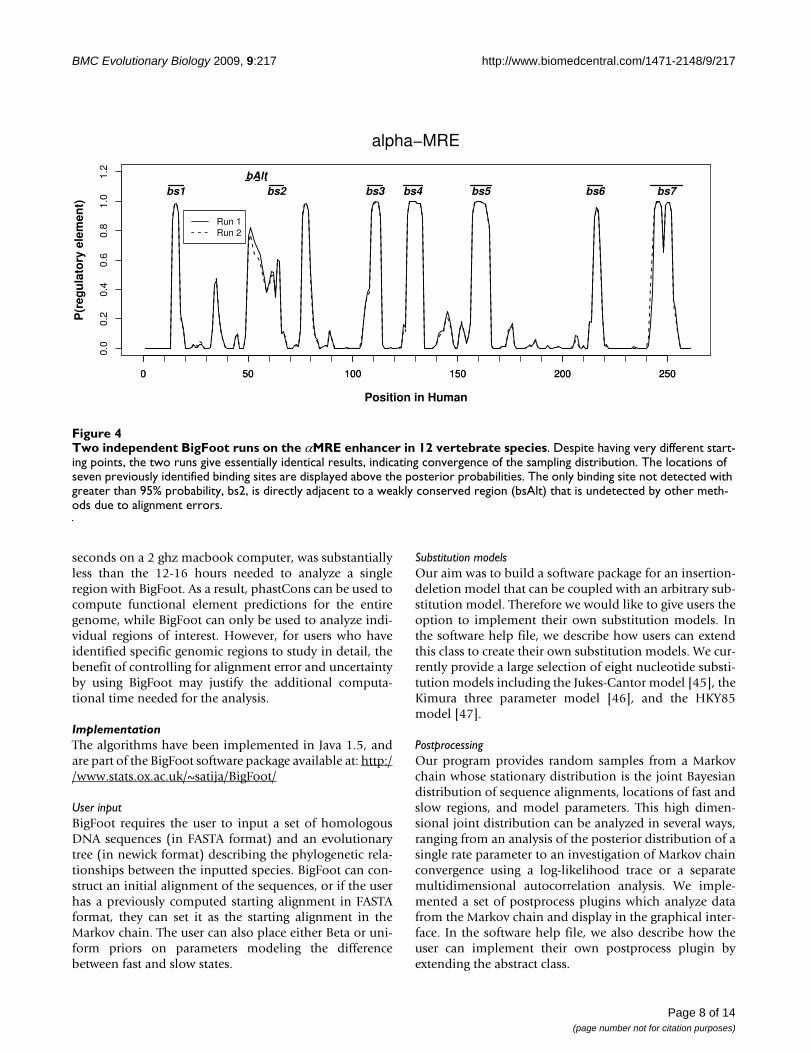
To demonstrate that BigFoot can be applied to sequencedata from vertebrates, we analyzed a 256 base pair regionpreviously identified as the major regulatory element ofhuman α-globin (αMRE) [40]. This region was sequencedin 22 species, analyzed with the TRANSFAC database, andfound to contain seven TFBS. These TFBS range from 8-15bp in length, and include recognition elements for theMaf protein and GATA-1, both important in globin generegulation [40,41].
To analyze this region, we downloaded the multiz28wayalignment of the region from the UCSC genome browser[42]. This alignment provided sequence information for15 vertebrate species, three of which (cat, shrew, hedge-hog) contained long deletions and were thereforeremoved from the analysis. The results of the analysis areshown in Figure 4, where we display the results of twoindependent MCMC runs initialized at independent start-ing points. The first run was started using the UCSC align-ment to initialize the Markov chain, while the second wasinitialized with a random alignment proposed by BigFoot.Both runs were also initialized with independent and ran-
Page 6 of 14(page number not for citation purposes)

BMC Evolutionary Biology 2009, 9:217 http://www.biomedcentral.com/1471-2148/9/217
domly selected evolutionary parameters. Despite thesedifferences, Figure 4 exhibits that there is extremely closeagreement - in many regions near exact correspondence -between the two sets of results, demonstrating the mixingand convergence of the MCMC sampling.
When analyzing the 12 vertebrate species, BigFoot detectssix of the seven known binding sites with posterior prob-abilities of greater than 95%. However, the seventh bind-ing site, notated in Figure 4 as bs2, is poorly conservedand the binding site peak probabilities do not exceed50%. In fact, this region was only detected due to the pres-ence of a previously unannotated and weakly conservedadjacent region, notated as bsAlt, which is incorrectlyaligned in the multiz28 way alignment. BigFoot correctsthis alignment error and annotates this region with a peakexceeding 80% posterior probability. This example dem-onstrates the importance of calculating and correcting foralignment ambiguity and error. By doing this, BigFoot notonly discovers a previously undetected conserved regionin a well-annotated regulatory module, but also enablesthe detection of a weakly conserved but previously identi-fied regulatory element.
Comparison with phastConsOne of the most widely used alignment-based phyloge-netic footprinting tools is the phastCons program, used tocreate the conservation track in the University of Califor-nia at Santa-Cruz (UCSC) genome browser [5,24]. Theconservation track makes predictions from a single multizalignment and does not incorporate indel information.This puts the method at a significant disadvantage to Big-Foot, as indel information has been shown to beextremely valuable in the detection of functional elements[43]. Indeed, we observed that predictions from the UCSCconservation track had significantly lower specificity andsensitivity when compared to the BigFoot results in boththe Drosophila and the αMRE datasets.
In the command-line version of phastCons, however, it ispossible to set an option for the program to incorporateindel information [44]. We set this option and ran phast-Cons on the BigFoot test datasets, using the UCSC align-ment as input. The two programs returned almostidentical results for the majority of the binding sites, sincethe majority of the binding sites are well conserved andthus perfectly aligned in the multiz alignments. In thesecases there is little alignment uncertainty, so BigFoot andphastCons are expected to return similar results. However,in shorter binding sites exhibiting weaker conservation,BigFoot outperforms the single-alignment method. Themost drastic example is the Kruppel site kr7 in the evestripe 2 enhancer. The core of the TFBS is very well con-served and BigFoot predicts the site with high probability,but there are substitutions towards the edges and shortindels in some species, and the multiz alignment incor-rectly aligns the binding site. As a result, phastConsdetects all nucleotides in the TFBS with less than 5% prob-ability. The ROC curve for the phastCons predictions isdisplayed alongside the BigFoot ROC curves in Figure 3.Comparing the AUC values demonstrates how theincrease in predictive accuracy caused by adding moresequence data is less than the corresponding increasecaused by analyzing a distribution of alignments insteadof a single alignment.
A similar error in the multiz alignment of the αMREenhancer results in phastCons failing to annotate anynucleotide the weakly conserved region discussed in theprevious section (bAlt) with greater than 5% probability.While we cannot know if this region is a functional TFBSwithout further experimental analysis, examining a distri-bution of alignments ensures that this region is not incor-rectly passed over during the conservation analysis.
Since phastCons analyzes only one single alignment, thecomputational time to analyze a single region, around 30
ROC curves comparing the performance of BigFoot when analyzing four or ten sequences and phastCons analyzing ten sequencesFigure 3ROC curves comparing the performance of BigFoot when analyzing four or ten sequences and phastCons analyzing ten sequences. The figure legend shows AUC values for all curves. Among the three methods, optimal per-formance is acheived when BigFoot analyzes the larger data-set.
0.0 0.2 0.4 0.6 0.8 1.0
0.2
0.4
0.6
0.8
1.0
Eve stripe 2
False Positive Rate
Tru
e P
ositi
ve R
ate
BigFoot (10): 86.1%BigFoot (4): 83.4%phastCons (10): 80.3%
Page 7 of 14(page number not for citation purposes)
BMC Evolutionary Biology 2009, 9:217 http://www.biomedcentral.com/1471-2148/9/217
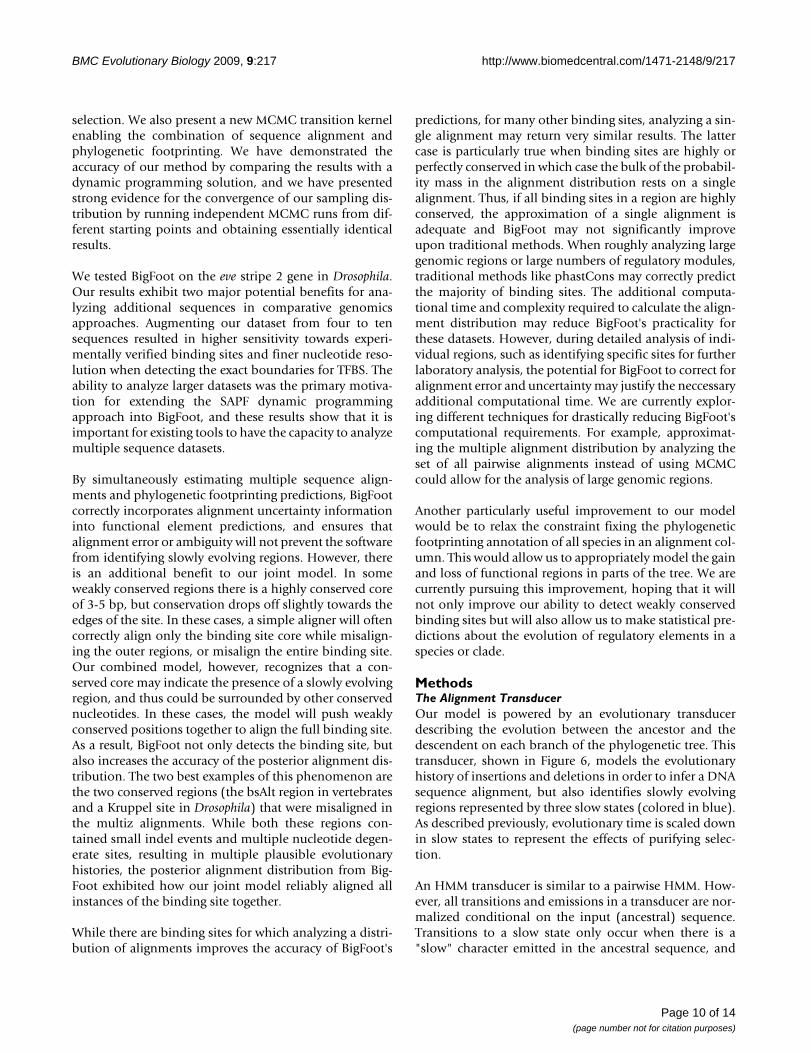
seconds on a 2 ghz macbook computer, was substantiallyless than the 12-16 hours needed to analyze a singleregion with BigFoot. As a result, phastCons can be used tocompute functional element predictions for the entiregenome, while BigFoot can only be used to analyze indi-vidual regions of interest. However, for users who haveidentified specific genomic regions to study in detail, thebenefit of controlling for alignment error and uncertaintyby using BigFoot may justify the additional computa-tional time needed for the analysis.
ImplementationThe algorithms have been implemented in Java 1.5, andare part of the BigFoot software package available at: http://www.stats.ox.ac.uk/~satija/BigFoot/
User inputBigFoot requires the user to input a set of homologousDNA sequences (in FASTA format) and an evolutionarytree (in newick format) describing the phylogenetic rela-tionships between the inputted species. BigFoot can con-struct an initial alignment of the sequences, or if the userhas a previously computed starting alignment in FASTAformat, they can set it as the starting alignment in theMarkov chain. The user can also place either Beta or uni-form priors on parameters modeling the differencebetween fast and slow states.
Substitution modelsOur aim was to build a software package for an insertion-deletion model that can be coupled with an arbitrary sub-stitution model. Therefore we would like to give users theoption to implement their own substitution models. Inthe software help file, we describe how users can extendthis class to create their own substitution models. We cur-rently provide a large selection of eight nucleotide substi-tution models including the Jukes-Cantor model [45], theKimura three parameter model [46], and the HKY85model [47].
PostprocessingOur program provides random samples from a Markovchain whose stationary distribution is the joint Bayesiandistribution of sequence alignments, locations of fast andslow regions, and model parameters. This high dimen-sional joint distribution can be analyzed in several ways,ranging from an analysis of the posterior distribution of asingle rate parameter to an investigation of Markov chainconvergence using a log-likelihood trace or a separatemultidimensional autocorrelation analysis. We imple-mented a set of postprocess plugins which analyze datafrom the Markov chain and display in the graphical inter-face. In the software help file, we also describe how theuser can implement their own postprocess plugin byextending the abstract class.
Two independent BigFoot runs on the αMRE enhancer in 12 vertebrate speciesFigure 4Two independent BigFoot runs on the αMRE enhancer in 12 vertebrate species. Despite having very different start-ing points, the two runs give essentially identical results, indicating convergence of the sampling distribution. The locations of seven previously identified binding sites are displayed above the posterior probabilities. The only binding site not detected with greater than 95% probability, bs2, is directly adjacent to a weakly conserved region (bsAlt) that is undetected by other meth-ods due to alignment errors.
0 50 100 150 200 250
0.0
0.2
0.4
0.6
0.8
1.0
1.2
alpha−MRE
Position in Human
P(r
egu
lato
ry e
lem
ent)
0 50 100 150 200 250
bs1 bs2 bs3 bs4 bs5 bs6 bs7bAlt
Run 1Run 2
Page 8 of 14(page number not for citation purposes)
BMC Evolutionary Biology 2009, 9:217 http://www.biomedcentral.com/1471-2148/9/217
We implemented the following plugins, each of whichrepresents a tab in the graphical interface:
• Log-likelihood trace This plugin plots the log-likeli-hood trace and writes the log-likelihood values into atext file when the analysis is complete.
• Current alignment This plugin shows the multiplesequence alignment in the current state of the Markovchain, along with the locations of slow and fastregions. Capital letters in the alignment representslowly evolving regions in the current state of thechain, while lower case letters represent quickly evolv-ing regions.
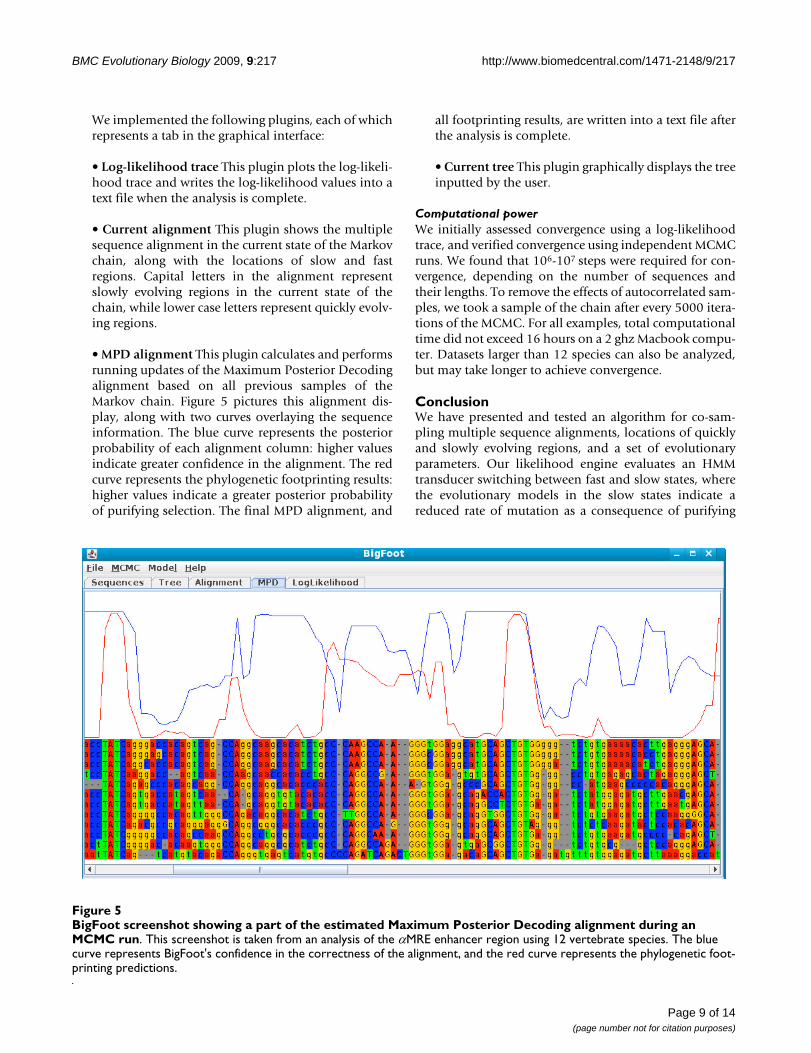
• MPD alignment This plugin calculates and performsrunning updates of the Maximum Posterior Decodingalignment based on all previous samples of theMarkov chain. Figure 5 pictures this alignment dis-play, along with two curves overlaying the sequenceinformation. The blue curve represents the posteriorprobability of each alignment column: higher valuesindicate greater confidence in the alignment. The redcurve represents the phylogenetic footprinting results:higher values indicate a greater posterior probabilityof purifying selection. The final MPD alignment, and
all footprinting results, are written into a text file afterthe analysis is complete.
• Current tree This plugin graphically displays the treeinputted by the user.
Computational powerWe initially assessed convergence using a log-likelihoodtrace, and verified convergence using independent MCMCruns. We found that 106-107 steps were required for con-vergence, depending on the number of sequences andtheir lengths. To remove the effects of autocorrelated sam-ples, we took a sample of the chain after every 5000 itera-tions of the MCMC. For all examples, total computationaltime did not exceed 16 hours on a 2 ghz Macbook compu-ter. Datasets larger than 12 species can also be analyzed,but may take longer to achieve convergence.
ConclusionWe have presented and tested an algorithm for co-sam-pling multiple sequence alignments, locations of quicklyand slowly evolving regions, and a set of evolutionaryparameters. Our likelihood engine evaluates an HMMtransducer switching between fast and slow states, wherethe evolutionary models in the slow states indicate areduced rate of mutation as a consequence of purifying
BigFoot screenshot showing a part of the estimated Maximum Posterior Decoding alignment during an MCMC runFigure 5BigFoot screenshot showing a part of the estimated Maximum Posterior Decoding alignment during an MCMC run. This screenshot is taken from an analysis of the αMRE enhancer region using 12 vertebrate species. The blue curve represents BigFoot's confidence in the correctness of the alignment, and the red curve represents the phylogenetic foot-printing predictions.
Page 9 of 14(page number not for citation purposes)
BMC Evolutionary Biology 2009, 9:217 http://www.biomedcentral.com/1471-2148/9/217
selection. We also present a new MCMC transition kernelenabling the combination of sequence alignment andphylogenetic footprinting. We have demonstrated theaccuracy of our method by comparing the results with adynamic programming solution, and we have presentedstrong evidence for the convergence of our sampling dis-tribution by running independent MCMC runs from dif-ferent starting points and obtaining essentially identicalresults.
We tested BigFoot on the eve stripe 2 gene in Drosophila.Our results exhibit two major potential benefits for ana-lyzing additional sequences in comparative genomicsapproaches. Augmenting our dataset from four to tensequences resulted in higher sensitivity towards experi-mentally verified binding sites and finer nucleotide reso-lution when detecting the exact boundaries for TFBS. Theability to analyze larger datasets was the primary motiva-tion for extending the SAPF dynamic programmingapproach into BigFoot, and these results show that it isimportant for existing tools to have the capacity to analyzemultiple sequence datasets.
By simultaneously estimating multiple sequence align-ments and phylogenetic footprinting predictions, BigFootcorrectly incorporates alignment uncertainty informationinto functional element predictions, and ensures thatalignment error or ambiguity will not prevent the softwarefrom identifying slowly evolving regions. However, thereis an additional benefit to our joint model. In someweakly conserved regions there is a highly conserved coreof 3-5 bp, but conservation drops off slightly towards theedges of the site. In these cases, a simple aligner will oftencorrectly align only the binding site core while misalign-ing the outer regions, or misalign the entire binding site.Our combined model, however, recognizes that a con-served core may indicate the presence of a slowly evolvingregion, and thus could be surrounded by other conservednucleotides. In these cases, the model will push weaklyconserved positions together to align the full binding site.As a result, BigFoot not only detects the binding site, butalso increases the accuracy of the posterior alignment dis-tribution. The two best examples of this phenomenon arethe two conserved regions (the bsAlt region in vertebratesand a Kruppel site in Drosophila) that were misaligned inthe multiz alignments. While both these regions con-tained small indel events and multiple nucleotide degen-erate sites, resulting in multiple plausible evolutionaryhistories, the posterior alignment distribution from Big-Foot exhibited how our joint model reliably aligned allinstances of the binding site together.
While there are binding sites for which analyzing a distri-bution of alignments improves the accuracy of BigFoot's
predictions, for many other binding sites, analyzing a sin-gle alignment may return very similar results. The lattercase is particularly true when binding sites are highly orperfectly conserved in which case the bulk of the probabil-ity mass in the alignment distribution rests on a singlealignment. Thus, if all binding sites in a region are highlyconserved, the approximation of a single alignment isadequate and BigFoot may not significantly improveupon traditional methods. When roughly analyzing largegenomic regions or large numbers of regulatory modules,traditional methods like phastCons may correctly predictthe majority of binding sites. The additional computa-tional time and complexity required to calculate the align-ment distribution may reduce BigFoot's practicality forthese datasets. However, during detailed analysis of indi-vidual regions, such as identifying specific sites for furtherlaboratory analysis, the potential for BigFoot to correct foralignment error and uncertainty may justify the neccessaryadditional computational time. We are currently explor-ing different techniques for drastically reducing BigFoot'scomputational requirements. For example, approximat-ing the multiple alignment distribution by analyzing theset of all pairwise alignments instead of using MCMCcould allow for the analysis of large genomic regions.
Another particularly useful improvement to our modelwould be to relax the constraint fixing the phylogeneticfootprinting annotation of all species in an alignment col-umn. This would allow us to appropriately model the gainand loss of functional regions in parts of the tree. We arecurrently pursuing this improvement, hoping that it willnot only improve our ability to detect weakly conservedbinding sites but will also allow us to make statistical pre-dictions about the evolution of regulatory elements in aspecies or clade.
MethodsThe Alignment TransducerOur model is powered by an evolutionary transducerdescribing the evolution between the ancestor and thedescendent on each branch of the phylogenetic tree. Thistransducer, shown in Figure 6, models the evolutionaryhistory of insertions and deletions in order to infer a DNAsequence alignment, but also identifies slowly evolvingregions represented by three slow states (colored in blue).As described previously, evolutionary time is scaled downin slow states to represent the effects of purifying selec-tion.
An HMM transducer is similar to a pairwise HMM. How-ever, all transitions and emissions in a transducer are nor-malized conditional on the input (ancestral) sequence.Transitions to a slow state only occur when there is a"slow" character emitted in the ancestral sequence, and
Page 10 of 14(page number not for citation purposes)

BMC Evolutionary Biology 2009, 9:217 http://www.biomedcentral.com/1471-2148/9/217
the same is true of fast states and fast characters. Themodel switches between fast and slow states only when acharacter type switch is emitted from the ancestral root. Aspreviously discussed, the ancestral root node switchesbetween emitting fast and slow characters according to abasic hidden markov model.
The transducer model contains two "wait" states, W1 andW2, to which the model transitions while waiting for
input from the ancestral sequence. These transitions occurafter the transducer has finished processing the previouscharacter from the ancestral sequence (for example, afterthe ancestral character has been either matched or deletedin the descendent), and the transducer will remain in thewait state until the ancestral sequence emits the next char-acter. This allows the transducer to pause while other evo-lutionary events, such as indels on a different half of thetree, occur in other sequences. A second wait state isneeded since unlike the insertion state, the delete statecannot self-transition. This second wait state, which onlythe delete state can access, creates an effective self-transi-tion that allows for the modeling of long deletion events.The full transition matrix for our HMM transducer isshown in supplementary section S1.2 [see Additional File1] and a complete explanation of wait states and the gen-eral application of HMM transducers to sequence align-ment can be found in [29].
MCMC Transition KernelsIn order to combine both alignment and phylogenetic foot-printing, we needed to introduce new sampling moves forour random walk. At each state in the chain, we kept trackof the points where the HMM transducer switched betweenfast and slow states, corresponding to a predictive switchbetween neutral sequences and functional elements. Fordisplay purposes (see Figure 7), we capitalized nucleotidesemitted from slow states in the sequence alignment at eachstep. We found that only three new types of moves werenecessary to provide good mixing.
• Shifting location of existing boundaries. Weextend (or shrink) an existing boundary and calculatethe effect on the overall likelihood. We fix the rootsequence and switch a small number of nucleotides(determined by a geometric distribution) in the rootbetween fast and slow. Figure 7 displays a boundary
The alignment transducer used to model evolution from the ancestor to the descendent on each branch of the phyloge-netic treeFigure 6The alignment transducer used to model evolution from the ancestor to the descendent on each branch of the phylogenetic tree. Match, Insert (Ins), and Delete (Del) states represent evolutionary events. States with blue outlines (slow states) have reduced rates of evolution com-pared to states with red outlines (fast states). The model enters one of the wait states (W1 and W2) when waiting for input from the ancestral sequence.
MCMC move where a boundary between slow and fast regions is shifted by three root nucleotidesFigure 7MCMC move where a boundary between slow and fast regions is shifted by three root nucleotides. This move is especially important in accurately calculating footprinting posterior probabilities at the edges of functional regions. We do not allow insertions to occur at the beginnings or ends of functional regions, as shown in the alignment on the right. For display purposes, nucleotides emitted from slowly evolving regions are represented as capital letters. While we store internal sequences as Felstenstein wildcards, we display the most likely nucleotide at each position here.
�������������������������������������������������������������������������������������������������������������������������� �������������������������������������������������������������������������������������
���������������������������������������������������������������������������������������������������������������������������
Page 11 of 14(page number not for citation purposes)

BMC Evolutionary Biology 2009, 9:217 http://www.biomedcentral.com/1471-2148/9/217
shift of three nucleotides. This move is especially help-ful for accurately calculating footprinting posteriorprobabilities near the ends of functional regions.
• Creating a new pair of boundaries. This move pro-poses either a new slowly evolving region in a stretchof neutral sequence (see Figure 8), or a new neutralregion in the middle of a conserved element, creatingtwo separate binding sites. The lengths of the newregions are proposed from simple stepwise distribu-tions. When proposing new conserved regions, weexpect the lengths to span approximately 5-10 bp. Wepropose shorter lengths for new quickly evolvingregions when splitting a conserved region in two, asthere are often short stretches of 1-4 degenerate nucle-otides in a long conserved binding site.
To achieve better mixing, we scan the existing align-ment for areas where new boundaries may improvethe likelihood before proposing new regions. We cal-culate a very basic conservation score, based on thenumber of mutations in the alignment column, andweight our proposals towards regions with high con-servation (for new slowly evolving regions) or lowconservation (for new quickly evolving regions).
• Deleting an existing pair of boundaries This moveis the exact reverse of the move described above, andis also pictured in Figure 8. It corresponds to the merg-ing of three heterogeneous regions into one homoge-neous region. When proposing regions to merge, weweight our proposals towards regions whose lengthsdiffer significantly from the expected geometric distri-bution set by the HMM in the ancestral root.
After each of these moves, we calculate the probability ofproposing the new state and the probability of back-pro-posing the old state, along with the resulting change in
likelihood. We then accept or reject the move, with anacceptance probability set by the Metropolis-Hastingsratio.
Availability and Requirements• Project name: BigFoot
• Project webpage: http://www.stats.ox.ac.uk/~satija/BigFoot/
• Operating system: Platform independent
• Programming language: Java
• Other requirements: Java Virtual Machine 1.5 orhigher
• License: GNU GPL
Authors' contributionsRS wrote the majority of the phylogenetic footprintingcode and performed the biological dataset analysis. IM,AN, and RL wrote the alignment software and post-processing code. All authors contributed to the manu-script. JH encouraged the research and supervised theproject.
Additional material
Additional file 1Technical Methods. Additional technical information describing the Big-Foot transducer parameters and the algorithm used to estimate MPD alignments on-the-fly.Click here for file[http://www.biomedcentral.com/content/supplementary/1471-2148-9-217-S1.pdf]
MCMC move creating a new pair (when going from right to left) or deleting an existing pair (going from left to right) of bound-ariesFigure 8MCMC move creating a new pair (when going from right to left) or deleting an existing pair (going from left to right) of boundaries. To improve mixing and convergence, we weight our proposals based on the lengths of the new or existing regions and their approximate level of conservation.
�������������������������������������������������������������������������������������������������������������������������� �������������������������������������������������������������������������������������
�����������������������������������������������������������������������������������������������������������������������������������������
Page 12 of 14(page number not for citation purposes)

BMC Evolutionary Biology 2009, 9:217 http://www.biomedcentral.com/1471-2148/9/217
AcknowledgementsThis research was supported by the BBSRC grant BB/C509566/1 and by the EU grant MTKD-CT-2006-042794. IM was also supported by a Bolyai post-doctoral fellowship and the OTKA grant F61730. RS is funded by the Rhodes Trust, UK.
References1. Stark A, Lin M, Kheradpour P, Pedersen J, Parts L, Carlson J, Crosby
M, Rasmussen M, Roy S, Deoras A, et al.: Discovery of functionalelements in 12 Drosophila genomes using evolutionary signa-tures. Nature 2007, 450(7167):219-232.
2. Cliften P, Sudarsanam P, Desikan A, Fulton L, Fulton B, Majors J,Waterston R, Cohen B, Johnston M: Finding Functional Featuresin Saccharomyces Genomes by Phylogenetic Footprinting.Science 2003, 301(5629):71-76.
3. Boffélli D, McAuliffe J, Ovcharenko D, Lewis K, Ovcharenko I, PachterL, Rubin E: Phylogenetic Shadowing of Primate Sequences toFind Functional Regions of the Human Genome. Science 2003,299(5611):1391-1394.
4. Wasserman W, Palumbo M, Thompson W, Fickett J, Lawrence C:Human-mouse genome comparisons to locate regulatorysites. Nature Genetics 2000, 26:225-228.
5. Siepel A, Bejerano G, Pedersen J, Hinrichs A, Hou M, Rosenbloom K,Clawson H, Spieth J, Hillier L, Richards S, et al.: Evolutionarily con-served elements in vertebrate, insect, worm, and yeastgenomes. Genome Research 2005, 15(8):1034.
6. Tagle D, Koop B, Goodman M, Slightom J, Hess D, Jones R: Embry-onic epsilon and gamma globin genes of a prosimian primate(Galago crassicaudatus). Nucleotide and amino acidsequences, developmental regulation and phylogenetic foot-prints. J Mol Biol 1988, 203(2):439-55.
7. GuhaThakurta D: Computational identification of transcrip-tional regulatory elements in DNA sequence. Nucleic AcidsResearch 2006, 34(12):3585.
8. Pollard D, Moses A, Iyer V, Eisen M: Detecting the limits of reg-ulatory element conservation and divergence estimationusing pairwise and multiple alignments. BMC Bioinformatics2006, 7:376.
9. Lunter G, Rocco A, Mimouni N, Heger A, Caldeira A, Hein J: Uncer-tainty in homology inferences: Assessing and improvinggenomic sequence alignment. Genome Research 2008,18(2):298.
10. Wong K, Suchard M, Huelsenbeck J: Alignment uncertainty andgenomic analysis. Science 2008, 319(5862):473-6.
11. Fan X, Zhu J, Schadt E, Liu J: Statistical power of phylo-HMM forevolutionarily conserved element detection. BMC Bioinformat-ics 2007, 8:374.
12. Hein J, Wiuf C, Knudsen B, Møller M, Wibling G: Statistical align-ment: computational properties, homology testing andgoodness-of-fit. Journal of Molecular Biology 2000, 302:265-279.
13. Thorne J, Kishino H, Felsenstein J: An evolutionary model formaximum likelihood alignment of DNA sequences. Journal ofMolecular Evolution 1991, 33(2):114-124.
14. Thorne J, Kishino H, Felsenstein J: Inching toward reality: Animproved likelihood model of sequence evolution. Journal ofMolecular Evolution 1992, 34:3-16.
15. Miklós I, Lunter G, Holmes I: A "Long Indel" Model For Evolu-tionary Sequence Alignment. Molecular Biology and Evolution2004, 21(3):529-540.
16. Holmes I: Using evolutionary Expectation Maximization toestimate indel rates. Bioinformatics 2005, 21:2294-2300.
17. Redelings B, Suchard M: Joint Bayesian Estimation of Alignmentand Phylogeny. Systematic Biology 2005, 54(3):401-418.
18. Lunter G, Miklós I, Drummond A, Jensen J, Hein J: Bayesian coesti-mation of phylogeny and sequence alignment. BMC Bioinfor-matics 2005, 6:83.
19. Lunter G: Probabilistic whole-genome alignments reveal highindel rates in the human and mouse genomes. Bioinformatics2007, 23(13):i289.
20. Satija R, Pachter L, Hein J: Combining statistical alignment andphylogenetic footprinting to detect regulatory elements. Bio-informatics 2008, 24(10):1236.
21. Sinha S, He X: MORPH: Probabilistic alignment combinedwith hidden Markov models of cis-regulatory modules. PLoSComput Biol 2007, 10:.
22. Durbin R, Eddy S, Krogh A, Mitchison G: Biological sequence analysis:Probabilistic models of proteins and nucleic acids Cambridge Univ Pr;1998.
23. Eddy S: A model of the statistical power of comparativegenome sequence analysis. PLoS Biol 2005, 3:e10.
24. Karolchik D, Kuhn R, Baertsch R, Barber G, Clawson H, Diekhans M,Giardine B, Harte R, Hinrichs A, Hsu F, et al.: The UCSC GenomeBrowser Database: 2008 update. Nucleic Acids Research2008:D773.
25. Metropolis N, Rosenbluth A, Rosenbluth M, Teller A, Teller E: Equa-tion of State Calculations by Fast Computing Machines. TheJournal of Chemical Physics 1953, 21(6):1087.
26. Hastings W: Monte Carlo simulation methods using Markovchains and their applications. Biometrika 1970, 57:97-109.
27. Holmes I, Bruno W: Evolutionary HMMs: a Bayesian approachto multiple alignment. Bioinformatics 2001, 17(9):803-820.
28. Novak A, Miklos I, Lyngso R, Hein J: StatAlign: an extendablesoftware package for joint Bayesian estimation of alignmentsand evolutionary trees. Bioinformatics 2008, 24(20):2403.
29. Holmes I: Using guide trees to construct multiple-sequenceevolutionary HMMs. Bioinformatics 2003, 19(90001):147-157.
30. Bradley R, Holmes I: Transducers: an emerging probabilisticframework for modeling indels on trees. Bioinformatics 2007,23(23):3258.
31. Miklós I, Novák Á, Dombai B, Hein J: How reliably can we predictthe reliability of protein structure predictions? BMC Bioinfor-matics 2008, 9:137.
32. Holmes I, Durbin R: Dynamic programming alignment accu-racy. Proceedings of the second annual international conference on Com-putational molecular biology 1998:102-108.
33. Ludwig M: Functional analysis of eve stripe 2 enhancer evolu-tion in Drosophila: rules governing conservation and change.Development 1998, 125(5):949-958.
34. Gallo S, Li L, Hu Z, Halfon M: REDfly: a Regulatory ElementDatabase for Drosophila. Bioinformatics 2006, 22(3):381-383.
35. Bergman C, Carlson J, Celniker S: Drosophila DNase I footprintdatabase: a systematic genome annotation of transcriptionfactor binding sites in the fruitfly, Drosophila melanogaster.Bioinformatics 2005, 21(8):1747-1749.
36. Stanojevic D, Small S, Levine M: Regulation of a segmentationstripe by overlapping activators and repressors in the Dro-sophila embryo. Science 1991, 254(5036):1385-1387.
37. Kreitman M, Ludwig M: Tempo and mode of even-skippedstripe 2 enhancer evolution in Drosophila. Seminars in Cell andDevelopmental Biology 1996, 7(4):583-592.
38. Drosophila 12 Genomes Consortium: Evolution of genes andgenomes on the Drosophila phylogeny. Nature 2007,450:203-218.
39. Dewey C, Huggins P, Woods K, Sturmfels B, Pachter L: Parametricalignment of Drosophila genomes. PLoS Computational Biology2006, 2(6):e73.
40. Hughes J, Cheng J, Ventress N, Prabhakar S, Clark K, Anguita E, DeGobbi M, de Jong P, Rubin E, Higgs D: Annotation of cis-regula-tory elements by identification, subclassification, and func-tional assessment of multispecies conserved sequences.Proceedings of the National Academy of Sciences 2005,102(28):9830-9835.
41. Onodera K, Takahashi S, Nishimura S, Ohta J, Motohashi H, Yomog-ida K, Hayashi N, Engel J, Yamamoto M: GATA-1 transcription iscontrolled by distinct regulatory mechanisms during primi-tive and definitive erythropoiesis. Proceedings of the NationalAcademy of Sciences 1997, 94(9):4487-4492.
42. Miller W, Rosenbloom K, Hardison R, Hou M, Taylor J, Raney B, Bur-hans R, King D, Baertsch R, Blankenberg D, et al.: 28-Way verte-brate alignment and conservation track in the UCSCGenome Browser. Genome Research 2007, 17(12):1797.
43. Lunter G, Ponting C, Hein J: Genome-Wide Identification ofHuman Functional DNA Using a Neutral Indel Model. PLoSComputational Biology 2006, 2:.
44. Siepel A, Haussler D: Computational identification of evolu-tionarily conserved exons. Proceedings of the eighth annual interna-
Page 13 of 14(page number not for citation purposes)

BMC Evolutionary Biology 2009, 9:217 http://www.biomedcentral.com/1471-2148/9/217
Publish with BioMed Central and every scientist can read your work free of charge
"BioMed Central will be the most significant development for disseminating the results of biomedical research in our lifetime."
Sir Paul Nurse, Cancer Research UK
Your research papers will be:
available free of charge to the entire biomedical community
peer reviewed and published immediately upon acceptance
cited in PubMed and archived on PubMed Central
yours — you keep the copyright
Submit your manuscript here:http://www.biomedcentral.com/info/publishing_adv.asp
BioMedcentral
tional conference on research in computational molecular biology2004:177-186.
45. Jukes T, Cantor C: Evolution of protein molecules. MammalianProtein Metabolism 1969, 3:21-132.
46. Kimura M: Estimation of Evolutionary Distances betweenHomologous Nucleotide Sequences. Proceedings of the NationalAcademy of Sciences 1981, 78:454-458.
47. Hasegawa M, Kishino H, Yano T: Dating of the human-ape split-ting by a molecular clock of mitochon-drial DNA. Journal ofMolecular Evolution 1985, 22(2):160-174.
Page 14 of 14(page number not for citation purposes)