Embed Size (px)
Citation preview

Big Yellow Group PLC
Third Quarter Trading Update
January 2006
IFRS
• First time adoption
• 27 September announcement
• Investment properties
• UK GAAP reconciliations
• Adjusted PBT, NAV per share
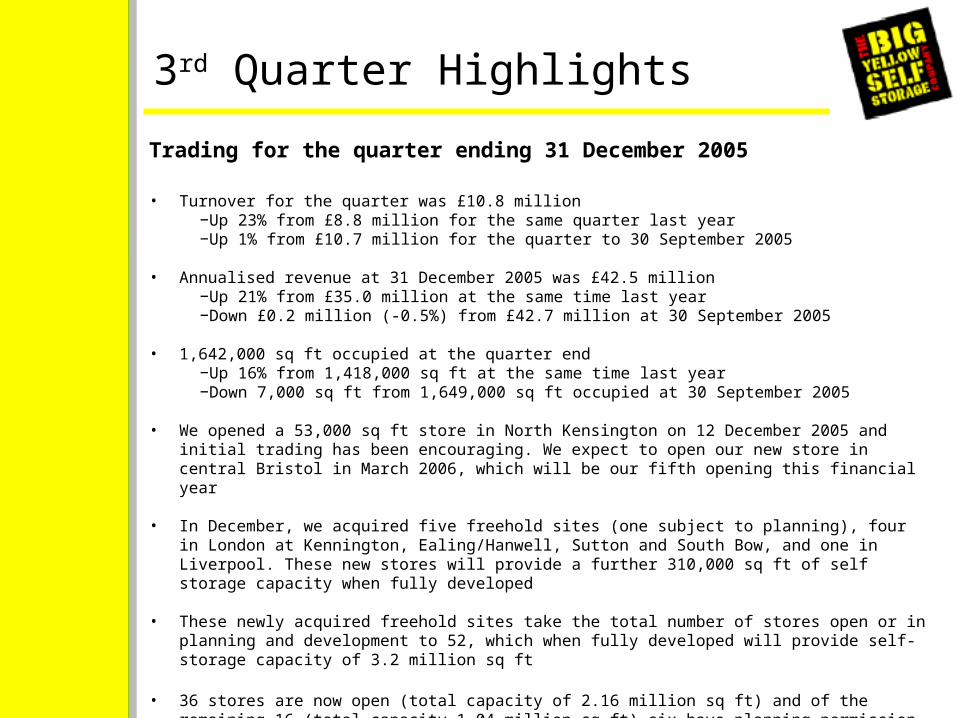
3rd Quarter Highlights
Trading for the quarter ending 31 December 2005
• Turnover for the quarter was £10.8 million−Up 23% from £8.8 million for the same quarter last year−Up 1% from £10.7 million for the quarter to 30 September 2005
• Annualised revenue at 31 December 2005 was £42.5 million−Up 21% from £35.0 million at the same time last year−Down £0.2 million (-0.5%) from £42.7 million at 30 September 2005
• 1,642,000 sq ft occupied at the quarter end−Up 16% from 1,418,000 sq ft at the same time last year−Down 7,000 sq ft from 1,649,000 sq ft occupied at 30 September 2005
• We opened a 53,000 sq ft store in North Kensington on 12 December 2005 and initial trading has been encouraging. We expect to open our new store in central Bristol in March 2006, which will be our fifth opening this financial year
• In December, we acquired five freehold sites (one subject to planning), four in London at Kennington, Ealing/Hanwell, Sutton and South Bow, and one in Liverpool. These new stores will provide a further 310,000 sq ft of self storage capacity when fully developed
• These newly acquired freehold sites take the total number of stores open or in planning and development to 52, which when fully developed will provide self-storage capacity of 3.2 million sq ft
• 36 stores are now open (total capacity of 2.16 million sq ft) and of the remaining 16 (total capacity 1.04 million sq ft) six have planning permission
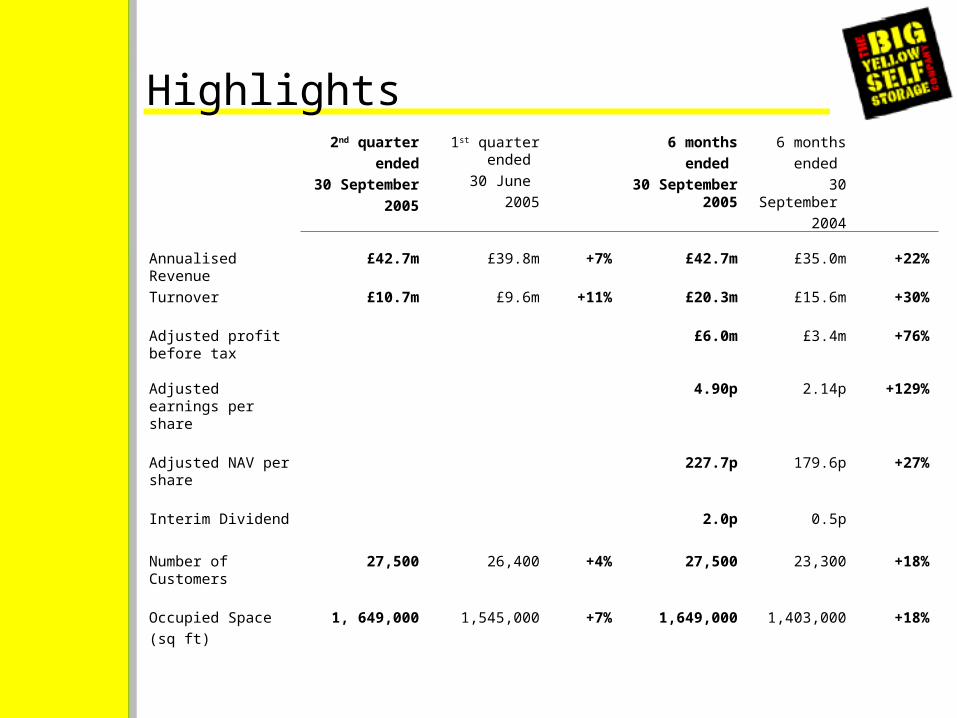
Highlights2nd quarter
ended30
September 2005
1st quarter ended
30 June 2005
6 months ended
30 September
2005
6 months ended
30 September
2004
Annualised Revenue
£42.7m £39.8m +7% £42.7m £35.0m +22%
Turnover £10.7m £9.6m +11% £20.3m £15.6m +30%
Adjusted profit before tax
£6.0m £3.4m +76%
Adjusted earnings per share
4.90p 2.14p +129%
Adjusted NAV per share
227.7p 179.6p +27%
Interim Dividend
Number of Customers
27,500 26,400 +4%
2.0p
27,500
0.5p
23,300 +18%
Occupied Space (sq ft)
1, 649,000 1,545,000 +7%
1,649,000 1,403,000 +18%
Highlights - Continued
• Adjusted profit before tax of £6.0 million up 76% (2004: £3.4 million)
• Adjusted net assets per share of 227.7 pence as at 30 September 2005 (2004: 179.6 pence) (March 05: 191.1 pence)
• Interim dividend increased to 2.0 pence per ordinary share (2004: 0.5 pence)
• 36 stores currently open with a further 16 committed, providing 3.2 million sq ft of self storage space when completed
• Acquired four freehold sites in London (Kennington, Ealing/Hanwell, Sutton and South Bow) and one freehold site in Liverpool
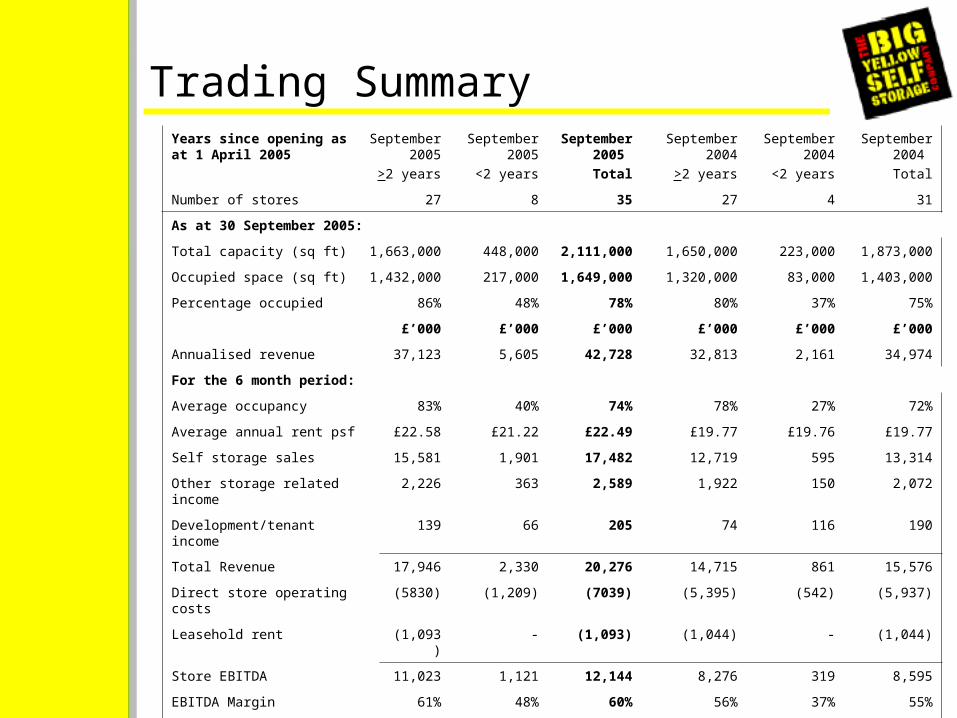
Trading SummaryYears since opening as at 1 April 2005
September 2005
>2 years
September 2005
<2 years
September 2005
Total
September 2004
>2 years
September 2004
<2 years
September 2004 Total
Number of stores 27 8 35 27 4 31
As at 30 September 2005:
Total capacity (sq ft) 1,663,000 448,000 2,111,000
1,650,000 223,000 1,873,000
Occupied space (sq ft) 1,432,000 217,000 1,649,000
1,320,000 83,000 1,403,000
Percentage occupied 86% 48% 78% 80% 37% 75%
£’000 £’000 £’000 £’000 £’000 £’000
Annualised revenue 37,123 5,605 42,728 32,813 2,161 34,974
For the 6 month period:
Average occupancy 83% 40% 74% 78% 27% 72%
Average annual rent psf £22.58 £21.22 £22.49 £19.77 £19.76 £19.77
Self storage sales 15,581 1,901 17,482 12,719 595 13,314
Other storage related income 2,226 363 2,589 1,922 150 2,072
Development/tenant income 139 66 205 74 116 190
Total Revenue 17,946 2,330 20,276 14,715 861 15,576
Direct store operating costs (5830) (1,209) (7039) (5,395) (542) (5,937)
Leasehold rent (1,093) - (1,093) (1,044) - (1,044)
Store EBITDA 11,023 1,121 12,144 8,276 319 8,595
EBITDA Margin 61% 48% 60% 56% 37% 55%
Central overhead (1,093) (248) (1,341) (946) (86) (1,032)
Store Net Operating Income 9930 873 10,803 7,330 233 7,563
NOI Margin 55% 37% 53% 50% 27% 49%
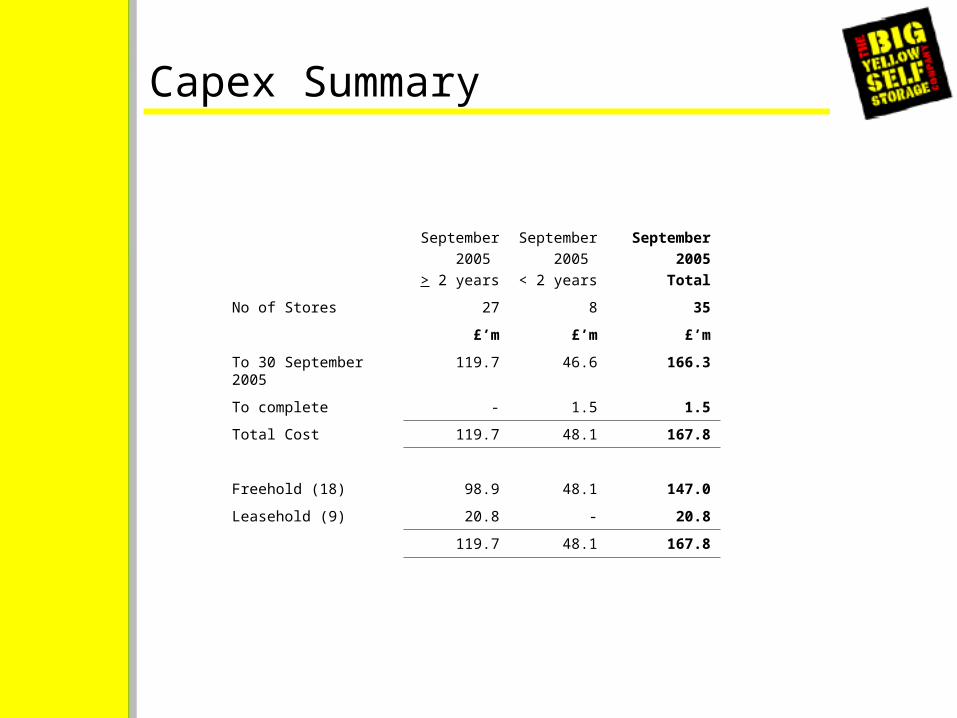
Capex Summary
September 2005
> 2 years
September
2005 < 2 years
September2005Total
No of Stores 27 8 35
£’m £’m £’m
To 30 September 2005
119.7 46.6 166.3
To complete - 1.5 1.5
Total Cost 119.7 48.1 167.8
Freehold (18) 98.9 48.1 147.0
Leasehold (9) 20.8 - 20.8
119.7 48.1 167.8
Store Trading Performance
6 Months to 30 September 2005:
• 35 stores open with total capacity 2.1 million sq ft
• 1.65 million sq ft occupied, 78%
• 179,000 sq ft occupancy growth in the last 6 months(2004: 135,000 sq ft)
• New stores performing well
• 27 stores open more than 2 years:− 86% occupied (2004: 80%)− Same store revenue up 22%; 15% is yield improvement− Freehold stores EBITDA of 67% (Mar 2005: 66%)− Leasehold stores EBITDA of 51% (Mar 2005: 51%)
• Net annual storage revenue psf of £22.49 on portfolio (2004: £19.77)
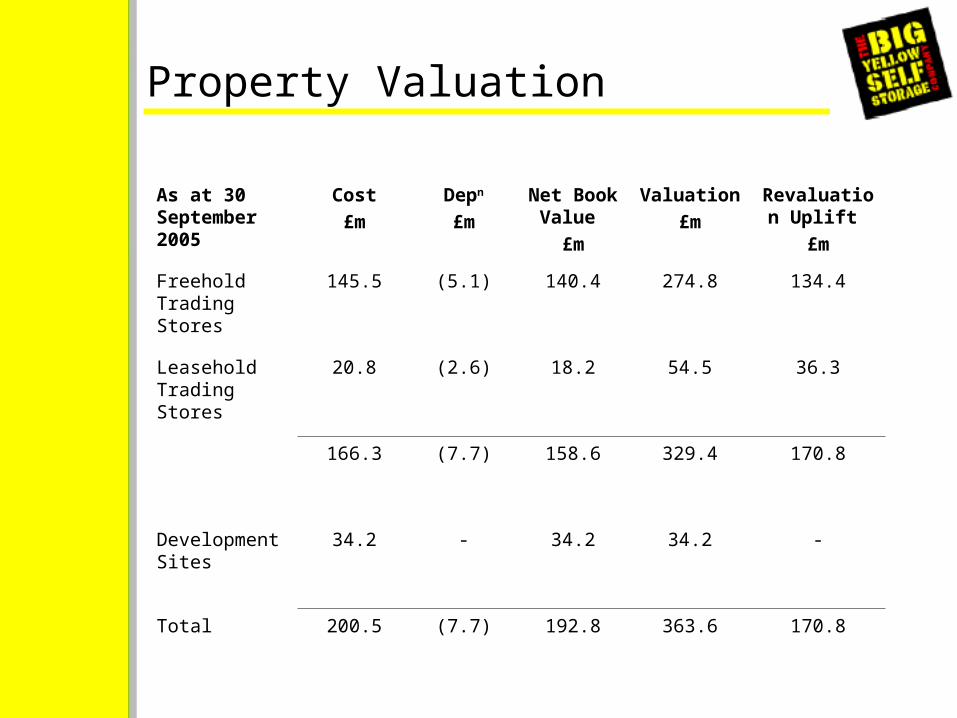
Property Valuation
As at 30 September 2005
Cost£m
Depn
£mNet
Book Value
£m
Valuation£m
Revaluation Uplift
£m
Freehold Trading Stores
145.5 (5.1) 140.4 274.8 134.4
Leasehold Trading Stores
20.8 (2.6) 18.2 54.5 36.3
166.3 (7.7) 158.6 329.4 170.8
Development Sites
34.2 - 34.2 34.2 -
Total 200.5 (7.7) 192.8 363.6 170.8
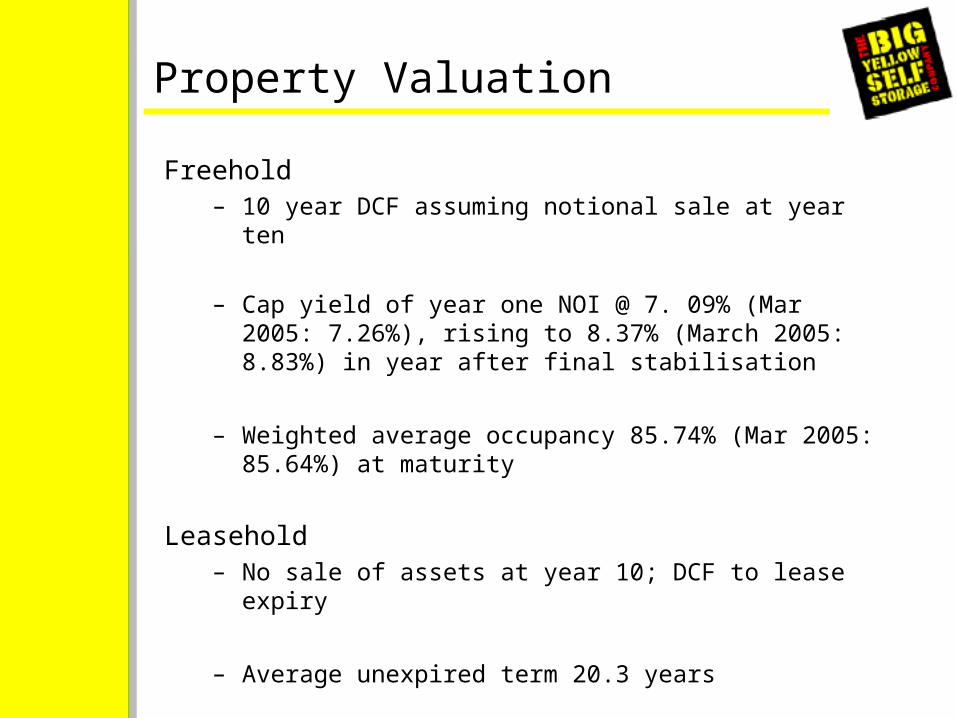
Property Valuation
Freehold– 10 year DCF assuming notional sale at year ten
– Cap yield of year one NOI @ 7. 09% (Mar 2005: 7.26%), rising to 8.37% (March 2005: 8.83%) in year after final stabilisation
– Weighted average occupancy 85.74% (Mar 2005: 85.64%) at maturity
Leasehold– No sale of assets at year 10; DCF to lease expiry
– Average unexpired term 20.3 years
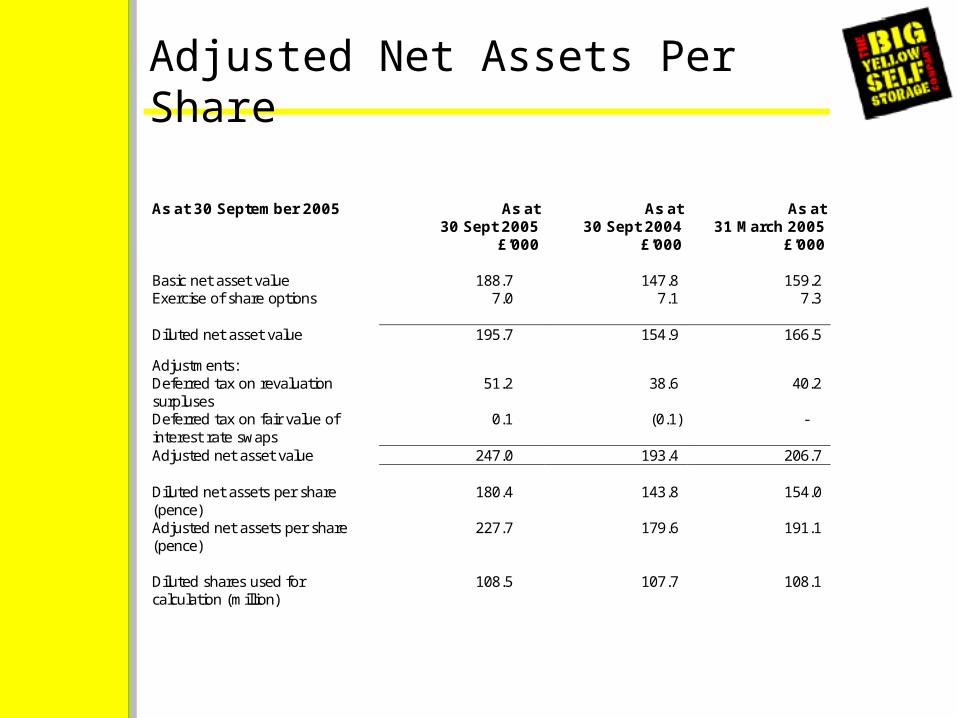
Adjusted Net Assets Per Share As at 30 September 2005 As at
30 Sept 2005 £’000
As at 30 Sept 2004
£’000
As at 31 March 2005
£’000 Basic net asset value 188.7 147.8 159.2 Exercise of share options 7.0 7.1 7.3 Diluted net asset value 195.7 154.9 166.5
Adjustments: Deferred tax on revaluation surpluses
51.2 38.6 40.2
Deferred tax on fair value of interest rate swaps
0.1 (0.1) -
Adjusted net asset value 247.0 193.4 206.7 Diluted net assets per share (pence)
180.4 143.8 154.0
Adjusted net assets per share (pence)
227.7 179.6 191.1
Diluted shares used for calculation (million)
108.5 107.7 108.1
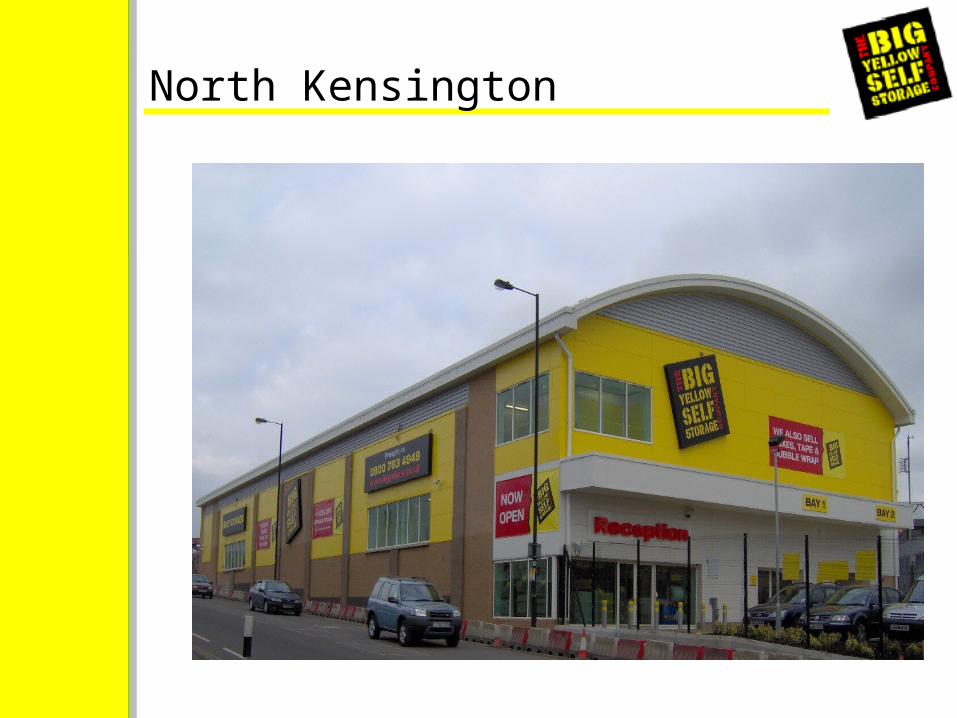
North Kensington
Property Review
• Acquired four freehold sites in London (Kennington, Ealing/Hanwell, Sutton and South Bow) and one freehold site in Liverpool
• 42 of 52 stores are freehold, 1 long leasehold and 9 leasehold
• Planning permissions on 42 stores
– Remaining 10 are subject to Planning Applications
• 16 stores in pipeline (12 in London) - will provide additional 1.04 million sq ft
• 32 located in Greater London (within M25), 2.04 million sq ft (64%)
Property Strategy• Current portfolio
– 52 stores and sites, providing 3.2 million sq ft of net storage– Average store size is approximately 62,000 sq ft– 85% freehold currently by number of stores and this will
continue to increase
• Future
– Acquire between 6 and 8 sites per annum
– Freehold bias
– Maintaining current average store size– UK only – Greater London, Midlands and North (Leeds and
Liverpool)– Timing of store openings will depend on planning permissions
• Sites– Target for current year is 6-8 site acquisitions, 3 to date– Planning and site acquisition remain difficult– Surplus land– Mixed use schemes (Kingston, Blackheath and Kennington)
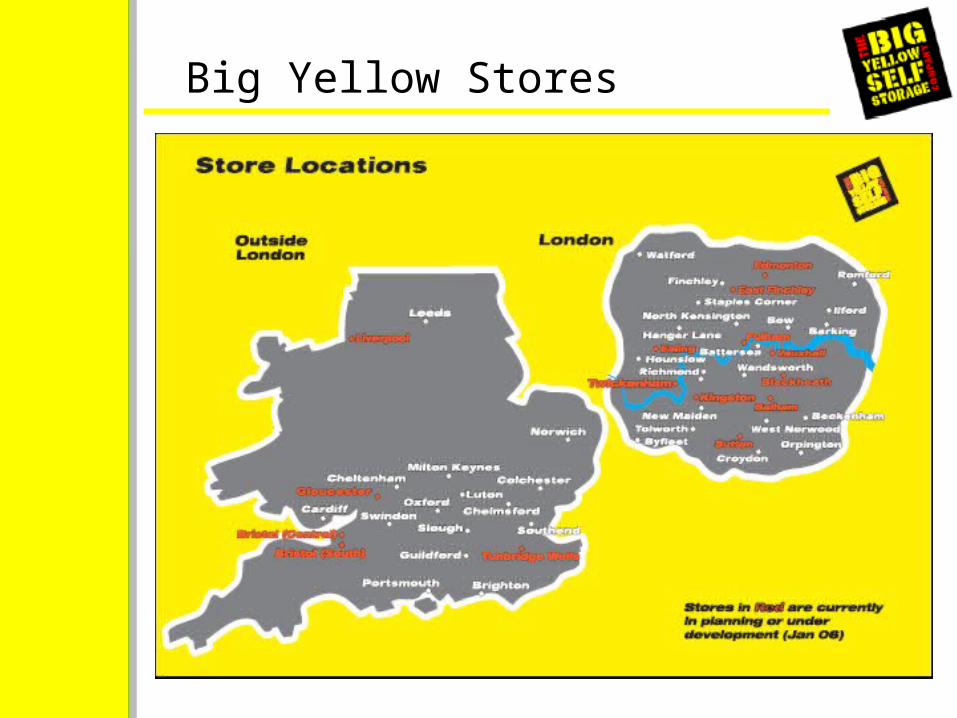
Big Yellow Stores
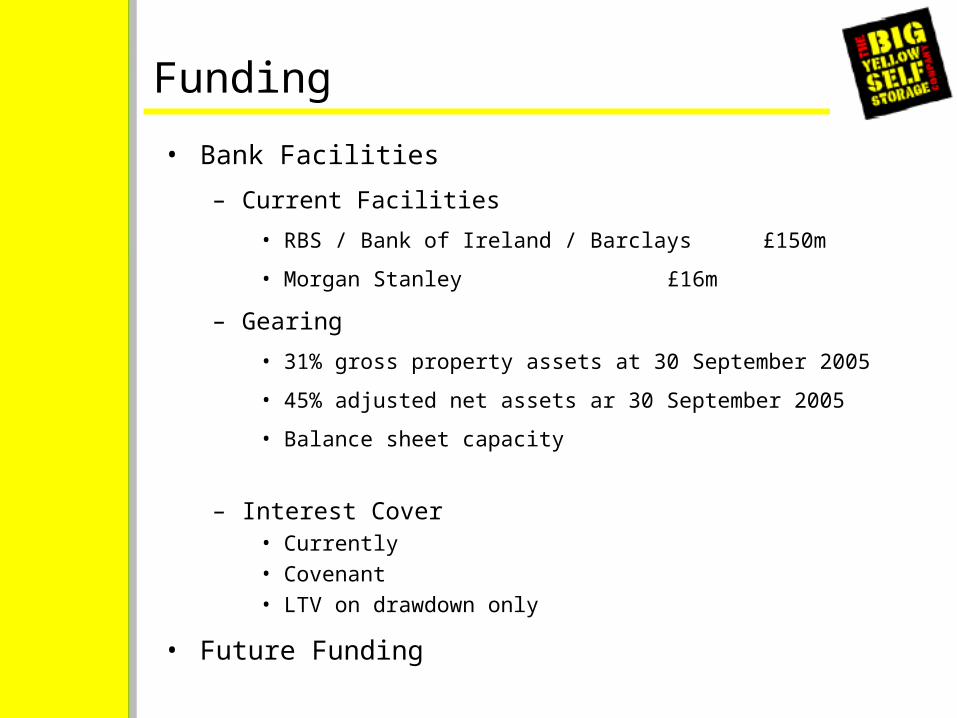
Funding
• Bank Facilities
– Current Facilities
• RBS / Bank of Ireland / Barclays £150m
• Morgan Stanley £16m
– Gearing
• 31% gross property assets at 30 September 2005
• 45% adjusted net assets ar 30 September 2005
• Balance sheet capacity
– Interest Cover• Currently• Covenant• LTV on drawdown only
• Future Funding

Conclusion
• Current Trading
• Outlook

Appendix
History
• Early 1998 - market research commenced
• October 1998 - Formed Cubic Self Storage
• January 1999 - Acquisition of Big Yellow Self Storage Company
• September 1999 - Pramerica investment
• May 2000 - AIM listing
• May 2001 - Placing and Open Offer
• June 2002 - Full listing
• February 2005 – Placing of Pramerica stake
Self-Storage Market
• The Market
– US market • 39,000 self-storage centres• 1.5 billion sq ft – 4-5 sq ft per person• Occupancy range of 82-89% since 1990• Population 300 million (approximately)
– UK market• Circa 450 self-storage centres• 15-18 million sq ft – 0.2-0.3 sq ft per person• Latest member survey indicates current occupancy on
whole market at 70%, with a mature store typically > 80%
• Population 60 million (approximately)
Self-Storage Market
• Key influencers
– Public awareness – low, new growing market
– Population mobility and density
– Physical planning and constraints, smaller homes
– Focus on high density development on brownfield sites
– Rising disposable incomes with GDP growth
– Growth in housing demand, divorce, single parent families, single living
– Small business formation requiring flexible, economic space
UK Market Potential
• Awareness of self-storage– Currently 15-20% in London– Much lower <5% in other major cities
• Significant advertising and promotion raising awareness
• Strong brands, roadside visibility also raising awareness
• New customers being created as market grows, e.g. lifestyle, de-cluttering
• 25% US penetration would imply the potential for 1500-1800 centres and approximately 1 sq ft per person
• At growth of 10%, 45-50 centres per year, this will take many years!
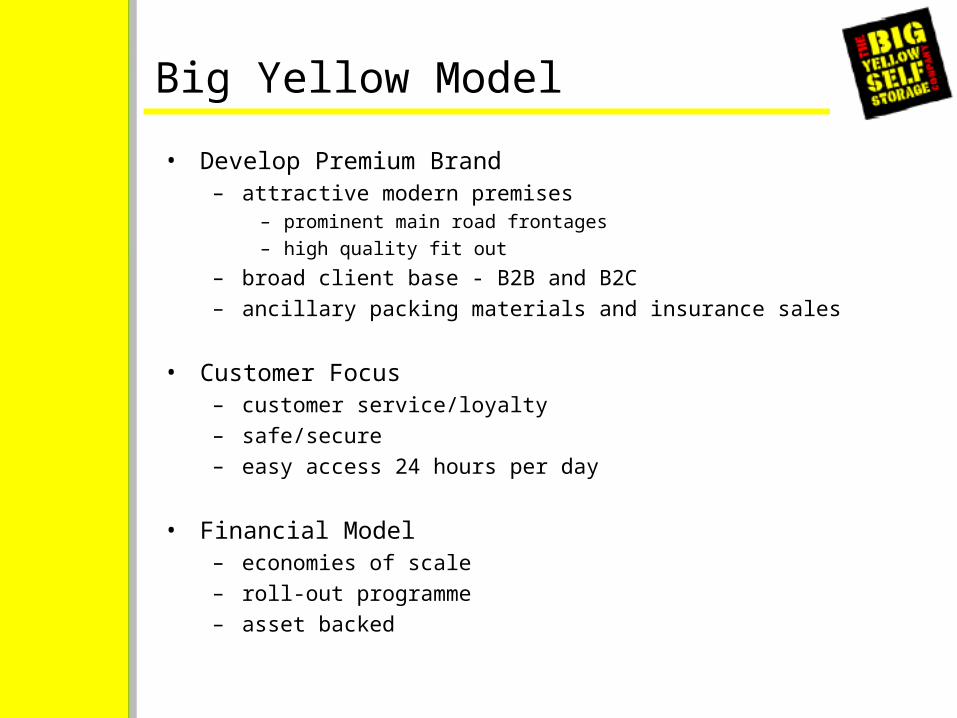
Big Yellow Model
• Develop Premium Brand– attractive modern premises
– prominent main road frontages– high quality fit out
– broad client base - B2B and B2C– ancillary packing materials and insurance sales
• Customer Focus– customer service/loyalty– safe/secure– easy access 24 hours per day
• Financial Model– economies of scale– roll-out programme– asset backed
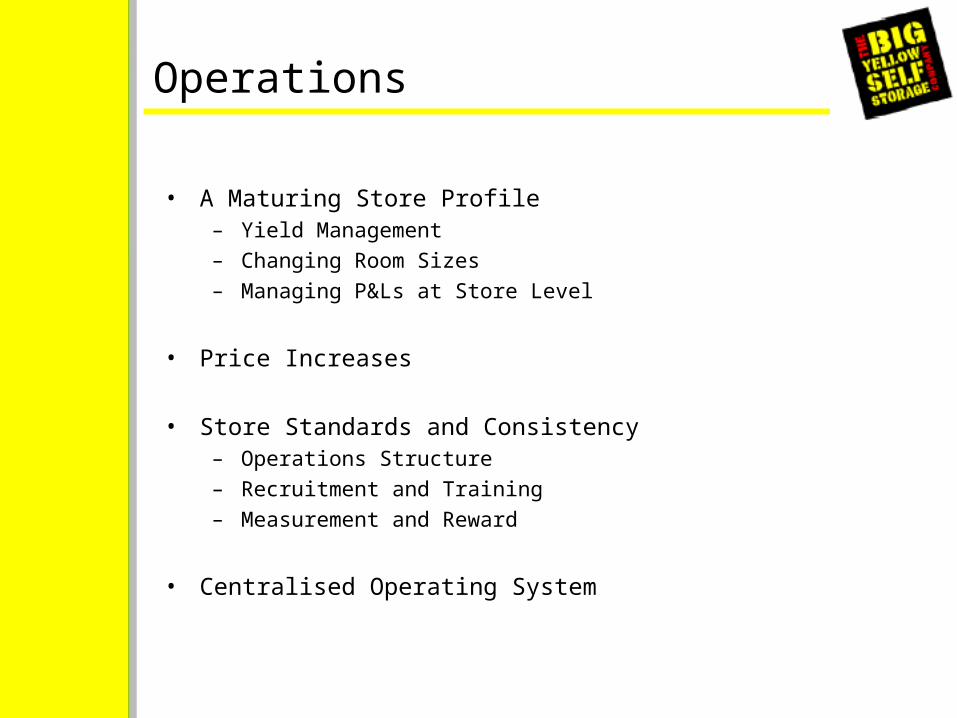
Operations
• A Maturing Store Profile– Yield Management– Changing Room Sizes– Managing P&Ls at Store Level
• Price Increases
• Store Standards and Consistency– Operations Structure– Recruitment and Training– Measurement and Reward
• Centralised Operating System

Sales and Marketing
• Store Promotions– Winter
– Summer
• Marketing– 4% of turnover
– Summer TV and Radio Campaign
• Customers– Business v Domestic
– Profile – age, gender
– How did they hear about us?
– Average Length of Stay
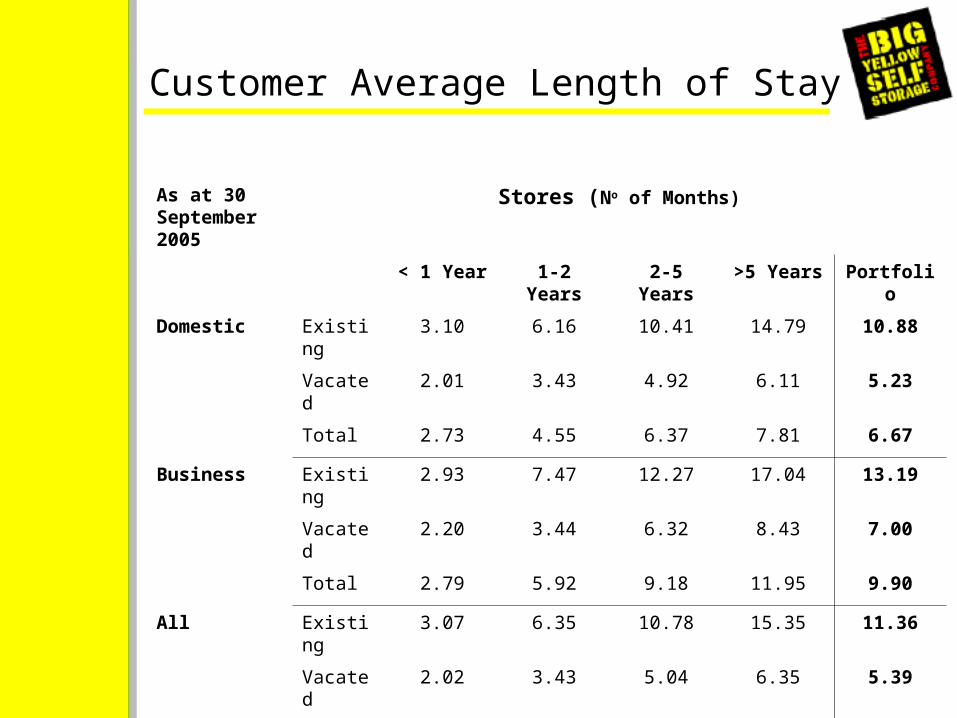
Customer Average Length of Stay
As at 30 September 2005
Stores (No of Months)
< 1 Year 1-2 Years
2-5 Years
>5 Years
Portfolio
Domestic Existing 3.10 6.16 10.41 14.79 10.88
Vacated
2.01 3.43 4.92 6.11 5.23
Total 2.73 4.55 6.37 7.81 6.67
Business Existing 2.93 7.47 12.27 17.04 13.19
Vacated
2.20 3.44 6.32 8.43 7.00
Total 2.79 5.92 9.18 11.95 9.90
All Existing 3.07 6.35 10.78 15.35 11.36
Vacated
2.02 3.43 5.04 6.35 5.39
Total 2.74 4.69 6.70 8.37 7.07