Embed Size (px)
Citation preview

FY2018 Half Year Results Briefing
27 February 2018
Big River Industries Limited (ASX:BRI)
Optus Stadium - Perth
H1 FY2018 - Contents
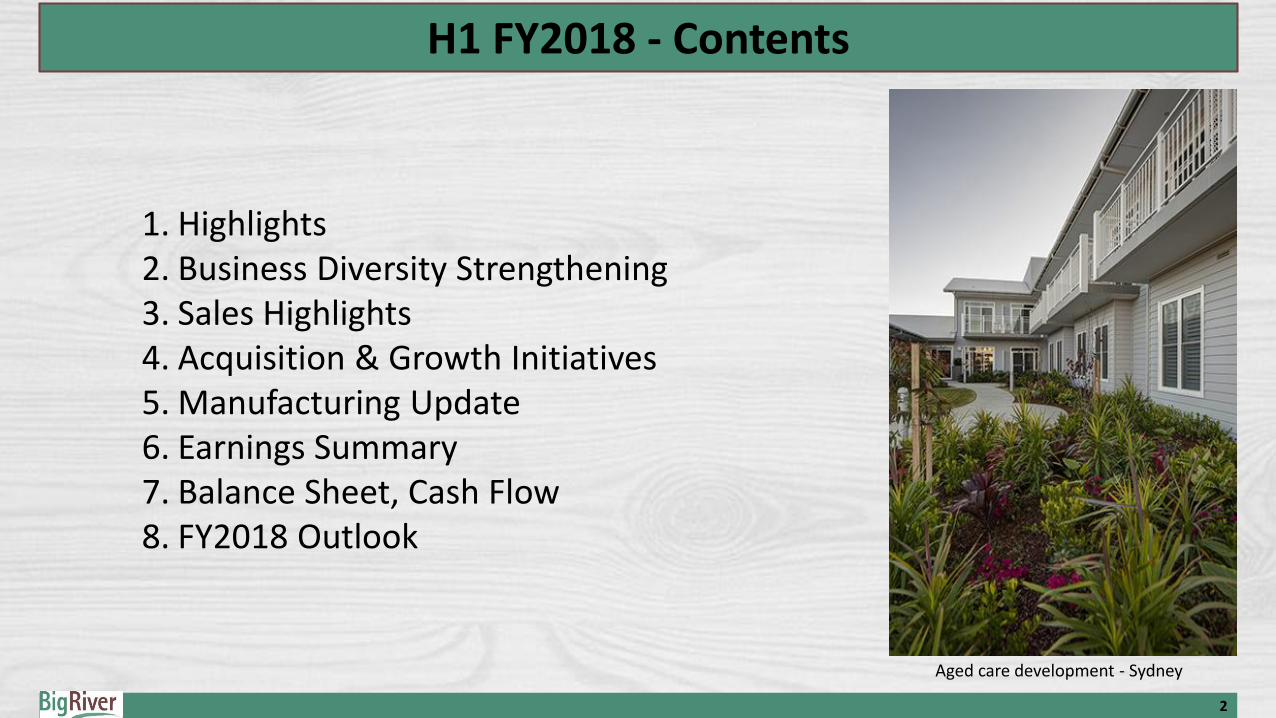
1. Highlights2. Business Diversity Strengthening3. Sales Highlights4. Acquisition & Growth Initiatives5. Manufacturing Update6. Earnings Summary7. Balance Sheet, Cash Flow8. FY2018 Outlook
2
Aged care development - Sydney

H1 FY2018 - Highlights
3
➢ Sales revenue up 21.8% on previous corresponding period, to $104.6m, assisted by acquisitions
➢ EBITDA (before acquisition costs) up 19.3% to $5.9m but below expectation as a result of lower profit from manufacturing operations
➢ NPAT of $2.9m up 15.8% on last year
➢ Distribution activities performed well, driven by a solid 70 bps improvement in gross margin despite very competitive market dynamics
➢ Completed two earnings accretive acquisitions in the Half, strengthening the network in the key regions of the Gold Coast and Canberra
➢ Managing the balance between manufactured and imported Formply was challenging for the Wagga manufacturing facility - impacted EBITDA and is being addressed
➢ Key new capital equipment installed and commissioned in Grafton to further focus the manufacturing assets on high value, differentiated products; the benefits are more likely to be realised in FY2019
➢ Fully franked interim dividend of 3.5 cps to be paid on 4 April 2018, equivalent to 64% of NPAT (being the midpoint of the dividend policy)
Unit development - Botany
HIA award winning home - Sydney

H1 FY2018 - Business Diversity Strengthening
➢ Canberra acquisition will see ACT contribute some 6% on annualised basis
➢ QLD strenghth due to the well spread 5 distribution sites
➢ Segment diversity continues to improve
30%
13%
14%
22%
11%
3%7% Detached housing
Medium density residential
High density residential
Commercial
Civil
Industrial
Alterations & Additions
Revenue By Segment
33%
34%
15%
10%
5%
3%
NSW
QLD
VIC
SA
WA
ACT
Revenue By State
4

H1 FY2018 - Sales Highlights
5
➢ Revenue has grown 21.8% in the last 12 months as Big River executes the acquisition component of its strategy
➢ Acquisitions contributed $18.2m of revenue in 1H18 since pcp
➢ Western Australia and North Queensland market recovery continues, with revenue up 20% versus 1H17 in both markets and EBITDA more than doubling in these branches
➢ Revenue growth of 2.1% (on a same stores basis) from distribution activities versus pcp flowed through to a 14.2% increase in EBITDA (on a same stores basis)
➢ Growth of architectural product sales of 17% (on a like-for-like basis) continues the strong 3 year trend in this high value segment following the launch of new panel and flooring products
➢ Sales of imported Formply increased 6 fold from a low base. Strong market share penetration achieved in this growing product category following a successful launch in the pcp
➢ 3 major Civil accounts in the Group top 20 customers reflect the strength of the Civil segment
Residential fit-out - Melbourne
Residential terraces – Sunshine Coast

H1 FY2018 - Acquisition & Growth Initiatives
6
➢ The Company continues a disciplined approach to acquisitions, with 4 contracts completed in calendar year 2017
➢ 1H18 EBITDA contribution from acquisitions of $1.2m and revenue contribution of $18.2m
➢ Big River continues to execute its acquisition strategy and is currently assessing acquisition opportunities in most states, with revenues in a range of sizes and segments
➢ National launch of Maxiwall, an autoclaved aerated concrete (AAC) product. Several projects have been secured for 2H18 along with pending project quotes for an additional $2m in revenue
➢ Fully commissioned $0.8m of new equipment at Grafton with the capability to enhance architectural product manufacture and produce high grade structural plywood products leading to higher margin revenue growth
➢ Decorative architectural panel sales in 1H18 were double those of the corresponding period last year with opportunity to increase further from the new Grafton equipment
Maxiwall project - Adelaide
Restaurant Armourpanel fit-out - Sydney

H1 FY2018 - Manufacturing Update
7
➢ Energy costs at manufacturing sites increased $0.4m for 1H18 versus the pcp, despite a 10% reduction in plywood output
▪ Annualised impact of higher gas and electricity pricing is $0.9m which is $0.4m higher than the prospectus forecast
▪ Volume reduction and Power Factor equipment installed will improve energy efficiencies at both sites
➢ A significant restructure was implemented at Christmas shutdown at Wagga, which included elimination of 25 positions
Manufacturing facility - Grafton
➢ EBITDA shortfall of $1.0m from manufacturing operations versus pcp
➢ Delays on regional bridge repair projects has seen minimal Bridgeply sales in the first half leading to $0.4m lower EBITDA than expected from this product and compared with $0.3m achieved in the pcp. Whilst several large projects have been quoted and confirmed, timing of revenue is uncertain
➢ Inefficiencies from production of lower grade commodity plywood products at Wagga saw EBITDA fall $0.4m below expectation
H1 FY2018 - Earnings Summary
8
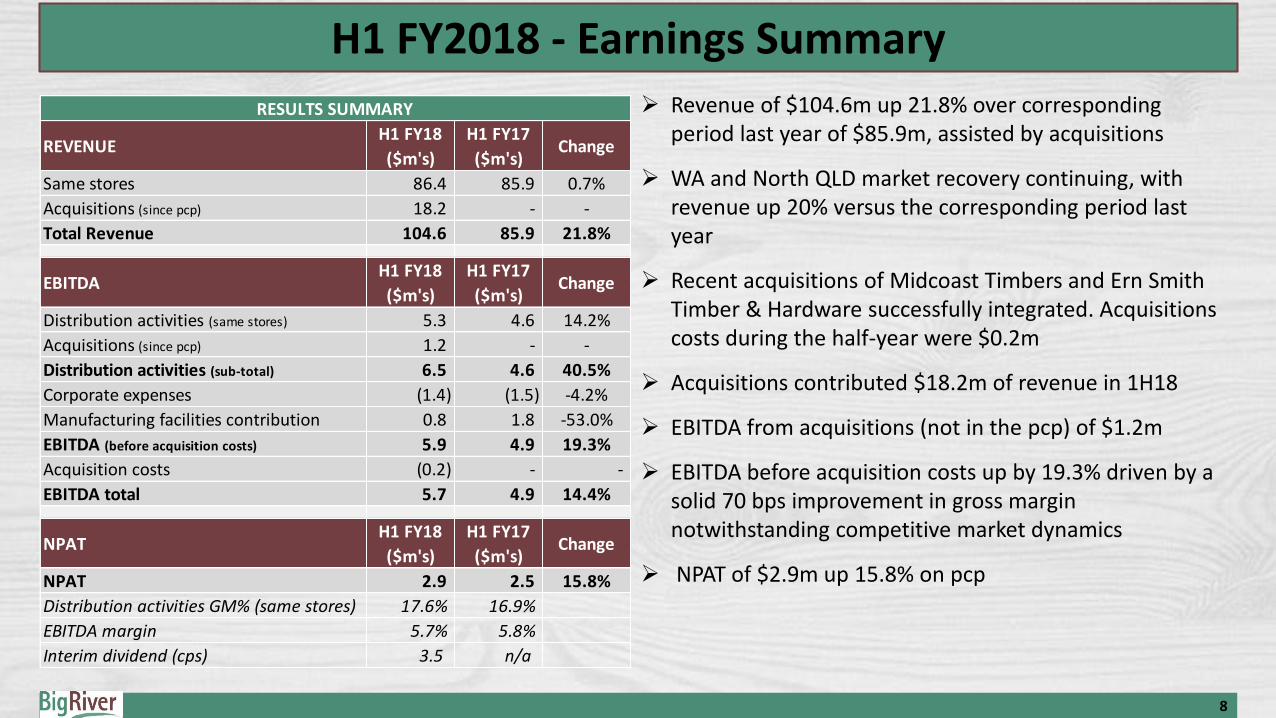
➢ Revenue of $104.6m up 21.8% over corresponding period last year of $85.9m, assisted by acquisitions
➢ WA and North QLD market recovery continuing, with revenue up 20% versus the corresponding period last year
➢ Recent acquisitions of Midcoast Timbers and Ern Smith Timber & Hardware successfully integrated. Acquisitions costs during the half-year were $0.2m
➢ Acquisitions contributed $18.2m of revenue in 1H18
➢ EBITDA from acquisitions (not in the pcp) of $1.2m
➢ EBITDA before acquisition costs up by 19.3% driven by a solid 70 bps improvement in gross margin notwithstanding competitive market dynamics
➢ NPAT of $2.9m up 15.8% on pcp
REVENUEH1 FY18
($m's)
H1 FY17
($m's)Change
Same stores 86.4 85.9 0.7%
Acquisitions (since pcp) 18.2 - -
Total Revenue 104.6 85.9 21.8%
EBITDAH1 FY18
($m's)
H1 FY17
($m's)Change
Distribution activities (same stores) 5.3 4.6 14.2%
Acquisitions (since pcp) 1.2 - -
Distribution activities (sub-total) 6.5 4.6 40.5%
Corporate expenses (1.4) (1.5) -4.2%
Manufacturing facilities contribution 0.8 1.8 -53.0%
EBITDA (before acquisition costs) 5.9 4.9 19.3%
Acquisition costs (0.2) - -
EBITDA total 5.7 4.9 14.4%
NPATH1 FY18
($m's)
H1 FY17
($m's)Change
NPAT 2.9 2.5 15.8%
Distribution activities GM% (same stores) 17.6% 16.9%
EBITDA margin 5.7% 5.8%
Interim dividend (cps) 3.5 n/a
RESULTS SUMMARY

H1 FY2018 - Balance Sheet
➢ Continued focus on working capital management with a trade working capital (TWC) ratio of 16.3% on a rolling 12 month basis (including pro forma revenue from acquisitions)
➢ Average debtor days during the half-year of 54 improved from an average of 57 in FY2017
➢ Increase in inventory is from acquisitions and from an increased range including imported products such as Formply, engineered flooring and Maxiwall
➢ Increase in intangibles from the recent acquisitions
➢ Borrowings – net debt increased to $9.9m, up from $4.0m primarily from $3.6m for acquisitions and a small increase in like-for-like working capital
➢ Total banking facilities of $33.2m and a gearing ratio of 14.5% (Net Debt/(Net Debt + Equity)) leaves Big River well positioned to continue its acquisition growth strategy
9
Balance Sheet31 Dec 17
($m's)
30 Jun 17
($m's)
Cash 0.8 3.6
Receivables 32.3 36.8
Inventories 30.1 24.4
Fixed assets 25.8 24.6
Intangibles 9.4 7.4
Deferred tax 2.3 2.3
Other 2.4 0.9
Total Assets 103.1 100.0
Payables 29.5 30.9
Borrowings 10.7 7.6
Current tax liability 0.5 1.2
Deferred tax liability 0.3 0.4
Provisions 3.6 3.4
Total Liabilities 44.6 43.5
Net Assets 58.5 56.5
Net Debt $m's 9.9 4.0
Gearing % 14.5% 6.6%
TWC $m's 35.3 31.2
TWC (% RTM revenue) 16.3% 15.8%
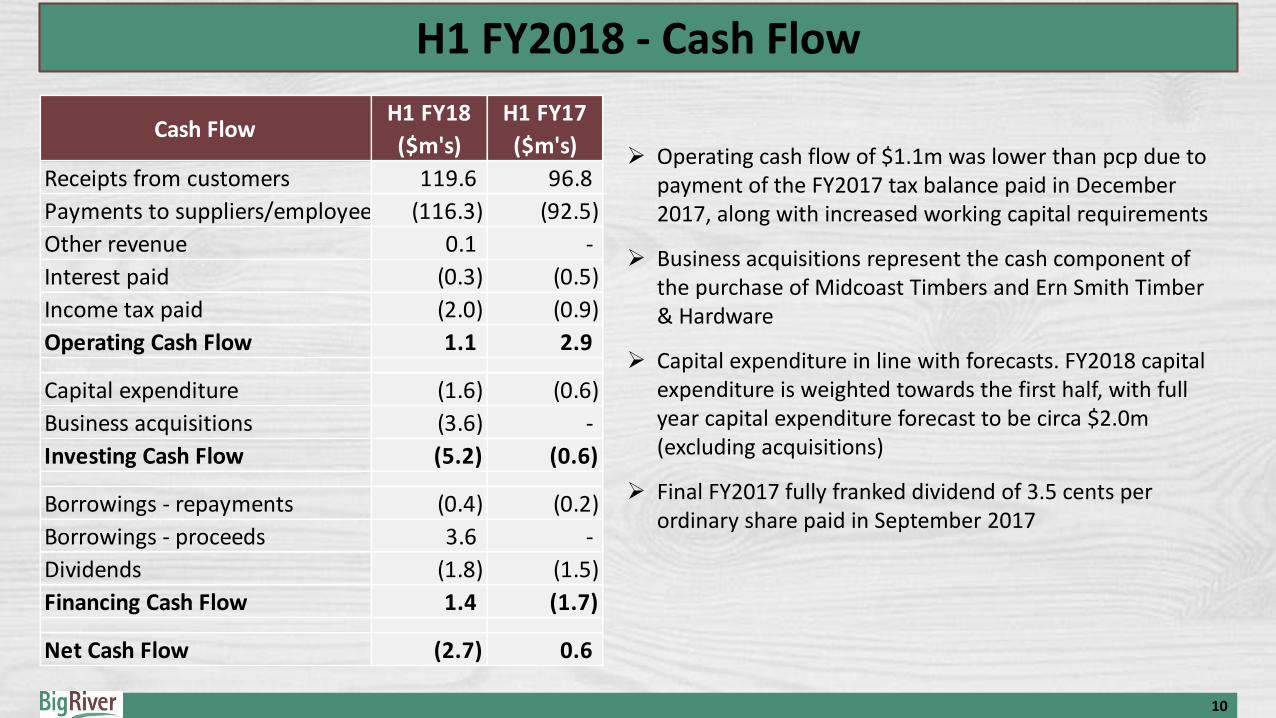
H1 FY2018 - Cash Flow
➢ Operating cash flow of $1.1m was lower than pcp due to payment of the FY2017 tax balance paid in December 2017, along with increased working capital requirements
➢ Business acquisitions represent the cash component of the purchase of Midcoast Timbers and Ern Smith Timber & Hardware
➢ Capital expenditure in line with forecasts. FY2018 capital expenditure is weighted towards the first half, with full year capital expenditure forecast to be circa $2.0m (excluding acquisitions)
➢ Final FY2017 fully franked dividend of 3.5 cents per ordinary share paid in September 2017
10
Cash FlowH1 FY18
($m's)
H1 FY17
($m's)
Receipts from customers 119.6 96.8
Payments to suppliers/employees (116.3) (92.5)
Other revenue 0.1 -
Interest paid (0.3) (0.5)
Income tax paid (2.0) (0.9)
Operating Cash Flow 1.1 2.9
Capital expenditure (1.6) (0.6)
Business acquisitions (3.6) -
Investing Cash Flow (5.2) (0.6)
Borrowings - repayments (0.4) (0.2)
Borrowings - proceeds 3.6 -
Dividends (1.8) (1.5)
Financing Cash Flow 1.4 (1.7)
Net Cash Flow (2.7) 0.6

11
FY2018 - Outlook
David Jones food hall – Bondi Junction
Waitomo Caves visitors centre – New Zealand
➢ Despite medium and high density construction having softened in some regions, the pipeline for the Group is still healthy for the balance of FY2018
➢ Strong commercial sector forecasts provides upside for 2H18 and FY2019
➢ The Company continues to be approached by a range of parties with further acquisition opportunities which are being evaluated
➢ Increased customer demand for imported Formply is expected to continue, placing pressure on contributions from the Wagga manufacturing facility, mitigated by a restructure of resources now occurring
➢ The Company provides guidance for the full 2018 financial year as follows:
▪ Revenue in the range of $208m to $212m
▪ EBITDA in the range of $11.5m to $12.5m
Important Notice and Disclaimer➢ This presentation is dated 27 February 2018.
➢ Big River Industries Limited (the "Company") advises that the information contained in this presentation is intended to be general background information about the Company's activities as at the date of this presentation. It is information given in summary form and is therefore not necessarily complete.
➢ It is not intended that it be relied upon as advice to investors or potential investors, who should seek independent professional advice depending upon their specific investment objectives, financial situation or particular needs. The material contained in the presentation may include information derived from publicly available sources that has not been independently verified.
➢ The information in the presentation contains forward looking statements, which include statements regarding the Company's intent, belief or current expectations with respect to the business and operations, market conditions, results of operations and financial condition, which may be subject to uncertainties outside the Company's control and therefore no representation or warranty, express or implied, is made or given as to the accuracy, reliability or completeness of the information, opinions or conclusionsexpressed in this presentation. There can be no assurance that future developments will be in accordance with the Company's expectations or that the effect of future developments on the Company will be those anticipated. Actual results could differ materially from those which the Company expects, depending on the outcome of various factors.
➢ The Company is under no obligation to disseminate updates or revisions to any forward looking statements in this presentation toreflect any change in expectations in relation to any forward looking statements or any change in events, conditions or circumstances on which any such statement is based.
➢ This presentation should not be relied upon as a recommendation or forecast by the Company.
➢ This presentation should be read in conjunction with the H1 FY2018 Appendix 4D and the FY2017 Annual Report.
12