Embed Size (px)
Citation preview
48 Industrial Engineer
Although small and medium enterprises (SMEs) are a key factor in the economies of all countries and regions, they sometimes face big gaps in production and performance when compared to large companies. One important gap is the fact that most SMEs do not use and implement information technologies to their full potential. This entails a significant loss of resources and consequently disappoints managers about how such technology can benefit the company. For exam-ple, several studies show that acquiring hardware and software licenses can be one of the most important investments a small or medium business can make. But evidence abounds that these companies have problems in fully exploiting the func-tionality of their new purchases.
Three factors explain why it is difficult for smaller compa-nies to use IT effectively. First, while almost all SMEs have a vision that acts as a guideline for IT, they often lack a definite roadmap to implement a strategy to prioritize investment proj-ects for the medium and long term. Second, smaller enterprises have a strong operational focus. Their lack of resources requires them to focus on the most important function of the business — operations — which reduces the effort that can be spent on nonoperating and support activities, such as effectively manag-ing IT. Third, smaller businesses often lack IT knowledge and skills. They have few specialized staff, and scarce resources
negatively affect the recruitment of IT professionals who can support and enhance strategic IT utilization.
This well-documented problem has few effective solutions. Researchers have placed a greater emphasis on larger enter-prises, so it is clear that more tools are needed to help small and medium organizations optimize their use of IT.
We developed a quick-scan method that helps a consultant or IT expert analyze the role of IT in a smaller enterprise and develop recommendations for improving its use. It is called information technology-quick-scan method (IT-QSM). The method requires two investigators and is applied in a session that lasts a day. It merges qualitative and quantitative data gathering and analysis techniques to explore the manager’s views about aligning IT with organizational goals. At the end of the day, researchers present their conclusions and recommen-dations to the manager and the IT leader of the organization. (We use the term “IT leader” because people in charge of IT could have various position titles.) The method was tested in seven organizations in New Zealand and Colombia. After the first three cases, feedback from participants showed that the
IT for small
companiesBy AlejAndro j. CAtAldo,
roBert j. MCQueen And
MArCos sepulvedA
Quick-scan method makes up for lack of resources
Big
May 2011 49
test had a high level of acceptance and usefulness.The test application described below shows how each step of
IT-QSM is executed.
Presenting IT-QSMInitiate the process, which is summarized in Figure 1, with a meeting between the main investigator and the manager. The manager’s initial enthusiasm is a key factor for the success of the work, so it is important to know the manager’s expecta-tions about IT-QSM. This meeting presents the requirements of the method. The investigators’ needs are simple: time and access to key informants, access to company facilities and documentation, a private room where researchers can discuss their conclusions and an Internet connection.
After this initial meeting, the researchers send two sets of questionnaires to be completed by the manager and the IT leader. The questionnaires help reduce the time spent inter-viewing these key informants. Not all respondents answered the questionnaires in advance, so in those cases, add about 30 to 40 minutes of time for each interview. Additionally, the investigators ask for relevant information about the company and its products. This information could include strategic or business plans and presentations about the company.
The questionnaires were based on three important research projects in the field of IT alignment in business. A set of
questions was developed to gather data about the company’s strategic orientation based on the work of N. Venkat Venka-traman. In his 1989 paper, “Strategic Orientation of Business Enterprises: The Construct, Dimensionality, and Measure-ment,” Venkatraman proposed that the strategic orientation of a business enterprise (STROBE) could be measured using eight dimensions, or variables: aggressiveness, analysis, internal defensiveness, external defensiveness, futurity, proac-tiveness, risk aversion and innovativeness. The company manager fills out Venkatraman’s questionnaire.
Using Venkatraman’s framework, authors Yolande Chan, Sid Huff, Donald Barclay and Duncan Copeland developed another questionnaire to measure the strategic orientation of the systems in an enterprise (STROIS) through their paper, “Business Strategic Orientation, Information Systems Strategic Orientation, and Strategic Alignment.” The STROIS is applied to the company’s IT leader. STROIS and STROBE are used together to measure the IT alignment by comparison.
The third frame of reference used in the questionnaires was developed by Paul Cragg, Marco Tagliavini and Annette Mills in their paper, “Evaluating the Alignment of IT with Business Processes in SMEs.” The authors proposed a set of question-naires to measure IT alignment in SMEs based on a set of standard processes transparent to the industry. These stan-dard processes were proposed by the American Productivity
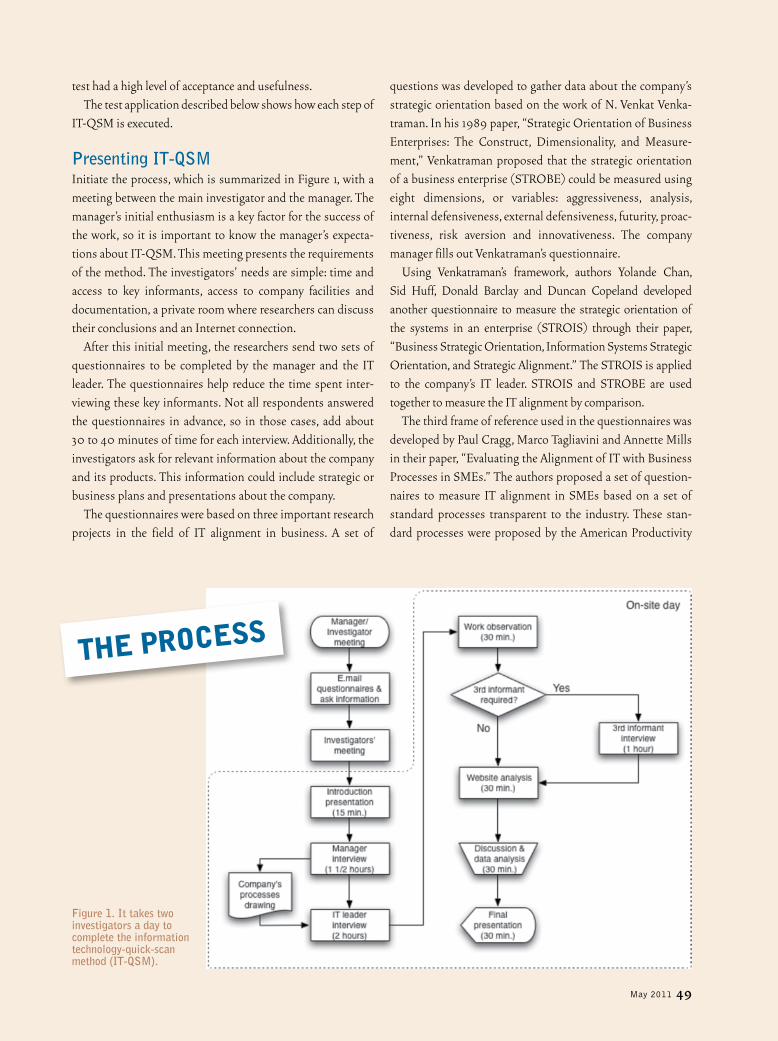
Figure 1. It takes two investigators a day to complete the information technology-quick-scan method (IT-QSM).
The process

50 Industrial Engineer
big IT for small companies
and Quality Center, which classified them in the 12 categories shown in Figure 2. Cragg and his colleagues developed two questionnaires to measure the alignment according to those 12 processes. One questionnaire was applied to the manager and the other to the IT leader.
IT-QSM uses two questionnaires. One is for the manager, who answers the STROBE questions and the managerial part of Cragg’s questionnaire. The second one is for the IT leader, who answers the STROIS questions and the technological part of Cragg’s questionnaire.
After the initial meeting and handing out the question-naires, investigators meet to discuss the company and their initial impressions. A two-person team reduces the bias that a single investigator might introduce because they can discuss and triangulate information to make more accurate recom-mendations. The team examines the information collected so far, including documents submitted by the manager, completed questionnaires (if any) and the company’s website. The meeting has three objectives: Discuss potential problems that may be present; list the systems that should exist; and prepare a set of key questions to respondents.
The fieldwork begins with a brief presentation of the method to the key participants (the manager and IT leader). Then the work continues with a private interview of the
manager. This interview is to determine the company’s vision and the concerns of the manager. Another objective is to deter-mine the perceived role of IT and how the manager thinks IT can contribute to the company’s success. It also is important to get a view of the company’s relationship with its customers, suppliers, competitors and other stakeholders. For example, some important questions in this interview are:
• What are the key indicators of success?• How does the manager use these indicators?• How do the systems help to get that information?• What is the biggest pain of the company?
During this interview, ask the manager to draw the processes of the company. Understanding the manager’s diagram helped the investigators better understand the company. It also helped reveal the information flows in the processes and how systems could contribute to those processes. In other words, through the process diagram, the investigators discovered the major and minor contributions of the systems to the processes of the company. The interview with the manager lasts about one to one and a half hours. If the manager has not yet completed the questionnaires, add an extra 30 minutes.
The next step is to interview the IT leader to verify the infor-mation delivered by the manager, determine the frequency and level of contact between the leader and IT manager, and get a list of the IT systems used. In this interview, the diagram drawn by the manager becomes an important tool. The diagram helps clarify doubts that investigators have developed from the first interview. Experience from these initial tests shows that exter-nal consultants, when acting as the key IT leader, sometimes are not the best candidates for this role. Given that external consul-tants mainly have operational responsibilities, they show very little knowledge of how systems are used by the organization. For example, at one company the question was asked, “What systems do you miss in the company?” The consultant said, “I think we’d need a gigabit Ethernet network.” In those cases, it is preferable to find another key informant.
Another key step is to visit the operational facilities and observe how employees and interviewees use the systems. These observations help uncover bottlenecks and clarify misconceptions. For example, one manager said he had a system to manage the company’s innovation. When the investigators viewed the system, they realized it was just a PowerPoint slideshow. The manager mistakenly understood that such a presentation was an innovation system.
Investigators may decide to interview a third informant. This is evaluated on a case-by-case basis, depending on
Figure 2. The American Productivity and Quality Center classified a set of 12 processes that are transparent to industry.
The classificaTion
abbreviationP1P2
P3
P4P5P6
P7P8P9
P10
P11P12
processDevelop vision and strategyDevelop and manage products and servicesMarket and sell products and servicesDeliver products and servicesManage customer serviceDevelop and manage human capitalManage information technologyManage financial resourcesAcquire, construct and manage propertyManage environmental health and safetyManage external relationshipsManage knowledge, improvement and change

May 2011 51
whether more information is needed. For example, in the case of the aforementioned consultant, the researchers decided to interview the company’s contact with the consultant.
Analyzing the company’s website is an important part of IT-QSM because the site delivers a lot of information about the implicit role of IT in the company’s systems. Comments about the company website were highly valued by managers in the feedback sessions, especially for small, low-cost ways to improve the company’s positioning in search engines like Google. The website analysis should examine things such as when the last update was done, content and active links, posi-tioning of the page in Google searches for combinations of keywords, and comparison of the site with two competitors’ sites — one a large business and the other a small one. The larger competitor was used as reference for future improvements. The smaller business helped reduce resistance to improvements by managers who looked at their larger competitors, agreed that they had wonderful websites, but doubted whether a company their size could pull it off. In three Colombian operations, the company had no website. In this situation, we showed the sites of competitors and delivered a list of recommendations to design a website.
The last two steps in the daylong quick scan are developing conclusions and recommendations and presenting them to the manager. All respondents should attend this presentation because we found that the discussion between the quick-scan investigators and the management team generated a wealth
of ideas and suggestions. At the end of the presentation and discussion, we asked for feedback on the effectiveness and usefulness of the process.
The presentation summarized the qualitative and quantita-tive results. For the latter, we developed a way to synthesize the information collected from the questionnaires using two radar charts similar to the illustration in Figure 3. These charts show the alignment gaps between strategic priorities and IT support. The graphs use the 12 standard process classifica-tions developed by the American Productivity and Quality Center. They are constructed according to the strategic impor-tance of each of the variables by putting the most important on the top part of the chart. The others are arranged clock-wise in descending order of importance. Matching techniques determined the alignment of each variable. The gray line represents the alignment of each variable measured between zero and one, and the gap between one and the gray line indi-cates alignment problems.
driving growthGovernments and entrepreneurs worldwide see the deployment of information technology systems as a key to driving the growth of small and medium-sized businesses.
For example, Singapore’s enterprise develop-ment agency invested $20.05 million in 69 startup enterprises last year, with a large share of that in IT and communication companies. Many of Europe’s most creative information and communi-cations technology companies are small businesses that have developed niche technological solutions.
Vietnam’s government is pushing to upgrade its information infrastructure after noting that more than 50 percent of enterprises do not use software for labor force and wage management. At a March conference in Ghana, specialists encouraged the government to improve commu-nications infrastructure, access and affordability of ICT equipment.
And India’s secretary of the Ministry of Micro, Small and Medium Enterprise, Uday Kumar Varma, told the SME Times that no matter the size, all businesses need to incorporate more IT.
“There is no way SMEs can avoid IT,” he said. “It will only add to your peril if you don’t adopt IT.”
Figure 3: As this radar chart details, questionnaires revealed that the company lacked IT support to manage financial resources.
radar love

52 Industrial Engineer
big IT for small companies
Applying the methodOne field case study was of a small agency that primarily rents property. Two partners who wanted to raise capital for retire-ment founded the company 16 months earlier. The company had three employees who managed approximately 100 properties. The manager’s vision was to grow at a rate of five properties per month and get to a staff of five or six people. The highest priorities for the manager were banking and solving everyday problems. The biggest pain was to align the requirements of some tenants with their landlords. For the manager, the long-term goal was to consolidate the company to sell before her retirement.
The company used some basic technology, such as Micro-soft Word for documentation and forms, Microsoft Excel to support the accounting system (which was primarily manual), and Microsoft Outlook to communicate with and send notices to tenants and landlords. The most important software was a commercial system, Aspect, that helped manage the properties.
As the manager drew the process diagram for the company, an important problem was revealed: the steady decline in visits to the website. The website was an important tool to attract new tenants. However, after a promotional assess-ment made by an Internet company, the manager discovered that site visits had fallen in the last few months. The website content was updated manually every week by the secretary.
Figure 3 shows the IT alignment according to the process level. The most important problem identified was the lack of support to manage financial resources (P8) because it is management’s second most important process and, at 30 percent, is the least aligned. The visit to the office facilities showed another problem: time management and scheduling.
Each time agents returned to the office, they had to review three notebooks with new announcements and task assignments to see if any new ones had been assigned. This ritual worked as long as the agent visited the office. Another discovery was that Aspect had extra features that the company did not use. For example, it could automatically upload photos of the houses to the website. In addition, the software had an accounting module tailored to property management.
As a tool for discussion and to summarize the problems identified and suggestions made, the researchers prepared a mind map, which is shown in Figure 4.
Finally, the most relevant recommendations made were:
• Increase staff skills on Aspect. • Implement a system of time management and workgroups,
such as using shared electronic calendars.• Improve website design.
ConclusionsIT-QSM is a quick and effective method for evaluating IT use in SMEs. After an initial period of adjustment, from the fourth case on, all the managers evaluated the results of the method as 100 percent useful. IT-QSM also presented an additional, unexpected benefit for managers. Most of them thought that the interviews had helped them assess their managerial work.
Still, the results yielded two insights that could improve IT-QSM. First, further development of the questionnaire and interview guidelines should seek ways to simplify the technical language when talking to businessmen. For example, during the New Zealand trials, the investigator’s first language was Spanish, and the language difference appeared to cause some
Figure 4. In this mind map, the solid line boxes represent the problems identified and the segmented line boxes the proposed solutions. The arrows represent linkages to related solutions.
mind’s eye soluTions

May 2011 53
communication difficulties with the participants. However, during the Colombian trials, even though Colombian manag-ers spoke Spanish as their first language, in some cases there were linguistic problems related to IT jargon. Using videos or images can help explain how software works or what the benefits of IT might be.
Second, IT-QSM was effective in recommending technol-ogy solutions for management and strategic problems, but it was less effective in suggesting technological improvements for operational problems, particularly in manufacturing companies. Applying the method to a specific group of companies in the same industry could improve its results at the operational level.
Still, the field research has shown that IT-QSM can be a useful tool to help managers and consultants in SMEs analyze and guide their organizations’ effective use of IT. d
Alejandro Cataldo has been an assistant professor at the University of Atacama, Chile since 2000, where he was chief of the computer science department. He is a Ph.D. candidate in the computer science depart-ment at the Catholic University of Chile, Santiago, where he received
his master’s in engineering. Cataldo has an industrial engineering degree and more than eight years of experience in private companies as department chief and consultant.
Robert J. McQueen is professor of electronic commerce technologies at the Waikato Management School at the University of Waikato. He holds a B.S. in electrical engineering from the University of Waterloo, an MBA from Harvard Business School and a Ph.D. from Waikato. His research interests are in electronic commerce, computer mediated group communication and technology support for tacit knowledge building in individuals.
Marcos Sepulveda has been a professor in the computer science department at Pontificia Universidad Católica de Chile since 2001. He earned his bachelor’s, master’s and doctoral degrees in computer science from the university and serves as director of its Informa-tion Technology Research Center (CETIUC). He did postdoctoral research at ETH Zürich, Switzerland. His research interests include IT management, IT outsourcing, business process modeling and business intelligence.
Contact Michelle Lorusso at (770) 349-1127 or [email protected]
PE Exam Review for Industrial Engineers
August 29 - September 2
Licensure for professional engineers opens the door to a world of opportunity and career development. But first you must pass two exams: the Fundamentals of Engineering Exam and the Professional Engineering (PE) Exam.
By refreshing your knowledge of IE topics, terminology and formulas, working through practice problems, and identifying areas you need to focus on during your exam prep, the course will cover all major elements of the PE exam.
CEUs and PDHs available
Pass the PE Exam!
For more information or to register, call (800) 494-0460 or go to
www.iieseminars.org.
Improve your odds of passing the most important test of your career with this popular review course.
WWW.IIESEMINARS.ORG