Embed Size (px)
Citation preview
Big Five Research:What’s happing outside Paradigm?Dr. Pierce Howard, Chief Innovation Officer
May 5, 2017
Lineup:
• Trait changes at end of life• Predicting cardiometabolic risk• Circadian rhythm• Leadership, one more time• You Neanderthal, you!• Caution—We change less than they think!• College student research cautions• Grit vs. C vs. DNA• Cognitive complexity and the Big FIve
© 2017 PARADIGM PERSONALITY LABS. ALL RIGHTS RESERVED.

End of life trait changes:What goes up, and what goes down?
Trait changes at end of life
• 516 seniors; last ten years• Measured only N, E, and O; used NEO items• Effect of .3 for N, .5 for E and O• Directions?
© 2017 PARADIGM PERSONALITY LABS. ALL RIGHTS RESERVED.
Trait changes at end of life
• N tend to increase• Exacerbated by loneliness
• E and O tend to decrease• Good mental and social life tend to maintain both• Poor health tends to decrease both• Sense of personal control associated with higher
E and O, lack of personal control with higher N
© 2017 PARADIGM PERSONALITY LABS. ALL RIGHTS RESERVED.

Heart attacks:Predicting cardiometabolic risk from traits
Predicting cardiometabolic risk
• University of Pittsburgh Adult Health and Behavior Project
• 856 community volunteers, 30-54 years old, 46% male, 86% Caucasian
• Dermody, S. S., et al. (2016). Personality correlates of midlife cardiometabolic risk: The explanatory role of higher-order factors of the Five-Factor Model. Journal of Personality, 84(6). 765-776.
• Risk factors:• N+• O-• A-• C-
• Why?
© 2017 PARADIGM PERSONALITY LABS. ALL RIGHTS RESERVED.
Predicting cardiometabolic risk
• N+• Sustained autonomic arousal and resulting
production of cortisol
• O-• Less seeking behavior relative to diet, lifestyle
• A-• Tendency to resist potentially healthy
suggestions
• C-• Less prone to follow a healthy protocol
consistently
© 2017 PARADIGM PERSONALITY LABS. ALL RIGHTS RESERVED.
Circadian rhythm:Traits associated with morningness and eveningness
Circadian rhythm
• Meta-analysis, 44 samples, n=c.17,000• Lipnevich et al (2017)• Morningness
• Peak alertness in the morning hours
• Eveningness• Peak alertness in the evening hours
© 2017 PARADIGM PERSONALITY LABS. ALL RIGHTS RESERVED.

Circadian rhythm
• Meta-analysis, 44 samples, n=c.17,000• Lipnevich et al (2017)• Morningness
• N-C++ correlated to morningness
• Eveningness• E+O+C- correlated to eveningness
• Earlier study:• N-C4+ correclation to morningness• Used EPQ measure of impulsiveness
© 2017 PARADIGM PERSONALITY LABS. ALL RIGHTS RESERVED.
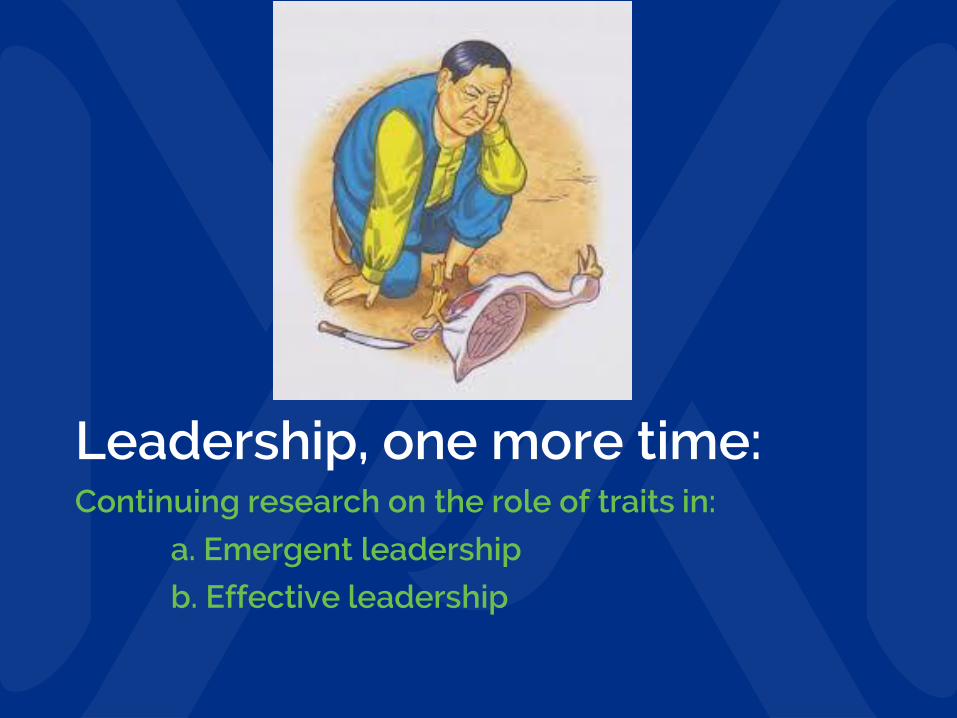
Leadership, one more time:Continuing research on the role of traits in:
a. Emergent leadership
b. Effective leadership
Leadership-1
• Tim Judge et al; a meta-analysis• From 998 studies, 73 met the criteria• Emergence vs. Effectiveness• Overall:
• Extraversion (+) strongest predictor• And, stronger for emergence than effectiveness
• Consolidation (+) and Originality (+) next• And, C also stronger for emergence than eff.
• Accommodation (mixed) and Need for Stability the weakest predictors for both• And, A different for effectiveness (+) than for
emergence (-)
© 2017 PARADIGM PERSONALITY LABS. ALL RIGHTS RESERVED.

Leadership
• Context differences:• O+ more predictive in business and student
samples; no correlation with government/military leadership
• E+ most predictive for students (+.4), then for business (+.3), then lastly for government/military (+.2)
• C+ twice as predictive among students
© 2017 PARADIGM PERSONALITY LABS. ALL RIGHTS RESERVED.
Leadership-2
• The dark side of leadership• Kaiser, LeBreton, & Hogan (2013)• Defined dark side as 11 Axis II disorders of
DSM IV• 13 meta-analyses and 46 individual studies• Used 360° with a too little/too much scale
© 2017 PARADIGM PERSONALITY LABS. ALL RIGHTS RESERVED.
Leadership
• Each disorder associated primarily with one extreme supertrait (e.g., Dependent w A++).
• Bright side = low to high• Dark side = very low or very high• The higher one’s N, the harder it is to manage
one’s extreme traits.
© 2017 PARADIGM PERSONALITY LABS. ALL RIGHTS RESERVED.
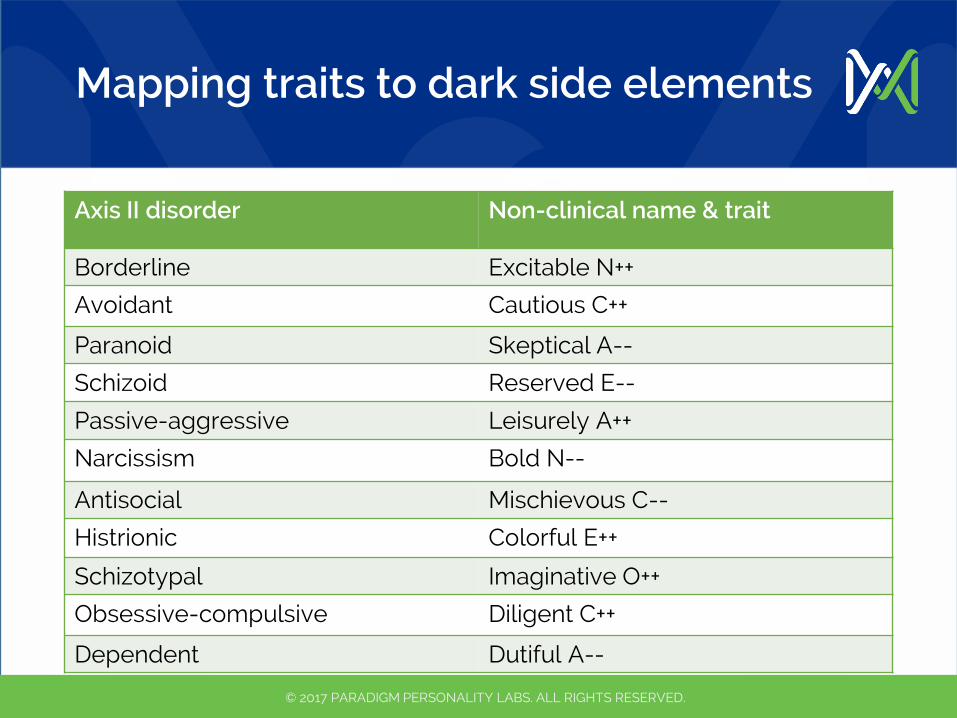
Mapping traits to dark side elements
© 2017 PARADIGM PERSONALITY LABS. ALL RIGHTS RESERVED.
Axis II disorder Non-clinical name & trait
Borderline Excitable N++
Avoidant Cautious C++
Paranoid Skeptical A--
Schizoid Reserved E--
Passive-aggressive Leisurely A++
Narcissism Bold N--
Antisocial Mischievous C--
Histrionic Colorful E++
Schizotypal Imaginative O++
Obsessive-compulsive Diligent C++
Dependent Dutiful A--
Leadership
• In a related study, Kaiser & Hogan (2011) found that overusing a trait (doing too much or too little of it) was predicted by scoring about 1 sd above or below, or below 40 and above 60.
© 2017 PARADIGM PERSONALITY LABS. ALL RIGHTS RESERVED.
Traits across cultures:Continuing research on similarities and differences of traits in different parts of the world
Cross-cultural
• Allik et al (2017)• Expanded earlier study from 36
countries/cultures to now include 62, n=71,870
• Major finding:• The sd across countries is 9x smaller than the sd
within countries; or, individuals within countries vary more than countries/cultures differ from one another, traitwise.
• Smallest cross-culture difference: E2: Sociability
© 2017 PARADIGM PERSONALITY LABS. ALL RIGHTS RESERVED.
Cross-cultural
• The differences in supertrait variance across cultures were statistically insignificant; i.e., the spread of scores is similar for all traits across all countries.
• Three modest tendencies:• Nordic and English-speaking tend to N-E+• German-speaking and Slavic, N+E+• Africa, N+E-
© 2017 PARADIGM PERSONALITY LABS. ALL RIGHTS RESERVED.
Cross-cultural
• Religious clusters do not differ in personality• Muslim = Protestant = Buddhist = Catholic = Jew
• IMP: Countries/cultures can differ on many variables (e.g., how important is God?), but not on traits. Traits are universal.
© 2017 PARADIGM PERSONALITY LABS. ALL RIGHTS RESERVED.
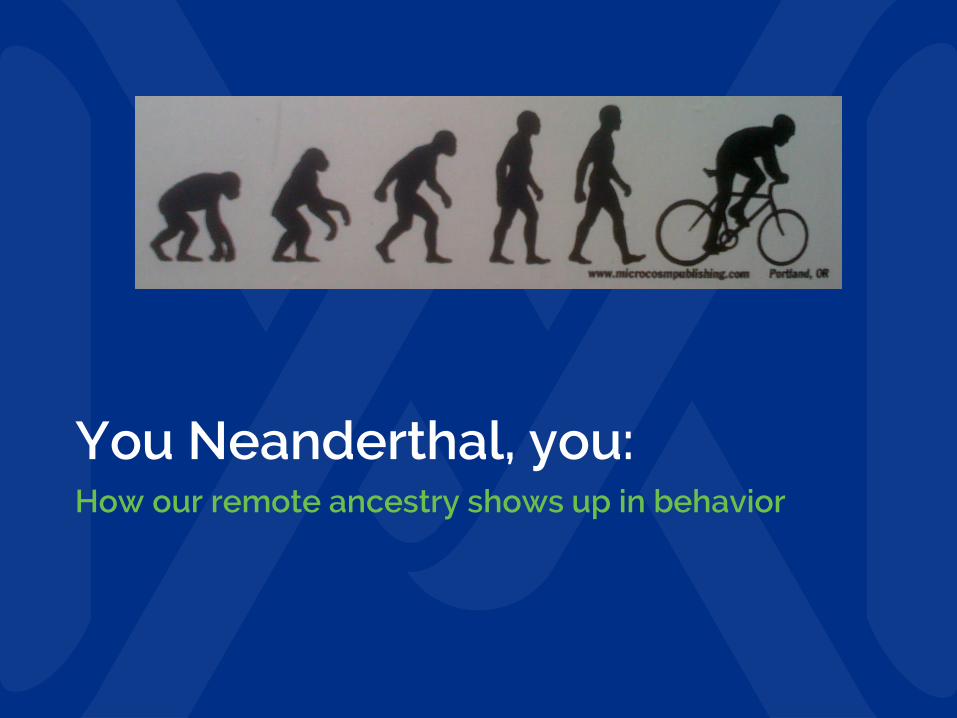
You Neanderthal, you:How our remote ancestry shows up in behavior

Neanderthal DNA
• Glenn Geher, SUNY New Paltz; n=100• Tends to be present in the range 0-4• Higher in Neanderthal-DNA:
• E-N+; sub-optimal relation with father; low emotional support from others; a-religious; don’t enjoy reading fiction
• Lower in Neanderthal-DNA:• E+N-; strong social network
• Consistent with Neanderthals sticking to family—did not form large social groups; intelligent, but less social than Homo Sapiens.
© 2017 PARADIGM PERSONALITY LABS. ALL RIGHTS RESERVED.
Caution—we don’t change as much as they think:A refutation of a highly publicized study
Research & the importance of critical analysis
• Headline: “Longest ever personality study finds no correlation between measures taken at age 14 and 77.”
• Matthew Harris & colleagues• University of Edinburgh• Began collecting data on 14 year olds in 1950• Retested at age 77, in 2012• Problems: ?
© 2017 PARADIGM PERSONALITY LABS. ALL RIGHTS RESERVED.
Research & the importance of critical analysis
• Problems (15):• Early ratings done by teachers of their students,
with later by self and a close friend/relative.• 1,208 tested in 1950, only 174 took repeat testing.• Not FFM: used six elements: self-confidence,
perseverance, mood stability, conscientiousness, originality, desire to learn. E.g., no E or A. Superficial, incomplete, lacking theory…
• Not the longest, really: BLSA. 59 vs. 63 years, beginning in 1958 (women added 1978). They make their case comparing 20s to 40s, 40s to 60s, showing stability, but 20s to 70s, not.
© 2017 PARADIGM PERSONALITY LABS. ALL RIGHTS RESERVED.
Research & the importance of critical analysis
• More problems:• The six “dimensions” were measured by only ONE
ITEM each!!! From test to retest, on a six-point scale, one-point random swings over six decades gives you no correlation, but excellent stability!
• The sample size is small for such a study. An increase in sample size would likely have resulted in many of the correlations becoming statistically significant.
© 2017 PARADIGM PERSONALITY LABS. ALL RIGHTS RESERVED.
Beware what you read!
• More problems:• Doesn’t indicate directionality—other research
suggests we embrace our extremes, such that a 56 could become a 68 over time, and is less likely to become a 44. That’s not changing—that’s embracing! When test-retest scores move in different directions, result is r=.00.
• Major events: Vietnam, Women’s Movement, Technology Revolution, Alienation from Government
• Developmental issues—14 less stable, better to compare mid-20s to 70s.
© 2017 PARADIGM PERSONALITY LABS. ALL RIGHTS RESERVED.
Beware what you read!
• More problems:• The teachers’ ratings of the original sample
showed very high correlation between “Dependability” and Intelligence (which was also assessed). They were rating academic prowess, not general personality.
• Biased sample: the 174 scored higher on both Dependability and Intelligence at age 77, so low scorers on both were unrepresented.
• No mention made of how representative Scotland is of the rest of the world.
© 2017 PARADIGM PERSONALITY LABS. ALL RIGHTS RESERVED.
Research & the importance of critical analysis
• More problems:• Used different IQ measures at beginning and end.
• At 14, a group test heavy on verbal reasoning (the Moray House Test No. 12), so it was really just measuring reading ability, which certainly increases dramatically with age. Also the Stanford-Binet, Form L.
• At 77, two tests: adult reading (NART) and visual/spatial skills (Raven’s Matrices)
• At 14: group reading test A + individual broad-range IQ• At 77: group reading B + group nonverbal/visual-spatial
IQ• Different tests, at both ends, and different scope and
administration process
© 2017 PARADIGM PERSONALITY LABS. ALL RIGHTS RESERVED.

Research & the importance of critical analysis
• More problems:• The Baltimore Longitudinal Study of Aging is not
mentioned anywhere in the original report.• The Senior Corresponding Author is identified as
Ian Deary, a highly controversial researcher who has embrace skull size and IQ—a discredited connection.
© 2017 PARADIGM PERSONALITY LABS. ALL RIGHTS RESERVED.

College student research:Trait means differ across campuses!

College student research
• Corker et al (2015)• Tested 8,600 students at 30 colleges • 20-item Big Five measure from IPIP• Major finding: Campuses differ up to one sd
on all five supertraits.• Be very cautious of research conducted on a
single campus, or with multiple campuses with equivalent demographics!
• BUT, no differences in regional means!
© 2017 PARADIGM PERSONALITY LABS. ALL RIGHTS RESERVED.

Other findings…
• The larger the campus, the higher the E• The more diverse the campus, the higher O• Urban campuses higher on O than non-urban• Higher % accepted campuses = lower A• Higher SAT scores = lower O• Required letters of recommendation = N-A+• Public lower on A than private• Land grant lower on C than non-land grant• The more expensive the school, N increases
© 2017 PARADIGM PERSONALITY LABS. ALL RIGHTS RESERVED.
Grit vs. C vs. DNA:Are they the same?
Grit vs. C vs. DNA
• Rimfeld et al (2016)• 2,231 16-year-old twin pairs• Found that genetics was the strongest
predictor of GPA .• Found that C (Consolidation) was the 2nd
best predictor of GPA• Found that Grit did not add anything• Conclusions:
• Grit “perseverance” predicted, “consistency” not• Grit “perseverance” and C are essentially the
same thing
© 2017 PARADIGM PERSONALITY LABS. ALL RIGHTS RESERVED.
Cognitive complexity and the Big Five:A rejoinder to an attack on the Five-Factor Model

Cognitive complexity and the FFM
• Mark Bowler (2012), East Carolina University• Says persons with low “cognitive complexity”
exhibit fewer than five factors, and those with high CC exhibit more than five
• First, what is cognitive complexity?
© 2017 PARADIGM PERSONALITY LABS. ALL RIGHTS RESERVED.

Cognitive complexity and the FFM
• Defined as the capacity to use and differentiate among diverse environmental features.
• Measure: Computer-Assisted Rep Test (CART)• Pick someone you know in each of ten categories
• A friend, an enemy, a parent, someone you’d like to help
• Rate them with a six-point scale on ten word pairs• Outgoing/shy, interesting/dull, maladjusted/adjusted
• High CC = more variety in ratings• Low CC = everyone rated similarly
© 2017 PARADIGM PERSONALITY LABS. ALL RIGHTS RESERVED.
Cognitive complexity and the FFM
• Problems:
• CC appears to be a component of O. Their research is like comparing all O- against all O+.
• No evidence that they have explored the correlation between CC and O.
• How do we know that low CC subjects aren’t choosing cases who are more similar trait-wise than the cases selected by high CC?
• Wouldn’t it make sense that O+ have more diverse associates than O-?
© 2017 PARADIGM PERSONALITY LABS. ALL RIGHTS RESERVED.