Embed Size (px)
Citation preview
© 2011 Cisco and/or its affiliates. All rights reserved. This document is Cisco Public Information. Page 1 of 33
White Paper
Big Data in the Enterprise: Network Design Considerations
What You Will Learn
This document examines the role of big data in the enterprise as it relates to network design considerations. It
describes the rise of big data and the transition of traditional enterprise data models with the addition of crucial
building blocks to handle the dramatic growth of data in the enterprise. According to IDC estimates, the size of the
“digital universe” in 2011 will be 1.8 zettabytes (1.8 trillion gigabytes). With information growth exceeding Moore’s
Law, the average enterprise will need to manage 50 times more information by the year 2020 while increasing IT
staff by only 1.5 percent. With this challenge in mind, the integration of big data models into existing enterprise
infrastructures is a critical element when considering the addition of new big data building blocks while considering
the efficiency, economics and privacy. This document also shows that the Cisco Nexus® architectures are
optimized to handle big data while providing integration into current enterprise infrastructures.
In reviewing multiple data models, this document examines the effects of Apache Hadoop as a building block for
big data and its effects on the network. Hadoop is an open source software platform for building reliable, scalable
clusters in a scaled-out, “shared-nothing” design model for storing, processing, and analyzing enormous volumes
of data at very high performance.
The information presented in this document is based on the actual network traffic patterns of the Hadoop
framework and can help in the design of a scalable network with the right balance of technologies that actually
contribute to the application’s network performance. Understanding the application’s traffic patterns fosters
collaboration between the application and network design teams, allowing advancements in technologies that
enhance application performance.
Note: Although this document omits most programming details, many excellent publications about Hadoop
applications are available, such as Hadoop: The Definitive Guide, Second Edition, which is referenced in this
document.
Emergence of Big Data
Big data is a foundational element of social networking and Web 2.0-based information companies. The enormous
amount of data is generated as a result of democratization and ecosystem factors such as the following:
● Mobility trends: Mobile devices, mobile events and sharing, and sensory integration
● Data access and consumption: Internet, interconnected systems, social networking, and convergent
interfaces and access models (Internet, search and social networking, and messaging)
● Ecosystem capabilities: Major changes in the information processing model and the availability of an open
source framework; the general-purpose computing and unified network integration

© 2011 Cisco and/or its affiliates. All rights reserved. This document is Cisco Public Information. Page 2 of 33
Data generation, consumption, and analytics have provided competitive business advantages for Web 2.0 portals
and Internet-centric firms that offer services to customers and services differentiation through correlation of
adjacent data. (An IDC data study provides a compelling view of the future of data growth; see
http://idcdocserv.com/1142.)
With the rise of business intelligence data mining and analytics spanning market research, behavioral modeling,
and inference-based decision, data can be used to provide a competitive advantage. Here are just a few of the
nearly limitless use cases of big data for the companies with large Internet presence:
● Targeted marketing and advertising
● Related attached sale promotions
● Analysis of behavioral social patterns
● Metadata-based optimization of workload and performance management for millions of users
Big Data Moves into the Enterprise
The requirements of traditional enterprise data models for application, database, and storage resources have
grown over the years, and the cost and complexity of these models has increased along the way to meet the needs
of big data. This rapid change has prompted changes in the fundamental models that describe the way that big
data is stored, analyzed, and accessed. The new models are based on a scaled-out, shared-nothing architecture,
bringing new challenges to enterprises to decide what technologies to use, where to use them, and how. One size
no longer fits all, and the traditional model is now being expanded to incorporate new building blocks that address
the challenges of big data with new information processing frameworks purpose-built to meet big data’s
requirements. However, these purpose-built systems also must meet the inherent requirement for integration into
current business models, data strategies, and network infrastructures.
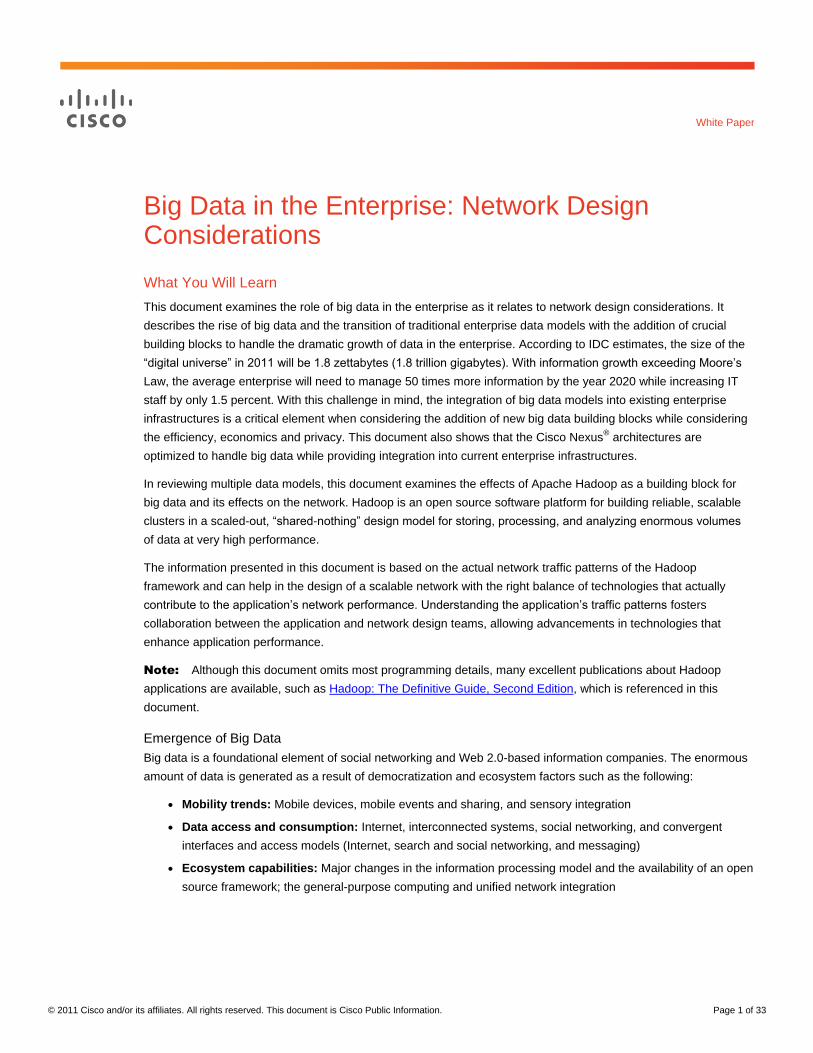
Big Data Components
Two main building blocks (Figure 1) are being added to the enterprise stack to accommodate big data:
● Hadoop: Provides storage capability through a distributed, shared-nothing file system, and analysis
capability through MapReduce
● NoSQL: Provides the capability to capture, read, and update, in real time, the large influx of unstructured
data and data without schemas; examples include click streams, social media, log files, event data, mobility
trends, and sensor and machine data
© 2011 Cisco and/or its affiliates. All rights reserved. This document is Cisco Public Information. Page 3 of 33
Figure 1. Big Data Enterprise Model
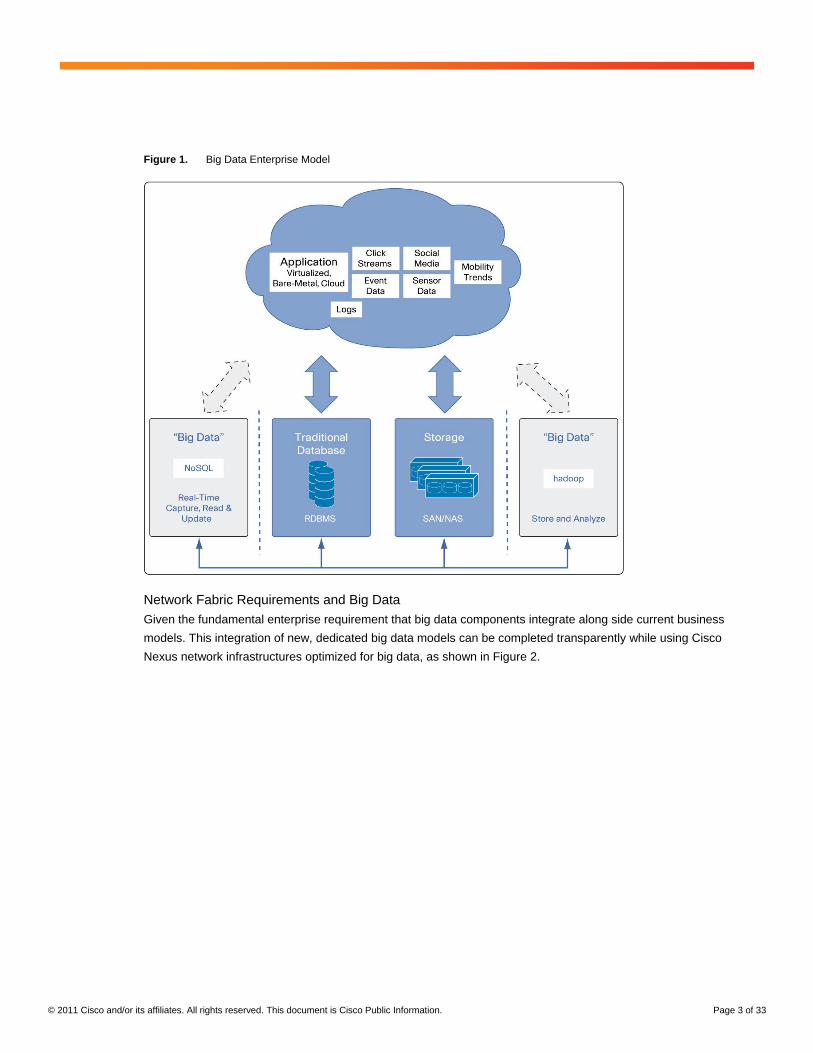
Network Fabric Requirements and Big Data
Given the fundamental enterprise requirement that big data components integrate along side current business
models. This integration of new, dedicated big data models can be completed transparently while using Cisco
Nexus network infrastructures optimized for big data, as shown in Figure 2.
© 2011 Cisco and/or its affiliates. All rights reserved. This document is Cisco Public Information. Page 4 of 33
Figure 2. Integration of Big Data Model into Enterprise Network Architecture
Hadoop Overview
The challenge facing companies today is how to analyze this massive amount of data to find those critical pieces of
information that provide a competitive edge. Hadoop provides the framework to handle massive amounts of data:
to either transform it to a more usable structure and format or analyze and extract valuable analytics from it.
Hadoop History
During the upturn in Internet traffic in the early 2000s, the scale of data reached terabyte and petabyte levels on a
daily basis for many companies. At those levels, standard databases could no longer scale enough to handle the
so-called big data.
In 2004, Google published a paper on the Google File System (GFS) and another paper on MapReduce, Google’s
patented software framework for distributed computing and large data sets on a scaled-out shared-nothing
architecture, to address the challenge of sorting and scaling big data. The concepts in these papers were then
implemented in Nutch, open source web-search software that enabled sort-and-merge-based processing.
“Every two days we create as much information as we did from the dawn
of civilization up until 2003.” — Eric Schmidt, former CEO of Google
© 2011 Cisco and/or its affiliates. All rights reserved. This document is Cisco Public Information. Page 5 of 33
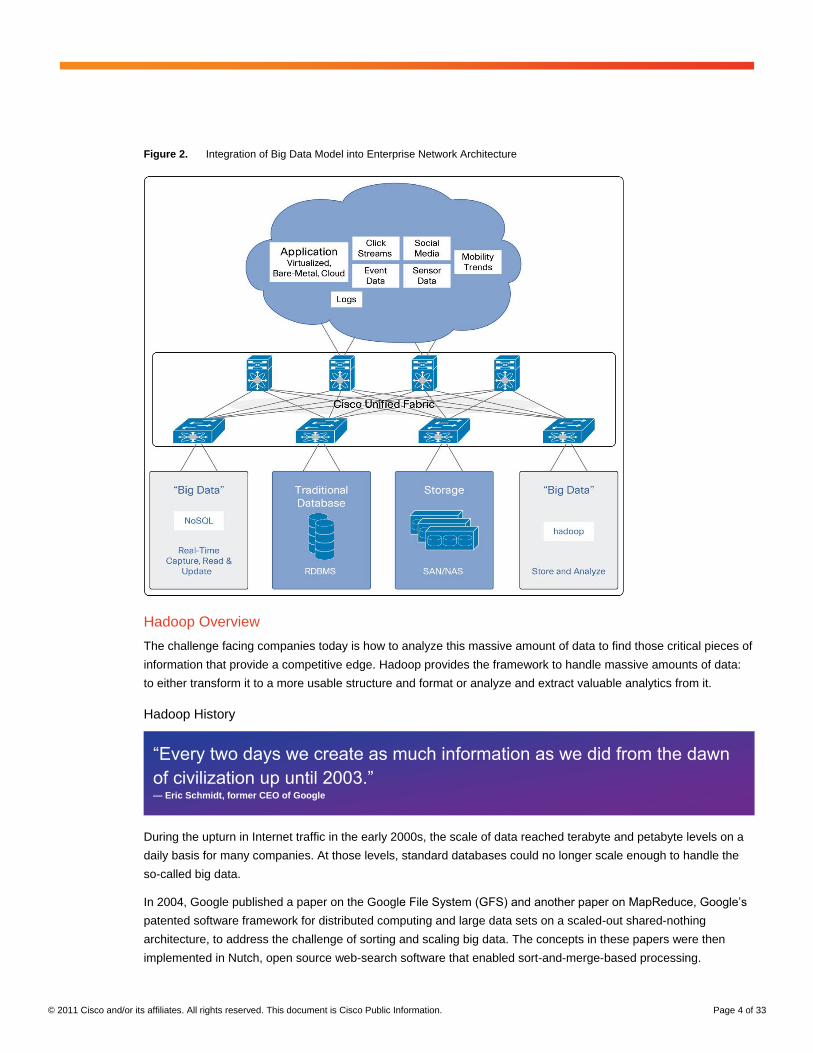
Hadoop, also based on open source and Java architecture, was later spun off from Nutch as an Apache project.
Enabling cost-effective bulk computing, Hadoop is both a distributed file system modeled on GFS and a distributed
processing framework using the MapReduce metaphor, according to its creator Doug Cutting of Yahoo! (Figure 3).
Figure 3. Lineage of Hadoop
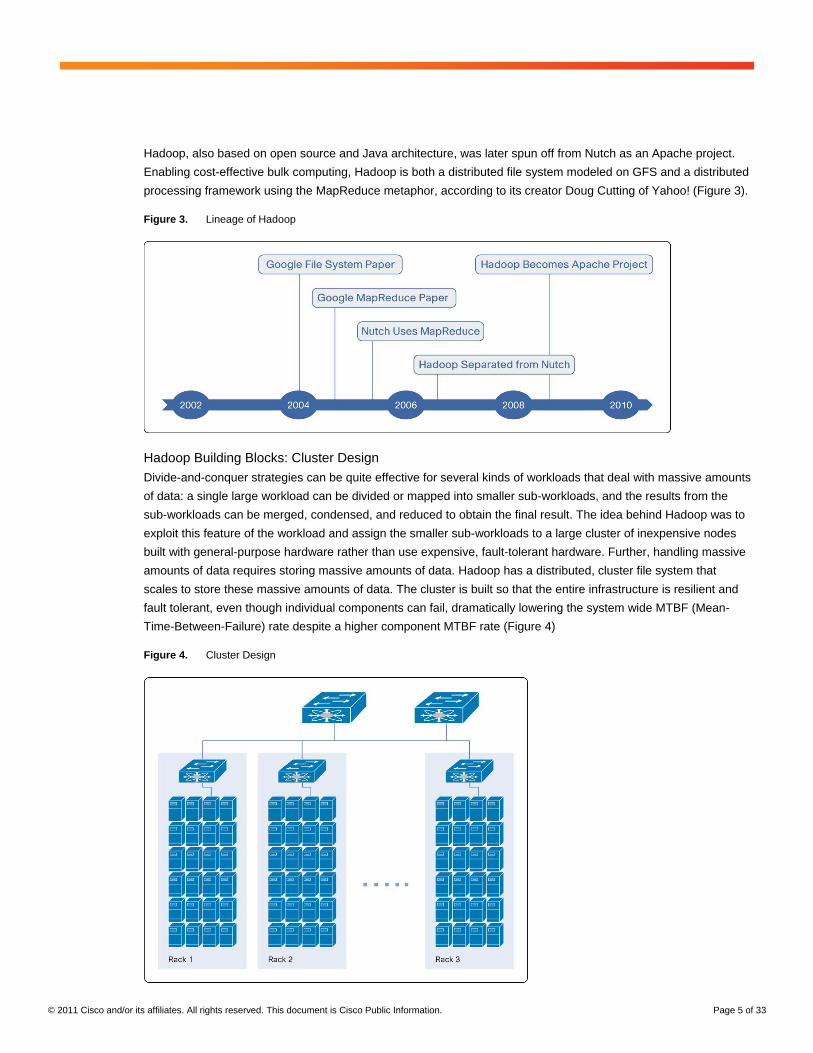
Hadoop Building Blocks: Cluster Design
Divide-and-conquer strategies can be quite effective for several kinds of workloads that deal with massive amounts
of data: a single large workload can be divided or mapped into smaller sub-workloads, and the results from the
sub-workloads can be merged, condensed, and reduced to obtain the final result. The idea behind Hadoop was to
exploit this feature of the workload and assign the smaller sub-workloads to a large cluster of inexpensive nodes
built with general-purpose hardware rather than use expensive, fault-tolerant hardware. Further, handling massive
amounts of data requires storing massive amounts of data. Hadoop has a distributed, cluster file system that
scales to store these massive amounts of data. The cluster is built so that the entire infrastructure is resilient and
fault tolerant, even though individual components can fail, dramatically lowering the system wide MTBF (Mean-
Time-Between-Failure) rate despite a higher component MTBF rate (Figure 4)
Figure 4. Cluster Design

© 2011 Cisco and/or its affiliates. All rights reserved. This document is Cisco Public Information. Page 6 of 33
Hadoop Distributed File System and Replication
The Hadoop Distributed File System (HDFS) is the first building block of a Hadoop cluster (Figure 5). To efficiently
process massive amounts of data, it was important to move computing to where the data is, using a distributed file
system, rather than a central system, for the data. A single large file is split into blocks, and the blocks are
distributed among the nodes of the Hadoop cluster. The blocks used in HDFS are large - 128 MB or more
compared to the small blocks associated with traditional file systems, allowing the system to scale without
increasing the size and complexity of HDFS metadata.
Figure 5. Distributed File System and Replication
Files in HDFS are “write once” files: input data is streamed or loaded into HDFS and processed by the MapReduce
framework (described later in this document), and any generated results are stored back in HDFS. The original
input data is not modified during its life in HDFS. With this approach, HDFS is not intended to be used as a
general-purpose file system.
To enhance reliability and availability of the data in HDFS, the data assigned to one node is replicated among the
other nodes. The default replication is threefold. This replication helps ensure that the data can survive the failure
or nonavailability of a node.
The nodes in a Hadoop cluster serve one of the following HDFS functions:
● Name node: The name node is a single node in the cluster that is the brain of HDFS. It is responsible for
keeping track of the file system metadata. It keeps a list of all the blocks in an HDFS file and a list of data
nodes that host this block. Since it can be a single point of failure, it is generally provisioned with a resilient,
highly available server.
● Data node: The data node is shared-nothing cluster of computers capable of executing the workload
components. These nodes operate independent of each other, and built with general-purpose hardware
storing the data blocks of workload in HDFS.
© 2011 Cisco and/or its affiliates. All rights reserved. This document is Cisco Public Information. Page 7 of 33
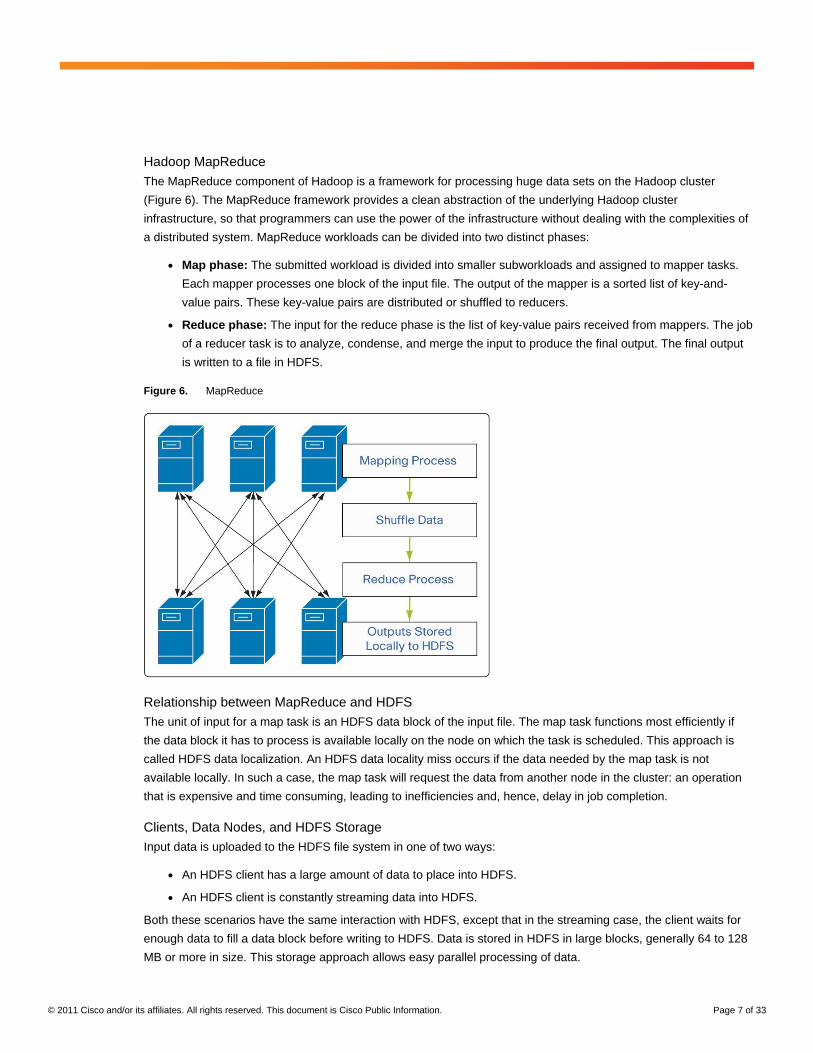
Hadoop MapReduce
The MapReduce component of Hadoop is a framework for processing huge data sets on the Hadoop cluster
(Figure 6). The MapReduce framework provides a clean abstraction of the underlying Hadoop cluster
infrastructure, so that programmers can use the power of the infrastructure without dealing with the complexities of
a distributed system. MapReduce workloads can be divided into two distinct phases:
● Map phase: The submitted workload is divided into smaller subworkloads and assigned to mapper tasks.
Each mapper processes one block of the input file. The output of the mapper is a sorted list of key-and-
value pairs. These key-value pairs are distributed or shuffled to reducers.
● Reduce phase: The input for the reduce phase is the list of key-value pairs received from mappers. The job
of a reducer task is to analyze, condense, and merge the input to produce the final output. The final output
is written to a file in HDFS.
Figure 6. MapReduce
Relationship between MapReduce and HDFS
The unit of input for a map task is an HDFS data block of the input file. The map task functions most efficiently if
the data block it has to process is available locally on the node on which the task is scheduled. This approach is
called HDFS data localization. An HDFS data locality miss occurs if the data needed by the map task is not
available locally. In such a case, the map task will request the data from another node in the cluster: an operation
that is expensive and time consuming, leading to inefficiencies and, hence, delay in job completion.
Clients, Data Nodes, and HDFS Storage
Input data is uploaded to the HDFS file system in one of two ways:
● An HDFS client has a large amount of data to place into HDFS.
● An HDFS client is constantly streaming data into HDFS.
Both these scenarios have the same interaction with HDFS, except that in the streaming case, the client waits for
enough data to fill a data block before writing to HDFS. Data is stored in HDFS in large blocks, generally 64 to 128
MB or more in size. This storage approach allows easy parallel processing of data.
© 2011 Cisco and/or its affiliates. All rights reserved. This document is Cisco Public Information. Page 8 of 33
During the process of writing to HDFS, the blocks are generally replicated to multiple data nodes for redundancy.
The number of copies, or the replication factor, is set to a default of 3 and can be modified by the cluster
administrator. When a new data block is stored on a data node, the data node initiates a replication process to
replicate the data onto a second data node. The second data node, in turn, replicates the block to a third data
node, completing the replication of the block.
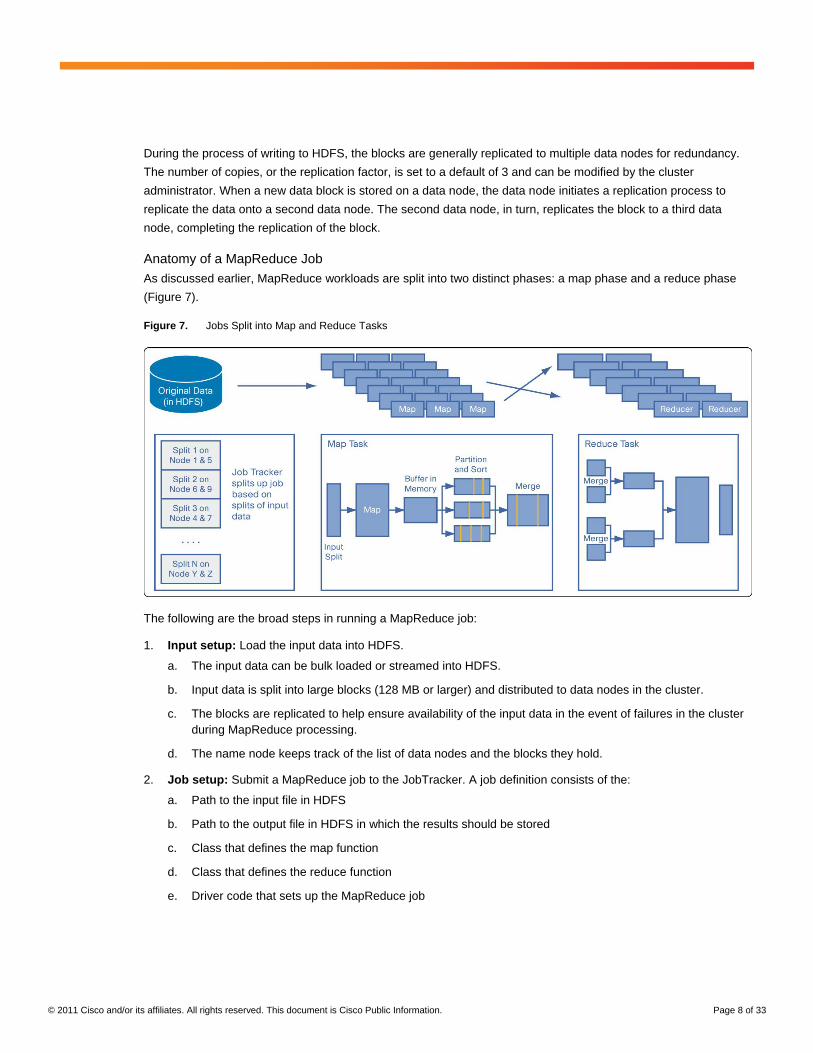
Anatomy of a MapReduce Job
As discussed earlier, MapReduce workloads are split into two distinct phases: a map phase and a reduce phase
(Figure 7).
Figure 7. Jobs Split into Map and Reduce Tasks
The following are the broad steps in running a MapReduce job:
1. Input setup: Load the input data into HDFS.
a. The input data can be bulk loaded or streamed into HDFS.
b. Input data is split into large blocks (128 MB or larger) and distributed to data nodes in the cluster.
c. The blocks are replicated to help ensure availability of the input data in the event of failures in the cluster
during MapReduce processing.
d. The name node keeps track of the list of data nodes and the blocks they hold.
2. Job setup: Submit a MapReduce job to the JobTracker. A job definition consists of the:
a. Path to the input file in HDFS
b. Path to the output file in HDFS in which the results should be stored
c. Class that defines the map function
d. Class that defines the reduce function
e. Driver code that sets up the MapReduce job

© 2011 Cisco and/or its affiliates. All rights reserved. This document is Cisco Public Information. Page 9 of 33
3. Job initialization: The JobTracker interacts with the TaskTracker on each data node to schedule map and
reduce tasks
a. The JobTracker interacts with the name node to get a list of data nodes that hold the blocks of the input
file. It schedules map tasks on these data nodes.
b. The JobTracker also schedules reducer tasks on nodes in the cluster
4. Map phase: The mapper processes input splits, or chunks of an HDFS block of an input file, and generate
intermediate key-value pairs.
5. Sort phase: The mapper performs a sort of the intermediate key-value pairs. Each mapper then partitions the
intermediate data into smaller units, one unit per reducer, typically using a hash function for the partitioning.
6. Shuffle phase: In Hadoop: The Definitive Guide (2010), shuffle is described as follows: “MapReduce makes
the guarantee that the input to every reducer is sorted by key. The process by which the system performs the
sort - and transfers the map outputs to the reducers as inputs - is known as the shuffle.”
7. Reduce phase: Each reducer merges all the units received from mappers and processes the merged list of
key-value pairs to generate the final result.
8. Result storage and replication: The results generated by reducers are stored as files in HDFS. This HDFS
write operation again triggers replication of blocks of the result file, for redundancy.
9. Result extraction: A client reads the HDFS file to export the results from HDFS.
Hadoop Cluster Performance Considerations
A key metric in measuring the performance of Hadoop clusters is the time-to-completion of submitted MapReduce
jobs. Numerous factors can affect the performance of a Hadoop cluster. Some of these factors, in order of their
impact on performance, are:
● Cluster size
● MapReduce data model
● Input data size
● Characteristics of data nodes
◦ I/O
◦ CPU
◦ Amount of memory
● Data locality in HDFS
● Background activity of the cluster
Cluster Size
Most Hadoop clusters start out with a modest size and grow as the demand on the cluster grows. You can increase
the cluster size on an as-needed basis because the Hadoop infrastructure can exploit the parallel nature of
MapReduce algorithms. As the number of jobs in the cluster grows or as the size of the input data grows, you can,
in most cases, just add more nodes to the cluster and scale almost linearly. When nodes are added to the cluster,
you must make sure that the network infrastructure and the name node can scale to match the increased size of
the cluster.
© 2011 Cisco and/or its affiliates. All rights reserved. This document is Cisco Public Information. Page 10 of 33
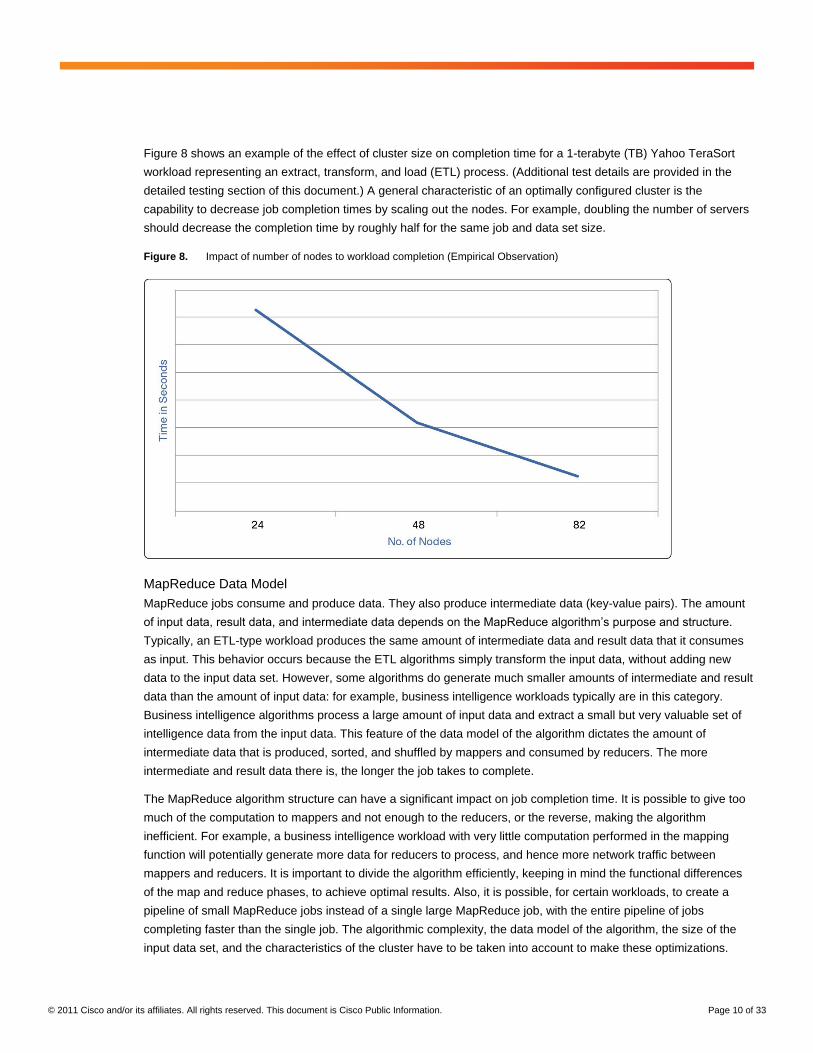
Figure 8 shows an example of the effect of cluster size on completion time for a 1-terabyte (TB) Yahoo TeraSort
workload representing an extract, transform, and load (ETL) process. (Additional test details are provided in the
detailed testing section of this document.) A general characteristic of an optimally configured cluster is the
capability to decrease job completion times by scaling out the nodes. For example, doubling the number of servers
should decrease the completion time by roughly half for the same job and data set size.
Figure 8. Impact of number of nodes to workload completion (Empirical Observation)
MapReduce Data Model
MapReduce jobs consume and produce data. They also produce intermediate data (key-value pairs). The amount
of input data, result data, and intermediate data depends on the MapReduce algorithm’s purpose and structure.
Typically, an ETL-type workload produces the same amount of intermediate data and result data that it consumes
as input. This behavior occurs because the ETL algorithms simply transform the input data, without adding new
data to the input data set. However, some algorithms do generate much smaller amounts of intermediate and result
data than the amount of input data: for example, business intelligence workloads typically are in this category.
Business intelligence algorithms process a large amount of input data and extract a small but very valuable set of
intelligence data from the input data. This feature of the data model of the algorithm dictates the amount of
intermediate data that is produced, sorted, and shuffled by mappers and consumed by reducers. The more
intermediate and result data there is, the longer the job takes to complete.
The MapReduce algorithm structure can have a significant impact on job completion time. It is possible to give too
much of the computation to mappers and not enough to the reducers, or the reverse, making the algorithm
inefficient. For example, a business intelligence workload with very little computation performed in the mapping
function will potentially generate more data for reducers to process, and hence more network traffic between
mappers and reducers. It is important to divide the algorithm efficiently, keeping in mind the functional differences
of the map and reduce phases, to achieve optimal results. Also, it is possible, for certain workloads, to create a
pipeline of small MapReduce jobs instead of a single large MapReduce job, with the entire pipeline of jobs
completing faster than the single job. The algorithmic complexity, the data model of the algorithm, the size of the
input data set, and the characteristics of the cluster have to be taken into account to make these optimizations.
© 2011 Cisco and/or its affiliates. All rights reserved. This document is Cisco Public Information. Page 11 of 33
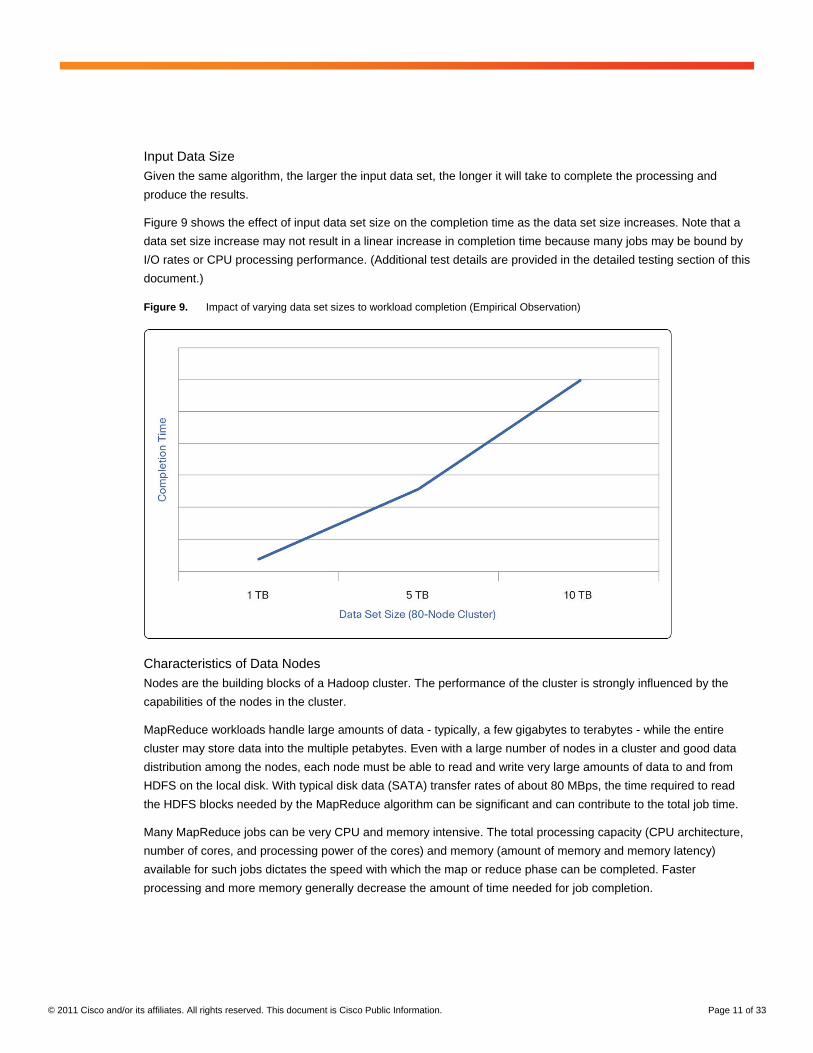
Input Data Size
Given the same algorithm, the larger the input data set, the longer it will take to complete the processing and
produce the results.
Figure 9 shows the effect of input data set size on the completion time as the data set size increases. Note that a
data set size increase may not result in a linear increase in completion time because many jobs may be bound by
I/O rates or CPU processing performance. (Additional test details are provided in the detailed testing section of this
document.)
Figure 9. Impact of varying data set sizes to workload completion (Empirical Observation)
Characteristics of Data Nodes
Nodes are the building blocks of a Hadoop cluster. The performance of the cluster is strongly influenced by the
capabilities of the nodes in the cluster.
MapReduce workloads handle large amounts of data - typically, a few gigabytes to terabytes - while the entire
cluster may store data into the multiple petabytes. Even with a large number of nodes in a cluster and good data
distribution among the nodes, each node must be able to read and write very large amounts of data to and from
HDFS on the local disk. With typical disk data (SATA) transfer rates of about 80 MBps, the time required to read
the HDFS blocks needed by the MapReduce algorithm can be significant and can contribute to the total job time.
Many MapReduce jobs can be very CPU and memory intensive. The total processing capacity (CPU architecture,
number of cores, and processing power of the cores) and memory (amount of memory and memory latency)
available for such jobs dictates the speed with which the map or reduce phase can be completed. Faster
processing and more memory generally decrease the amount of time needed for job completion.
© 2011 Cisco and/or its affiliates. All rights reserved. This document is Cisco Public Information. Page 12 of 33
Note: The amount of memory allocated per data node should depend on importance of job completion time
considerations and price-to-performance trade-offs for those gains. If a Hadoop cluster is used for a single job, it is
sufficient if a data node has adequate memory to run that single job. However, most Hadoop clusters run multiple
jobs at a time. In such cases, having more memory will allow more tasks to be accommodated on the data node,
increasing the possibility of faster job completion.
When determining the characteristics of the data node, you need to consider the benefits and costs of the available
options. Should you use a one-rack-unit (1RU) server with 8 disks and 2 CPUs, or a 2RU server with 16 disks and
2 CPUs? A 2RU server with 16 disks gives the node more storage space and more disk transfer parallelism,
helping it cope better with workloads that are I/O intensive. However, a 2RU server also uses more space,
decreasing the number of CPUs that can be fit into a single rack (CPU rack density), a factor that can increase the
number of racks in a cluster and the total infrastructure needs (space, power, cooling, and networking resources) of
the cluster. From the point of view of a top-of-rack (ToR) networking device, the ports on the device could be
sparsely used, leading to the use of more ToR devices and, hence, more core ports and devices. A 1RU server,
while limited in storage, offers greater CPU density and a lower per-server power footprint. More 1RU servers can
be fit into a single rack, requiring a higher-density ToR switch or fabric extender. It is useful to consider some of
these trade-offs in the context of whether the applications are CPU bound or I/O bound. A CPU-bound application
might benefit from greater CPU density per rack, whereas an I/O-bound application might benefit from larger
storage capacity and greater disk transfer parallelism.
Data Locality in HDFS
A task that is scheduled on a node can finish more quickly if the data it needs is available locally. The Hadoop
JobTracker is intelligent enough to schedule jobs optimally on nodes on which the data is available. Further,
because typical Hadoop clusters use a replication factor of greater than one (>1), the JobTracker has more than
one node to choose from to schedule the task. However, in some instances all the nodes that host a particular data
block may be experiencing heavy load. In such instances, the JobTracker will be forced to schedule tasks in any
node that is not experiencing heavy load. Since the data blocks needed by the task are now not available locally,
the task will have to request the data block from a node that has the data. Every such data transfer consumes
resources on the node requesting the data, on the node providing the data, and on the network and can lead to
slower job completion.
Background Activity of the Cluster
Hadoop clusters are typically used for numerous MapReduce workloads with jobs that run in parallel. The total
existing activity of the cluster influences the resources available for any newly submitted jobs since newly
submitted jobs have to be scheduled alongside existing jobs and will compete for task slots in the cluster. Although
you can increase the priority of the new job, this change will have a cost for the other existing jobs. Background
activity can also impair the ability of a cluster to accelerate jobs with strategies such as speculative execution,
through which the Hadoop infrastructure can speed up job completion by aggressively and intelligently spawning
multiple instances of the same task and using the results only from the task that finishes first, discarding results
from the rest. Less sharing of the cluster among MapReduce jobs will lead to better performance for the scheduled
jobs.
Other background activities such as importing and exporting data from HDFS and internal HDFS operations such
as data rebalancing when nodes are added or removed from the cluster can consume the resources of the cluster
and affect the completion times of submitted jobs.
© 2011 Cisco and/or its affiliates. All rights reserved. This document is Cisco Public Information. Page 13 of 33
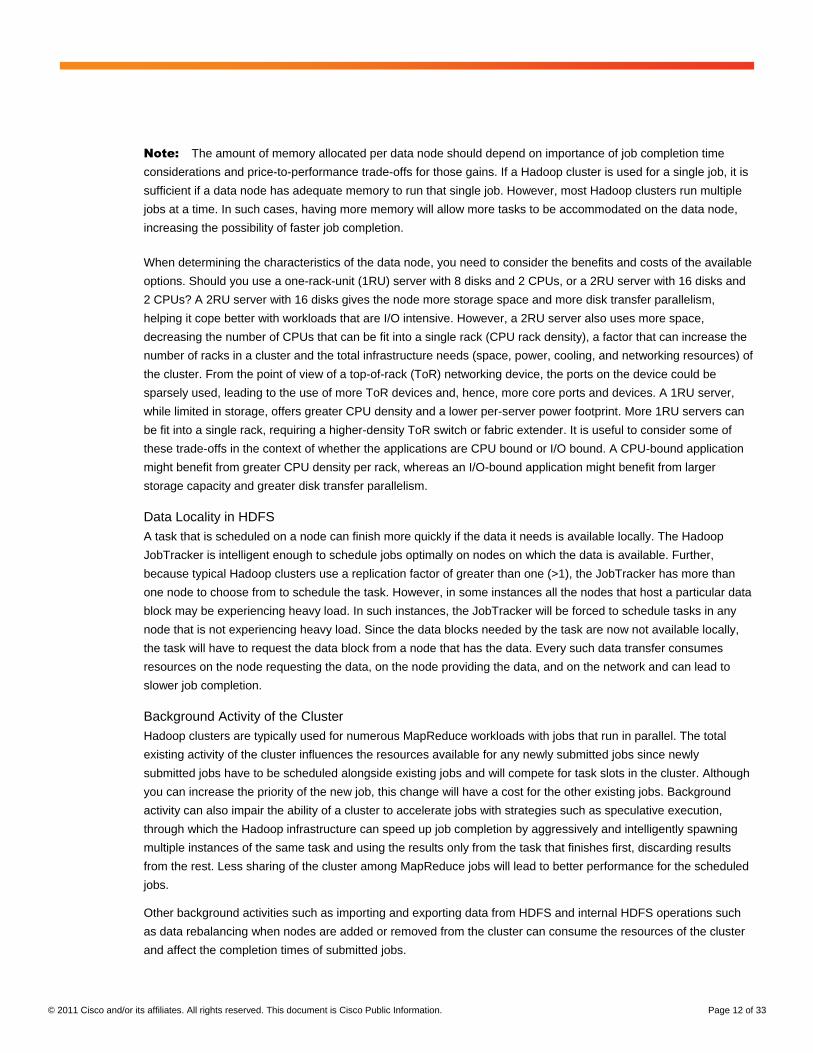
Figure 10 shows what happens when you add eight servers that are constantly loading 128-MB blocks of data to
HDFS while the job is running. The figure shows that the background activity of loading data to HDFS, which
triggers replication as well, can have a significant impact on job completion time. (Additional test details are
provided in the detailed testing section of this document.)
Figure 10. Impact of HDFS imports to workload completion time
Network Characteristics
The nodes in a Hadoop cluster are interconnected through the network. Typically, one or more of the following
phases of MapReduce jobs transfers data over the network:
1. Writing data: This phase occurs when the initial data is either streamed or bulk-delivered to HDFS. Data
blocks of the loaded files are replicated, transferring additional data over the network.
2. Workload execution: The MapReduce algorithm is run.
a. Map phase: In the map phase of the algorithm, almost no traffic is sent over the network. The network is
used at the beginning of the map phase only if a HDFS locality miss occurs (the data block is not locally
available and has to be requested from another data node).
b. Shuffle phase: This is the phase of workload execution in which traffic is sent over the network, the
degree to which depends on the workload. Data is transferred over the network when the output of the
mappers is shuffled to the reducers.
c. Reduce phase: In this phase, almost no traffic is sent over the network because the reducers have all the
data they need from the shuffle phase.
d. Output replication: MapReduce output is stored as a file in HDFS. The network is used when the blocks
of the result file have to be replicated by HDFS for redundancy.
3. Reading data: This phase occurs when the final data is read from HDFS for consumption by the end
application, such as the website, indexing, or SQL database.
In addition, the network is crucial for the Hadoop control plane: the signaling and operations of HDFS and the
MapReduce infrastructure.
© 2011 Cisco and/or its affiliates. All rights reserved. This document is Cisco Public Information. Page 14 of 33
Be sure to consider the benefits and costs of the choices available when designing a network: network
architectures, network devices, resiliency, oversubscription ratios, etc. The following section discusses some of
these parameters in more detail.
Impact of Network Characteristics on Job Completion Times
Note: The following information is an overview of all the findings in the detailed test section of this document.
More information about any of the findings discussed in this section can be found in the detailed test section of this
document.
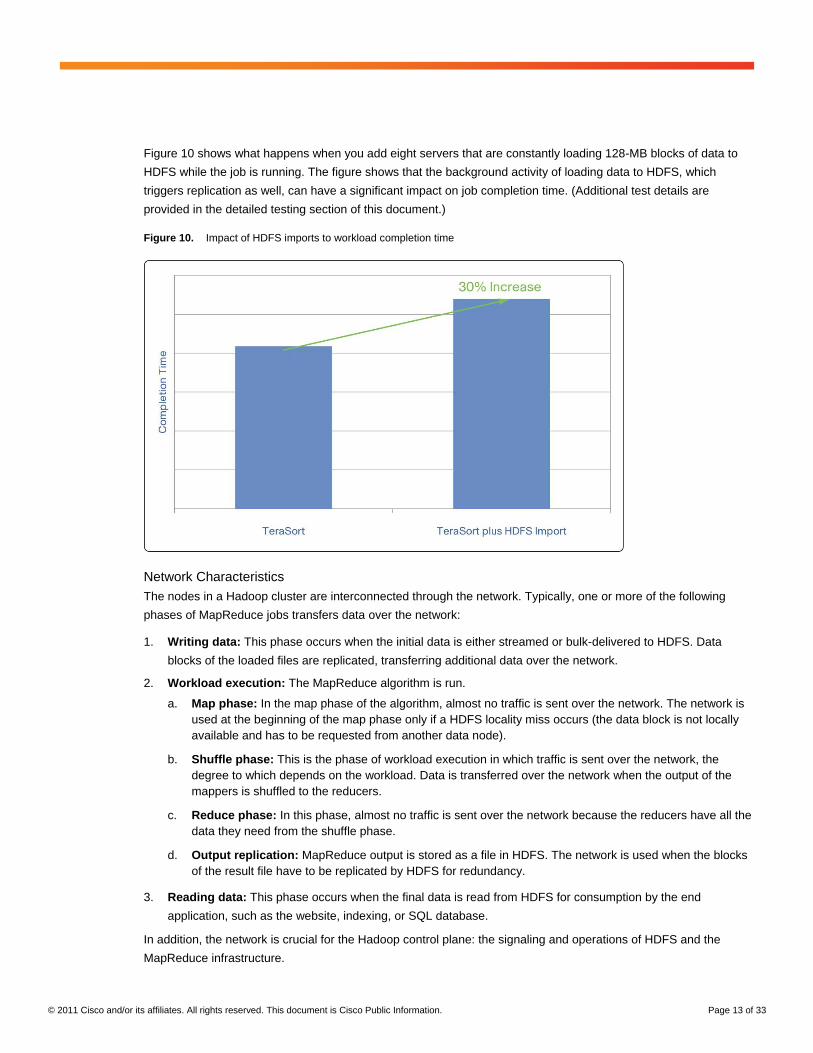
A functional and resilient network is a crucial part of a good Hadoop cluster. However, an analysis of the relative
importance of the factors shows that other factors in a cluster have a greater influence on the performance of the
cluster than the network. Nevertheless, you should consider some of the relevant network characteristics and their
potential effects. Figure 11 shows the relative importance of the primary parameters as revealed by the
observations in the detailed test section of this document.
Figure 11. Relative Importance of Parameters to Job Completion as Revealed by Observations in the Detailed Test Section
Availability and Resiliency
The failure of a networking device can affect multiple data nodes of a Hadoop cluster. The tasks on the affected
nodes may then need to be rescheduled on other functioning nodes, increasing the load on the functioning nodes.
Further, the Hadoop infrastructure may start certain maintenance activities such as data rebalancing and
replication factor to compensate for the failed nodes, increasing the load on the cluster even more. These events
are critical factor in degradation of the cluster performance. Running jobs will take a lot longer to complete, and the
ability to schedule new jobs will be impaired.
It is important to build a network that is available and resilient. First, you should focus on the network architecture:
to deploy architectures that provide the required redundancy and that can also scale as the cluster grows.
Technologies that allow network designs with multiple redundant paths between the data nodes are inherently
better than technologies that have one or two points of failure.

© 2011 Cisco and/or its affiliates. All rights reserved. This document is Cisco Public Information. Page 15 of 33
After the architectural framework is laid out, you should consider the availability aspects of individual devices.
Switches and routers that run operating systems that are proven in the industry to be resilient provide better
network availability to servers. Switches and routers that can be upgraded without any disruption to the data nodes
provide higher availability. Further, devices that are proven to be easy to manage, troubleshoot, and upgrade help
ensure less network downtime and increase the availability of the network and, hence, the cluster.
Burst Handling and Queue Depth
Several HDFS operations and phases of MapReduce jobs are bursty:
● Loading input files into HDFS or writing result files to HDFS uses the network. In addition, these write
operations trigger replication of data blocks of the file, leading to higher network use. These operations,
since they occur in a short period of time, show up as bursts of traffic in the network.
● The output of mappers, as they complete, is shuffled to reducers over the network. If many mappers finish
at the same time, they will try to send their output to reducers at the same time, leading to bursts of traffic in
the network.
A network that cannot handle bursts effectively will drop packets, so optimal buffering is needed in network devices
to absorb bursts. Any packet dropped because a buffer is not available will result in retransmission, if excessive
leads to longer job completion times. Be sure to choose switches and routers with architectures that employ buffer
and queuing strategies that can handle bursts effectively.
Oversubscription Ratio
A good network design will consider the possibility of unacceptable congestion at critical points in the network
under realistic loads. A ToR device that accepts 20 Gbps of traffic from the servers, but that has only two 1-Gbps
uplinks (a total of 2 Gbps) provisioned (a 20:2 [or 10:1] oversubscription ratio) can drop packets, leading to poor
cluster performance. However, overprovisioning the network can be costly. Generally accepted oversubscription
ratios are around 4:1 at the server access layer and 2:1 between the access layer and the aggregation layer or
core. Lower oversubscription ratios can be considered if higher performance is required. You should consider how
oversubscription increases when certain devices fail and be sure to provision critical points in the network (such as
the core) adequately. Network architectures (Layer 2 multipathing technologies such as Cisco® FabricPath or Layer
3 Equal Cost Multipath [ECMP]) that deliver a linear increase in oversubscription with each device failure are better
than architectures that degrade dramatically during failures.
Data Node Network Speed
Be sure to provision data nodes with enough bandwidth for efficient job completion. Also continue to keep in mind
the price-to-performance ratio entailed in adding more bandwidth to nodes.
Recommendations for a cluster depend on workload characteristics. Typical clusters are provisioned with one or
two 1-GB uplinks per data node. Cluster management is made easier by choosing network architectures that are
proven to be resilient and easy to manage and that can scale as your data grows. The use of 10Gbps server
access is largely dependant on the cost/performance trade-off. The workload characteristics and business
requirement to complete the job in required time will drive the 10Gbps server connectivity. As 10 Gbps Ethernet
LAN-on-motherboard (LOM) connectors become more commonly available on servers in the future, more clusters
likely will be built with 10 Gigabit Ethernet data node uplinks.

© 2011 Cisco and/or its affiliates. All rights reserved. This document is Cisco Public Information. Page 16 of 33
Network Latency
Variations in switch and router latency have been shown to have only limited impact on cluster performance. From
a network point of view, any latency-related optimization should start with a network wide analysis. “Architecture
first, and device next” is an effective strategy. Architectures that deliver consistently lower latency at scale are
better than architectures with higher overall latency but lower individual device latency. The latency contribution to
the workload is much higher at the application level, contributed by the application logic (Java Virtual Machine
software stack, socket-buffer etc)than network latency. In any case, slightly more or less network latency will not
noticeably affect job completion times.
Understanding Network Behavior with Hadoop Benchmarking
Workload Characterization for Hadoop Clusters
Hadoop is an open framework with a programmable environment in which many types of workloads can be run to
use distributed computing capabilities. The factors that affect workload completion times vary widely, as described
in the previous sections. The tests reported here focus on large ETL workloads and business intelligence analytics.
From a network standpoint, it is important to understand events that are taking place during the map, shuffle, and
reduce phases for a given workload:
● What are the traffic patterns of the map tasks?
● What happens when the reducer tasks start?
● What happens when the map tasks are complete?
● What is the effect of adding replication to the reduce tasks?
Two distinct workloads were used with associated benchmark tools to demonstrate their behavior in thw network:
● Business Intelligence(BI) workload: The business intelligence workload is a reduced-function workload in
which a large amount of data is presented as input, while the amount of resulting data is much smaller than
the amount of input data. This type of workload can be simulated with tools such as WordCount, which
comes packaged with Apache Hadoop. This workload takes a large data amount of input data (1 TB) and
outputs a much smaller amount (1 MB).
● Extract, Transform, and Load(ETL) workload: ETL workloads are found most common in enterprises in
which a large amount of data needs to be converted to another format suited for various application. This
type of workload can be demonstrated with the Yahoo TeraSort benchmarking application, described at
http://sortbenchmark.org/Yahoo2009.pdf
Hadoop Topology
The Hadoop cluster was validated with various configurations of server components and network devices. The data
nodes are UCS rack-mount severs while network devices consist of Nexus 5000/2000 and 3000 switches.
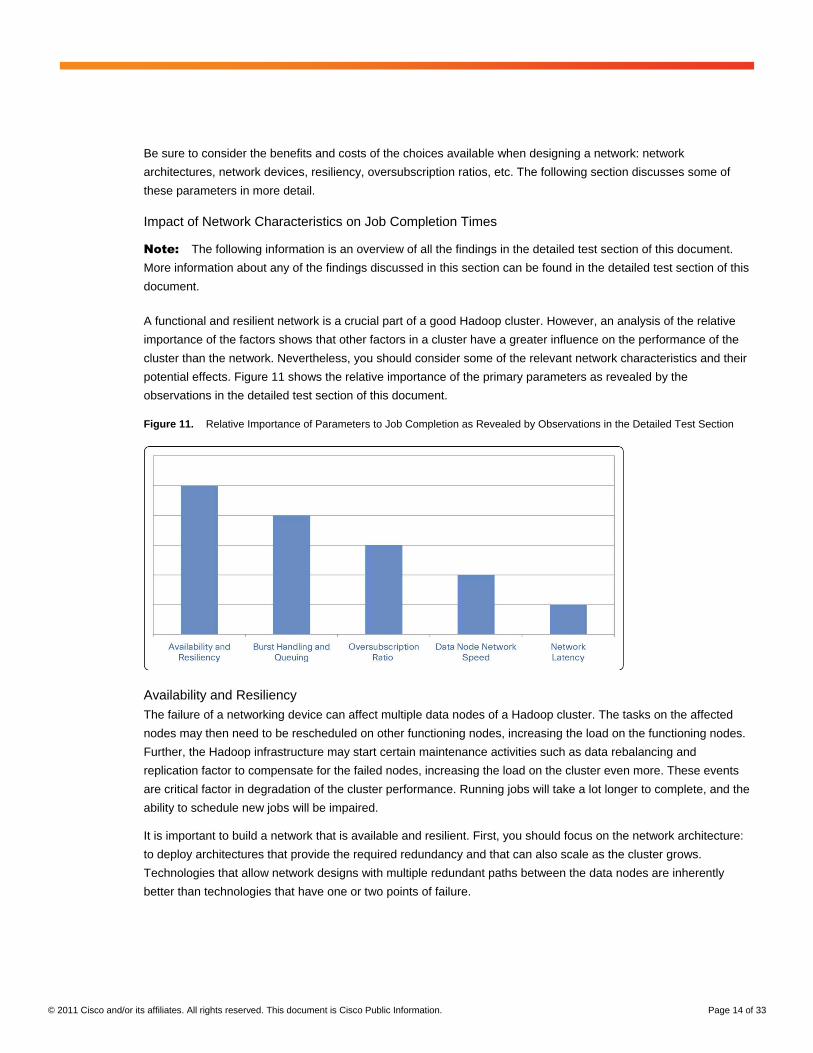
The topology consists of two types of topologies commonly used in many enterprise networks. The workload was
tested with various Hadoop cluster sizes. The below figures depict the topology and components of Hadoop
cluster. For the Nexus 5000/2248 topology, data nodes are divided into groups in multiple FEXs. The Nexus 3000
topology used multiple devices to accommodate varying data node density.
© 2011 Cisco and/or its affiliates. All rights reserved. This document is Cisco Public Information. Page 17 of 33
Figure 12. Test Topology
Servers
● 128 nodes of Cisco UCS™
C200 M2 High-Density Rack-Mount Servers (1RU each)
◦ Four 2-TB disk drives, dual Intel Xeon 5670 processors at 2.93 GHz, and 96 GB of RAM
● 16 nodes of Cisco UCS C210 M2 General-Purpose Rack-Mount Servers (2RU each)
◦ 16 SFF drives, dual Intel Xeon 5670 processors at 2.93 GHz, and 96 GB of RAM
Network
● Cisco Nexus 7000 Series Switches, Cisco Nexus 5500 switching platform, and Cisco Nexus 2200 fabric
extender platform
Software
● Red Hat Enterprise Linux 5.4, 5.5, 6.0, and 6.1
● Hadoop versions: Apache Hadoop 0.20.2 and Cloudera’s Distribution Including Hadoop (CDH) Release 3u1
Business Intelligence Workload Benchmark
The BI workload (WordCount) is characterized with following key behavior
● The initial data set size is large, however final output is small
● Higher computation-intensive map process, compared to shuffle and reduced phases
● The network utilization is low in shuffle phase due to the output of the map tasks are a small subset of the
total dataset.
● Many network flows, but short lived one
© 2011 Cisco and/or its affiliates. All rights reserved. This document is Cisco Public Information. Page 18 of 33
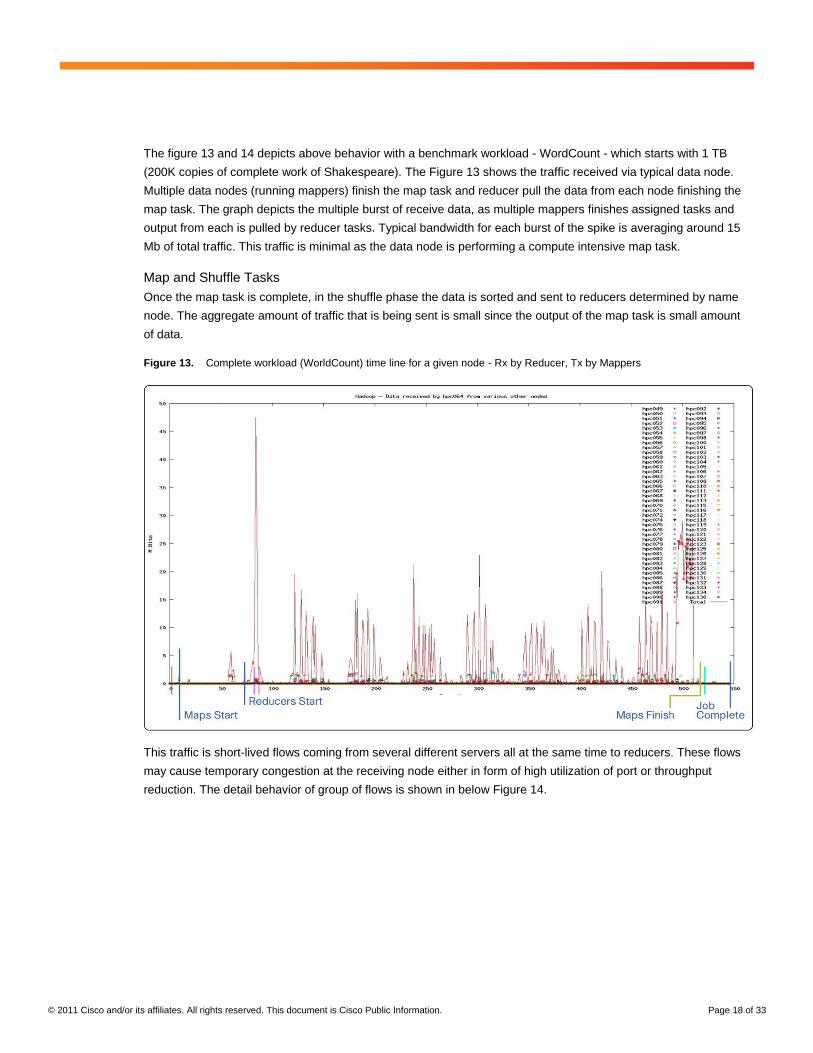
The figure 13 and 14 depicts above behavior with a benchmark workload - WordCount - which starts with 1 TB
(200K copies of complete work of Shakespeare). The Figure 13 shows the traffic received via typical data node.
Multiple data nodes (running mappers) finish the map task and reducer pull the data from each node finishing the
map task. The graph depicts the multiple burst of receive data, as multiple mappers finishes assigned tasks and
output from each is pulled by reducer tasks. Typical bandwidth for each burst of the spike is averaging around 15
Mb of total traffic. This traffic is minimal as the data node is performing a compute intensive map task.
Map and Shuffle Tasks
Once the map task is complete, in the shuffle phase the data is sorted and sent to reducers determined by name
node. The aggregate amount of traffic that is being sent is small since the output of the map task is small amount
of data.
Figure 13. Complete workload (WorldCount) time line for a given node - Rx by Reducer, Tx by Mappers
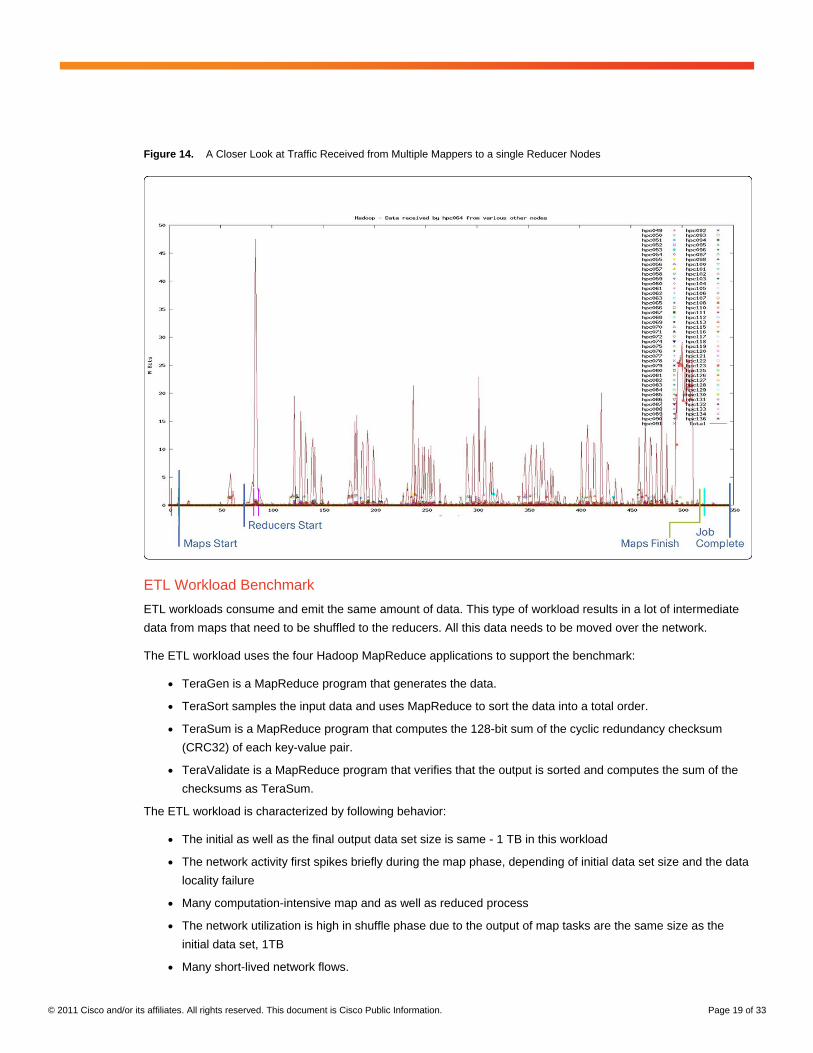
This traffic is short-lived flows coming from several different servers all at the same time to reducers. These flows
may cause temporary congestion at the receiving node either in form of high utilization of port or throughput
reduction. The detail behavior of group of flows is shown in below Figure 14.
© 2011 Cisco and/or its affiliates. All rights reserved. This document is Cisco Public Information. Page 19 of 33
Figure 14. A Closer Look at Traffic Received from Multiple Mappers to a single Reducer Nodes
ETL Workload Benchmark
ETL workloads consume and emit the same amount of data. This type of workload results in a lot of intermediate
data from maps that need to be shuffled to the reducers. All this data needs to be moved over the network.
The ETL workload uses the four Hadoop MapReduce applications to support the benchmark:
● TeraGen is a MapReduce program that generates the data.
● TeraSort samples the input data and uses MapReduce to sort the data into a total order.
● TeraSum is a MapReduce program that computes the 128-bit sum of the cyclic redundancy checksum
(CRC32) of each key-value pair.
● TeraValidate is a MapReduce program that verifies that the output is sorted and computes the sum of the
checksums as TeraSum.
The ETL workload is characterized by following behavior:
● The initial as well as the final output data set size is same - 1 TB in this workload
● The network activity first spikes briefly during the map phase, depending of initial data set size and the data
locality failure
● Many computation-intensive map and as well as reduced process
● The network utilization is high in shuffle phase due to the output of map tasks are the same size as the
initial data set, 1TB
● Many short-lived network flows.
© 2011 Cisco and/or its affiliates. All rights reserved. This document is Cisco Public Information. Page 20 of 33
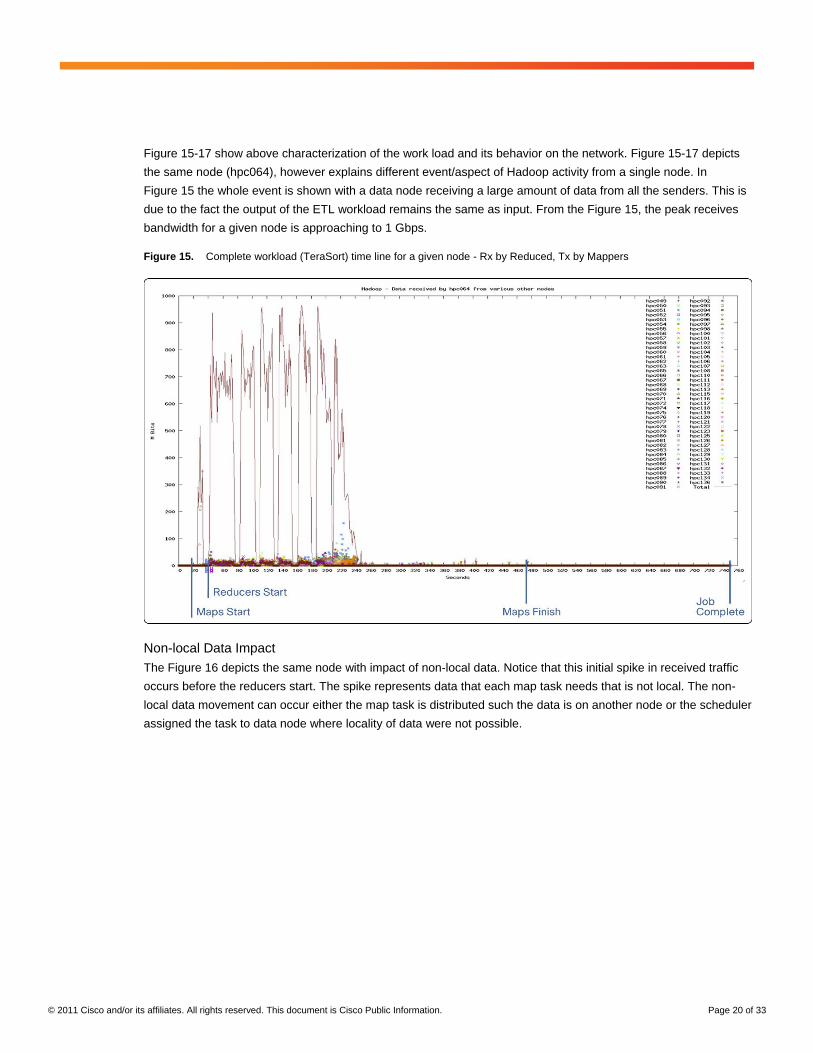
Figure 15-17 show above characterization of the work load and its behavior on the network. Figure 15-17 depicts
the same node (hpc064), however explains different event/aspect of Hadoop activity from a single node. In
Figure 15 the whole event is shown with a data node receiving a large amount of data from all the senders. This is
due to the fact the output of the ETL workload remains the same as input. From the Figure 15, the peak receives
bandwidth for a given node is approaching to 1 Gbps.
Figure 15. Complete workload (TeraSort) time line for a given node - Rx by Reduced, Tx by Mappers
Non-local Data Impact
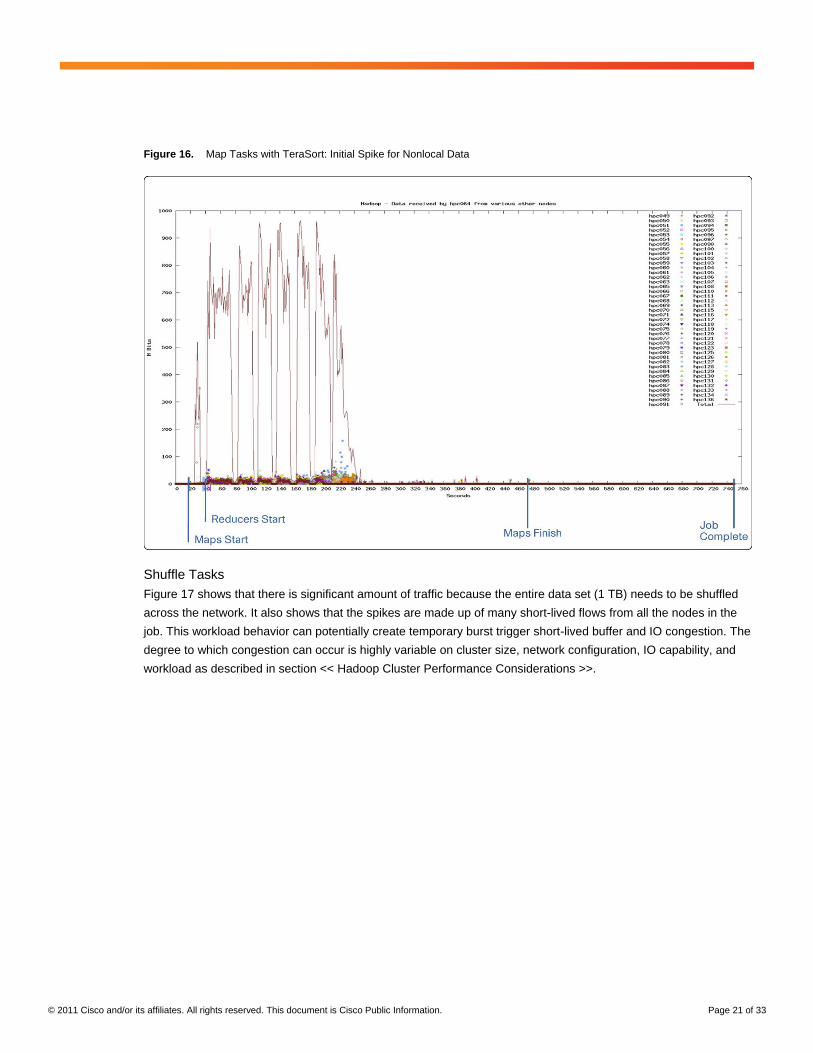
The Figure 16 depicts the same node with impact of non-local data. Notice that this initial spike in received traffic
occurs before the reducers start. The spike represents data that each map task needs that is not local. The non-
local data movement can occur either the map task is distributed such the data is on another node or the scheduler
assigned the task to data node where locality of data were not possible.
© 2011 Cisco and/or its affiliates. All rights reserved. This document is Cisco Public Information. Page 21 of 33
Figure 16. Map Tasks with TeraSort: Initial Spike for Nonlocal Data
Shuffle Tasks
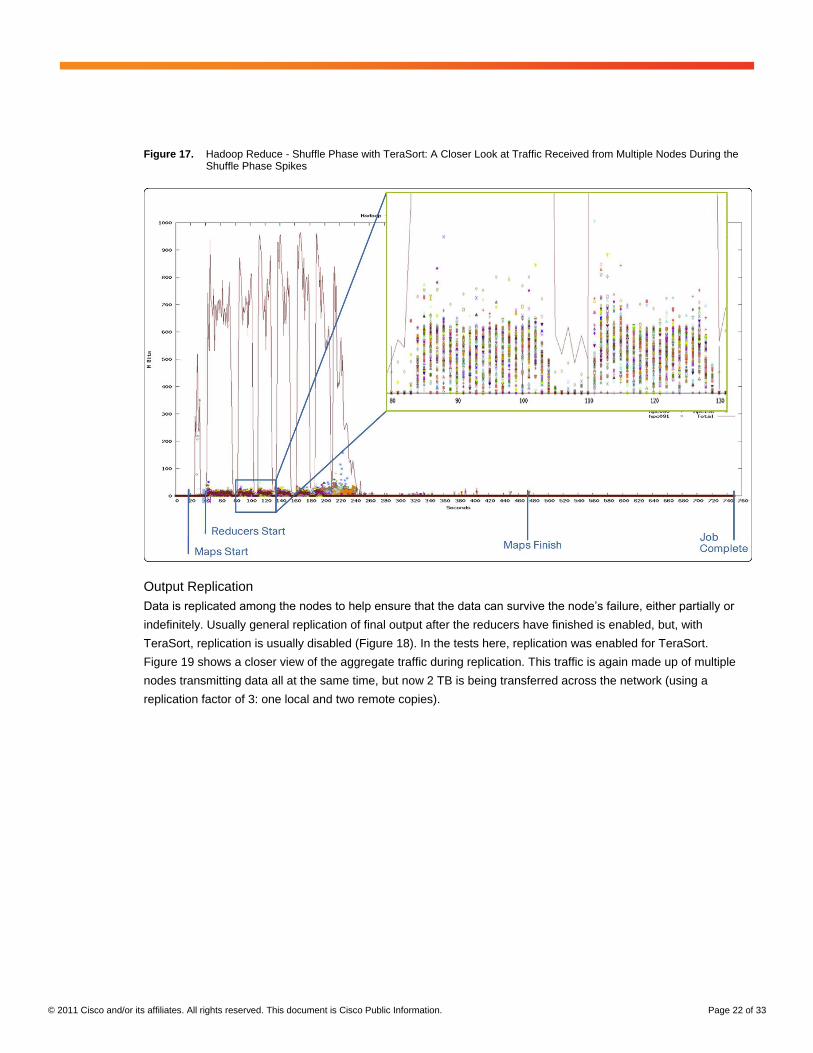
Figure 17 shows that there is significant amount of traffic because the entire data set (1 TB) needs to be shuffled
across the network. It also shows that the spikes are made up of many short-lived flows from all the nodes in the
job. This workload behavior can potentially create temporary burst trigger short-lived buffer and IO congestion. The
degree to which congestion can occur is highly variable on cluster size, network configuration, IO capability, and
workload as described in section << Hadoop Cluster Performance Considerations >>.
© 2011 Cisco and/or its affiliates. All rights reserved. This document is Cisco Public Information. Page 22 of 33
Figure 17. Hadoop Reduce - Shuffle Phase with TeraSort: A Closer Look at Traffic Received from Multiple Nodes During the Shuffle Phase Spikes
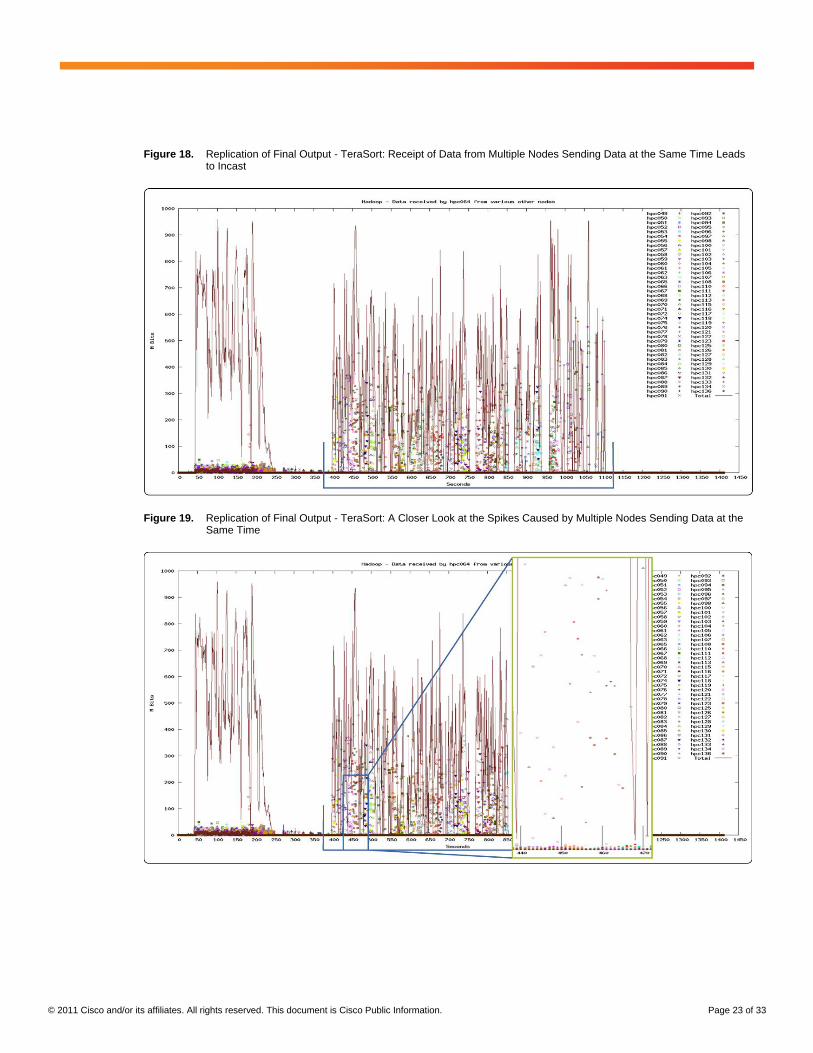
Output Replication
Data is replicated among the nodes to help ensure that the data can survive the node’s failure, either partially or
indefinitely. Usually general replication of final output after the reducers have finished is enabled, but, with
TeraSort, replication is usually disabled (Figure 18). In the tests here, replication was enabled for TeraSort.
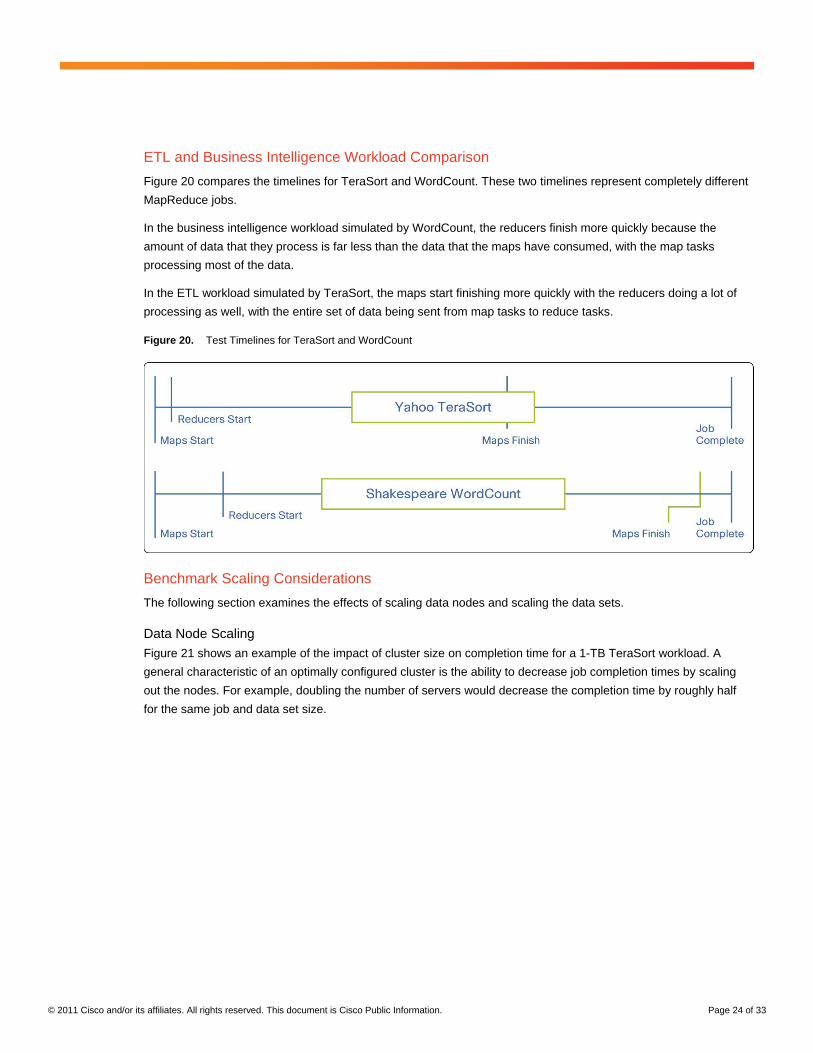
Figure 19 shows a closer view of the aggregate traffic during replication. This traffic is again made up of multiple
nodes transmitting data all at the same time, but now 2 TB is being transferred across the network (using a
replication factor of 3: one local and two remote copies).
© 2011 Cisco and/or its affiliates. All rights reserved. This document is Cisco Public Information. Page 23 of 33
Figure 18. Replication of Final Output - TeraSort: Receipt of Data from Multiple Nodes Sending Data at the Same Time Leads to Incast
Figure 19. Replication of Final Output - TeraSort: A Closer Look at the Spikes Caused by Multiple Nodes Sending Data at the Same Time
© 2011 Cisco and/or its affiliates. All rights reserved. This document is Cisco Public Information. Page 24 of 33
ETL and Business Intelligence Workload Comparison
Figure 20 compares the timelines for TeraSort and WordCount. These two timelines represent completely different
MapReduce jobs.
In the business intelligence workload simulated by WordCount, the reducers finish more quickly because the
amount of data that they process is far less than the data that the maps have consumed, with the map tasks
processing most of the data.
In the ETL workload simulated by TeraSort, the maps start finishing more quickly with the reducers doing a lot of
processing as well, with the entire set of data being sent from map tasks to reduce tasks.
Figure 20. Test Timelines for TeraSort and WordCount
Benchmark Scaling Considerations
The following section examines the effects of scaling data nodes and scaling the data sets.
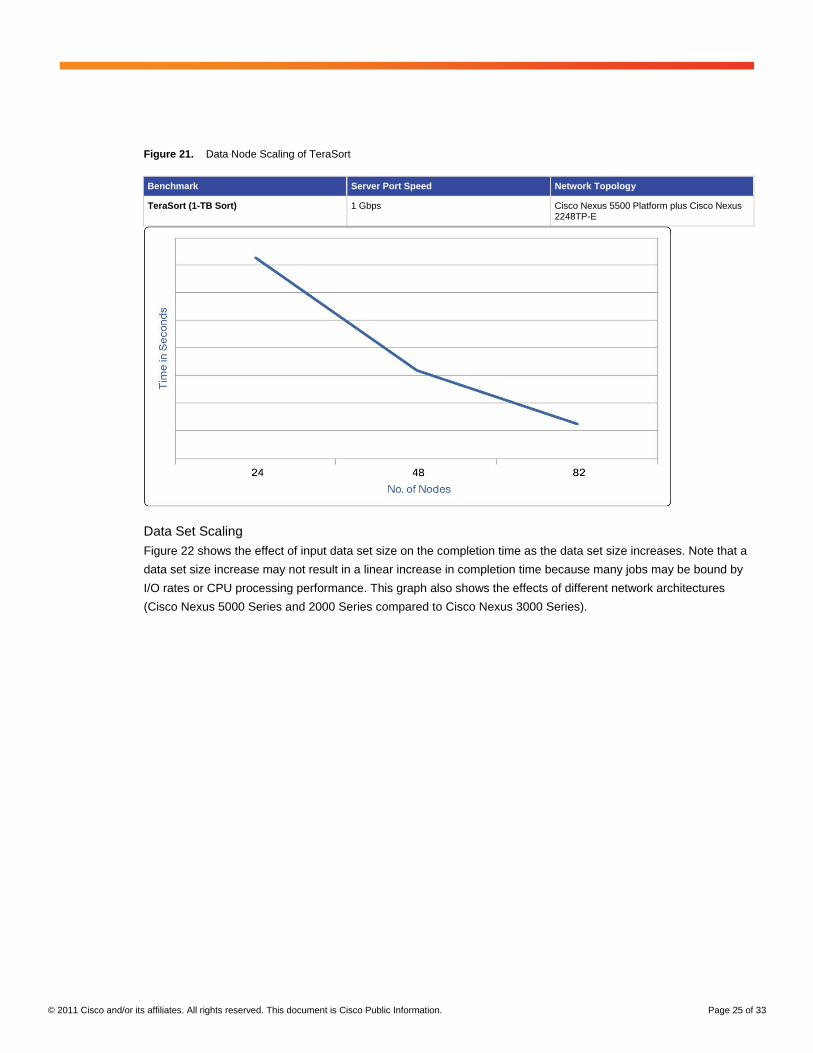
Data Node Scaling
Figure 21 shows an example of the impact of cluster size on completion time for a 1-TB TeraSort workload. A
general characteristic of an optimally configured cluster is the ability to decrease job completion times by scaling
out the nodes. For example, doubling the number of servers would decrease the completion time by roughly half
for the same job and data set size.
© 2011 Cisco and/or its affiliates. All rights reserved. This document is Cisco Public Information. Page 25 of 33
Figure 21. Data Node Scaling of TeraSort
Benchmark Server Port Speed Network Topology
TeraSort (1-TB Sort) 1 Gbps Cisco Nexus 5500 Platform plus Cisco Nexus 2248TP-E
Data Set Scaling
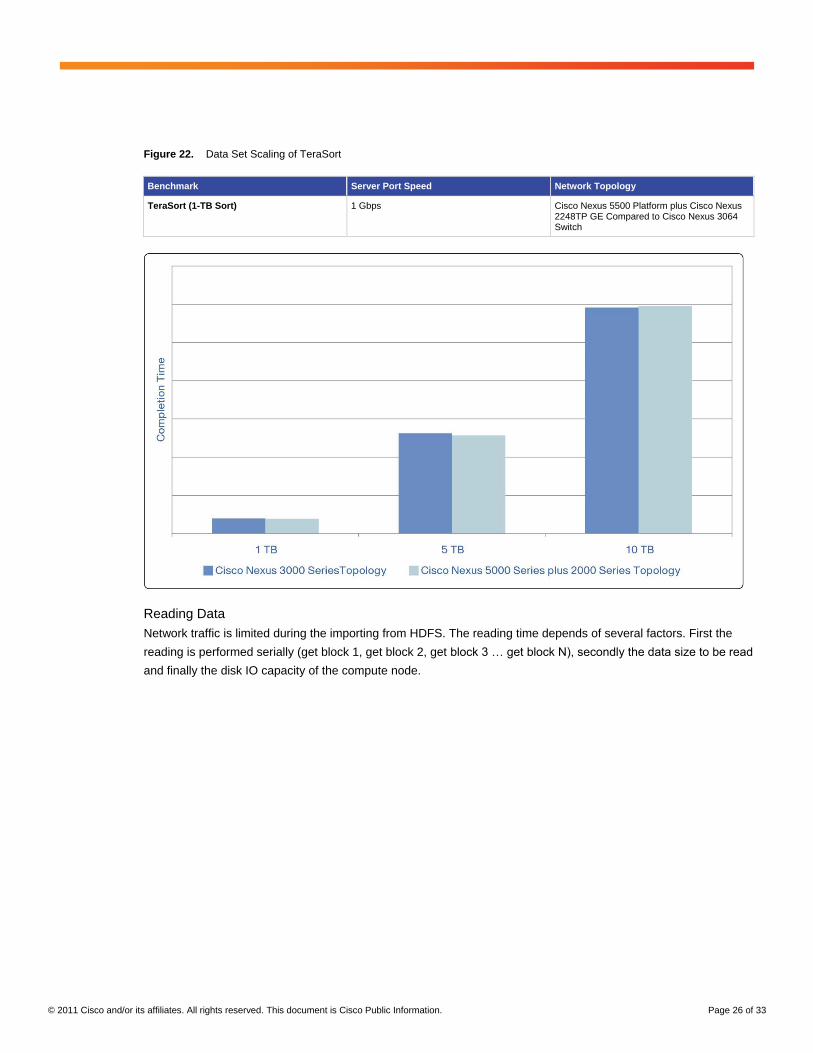
Figure 22 shows the effect of input data set size on the completion time as the data set size increases. Note that a
data set size increase may not result in a linear increase in completion time because many jobs may be bound by
I/O rates or CPU processing performance. This graph also shows the effects of different network architectures
(Cisco Nexus 5000 Series and 2000 Series compared to Cisco Nexus 3000 Series).
© 2011 Cisco and/or its affiliates. All rights reserved. This document is Cisco Public Information. Page 26 of 33
Figure 22. Data Set Scaling of TeraSort
Benchmark Server Port Speed Network Topology
TeraSort (1-TB Sort) 1 Gbps Cisco Nexus 5500 Platform plus Cisco Nexus 2248TP GE Compared to Cisco Nexus 3064 Switch
Reading Data
Network traffic is limited during the importing from HDFS. The reading time depends of several factors. First the
reading is performed serially (get block 1, get block 2, get block 3 … get block N), secondly the data size to be read
and finally the disk IO capacity of the compute node.
© 2011 Cisco and/or its affiliates. All rights reserved. This document is Cisco Public Information. Page 27 of 33
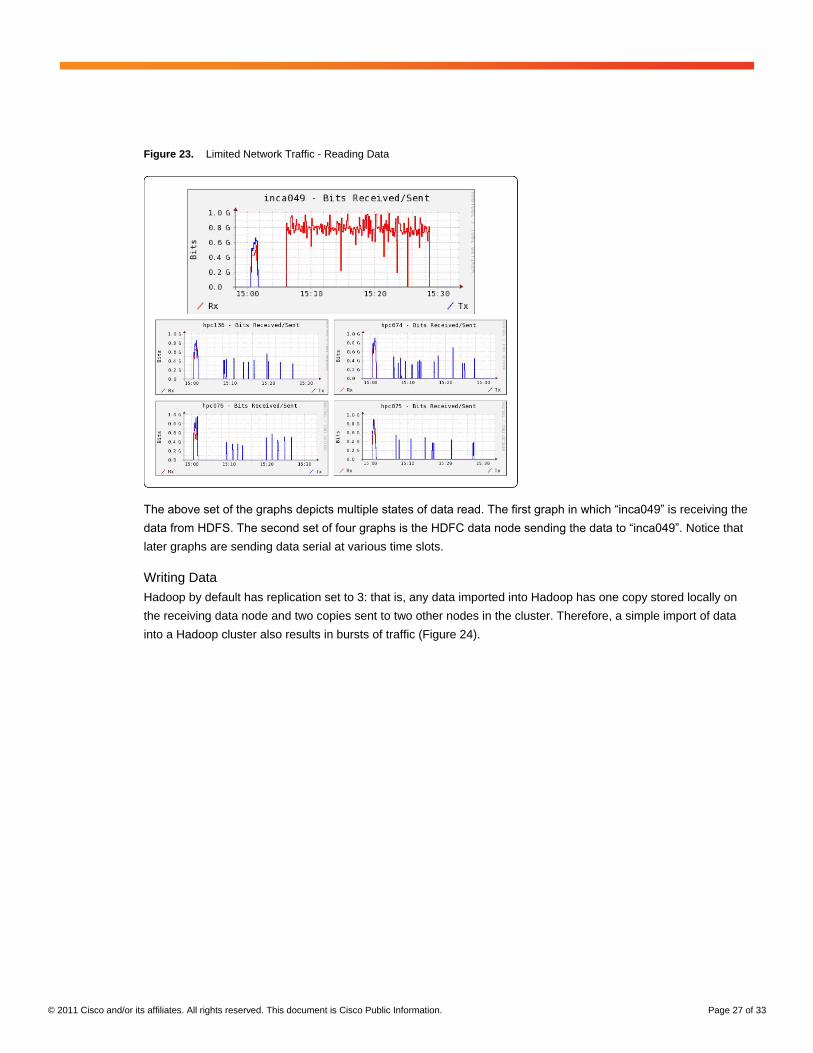
Figure 23. Limited Network Traffic - Reading Data
The above set of the graphs depicts multiple states of data read. The first graph in which “inca049” is receiving the
data from HDFS. The second set of four graphs is the HDFC data node sending the data to “inca049”. Notice that
later graphs are sending data serial at various time slots.
Writing Data
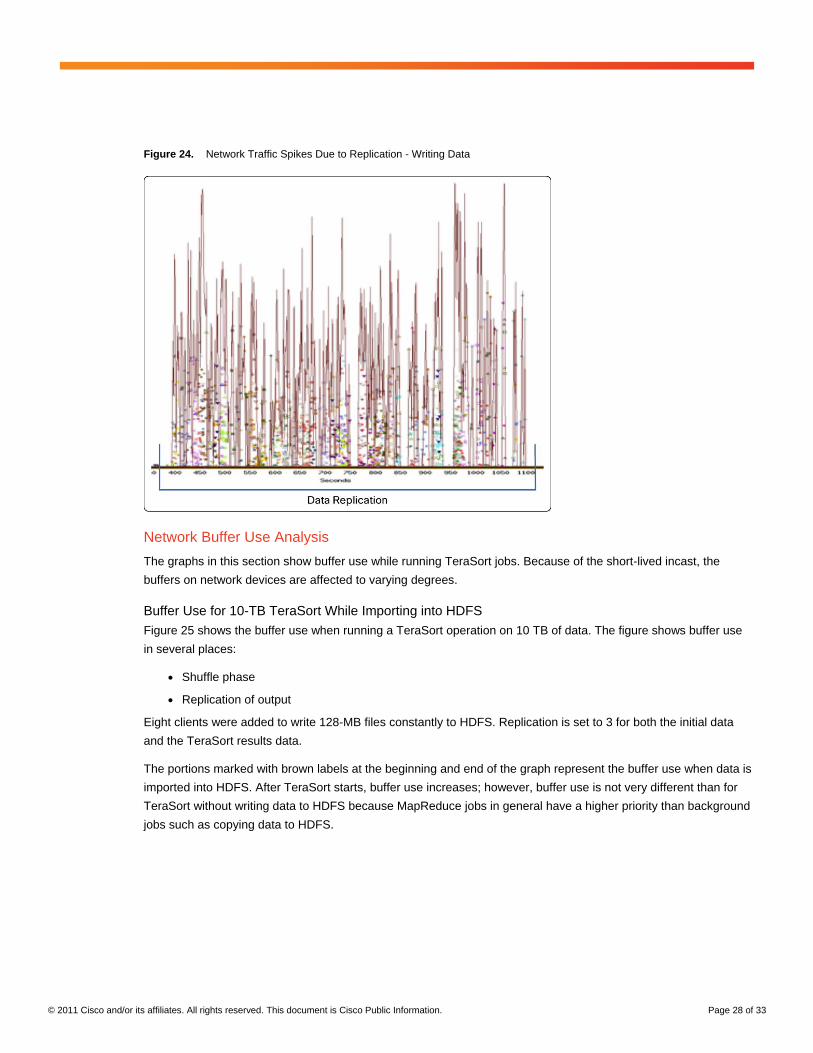
Hadoop by default has replication set to 3: that is, any data imported into Hadoop has one copy stored locally on
the receiving data node and two copies sent to two other nodes in the cluster. Therefore, a simple import of data
into a Hadoop cluster also results in bursts of traffic (Figure 24).
© 2011 Cisco and/or its affiliates. All rights reserved. This document is Cisco Public Information. Page 28 of 33
Figure 24. Network Traffic Spikes Due to Replication - Writing Data
Network Buffer Use Analysis
The graphs in this section show buffer use while running TeraSort jobs. Because of the short-lived incast, the
buffers on network devices are affected to varying degrees.
Buffer Use for 10-TB TeraSort While Importing into HDFS
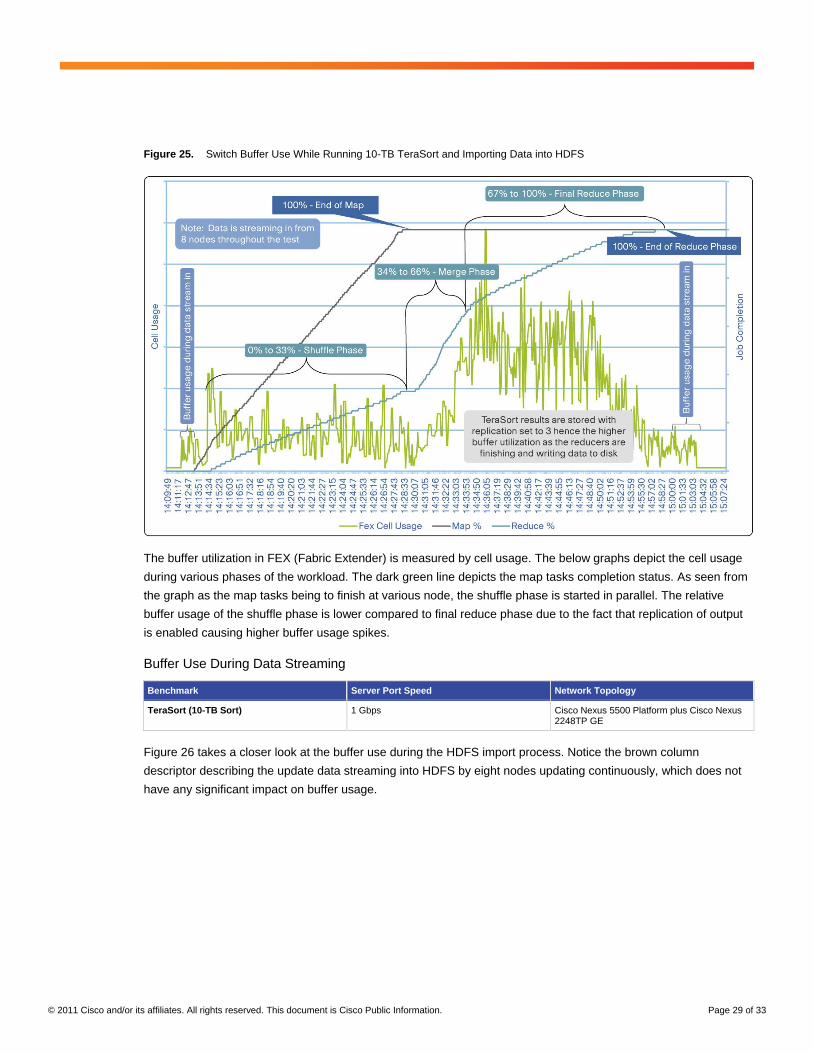
Figure 25 shows the buffer use when running a TeraSort operation on 10 TB of data. The figure shows buffer use
in several places:
● Shuffle phase
● Replication of output
Eight clients were added to write 128-MB files constantly to HDFS. Replication is set to 3 for both the initial data
and the TeraSort results data.
The portions marked with brown labels at the beginning and end of the graph represent the buffer use when data is
imported into HDFS. After TeraSort starts, buffer use increases; however, buffer use is not very different than for
TeraSort without writing data to HDFS because MapReduce jobs in general have a higher priority than background
jobs such as copying data to HDFS.
© 2011 Cisco and/or its affiliates. All rights reserved. This document is Cisco Public Information. Page 29 of 33
Figure 25. Switch Buffer Use While Running 10-TB TeraSort and Importing Data into HDFS
The buffer utilization in FEX (Fabric Extender) is measured by cell usage. The below graphs depict the cell usage
during various phases of the workload. The dark green line depicts the map tasks completion status. As seen from
the graph as the map tasks being to finish at various node, the shuffle phase is started in parallel. The relative
buffer usage of the shuffle phase is lower compared to final reduce phase due to the fact that replication of output
is enabled causing higher buffer usage spikes.
Buffer Use During Data Streaming
Benchmark Server Port Speed Network Topology
TeraSort (10-TB Sort) 1 Gbps Cisco Nexus 5500 Platform plus Cisco Nexus 2248TP GE
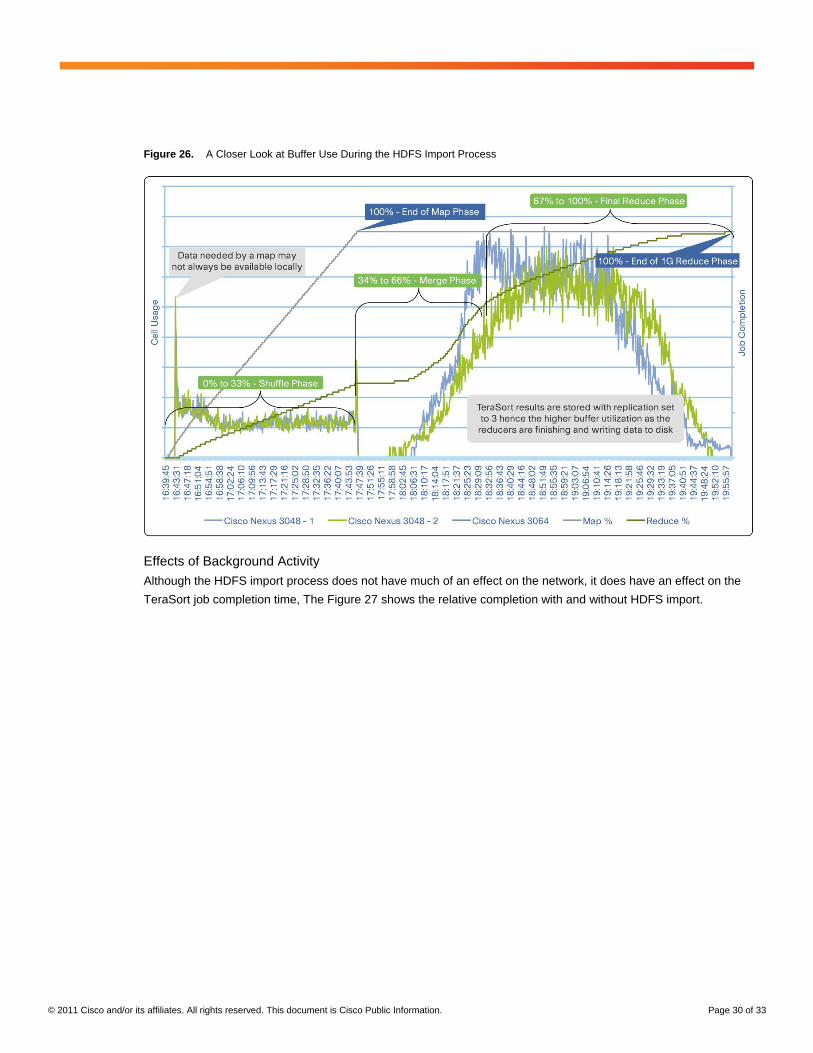
Figure 26 takes a closer look at the buffer use during the HDFS import process. Notice the brown column
descriptor describing the update data streaming into HDFS by eight nodes updating continuously, which does not
have any significant impact on buffer usage.
© 2011 Cisco and/or its affiliates. All rights reserved. This document is Cisco Public Information. Page 30 of 33
Figure 26. A Closer Look at Buffer Use During the HDFS Import Process
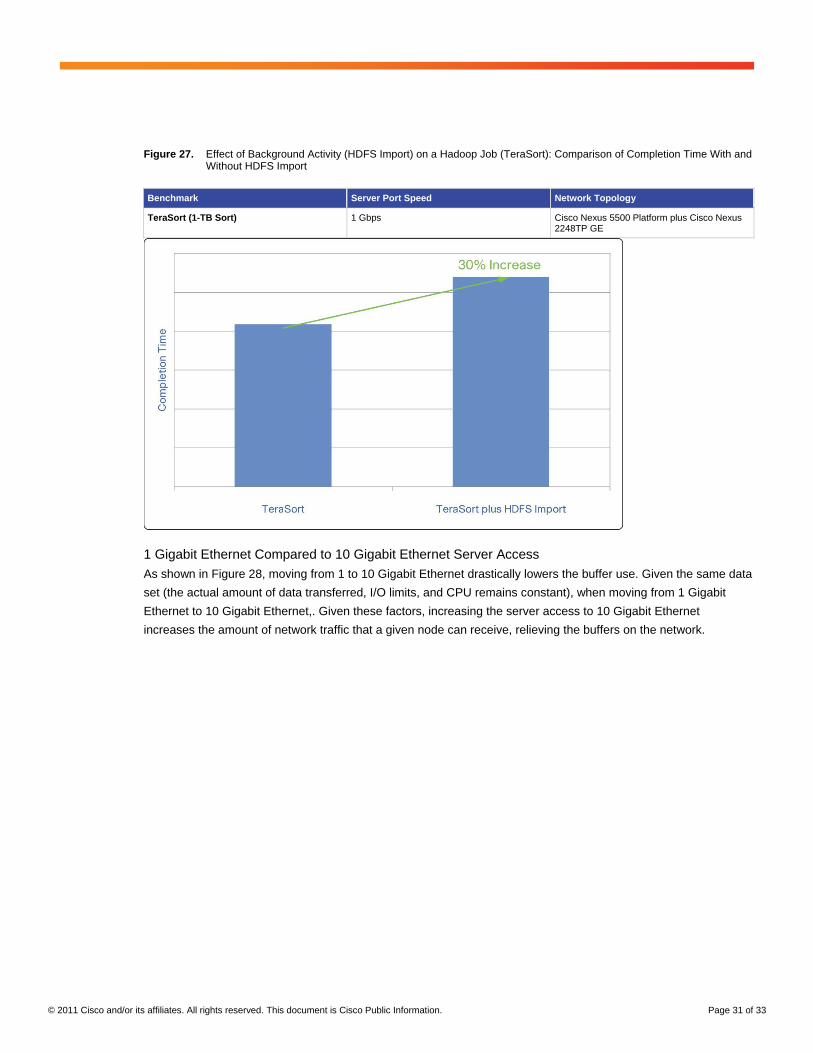
Effects of Background Activity
Although the HDFS import process does not have much of an effect on the network, it does have an effect on the
TeraSort job completion time, The Figure 27 shows the relative completion with and without HDFS import.
© 2011 Cisco and/or its affiliates. All rights reserved. This document is Cisco Public Information. Page 31 of 33
Figure 27. Effect of Background Activity (HDFS Import) on a Hadoop Job (TeraSort): Comparison of Completion Time With and Without HDFS Import
Benchmark Server Port Speed Network Topology
TeraSort (1-TB Sort) 1 Gbps Cisco Nexus 5500 Platform plus Cisco Nexus 2248TP GE
1 Gigabit Ethernet Compared to 10 Gigabit Ethernet Server Access
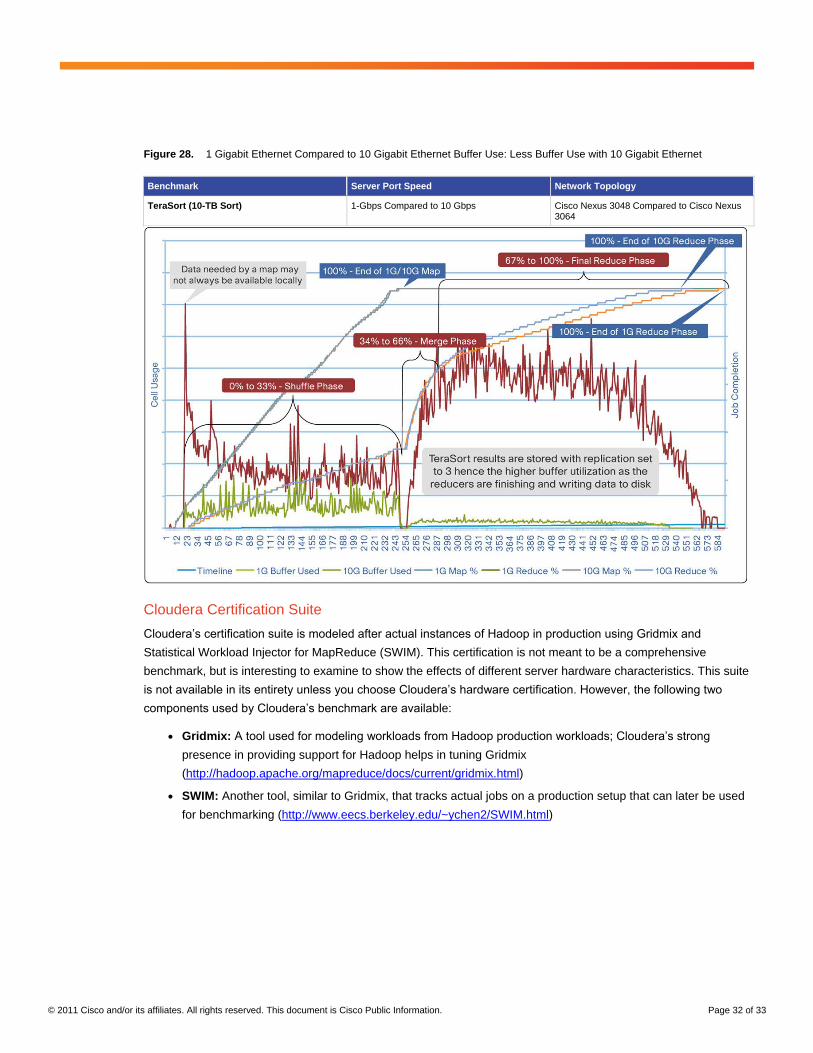
As shown in Figure 28, moving from 1 to 10 Gigabit Ethernet drastically lowers the buffer use. Given the same data
set (the actual amount of data transferred, I/O limits, and CPU remains constant), when moving from 1 Gigabit
Ethernet to 10 Gigabit Ethernet,. Given these factors, increasing the server access to 10 Gigabit Ethernet
increases the amount of network traffic that a given node can receive, relieving the buffers on the network.
© 2011 Cisco and/or its affiliates. All rights reserved. This document is Cisco Public Information. Page 32 of 33
Figure 28. 1 Gigabit Ethernet Compared to 10 Gigabit Ethernet Buffer Use: Less Buffer Use with 10 Gigabit Ethernet
Benchmark Server Port Speed Network Topology
TeraSort (10-TB Sort) 1-Gbps Compared to 10 Gbps Cisco Nexus 3048 Compared to Cisco Nexus 3064
Cloudera Certification Suite
Cloudera’s certification suite is modeled after actual instances of Hadoop in production using Gridmix and
Statistical Workload Injector for MapReduce (SWIM). This certification is not meant to be a comprehensive
benchmark, but is interesting to examine to show the effects of different server hardware characteristics. This suite
is not available in its entirety unless you choose Cloudera’s hardware certification. However, the following two
components used by Cloudera’s benchmark are available:
● Gridmix: A tool used for modeling workloads from Hadoop production workloads; Cloudera’s strong
presence in providing support for Hadoop helps in tuning Gridmix
(http://hadoop.apache.org/mapreduce/docs/current/gridmix.html)
● SWIM: Another tool, similar to Gridmix, that tracks actual jobs on a production setup that can later be used
for benchmarking (http://www.eecs.berkeley.edu/~ychen2/SWIM.html)
© 2011 Cisco and/or its affiliates. All rights reserved. This document is Cisco Public Information. Page 33 of 33
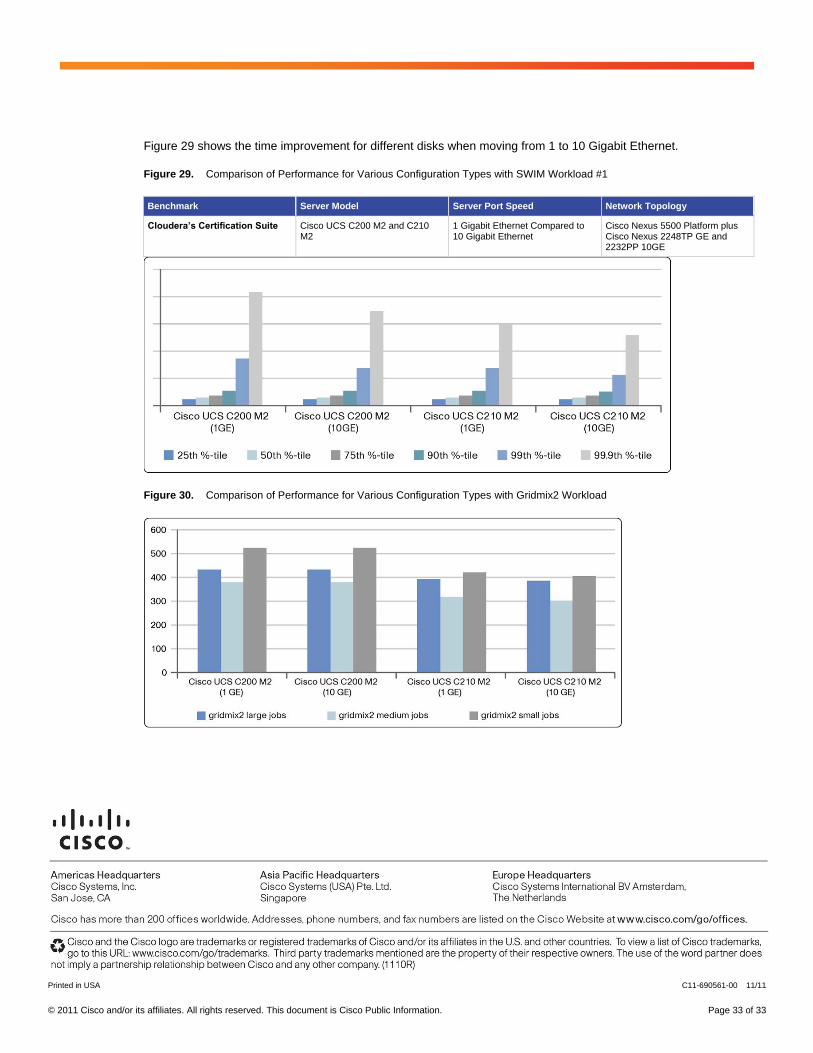
Figure 29 shows the time improvement for different disks when moving from 1 to 10 Gigabit Ethernet.
Figure 29. Comparison of Performance for Various Configuration Types with SWIM Workload #1
Benchmark Server Model Server Port Speed Network Topology
Cloudera’s Certification Suite Cisco UCS C200 M2 and C210 M2
1 Gigabit Ethernet Compared to 10 Gigabit Ethernet
Cisco Nexus 5500 Platform plus Cisco Nexus 2248TP GE and 2232PP 10GE
Figure 30. Comparison of Performance for Various Configuration Types with Gridmix2 Workload
Printed in USA C11-690561-00 11/11