Embed Size (px)
Citation preview
Big datain
spatial planning
20-03-2017
Anto Aasa
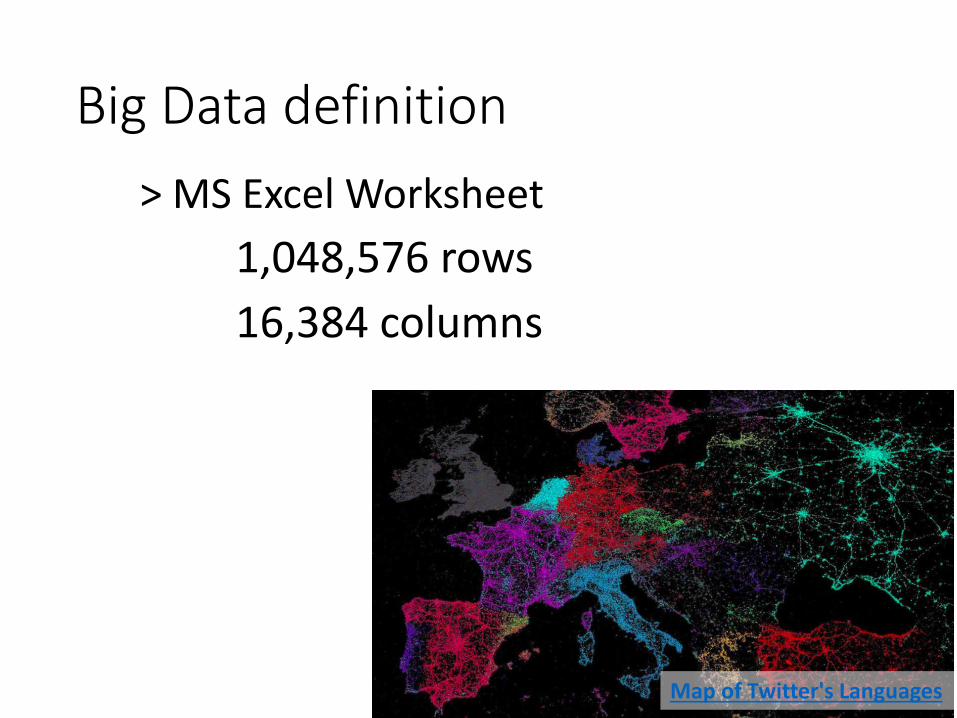
Big Data definition
> MS Excel Worksheet
1,048,576 rows
16,384 columns
Map of Twitter's Languages
Big Data
• Most of big data is produced automatically, routinely, and by various forms of sensors
• Continuing stream of data
• Computers access resources in remote locations
• Cloud: remotely accessed computing power and storage
• Rise of Sensing Technologies• Everything is „smart“
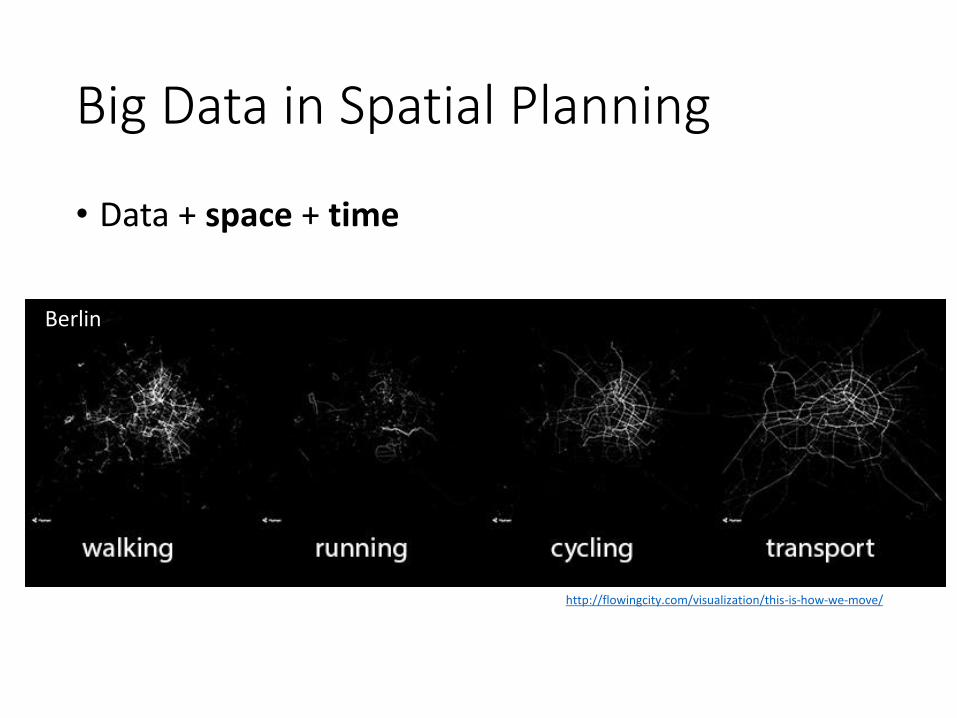
Big Data in Spatial Planning
• Data + space + time
Berlin
http://flowingcity.com/visualization/this-is-how-we-move/
Big Data
• More knowledge of how cities function
• Many new opportunities for social interaction
• More informed decision-making
• Questions of privacy and confidentiality• You’re not the Facebook user? What’s wrong with you?
• Computational problem• Data avalanche
Big Data
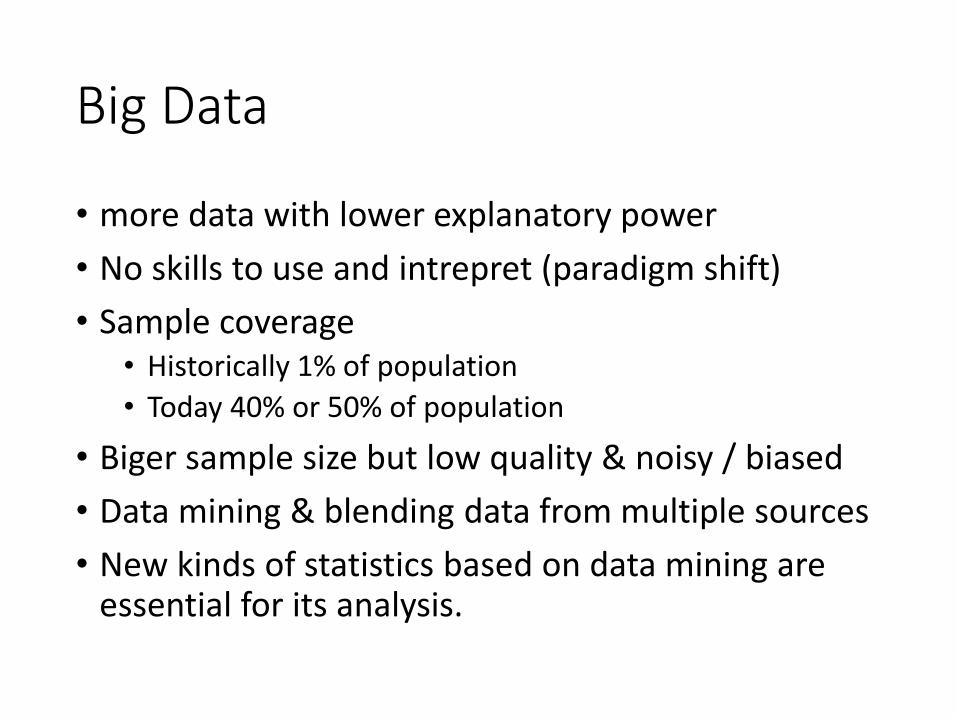
• more data with lower explanatory power
• No skills to use and intrepret (paradigm shift)
• Sample coverage• Historically 1% of population
• Today 40% or 50% of population
• Biger sample size but low quality & noisy / biased
• Data mining & blending data from multiple sources
• New kinds of statistics based on data mining are essential for its analysis.
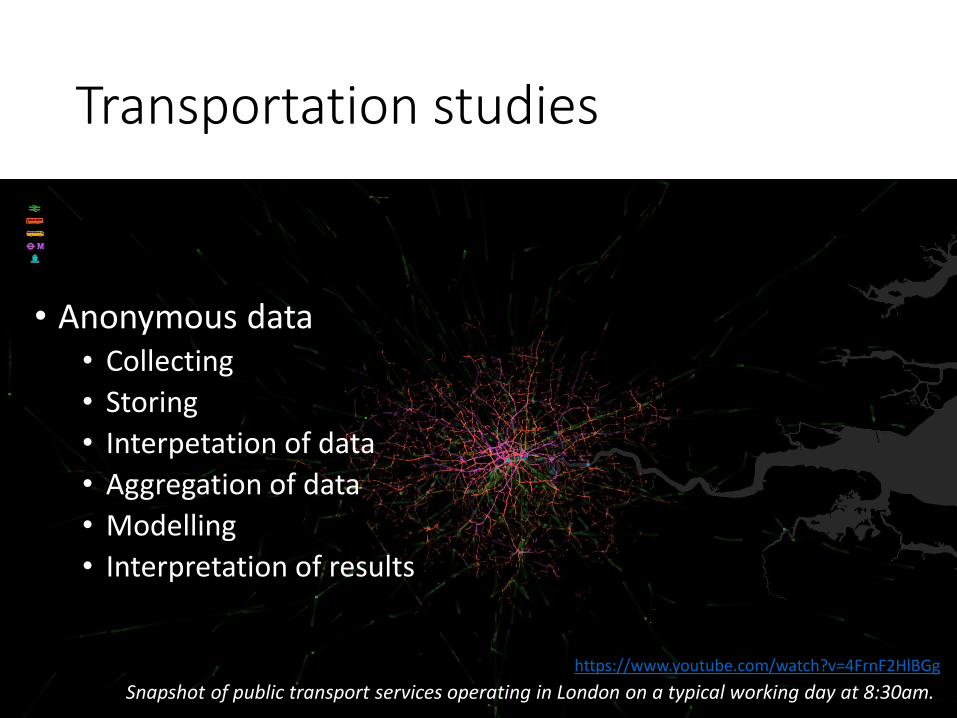
Transportation studies
• Anonymous data• Collecting
• Storing
• Interpetation of data
• Aggregation of data
• Modelling
• Interpretation of results
https://www.youtube.com/watch?v=4FrnF2HlBGg
Snapshot of public transport services operating in London on a typical working day at 8:30am.
Right tool!
• MS Access (database max size < 2 GB)
• MS Word
• ESRI
• QGis
• mySQL
• PostgreSQL
• Python
• R
• Hadoop
• …
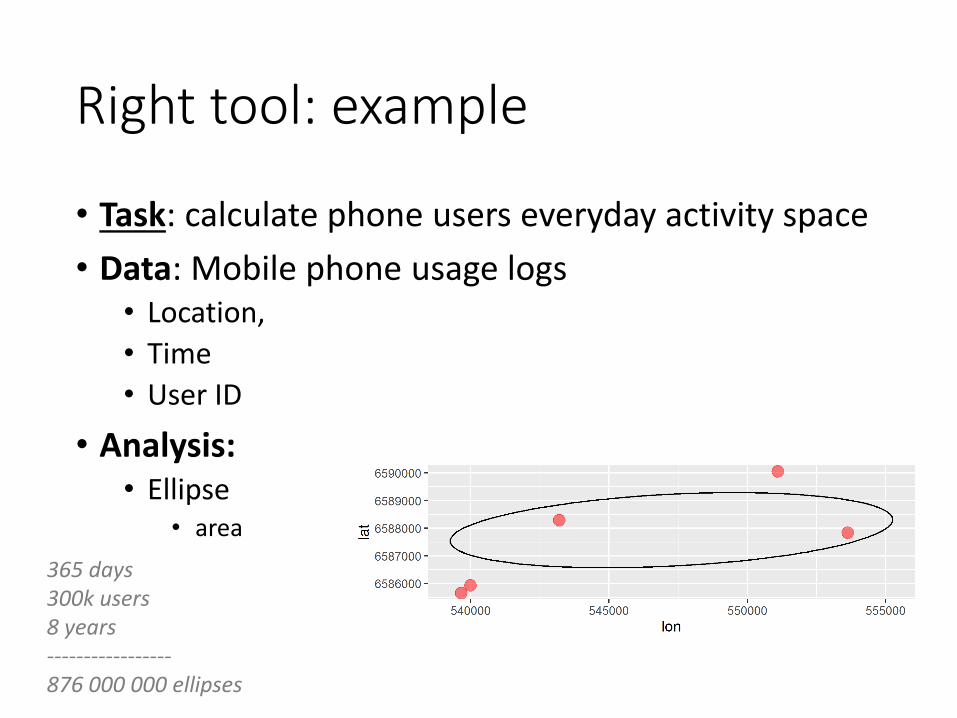
Right tool: example
• Task: calculate phone users everyday activity space
• Data: Mobile phone usage logs• Location,
• Time
• User ID
• Analysis:• Ellipse
• area
365 days300k users8 years-----------------876 000 000 ellipses
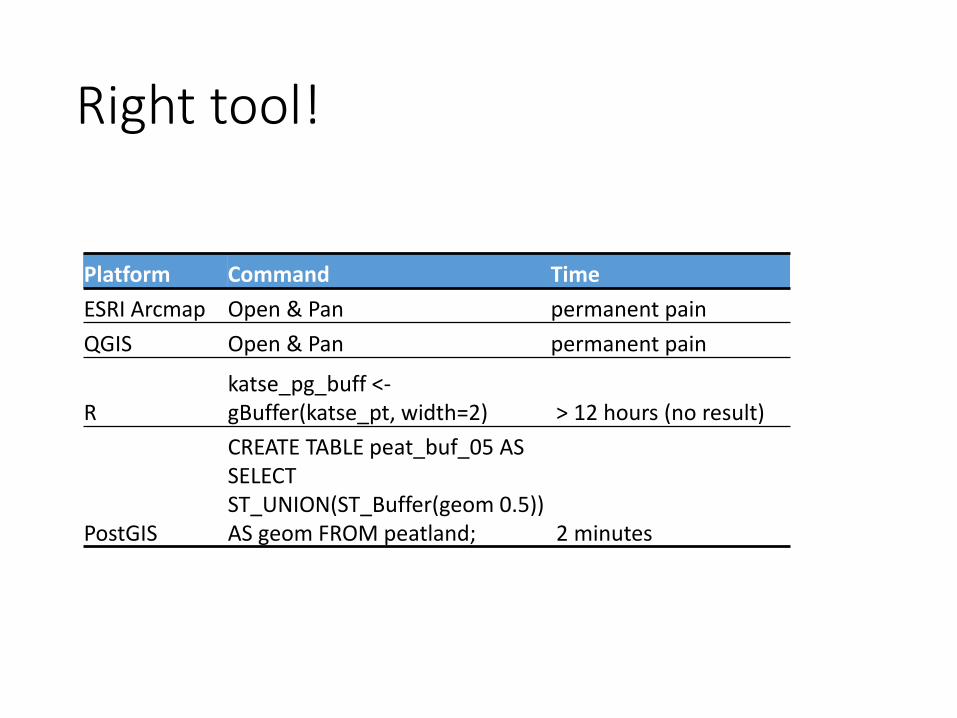
Right tool!
Platform Command Time
ESRI Arcmap Open & Pan permanent pain
QGIS Open & Pan permanent pain
Rkatse_pg_buff <-gBuffer(katse_pt, width=2) > 12 hours (no result)
PostGIS
CREATE TABLE peat_buf_05 AS SELECT ST_UNION(ST_Buffer(geom 0.5)) AS geom FROM peatland; 2 minutes
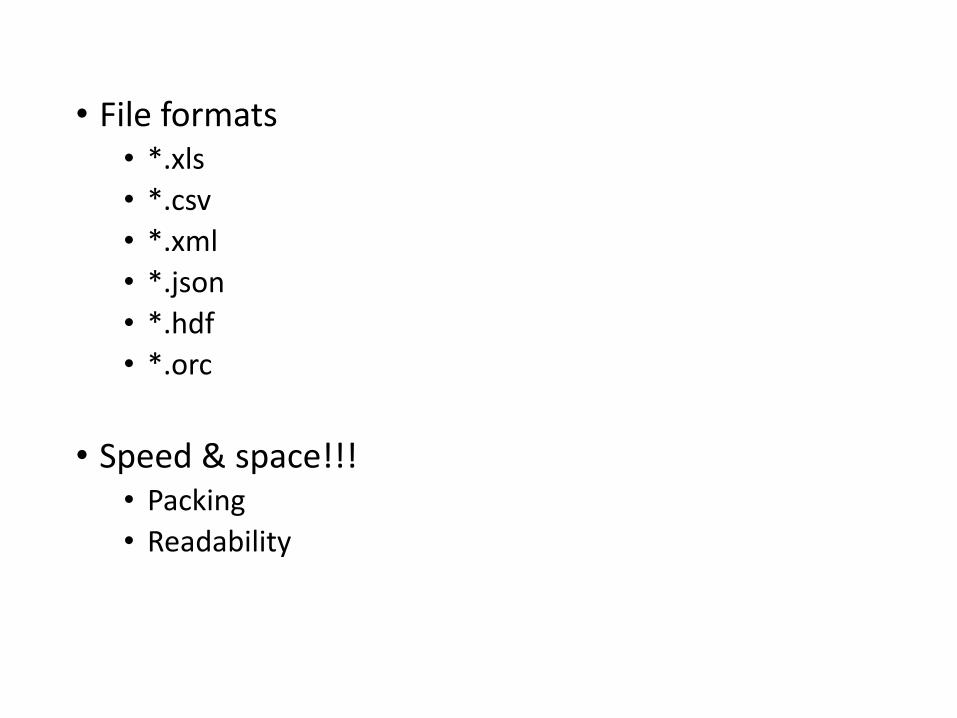
• File formats• *.xls
• *.csv
• *.xml
• *.json
• *.hdf
• *.orc
• Speed & space!!!• Packing
• Readability
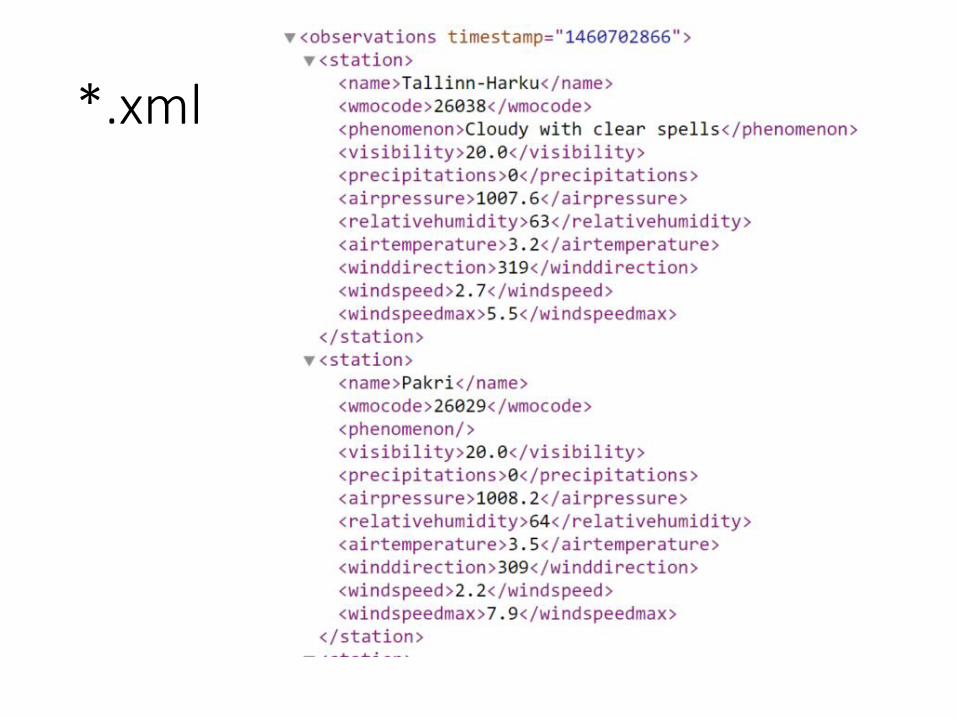
*.xml
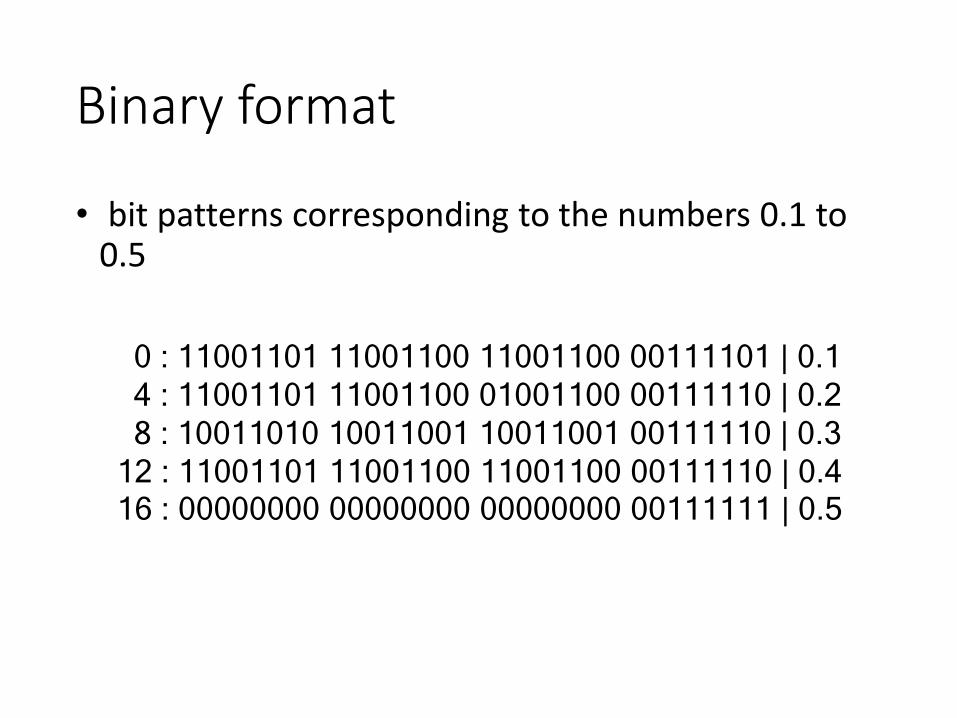
Binary format
• bit patterns corresponding to the numbers 0.1 to 0.5
0 : 11001101 11001100 11001100 00111101 | 0.1
4 : 11001101 11001100 01001100 00111110 | 0.2
8 : 10011010 10011001 10011001 00111110 | 0.3
12 : 11001101 11001100 11001100 00111110 | 0.4 16 : 00000000 00000000 00000000 00111111 | 0.5
• Data driven analysis
• Data mining
• Parallel processing / computing
• Open Data
Infographics.Interactive graphs & maps.
Animations
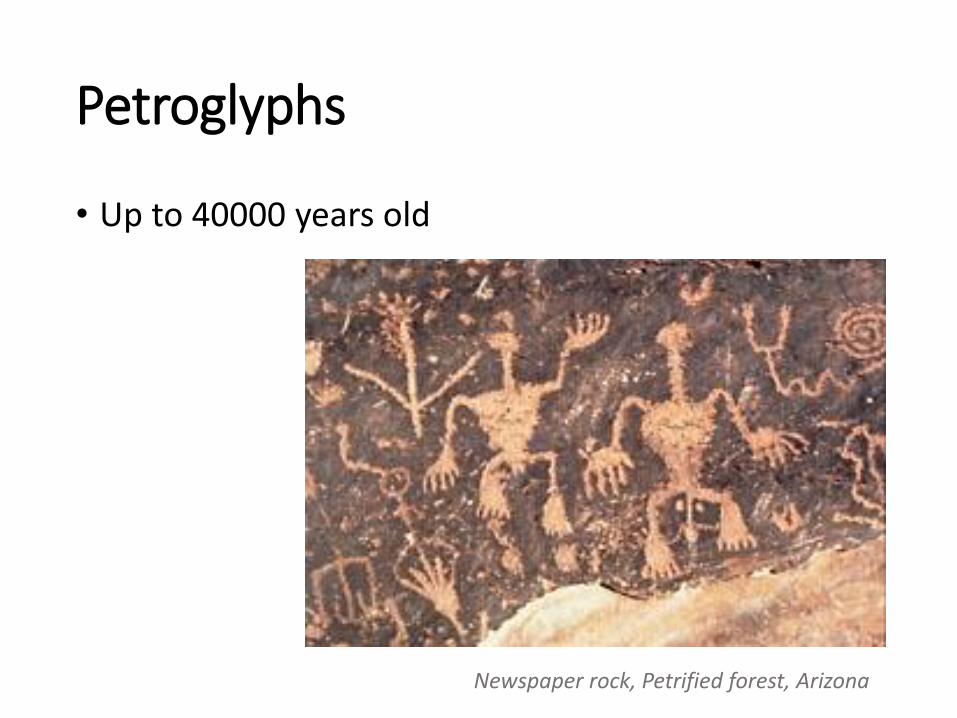
Petroglyphs
• Up to 40000 years old
Newspaper rock, Petrified forest, Arizona
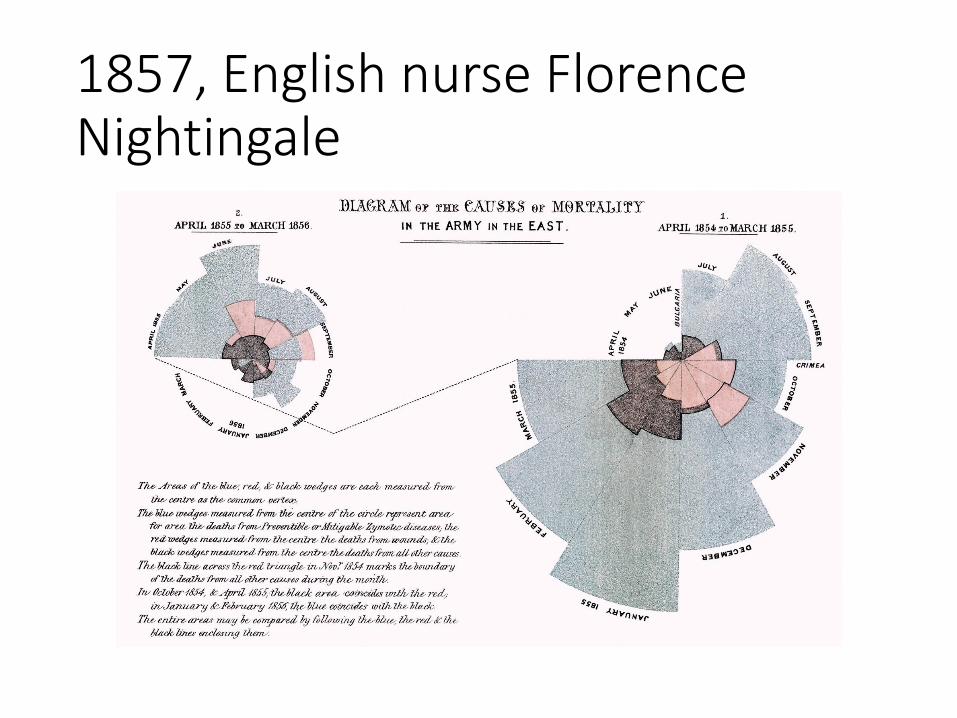
1857, English nurse Florence Nightingale
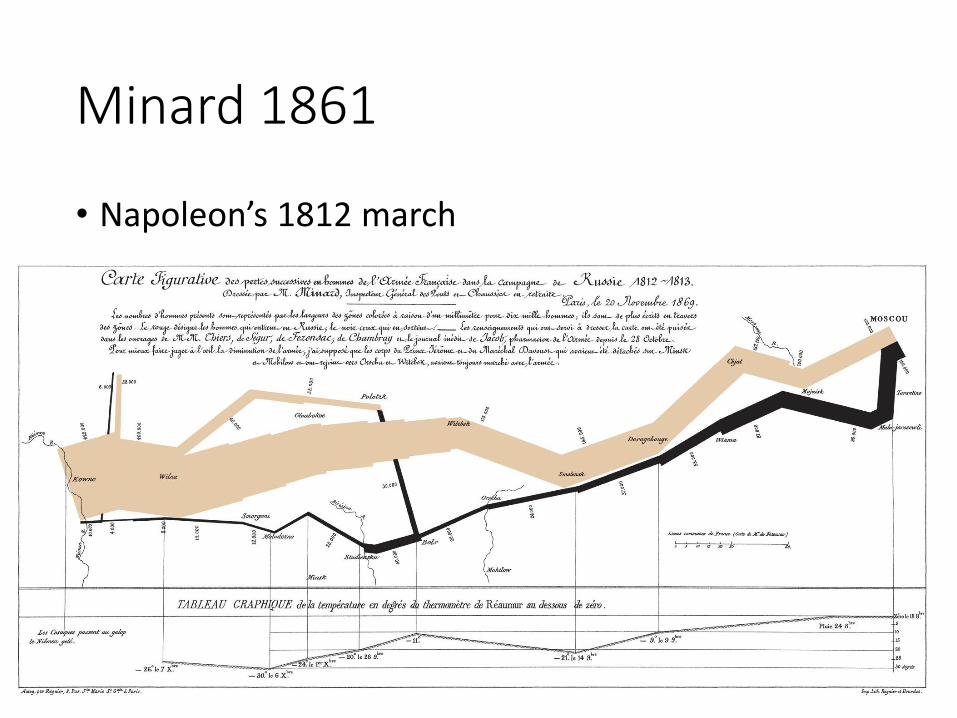
Minard 1861
• Napoleon’s 1812 march
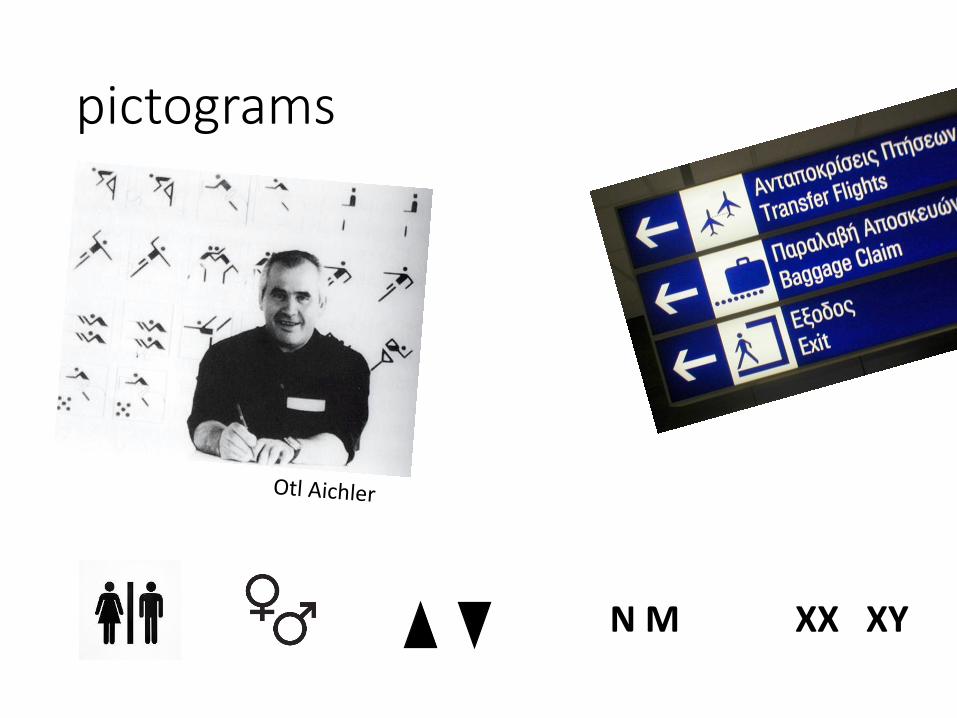
pictograms
N M XX XY
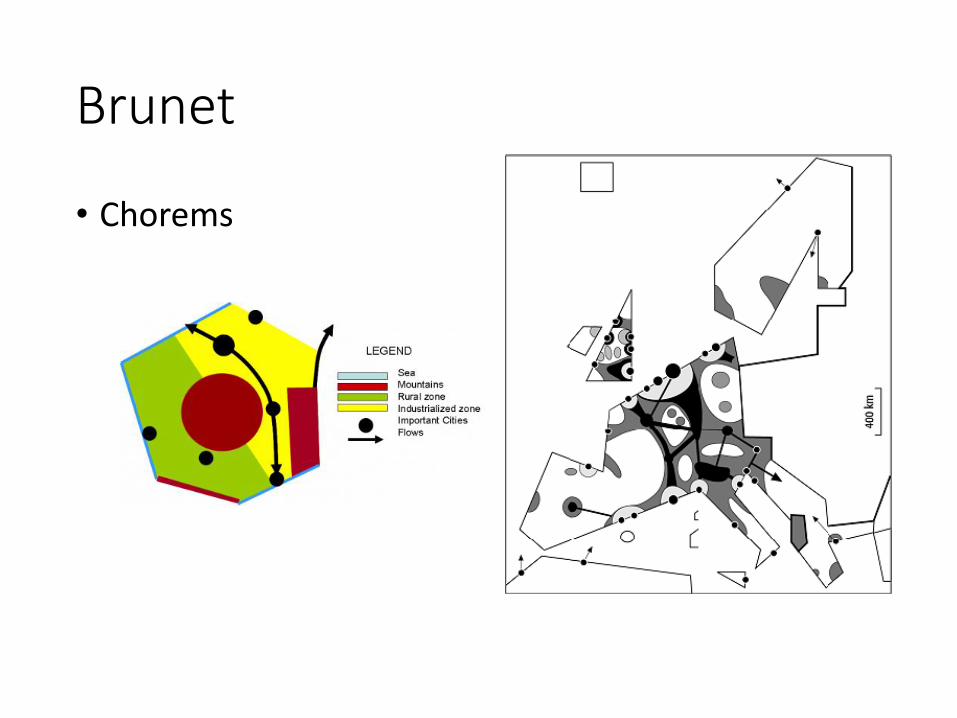
Brunet
• Chorems
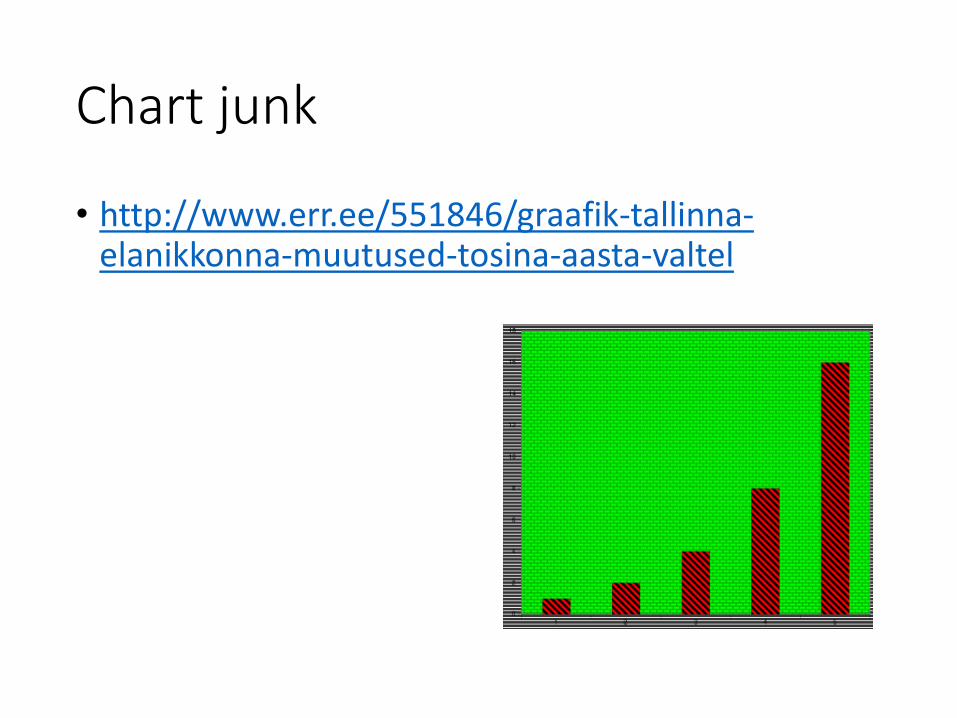
Chart junk
• http://www.err.ee/551846/graafik-tallinna-elanikkonna-muutused-tosina-aasta-valtel
Interactive graphs
• Network graph
• „calendar graph“
• Commuters near Tallinn
• Interactive map
• Movement animation
• ..