Embed Size (px)
Citation preview
© 2012 The Royal Statistical Society
greater depths with the Palomar Sky Survey during the 1950s. Astronomers pored over these photographic plates to build catalogues of new classes of objects, such as George Abell’s catalogue of rich galaxy clusters and Berverly Lynds’s catalogues of interstellar clouds.
These early catalogues, published on paper in spe-cialised journals, laid the foundations for entire fields of modern astronomy. But it was the Sloan Digital Sky Survey (SDSS, http://sdss.org), designed in the 1990s by James Gunn and many colleagues, that brought astronomy into the big data era – and here ‘big’ really does mean massive. The entire telescope was designed around a thorough visible-light survey of one-third of the celestial sphere, obtaining positions and brightness for a billion stars, galaxies and quasars (supermassive black holes in distant galaxies) along with spectra of a million objects. With a modest cost of around $100 million and still thriving today, the SDSS telescope produces about 200 GB of data every night, adding to a database that stands at around 50 TB today.
The scientific impact of the SDSS has been phe-nomenal: over 3000 papers on topics ranging from comets to cosmology, generating today over 160 000 cita-tions. NASA’s Hubble Space Telescope (HST) has had roughly 3 times the impact, but at roughly 100 times the cost. Leaders of the astronomical communities have paid attention to this success, and plans for new visible-band telescopes in the 2010s and 2020s are concentrating on wide-field surveys. Reasonable detector costs, coupled with the rapid rise of computational processing power, data storage capacity and network bandwidth, allow ever wider fields and fainter sources to be probed.
Big data in astronomy
The changing landscape of astronomical research
Not so long ago, astronomers would typically travel to a distant mountain-top and observe a few stars or galaxies through the cold night. Today those astronomers will often be sitting in their comfortable office, keeping much more sociable hours, at the end of a T2 internet line accessing megadatasets from around the world. Most leading research is based on data from a handful of very expensive telescopes located in deserts, on mountain-tops or on satellites in near-Earth space. A growing number of telescopes are entirely devoted to large-scale surveys of the sky, prohibiting individual scientists from making private observations. With a shared culture of cooperation and government regulations, the data from these telescopes are placed into online publicly avail-able archives. Big data is thus increasingly the norm in astronomy.
But order-of-magnitude increases in the size of our datasets is something of a tradition in astronomy. Ambi-tious and well-organised surveys of star positions and brightnesses date back to England’s first Astronomer Royal, John Flamsteed, whose early eighteenth-century catalogue had around 3000 stars. The bequest of the prosperous medical doctor Henry Draper funded the first spectroscopic star survey in the late nineteenth century. The resulting HD catalogue had around 300 000 stars. The increase was productive: it led to the development of the Hertzsprung–Russell diagram from which the internal structure and evolution of stars was inferred. The sky was photographed to much
Astronomy has been one of the first areas of science to embrace and learn from big data. Eric D. Feigelson and G. Jogesh Babu tell of the efforts, the challenges, and some of the ways it is transforming our knowledge of the cosmos.
A billion stars surveyed, spectra taken of a million objects; 800 new
planets discovered – and that is only
the beginning
22 august2012
23august2012
An entirely new dimension is now being added to astronomical imaging – the time axis. Repeated views of the night sky are revealing a wealth of variable stars and transient phe-nomena. These include Type Ia supernovae (exploding stars used to quantify Dark Matter and Dark Energy in the universe) and plan-etary transits (when a planet orbiting another star eclipses a tiny portion of its host starlight).
Many of us witnessed the recent planetary tran-sit when Venus passed across the disc of our sun. Planets outside our solar system, orbiting more distant stars, can be revealed by the same phenomenon. Nearly 800 of these exoplanets have already been recorded, and some of them may be capable of supporting life. Precision cosmology and exoplanet discoveries are now the two most exciting fields in astronomy. This time-domain astronomy will be a hallmark of twenty-first-century astronomy as a rich area for scientific exploration1.
The largest of these planned projects is the Large Synoptic Survey Telescope (LSST),
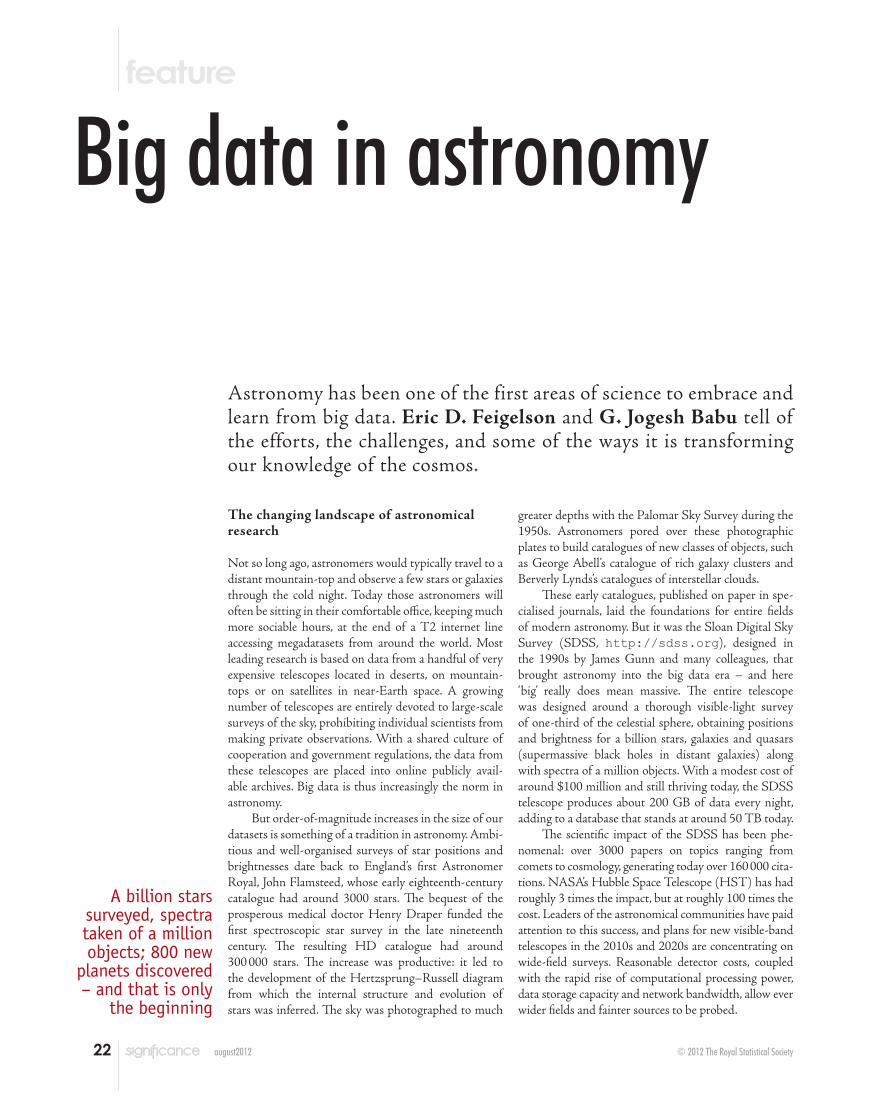
rated the top priority new telescope by the US National Academy of Sciences and scheduled to start around 2020. It will photograph half of the sky every 3 nights using wide-field optics and a gigantic gigapixel charge-coupled device (CCD) camera (Figure 1, left). The data flow will be 5–10 TB each night – so in 10 nights it will give as much information as the Sloan’s total contribution over the decade and a half that it has been operating. The imaging database will be 60 PB, and the reduced object table will have around 20 billion rows with dozens of columns. Thou-sands of transient objects are expected to be found each night. Sifting this information is clearly beyond unaided human power – and is beyond present computing power as well. Ef-ficient algorithms for high-dimensional den-sity estimation, pair correlation functions, and other statistical operations will be necessary. Though challenging, there is some optimism that the informatics of LSST will be feasible if Moore’s law for improvements in process-ing, and similar improvements in data storage technology, continue throughout the coming decade (a discussion of this can be found at https://asaip.psu.edu/forums/lsst-forum).
A large fraction of astronomical observa-tions in recent decades have been conducted in wavebands that our eyes cannot see. Infrared, microwave, ultraviolet, X-rays and gamma rays generated by stars, galaxies and accret-ing black holes cannot penetrate the Earth’s
atmosphere, and are observed with space-borne telescopes. However, data reduction is often performed by on-board computers to reduce the data volume transmitted to Earth. Satellite telescopes such as HST thus do not generally produce megadatasets. The prin-cipal exception may be the European Space Agency’s Planck satellite that is now mapping the cosmic microwave background radiation at high resolution. The resulting dataset will again hugely increase our understanding of the cosmos. When it has been fitted to a high-dimensional nonlinear model of modern cosmology, it will guide us in discriminating between astrophysical models of the structure of the universe.
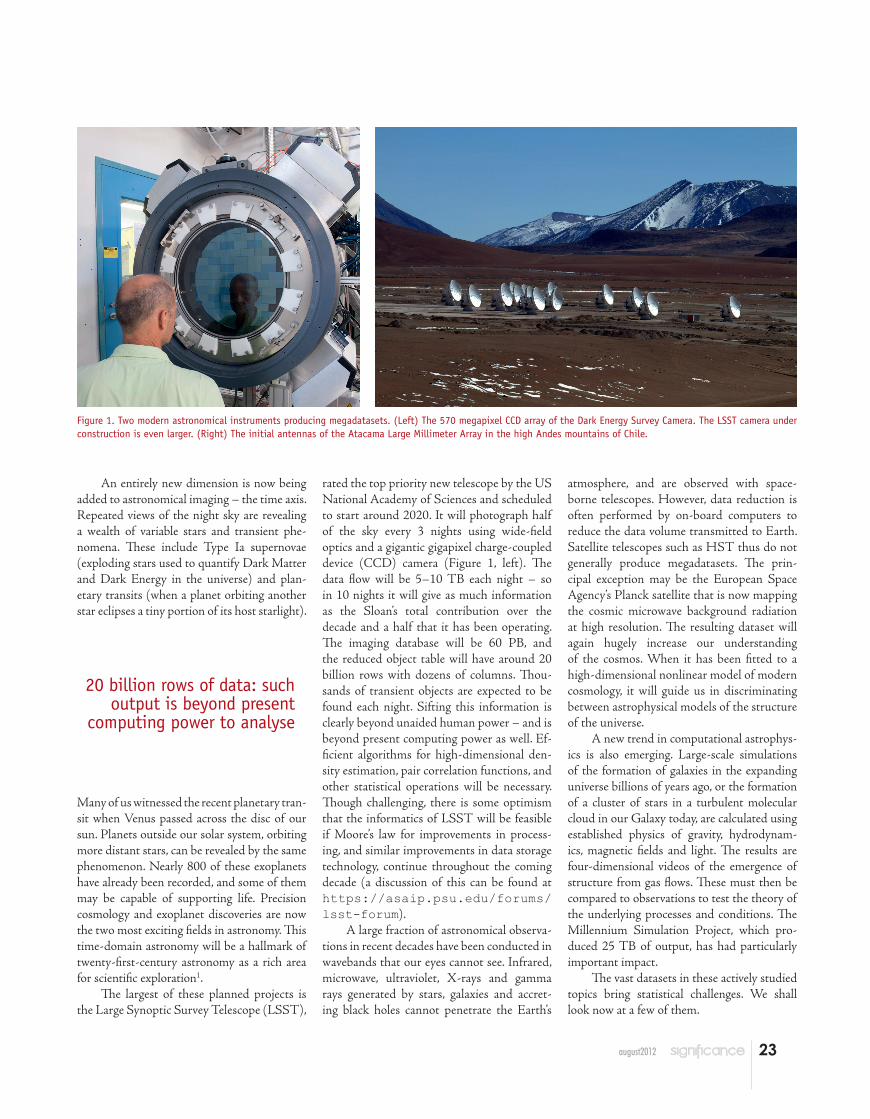
A new trend in computational astrophys-ics is also emerging. Large-scale simulations of the formation of galaxies in the expanding universe billions of years ago, or the formation of a cluster of stars in a turbulent molecular cloud in our Galaxy today, are calculated using established physics of gravity, hydrodynam-ics, magnetic fields and light. The results are four-dimensional videos of the emergence of structure from gas flows. These must then be compared to observations to test the theory of the underlying processes and conditions. The Millennium Simulation Project, which pro-duced 25 TB of output, has had particularly important impact.
The vast datasets in these actively studied topics bring statistical challenges. We shall look now at a few of them.
Figure 1. Two modern astronomical instruments producing megadatasets. (Left) The 570 megapixel CCD array of the Dark Energy Survey Camera. The LSST camera under construction is even larger. (Right) The initial antennas of the Atacama Large Millimeter Array in the high Andes mountains of Chile.
20 billion rows of data: such output is beyond present
computing power to analyse
24 august2012
Datacubes of the sky
Just as spectra of visible light emission of ce-lestial objects reveal the atomic universe and hot gas like the surfaces of stars, radio and millimetre spectra reveal the cooler molecu-lar universe. Today we are recognising that molecules, particularly organic monomers such as alcohols and aldehydes, are wide-spread throughout the universe (http://astrochymist.org). Astrochemistry is an essential link for understanding the origin of life on Earth and its possible emergence on planets orbiting other stars.
Innovations in various technologies are leading to order-of-magnitude improvements in sensitivities and throughput from metre to sub-millimetre wavelengths (see box). Their output is often in the form of datacubes (im-ages in three or more dimensions, with time, wavelength or other variables as one of the dimensions); Figure 2 is a two-dimensional slice of a four-dimensional datacube2.
Most celestial objects are faint, and as-tronomers are always struggling with source detection near the noise limit. These datacubes are non-Gaussian and have sub-populations with differing degrees of variability; which
makes identifying faint structures within them a monumental needle-in-a-haystack problem. As even a single datacube provides billions of opportunities to detect sources, there is ample opportunity for confusing faint sources with peaks in background noise. False detection rates must be understood and controlled.
Statistical signal detection must be combined with effective datacube visualisation for sci-entific validation and interpretation. Few of these methodologies are in place today: the successful construction of new telescopes does not by itself ensure discovery of new phenom-ena without tackling the ensuing statistical challenges.
Flashes in the sky
As mentioned above, many datacubes in as-tronomy have time, rather than frequency of light, as the third dimension. In this sense, they
Figure 2. A two-dimensional slice of a portion of the four-dimensional movie of the Millennium Simulation of galaxy formation in the expanding universe2
The US NSF-funded National Radio Astronomy Observatory (NRAO) has just completed the upgrade of the Jansky Very Large Array (JVLA) in New Mexico and, together with the European Southern Observatory and East Asian nations, NRAO is now constructing the Atacama Large Millimeter Array (ALMA) in Chile (Figure 1, right). The data come in the form of Fourier components of the sky brightness distribution extracted from the correlated signals of dozens of paraboloid antennas. With computationally intensive Fourier transforms and high-dimensional statistical modelling, these data are converted into a three-dimensional hyperspectral image, known as a datacube. The new JVLA and ALMA correlators can produce 10–100 GB datacubes with images of 1–10 million pixels across a region of the sky at 1000–10 000 frequency channels several times a day. Over a decade, ALMA will produce petabytes of datacubes.
The scientific analysis requires the identification and characterisation of radio emitting struc-tures in these datacubes. The noise is messy: stripes or rings may be present from inadequate modelling of the Fourier data; spatial autocorrelation in the spatial (but not spectral) dimension is present; and the distribution is non-Gaussian with heavy tails. A variety of structures are sought: tubes of emission from continuous sources present in all channels, irregular clouds at particularly wavelengths associated with molecular quantum transitions, and isolated lines from unknown galaxies or intergalactic gaseous structures. Normal mixture models (the astronomers have a version called GaussClumps), active contours, and other methods can be used to charac-terise relatively bright regions.
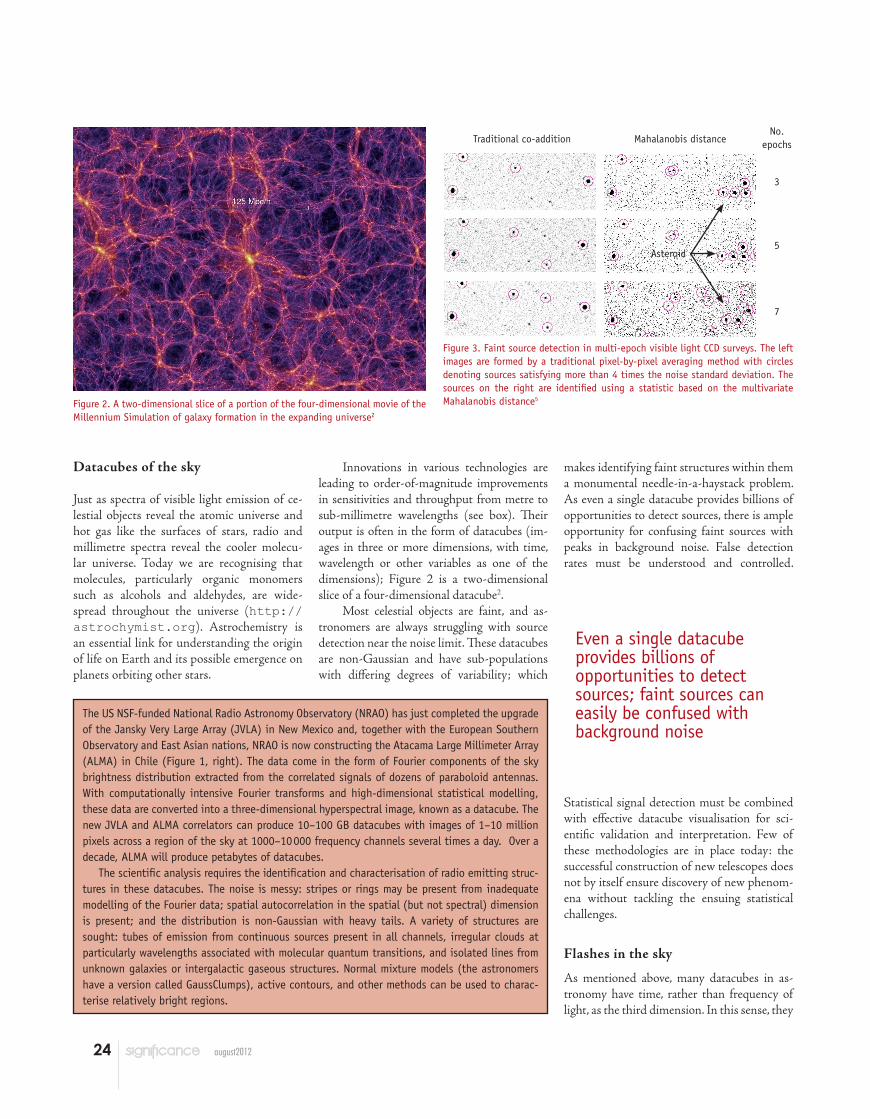
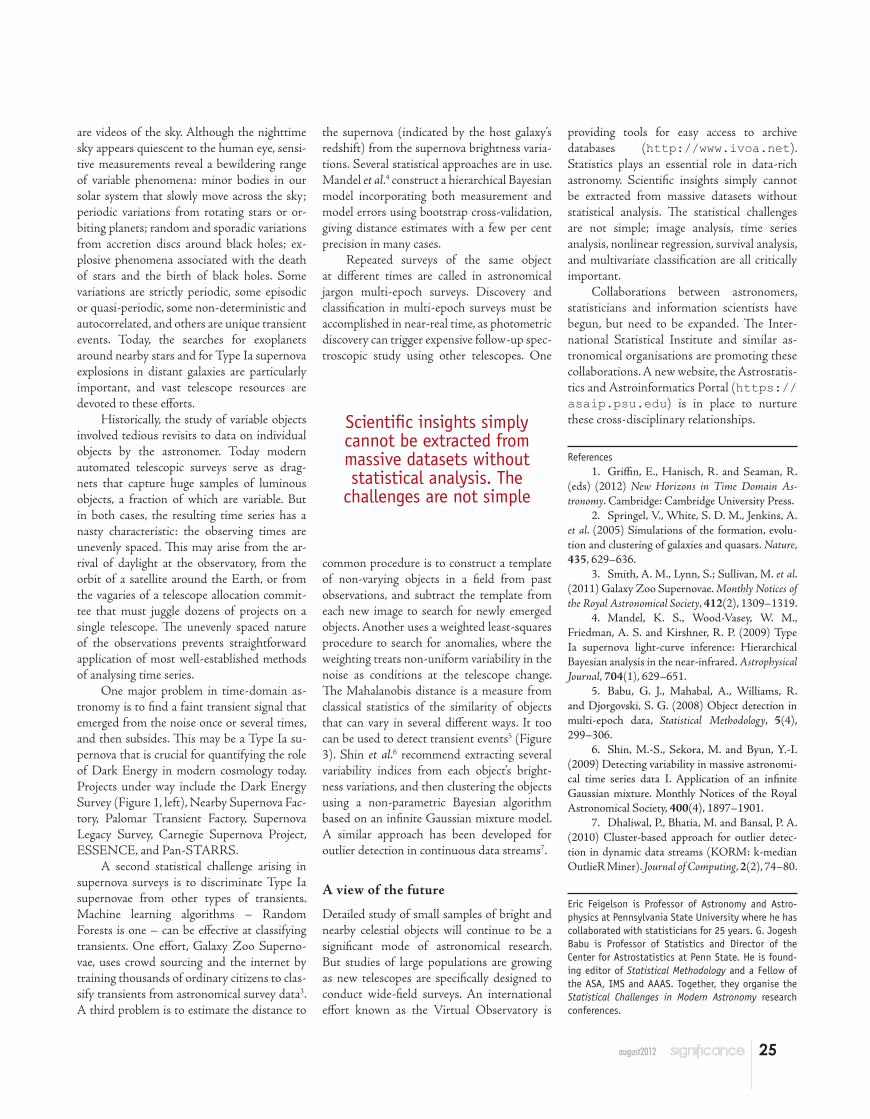
Figure 3. Faint source detection in multi-epoch visible light CCD surveys. The left images are formed by a traditional pixel-by-pixel averaging method with circles denoting sources satisfying more than 4 times the noise standard deviation. The sources on the right are identified using a statistic based on the multivariate Mahalanobis distance5
Even a single datacube provides billions of opportunities to detect sources; faint sources can easily be confused with background noise
Traditional co-addition Mahalanobis distanceNo.
epochs
3
5
7
Asteroid
25august2012
are videos of the sky. Although the nighttime sky appears quiescent to the human eye, sensi-tive measurements reveal a bewildering range of variable phenomena: minor bodies in our solar system that slowly move across the sky; periodic variations from rotating stars or or-biting planets; random and sporadic variations from accretion discs around black holes; ex-plosive phenomena associated with the death of stars and the birth of black holes. Some variations are strictly periodic, some episodic or quasi-periodic, some non-deterministic and autocorrelated, and others are unique transient events. Today, the searches for exoplanets around nearby stars and for Type Ia supernova explosions in distant galaxies are particularly important, and vast telescope resources are devoted to these efforts.
Historically, the study of variable objects involved tedious revisits to data on individual objects by the astronomer. Today modern automated telescopic surveys serve as drag-nets that capture huge samples of luminous objects, a fraction of which are variable. But in both cases, the resulting time series has a nasty characteristic: the observing times are unevenly spaced. This may arise from the ar-rival of daylight at the observatory, from the orbit of a satellite around the Earth, or from the vagaries of a telescope allocation commit-tee that must juggle dozens of projects on a single telescope. The unevenly spaced nature of the observations prevents straightforward application of most well-established methods of analysing time series.
One major problem in time-domain as-tronomy is to find a faint transient signal that emerged from the noise once or several times, and then subsides. This may be a Type Ia su-pernova that is crucial for quantifying the role of Dark Energy in modern cosmology today. Projects under way include the Dark Energy Survey (Figure 1, left), Nearby Supernova Fac-tory, Palomar Transient Factory, Supernova Legacy Survey, Carnegie Supernova Project, ESSENCE, and Pan-STARRS.
A second statistical challenge arising in supernova surveys is to discriminate Type Ia supernovae from other types of transients. Machine learning algorithms – Random Forests is one – can be effective at classifying transients. One effort, Galaxy Zoo Superno-vae, uses crowd sourcing and the internet by training thousands of ordinary citizens to clas-sify transients from astronomical survey data3. A third problem is to estimate the distance to
the supernova (indicated by the host galaxy’s redshift) from the supernova brightness varia-tions. Several statistical approaches are in use. Mandel et al.4 construct a hierarchical Bayesian model incorporating both measurement and model errors using bootstrap cross-validation, giving distance estimates with a few per cent precision in many cases.
Repeated surveys of the same object at different times are called in astronomical jargon multi-epoch surveys. Discovery and classification in multi-epoch surveys must be accomplished in near-real time, as photometric discovery can trigger expensive follow-up spec-troscopic study using other telescopes. One
common procedure is to construct a template of non-varying objects in a field from past observations, and subtract the template from each new image to search for newly emerged objects. Another uses a weighted least-squares procedure to search for anomalies, where the weighting treats non-uniform variability in the noise as conditions at the telescope change. The Mahalanobis distance is a measure from classical statistics of the similarity of objects that can vary in several different ways. It too can be used to detect transient events5 (Figure 3). Shin et al.6 recommend extracting several variability indices from each object’s bright-ness variations, and then clustering the objects using a non-parametric Bayesian algorithm based on an infinite Gaussian mixture model. A similar approach has been developed for outlier detection in continuous data streams7.
A view of the future
Detailed study of small samples of bright and nearby celestial objects will continue to be a significant mode of astronomical research. But studies of large populations are growing as new telescopes are specifically designed to conduct wide-field surveys. An international effort known as the Virtual Observatory is
providing tools for easy access to archive databases (http://www.ivoa.net). Statistics plays an essential role in data-rich astronomy. Scientific insights simply cannot be extracted from massive datasets without statistical analysis. The statistical challenges are not simple; image analysis, time series analysis, nonlinear regression, survival analysis, and multivariate classification are all critically important.
Collaborations between astronomers, statisticians and information scientists have begun, but need to be expanded. The Inter-national Statistical Institute and similar as-tronomical organisations are promoting these collaborations. A new website, the Astrostatis-tics and Astroinformatics Portal (https://asaip.psu.edu) is in place to nurture these cross-disciplinary relationships.
References1. Griffin, E., Hanisch, R. and Seaman, R.
(eds) (2012) New Horizons in Time Domain As-tronomy. Cambridge: Cambridge University Press.
2. Springel, V., White, S. D. M., Jenkins, A. et al. (2005) Simulations of the formation, evolu-tion and clustering of galaxies and quasars. Nature, 435, 629–636.
3. Smith, A. M., Lynn, S.; Sullivan, M. et al. (2011) Galaxy Zoo Supernovae. Monthly Notices of the Royal Astronomical Society, 412(2), 1309–1319.
4. Mandel, K. S., Wood-Vasey, W. M., Friedman, A. S. and Kirshner, R. P. (2009) Type Ia supernova light-curve inference: Hierarchical Bayesian analysis in the near-infrared. Astrophysical Journal, 704(1), 629–651.
5. Babu, G. J., Mahabal, A., Williams, R. and Djorgovski, S. G. (2008) Object detection in multi-epoch data, Statistical Methodology, 5(4), 299–306.
6. Shin, M.-S., Sekora, M. and Byun, Y.-I. (2009) Detecting variability in massive astronomi-cal time series data I. Application of an infinite Gaussian mixture. Monthly Notices of the Royal Astronomical Society, 400(4), 1897–1901.
7. Dhaliwal, P., Bhatia, M. and Bansal, P. A. (2010) Cluster-based approach for outlier detec-tion in dynamic data streams (KORM: k-median OutlieR Miner). Journal of Computing, 2(2), 74–80.
Eric Feigelson is Professor of Astronomy and Astro-physics at Pennsylvania State University where he has collaborated with statisticians for 25 years. G. Jogesh Babu is Professor of Statistics and Director of the Center for Astrostatistics at Penn State. He is found-ing editor of Statistical Methodology and a Fellow of the ASA, IMS and AAAS. Together, they organise the Statistical Challenges in Modern Astronomy research conferences.
Scientific insights simply cannot be extracted from massive datasets without statistical analysis. The
challenges are not simple