Embed Size (px)
Citation preview
Big Data doesn’t have to meanHadoop: Using SQL to easily solveBig Data challenges
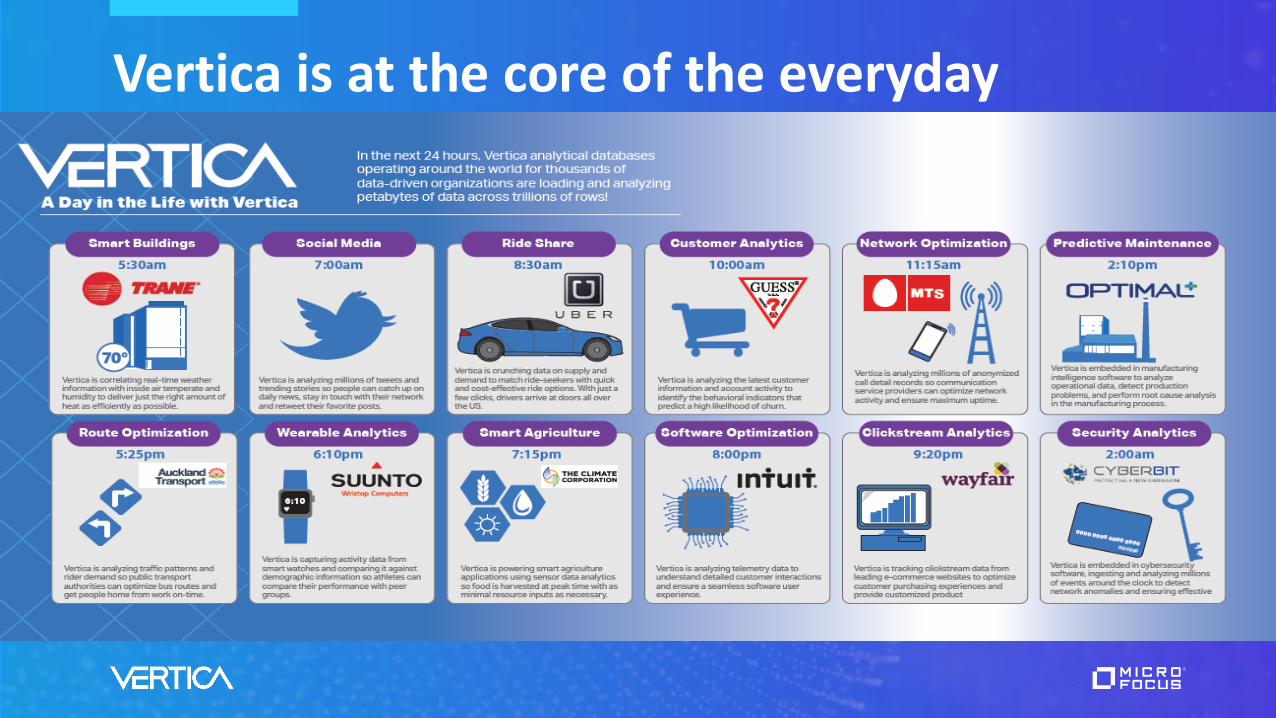
Vertica is at the core of the everyday
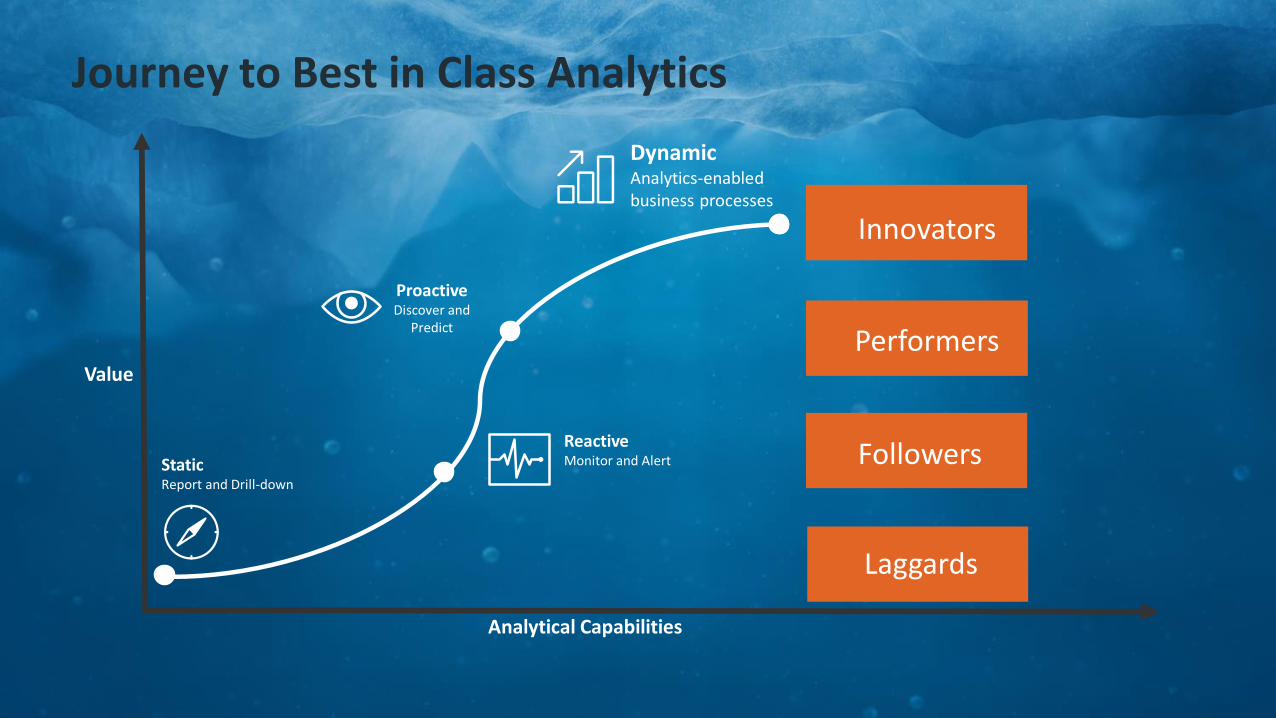
Analytical Capabilities
Journey to Best in Class Analytics
Value
ProactiveDiscover and
Predict
Performers
ReactiveMonitor and Alert FollowersStatic
Report and Drill-down
Laggards
DynamicAnalytics-enabled business processes
Innovators

1. Log everything2. Analyze everything3. Sample Size = ∞4. Segmentation = me
Lessons from Big Data leaders
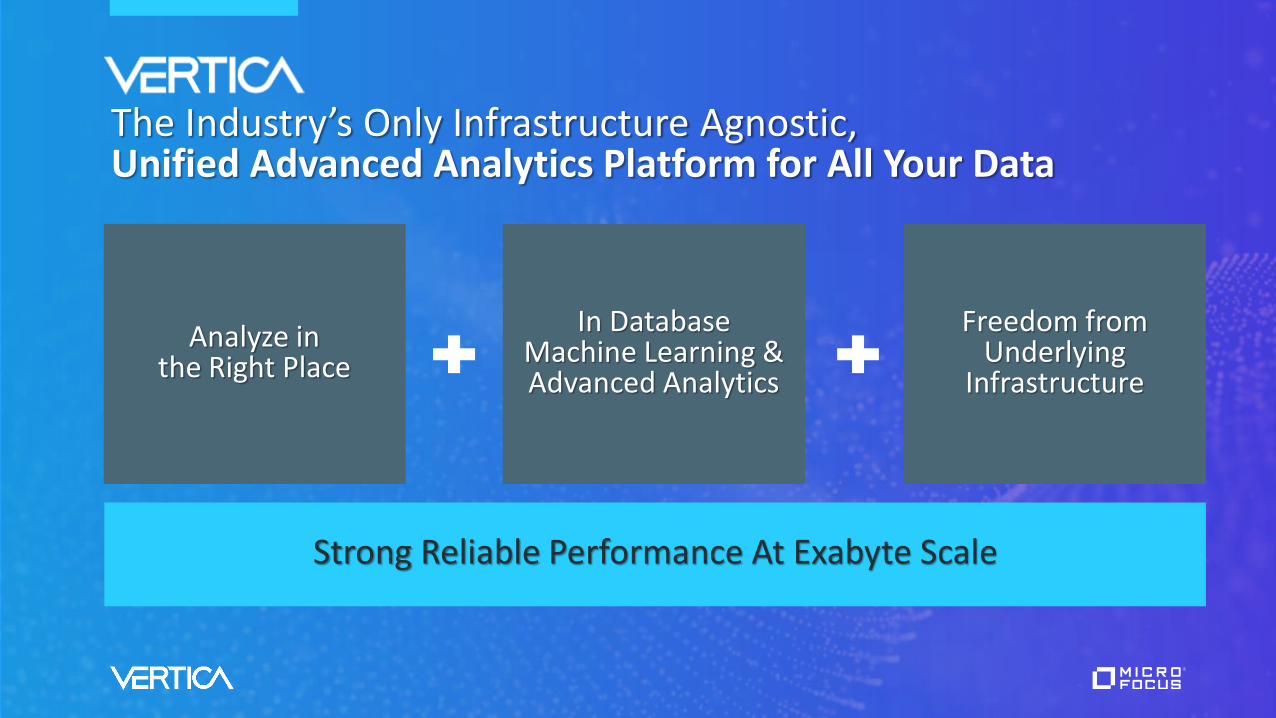
The Industry’s Only Infrastructure Agnostic, Unified Advanced Analytics Platform for All Your Data
Analyze in the Right Place
In Database Machine Learning & Advanced Analytics
Freedom from Underlying
Infrastructure
Strong Reliable Performance At Exabyte Scale
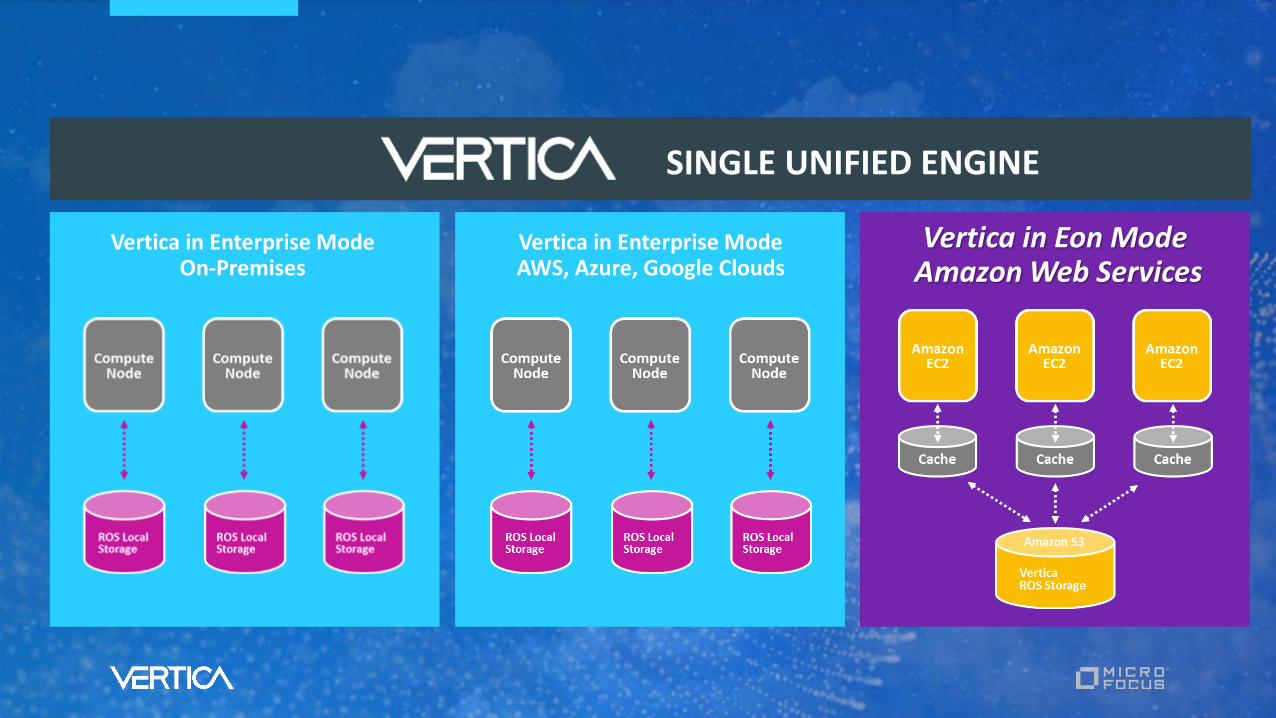
Vertica in Enterprise ModeOn-Premises
Vertica in Enterprise ModeAWS, Azure, Google Clouds
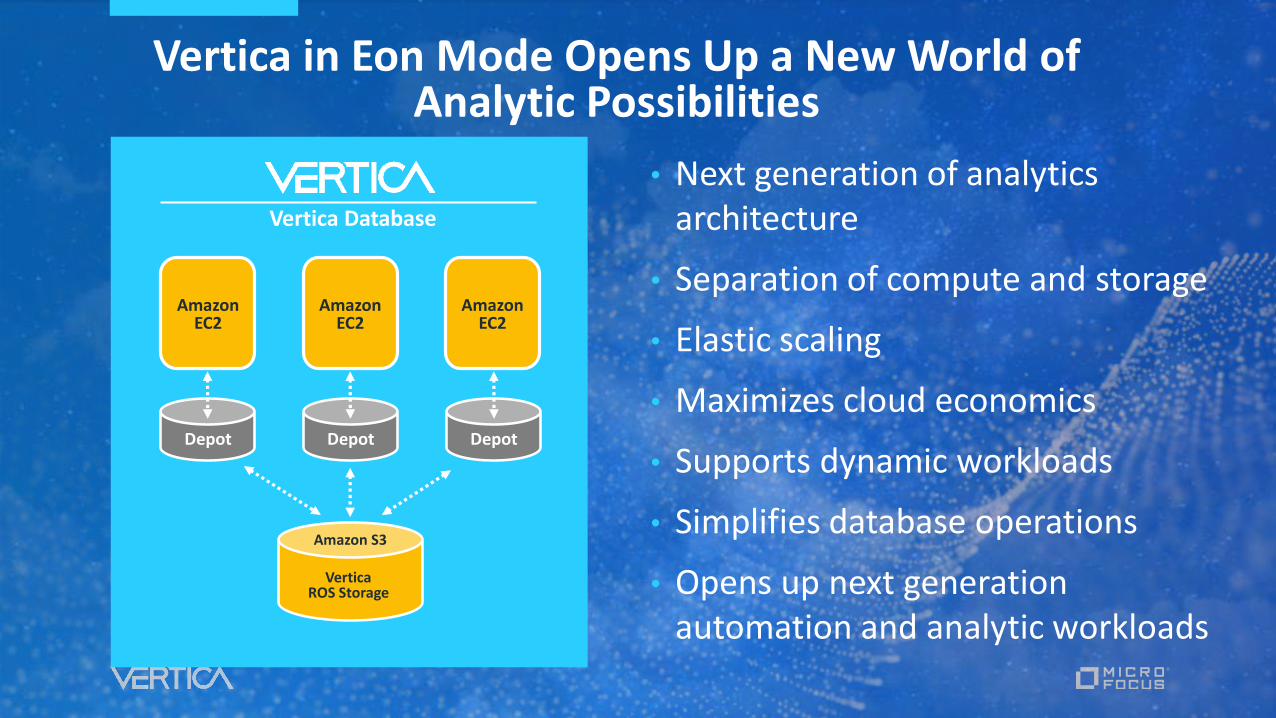
Vertica in Eon Mode Amazon Web Services
SINGLE UNIFIED ENGINE
Vertica Database
Vertica in Eon Mode Opens Up a New World of Analytic Possibilities
• Next generation of analytics architecture
• Separation of compute and storage
• Elastic scaling
• Maximizes cloud economics
• Supports dynamic workloads
• Simplifies database operations
• Opens up next generation automation and analytic workloads
Amazon S3
AmazonEC2
AmazonEC2
AmazonEC2
Depot Depot Depot
VerticaROS Storage
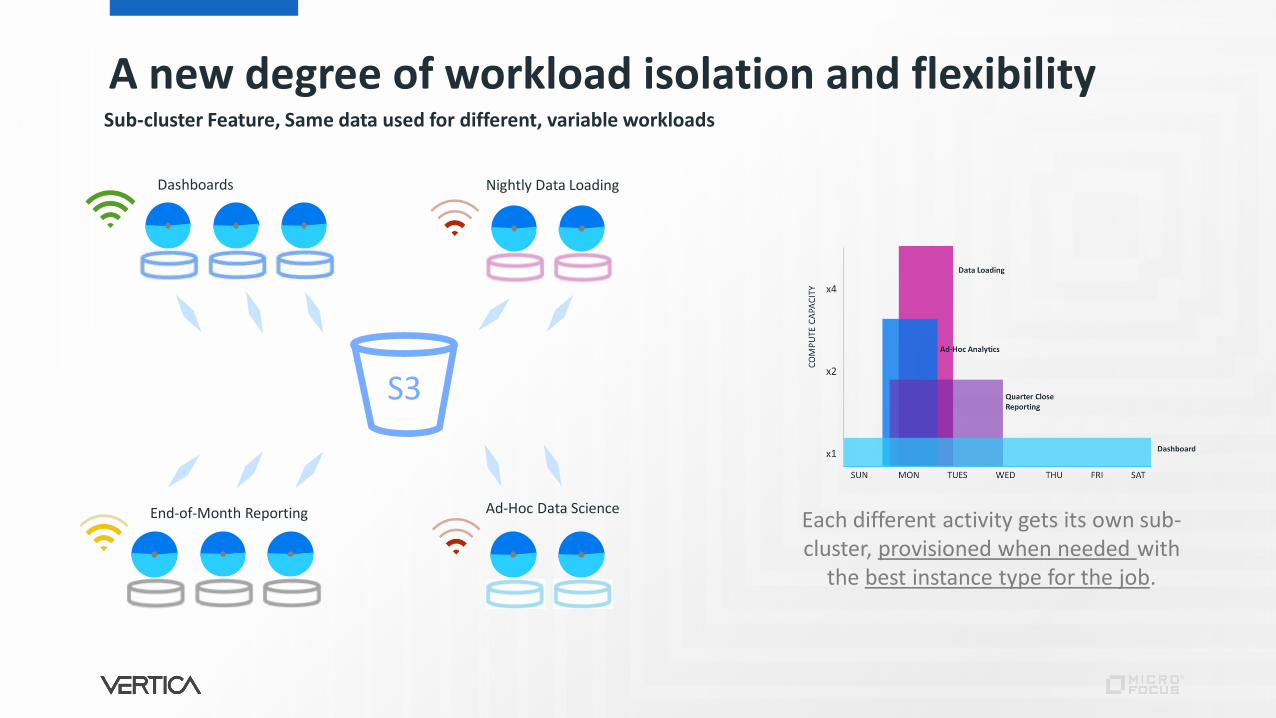
A new degree of workload isolation and flexibilitySub-cluster Feature, Same data used for different, variable workloads
Dashboards Nightly Data Loading
End-of-Month Reporting Ad-Hoc Data Science
S3
Each different activity gets its own sub-cluster, provisioned when needed with
the best instance type for the job.
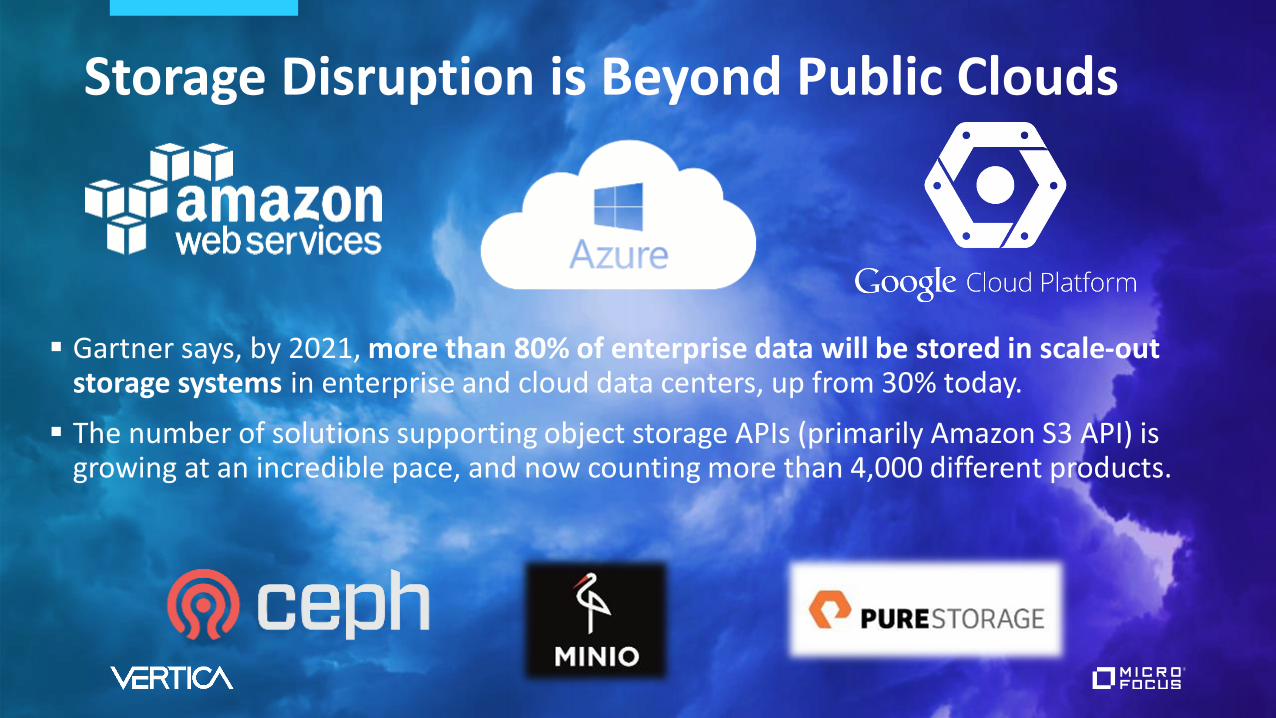
Storage Disruption is Beyond Public Clouds
Gartner says, by 2021, more than 80% of enterprise data will be stored in scale-out storage systems in enterprise and cloud data centers, up from 30% today.
The number of solutions supporting object storage APIs (primarily Amazon S3 API) is growing at an incredible pace, and now counting more than 4,000 different products.
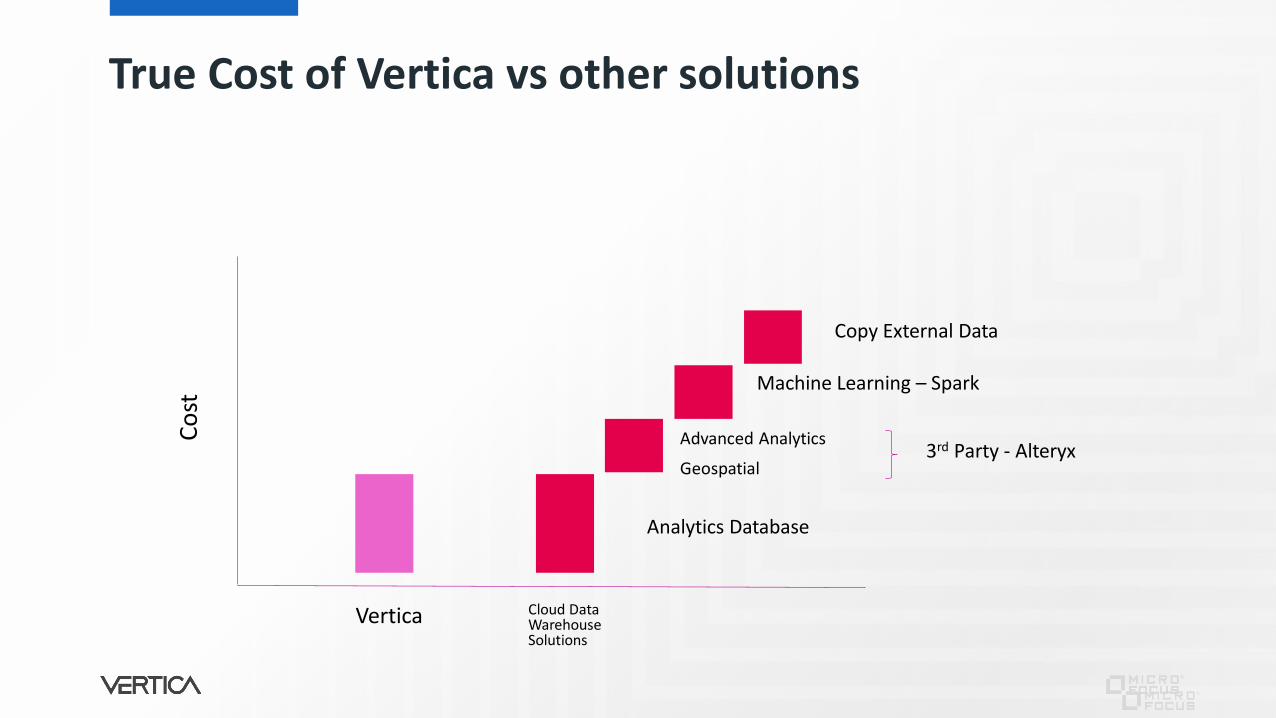
True Cost of Vertica vs other solutions
Co
st
Vertica Cloud DataWarehouseSolutions
Advanced Analytics
Geospatial
Machine Learning – Spark
3rd Party - Alteryx
Copy External Data
Analytics Database
BIG DATA
12
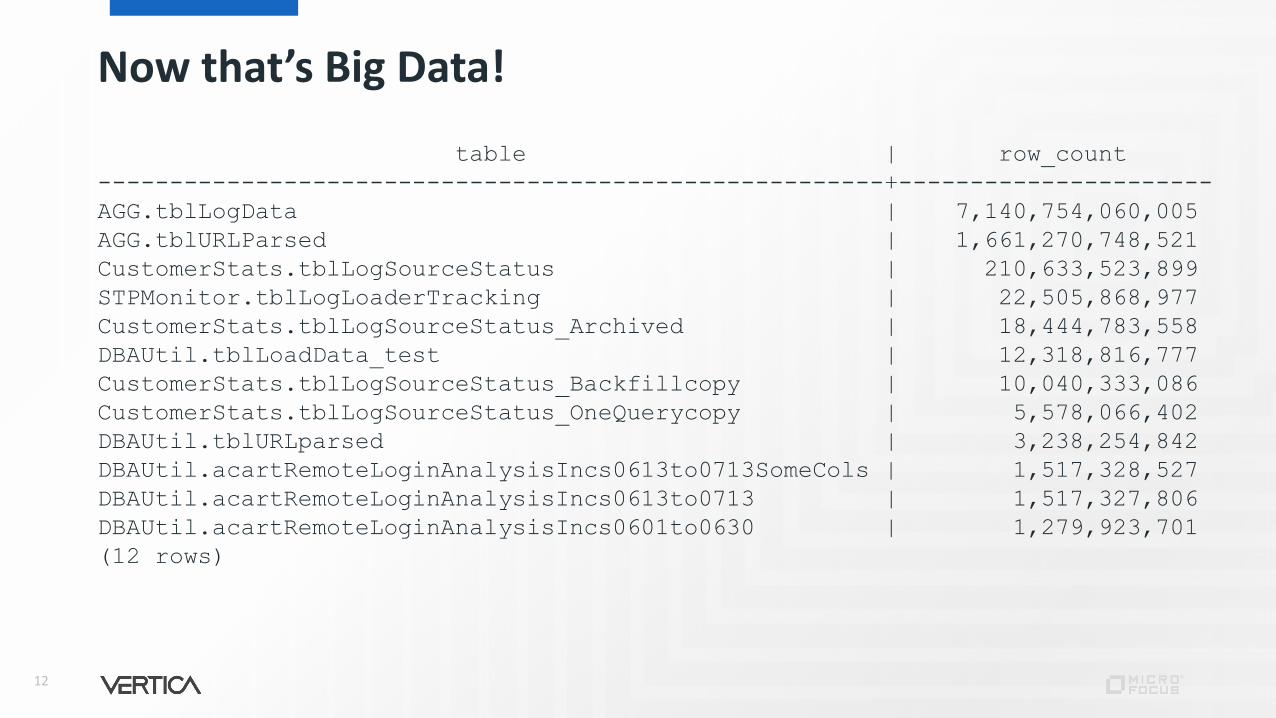
Now that’s Big Data!
table | row_count
-------------------------------------------------------+----------------------
AGG.tblLogData | 7,140,754,060,005
AGG.tblURLParsed | 1,661,270,748,521
CustomerStats.tblLogSourceStatus | 210,633,523,899
STPMonitor.tblLogLoaderTracking | 22,505,868,977
CustomerStats.tblLogSourceStatus_Archived | 18,444,783,558
DBAUtil.tblLoadData_test | 12,318,816,777
CustomerStats.tblLogSourceStatus_Backfillcopy | 10,040,333,086
CustomerStats.tblLogSourceStatus_OneQuerycopy | 5,578,066,402
DBAUtil.tblURLparsed | 3,238,254,842
DBAUtil.acartRemoteLoginAnalysisIncs0613to0713SomeCols | 1,517,328,527
DBAUtil.acartRemoteLoginAnalysisIncs0613to0713 | 1,517,327,806
DBAUtil.acartRemoteLoginAnalysisIncs0601to0630 | 1,279,923,701
(12 rows)

13
“Wait. What about Hadoop? I thought Hadoop was for Big Data?”
#SeizeTheData14
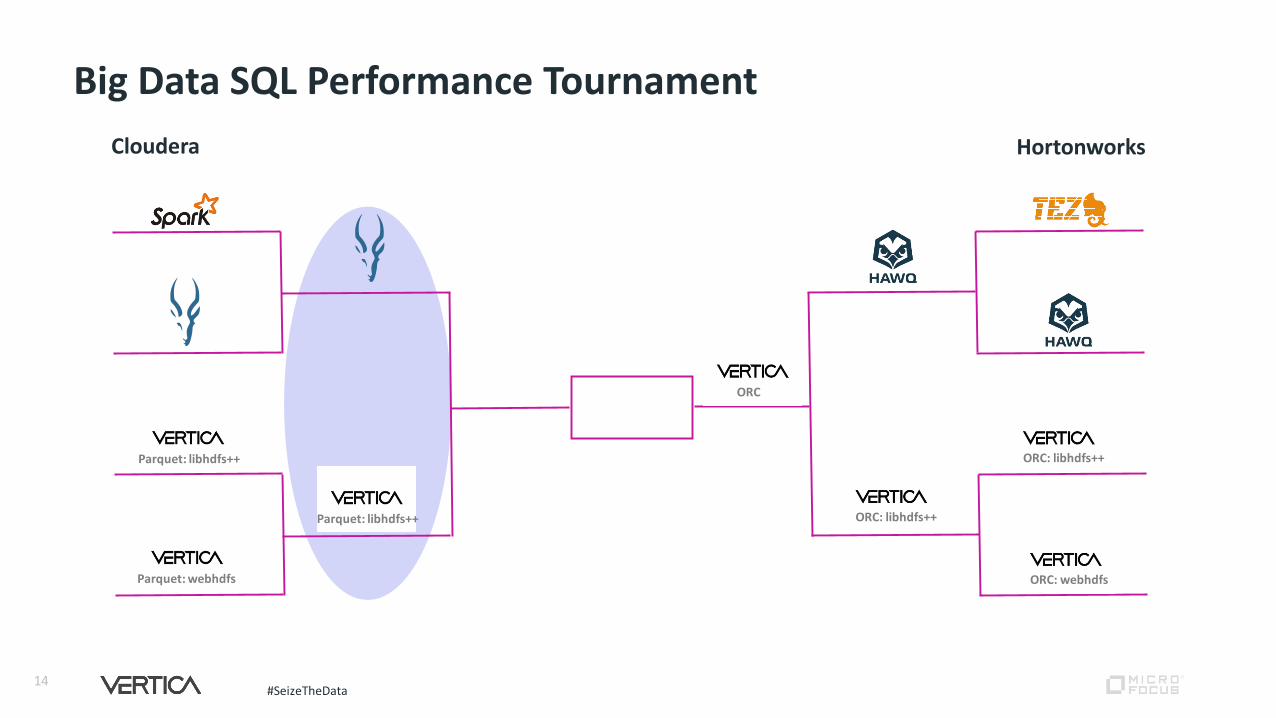
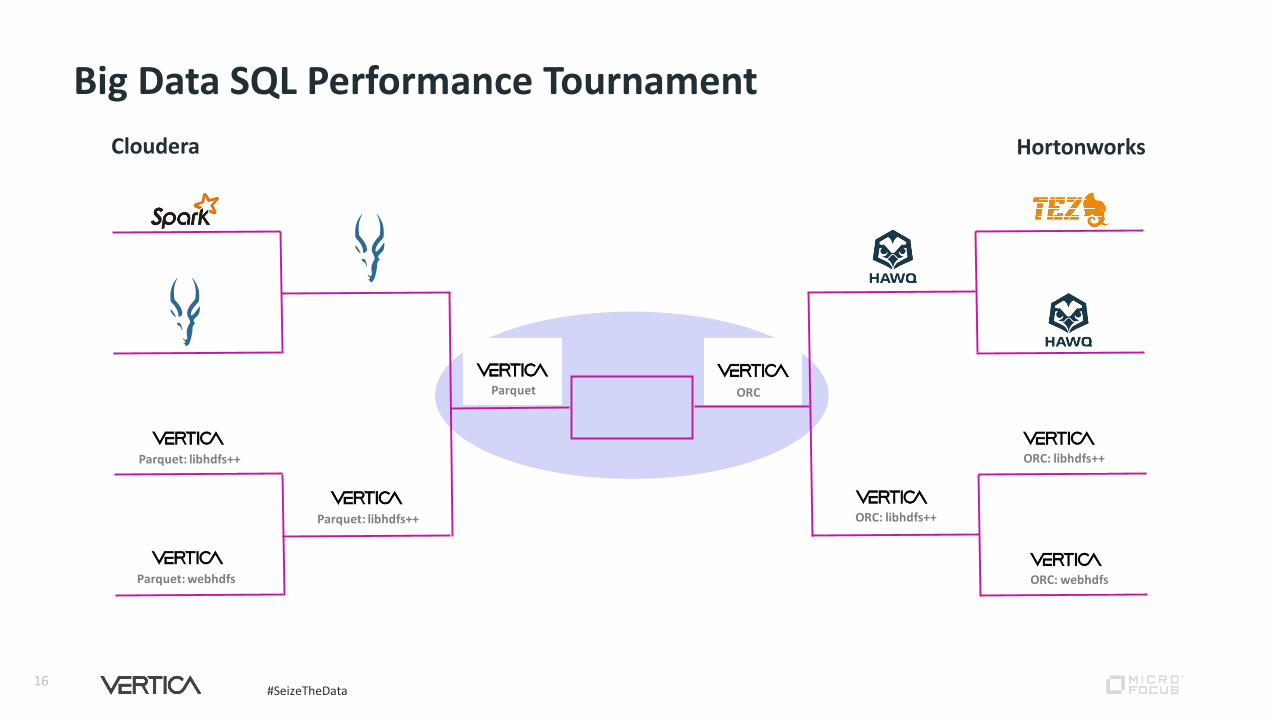
Big Data SQL Performance Tournament
Cloudera Hortonworks
Parquet: libhdfs++
Parquet: webhdfs
Parquet: libhdfs++
ORC
ORC: libhdfs++
ORC: libhdfs++
ORC: webhdfs
#SeizeTheData
0x
5x
10x
15x
20x
25x
30x
35x
15
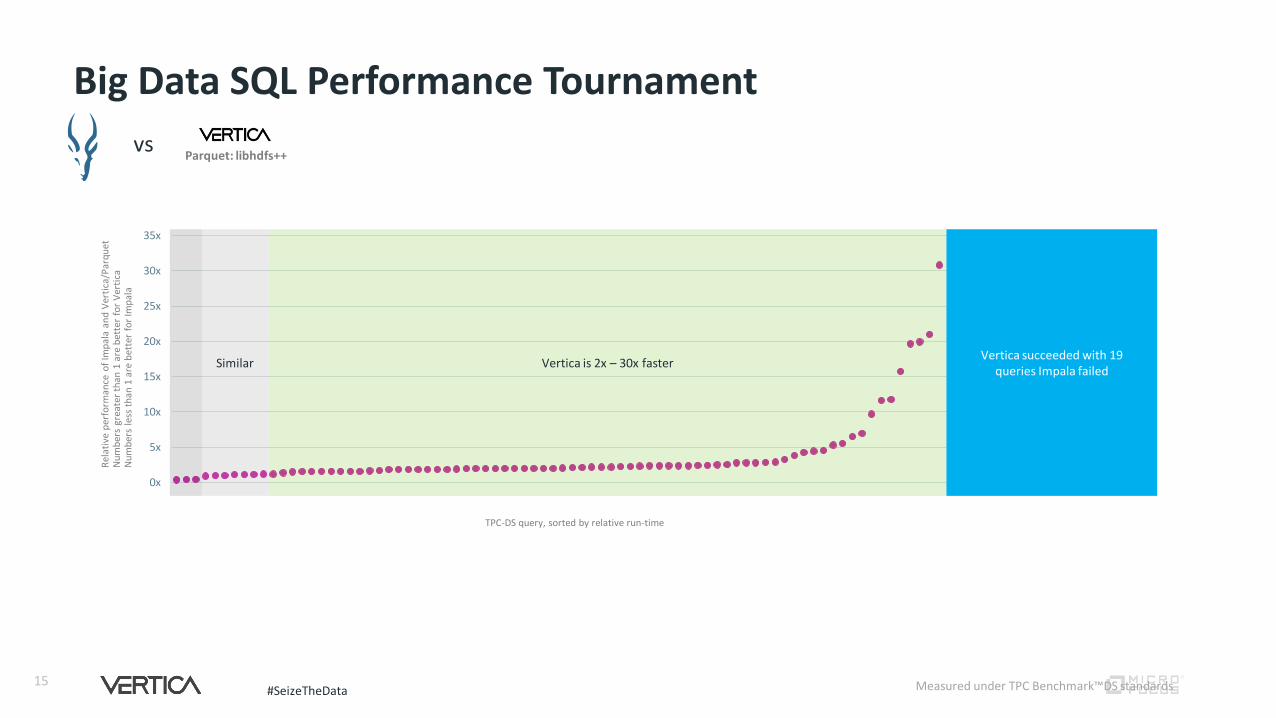
Big Data SQL Performance Tournament
vs
Vertica is 2x – 30x fasterSimilarVertica succeeded with 19
queries Impala failed
Measured under TPC Benchmark™DS standards
TPC-DS query, sorted by relative run-time
Rel
ativ
e p
erfo
rman
ce o
f Im
pal
a an
d V
erti
ca/P
arq
uet
Nu
mb
ers
grea
ter
than
1 a
re b
ette
r fo
r V
erti
caN
um
ber
s le
ss t
han
1 a
re b
ette
r fo
r Im
pal
a
Parquet: libhdfs++
#SeizeTheData16
Big Data SQL Performance Tournament
Cloudera Hortonworks
Parquet: libhdfs++
Parquet: webhdfs
Parquet: libhdfs++
ORC
ORC: libhdfs++
ORC: libhdfs++
ORC: webhdfs
Parquet
#SeizeTheData17
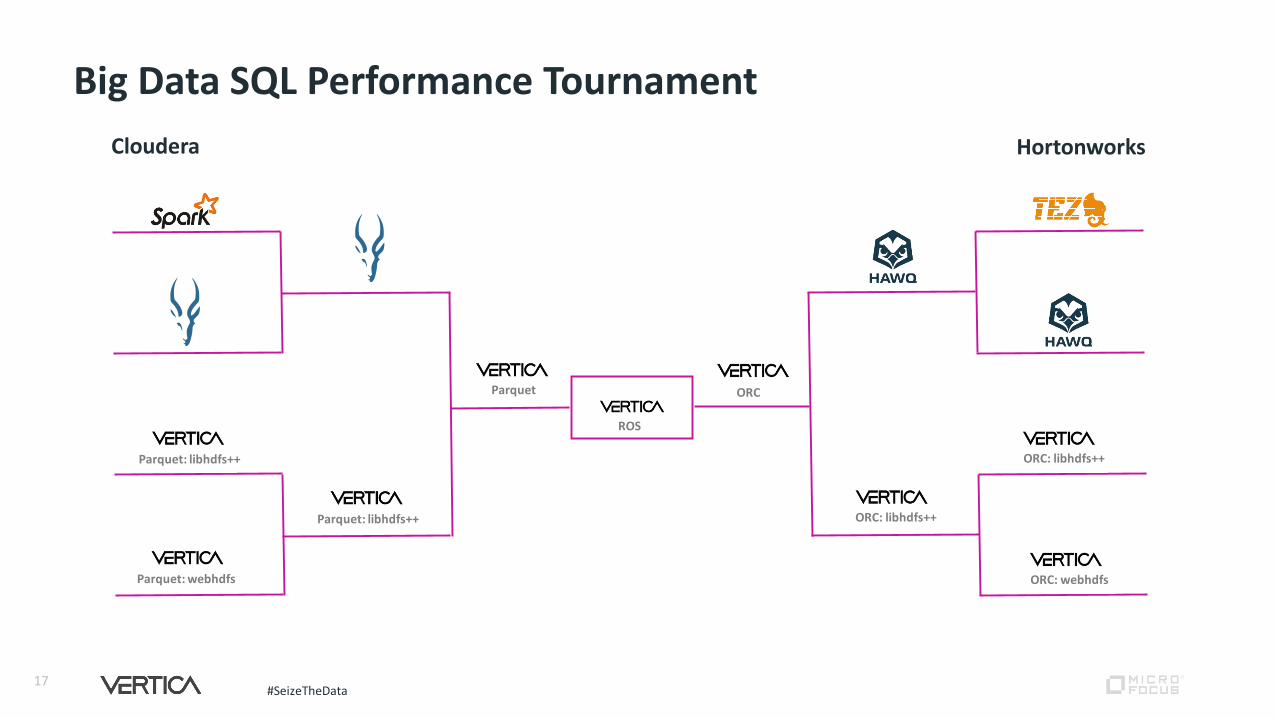
Big Data SQL Performance Tournament
Cloudera Hortonworks
Parquet: libhdfs++
Parquet: webhdfs
Parquet: libhdfs++
ORC
ORC: libhdfs++
ORC: libhdfs++
ORC: webhdfs
Parquet
ROS
#SeizeTheData18
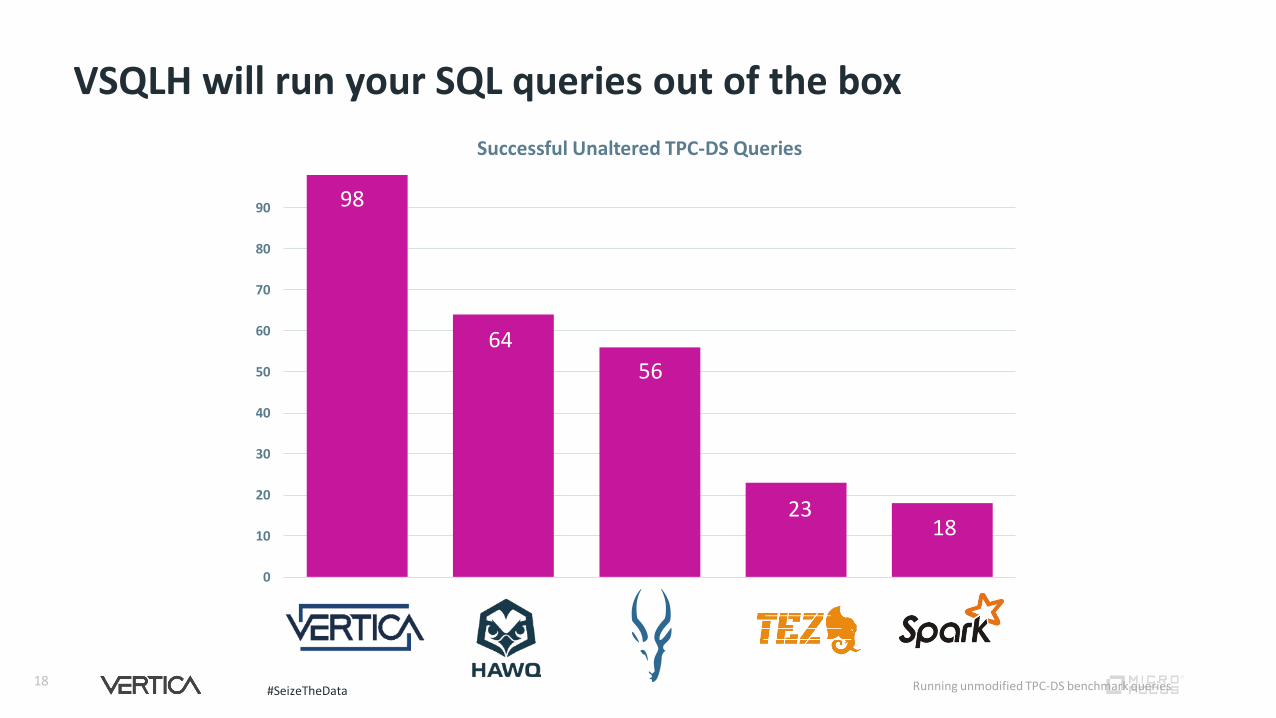
VSQLH will run your SQL queries out of the box
0
10
20
30
40
50
60
70
80
90
Successful Unaltered TPC-DS Queries
56
2318
98
64
Running unmodified TPC-DS benchmark queries

Pattern Matching

You are Groupon.com
“I want to find customers that were referred to us by Twitter, who purchased something other than the thing they were referred to.”
PROBLEM

21
“I also want to know how many items they viewed, which item they were referred to, which item(s) they bought, and who referred them.”
1
n
n
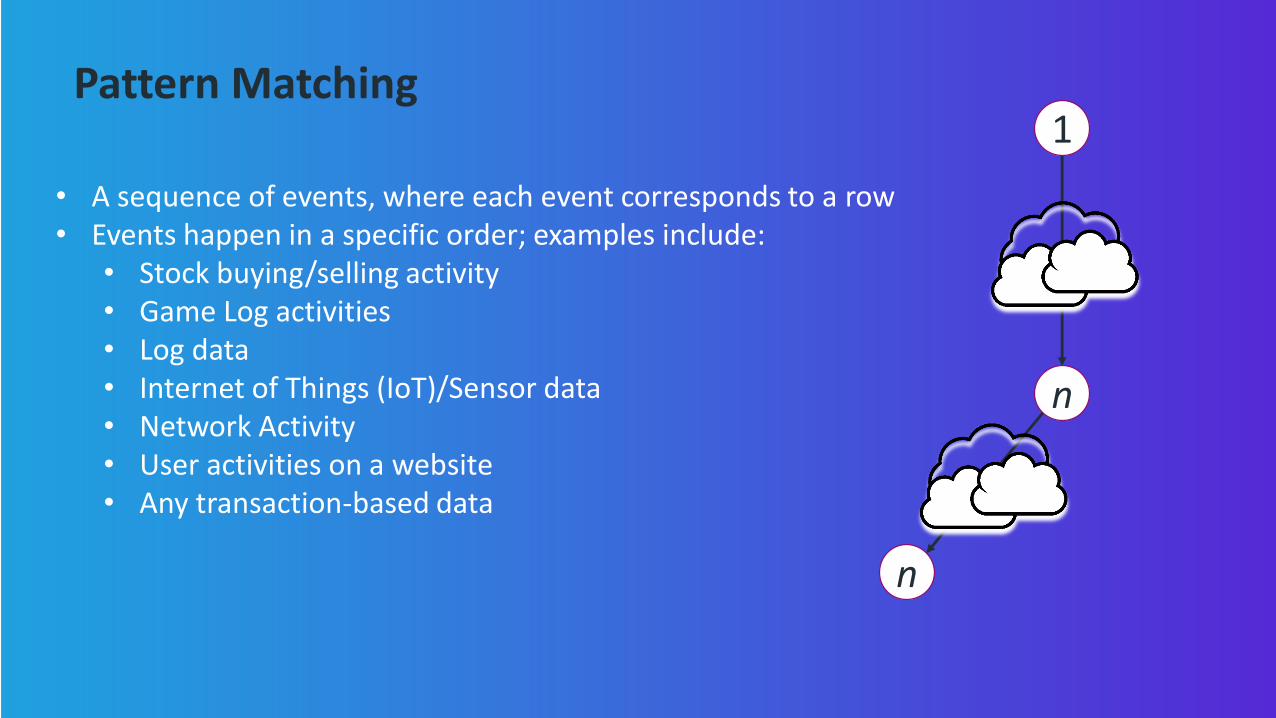
Pattern Matching
• A sequence of events, where each event corresponds to a row• Events happen in a specific order; examples include:
• Stock buying/selling activity• Game Log activities• Log data• Internet of Things (IoT)/Sensor data• Network Activity• User activities on a website• Any transaction-based data
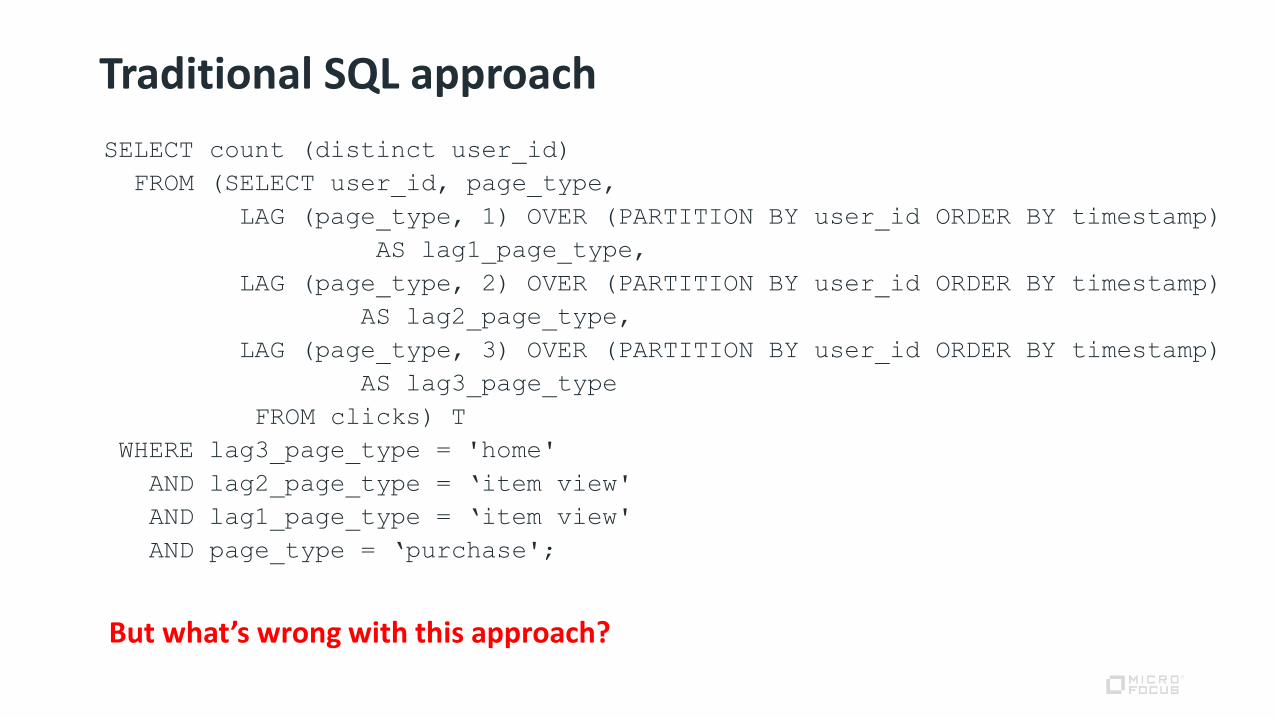
Traditional SQL approach
SELECT count (distinct user_id)
FROM (SELECT user_id, page_type,
LAG (page_type, 1) OVER (PARTITION BY user_id ORDER BY timestamp)
AS lag1_page_type,
LAG (page_type, 2) OVER (PARTITION BY user_id ORDER BY timestamp)
AS lag2_page_type,
LAG (page_type, 3) OVER (PARTITION BY user_id ORDER BY timestamp)
AS lag3_page_type
FROM clicks) T
WHERE lag3_page_type = 'home'
AND lag2_page_type = ‘item view'
AND lag1_page_type = ‘item view'
AND page_type = ‘purchase';
But what’s wrong with this approach?
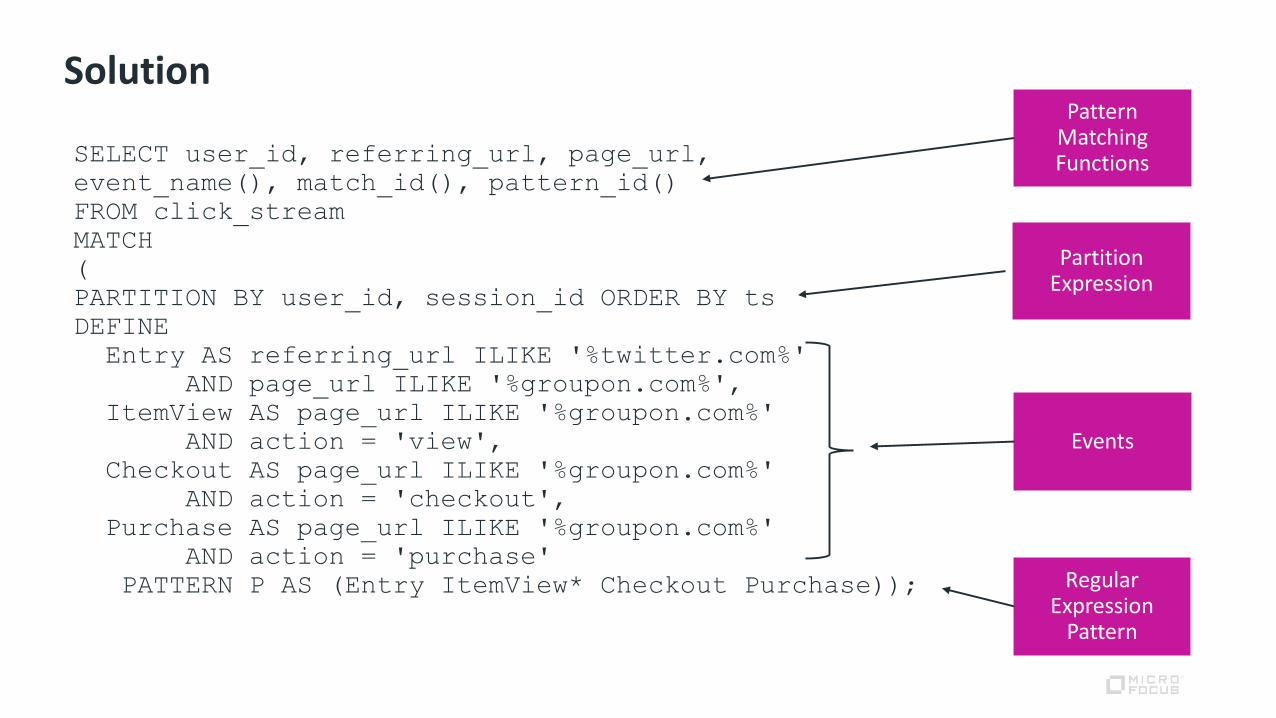
Solution
SELECT user_id, referring_url, page_url,
event_name(), match_id(), pattern_id()
FROM click_stream
MATCH
(
PARTITION BY user_id, session_id ORDER BY ts
DEFINE
Entry AS referring_url ILIKE '%twitter.com%'
AND page_url ILIKE '%groupon.com%',
ItemView AS page_url ILIKE '%groupon.com%'
AND action = 'view',
Checkout AS page_url ILIKE '%groupon.com%'
AND action = 'checkout',
Purchase AS page_url ILIKE '%groupon.com%'
AND action = 'purchase'
PATTERN P AS (Entry ItemView* Checkout Purchase)); Regular Expression
Pattern
Partition Expression
Events
Pattern Matching Functions
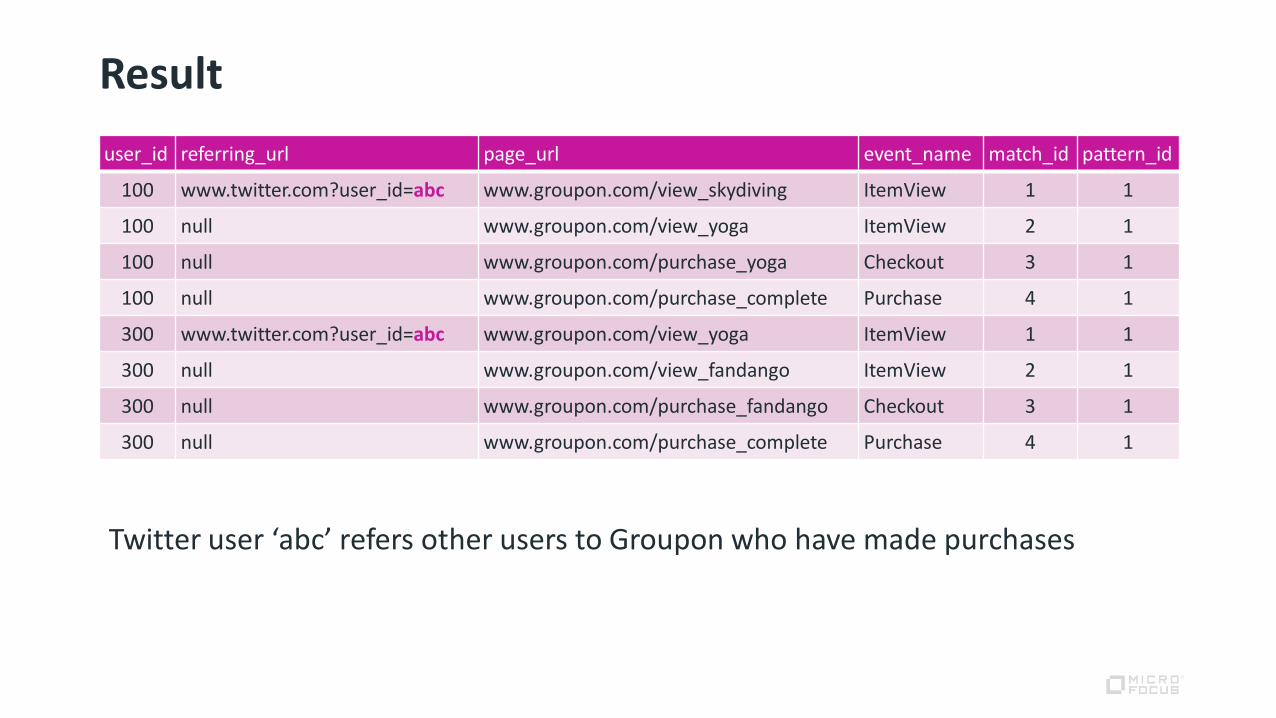
Result
user_id referring_url page_url event_name match_id pattern_id
100 www.twitter.com?user_id=abc www.groupon.com/view_skydiving ItemView 1 1
100 null www.groupon.com/view_yoga ItemView 2 1
100 null www.groupon.com/purchase_yoga Checkout 3 1
100 null www.groupon.com/purchase_complete Purchase 4 1
300 www.twitter.com?user_id=abc www.groupon.com/view_yoga ItemView 1 1
300 null www.groupon.com/view_fandango ItemView 2 1
300 null www.groupon.com/purchase_fandango Checkout 3 1
300 null www.groupon.com/purchase_complete Purchase 4 1
Twitter user ‘abc’ refers other users to Groupon who have made purchases

Machine Learning
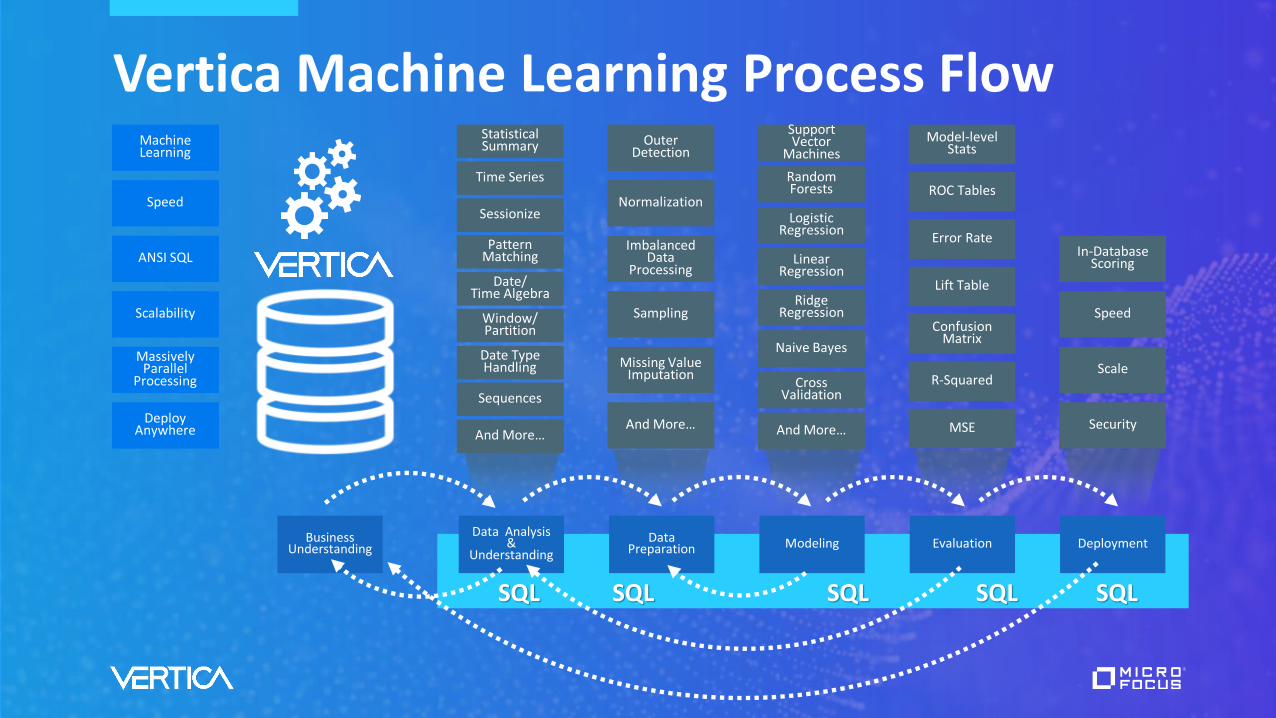
Business Understanding
Data Analysis &
UnderstandingData
Preparation Modeling Evaluation Deployment
Machine Learning
Speed
ANSI SQL
Scalability
Massively Parallel
Processing
Deploy Anywhere
Outer Detection
Normalization
ImbalancedData
Processing
Sampling
Missing Value Imputation
And More…
Support Vector
Machines
Random Forests
Logistic Regression
Linear Regression
Ridge Regression
Naive Bayes
Cross Validation
And More…
Model-level Stats
ROC Tables
Error Rate
Lift Table
Confusion Matrix
R-Squared
MSE
In-Database Scoring
Speed
Scale
Security
Pattern Matching
Date/Time Algebra
Window/Partition
Date Type Handling
Sequences
And More…
Sessionize
Time Series
Statistical Summary
SQL SQLSQL SQLSQL
Vertica Machine Learning Process Flow
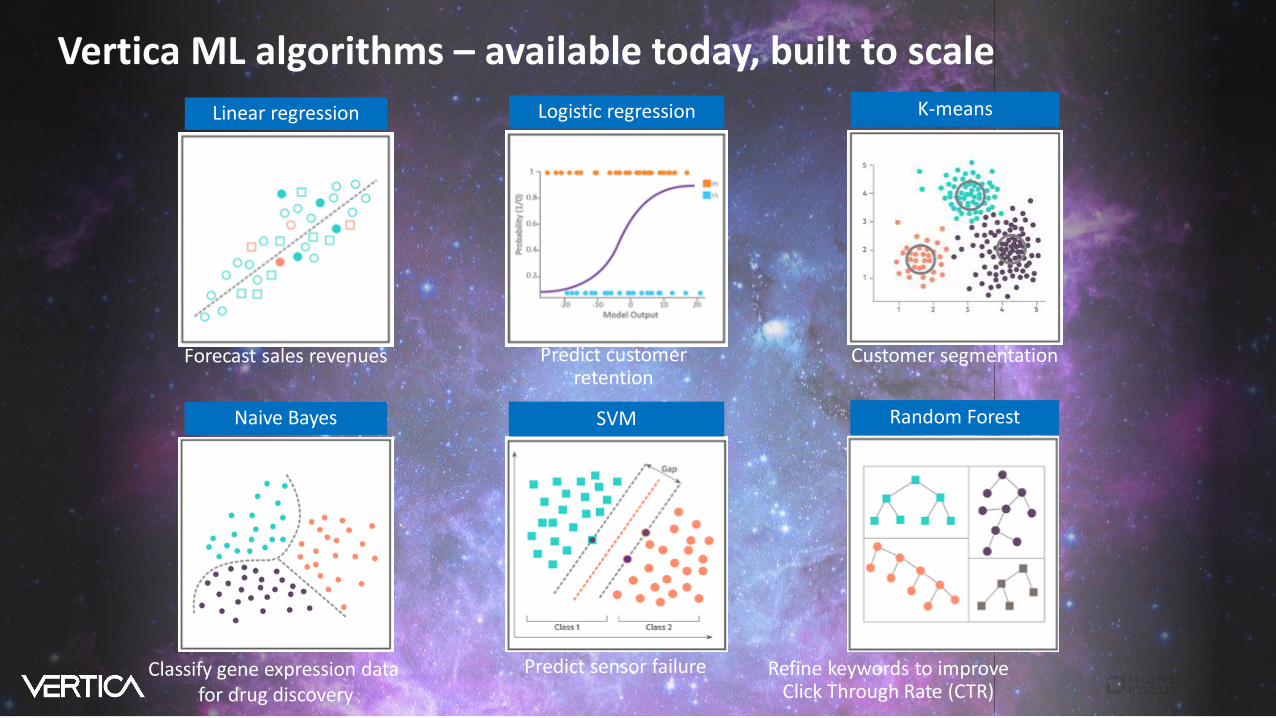
Vertica ML algorithms – available today, built to scale
Linear regression K-meansLogistic regression
Naive Bayes Random ForestSVM
Predict customer retention
Forecast sales revenues Customer segmentation
Predict sensor failureClassify gene expression datafor drug discovery
Refine keywords to improve Click Through Rate (CTR)
#SeizeTheData
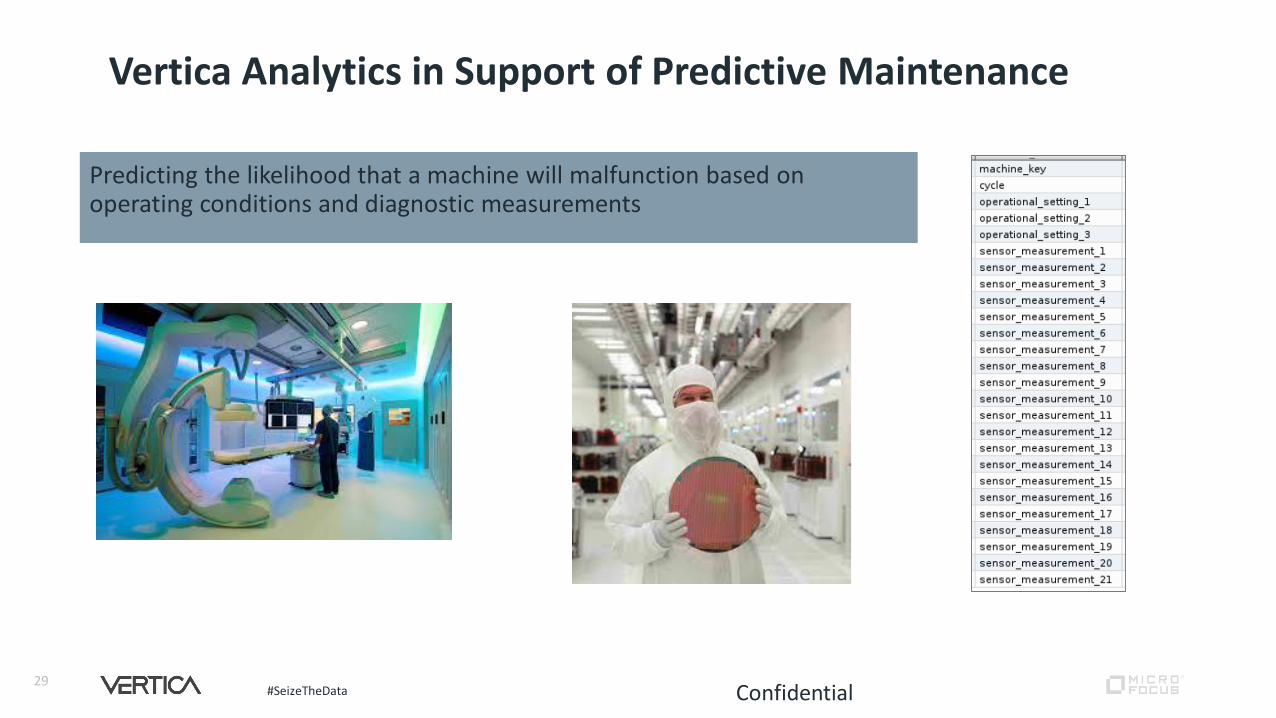
Vertica Analytics in Support of Predictive Maintenance
Predicting the likelihood that a machine will malfunction based on operating conditions and diagnostic measurements
29Confidential
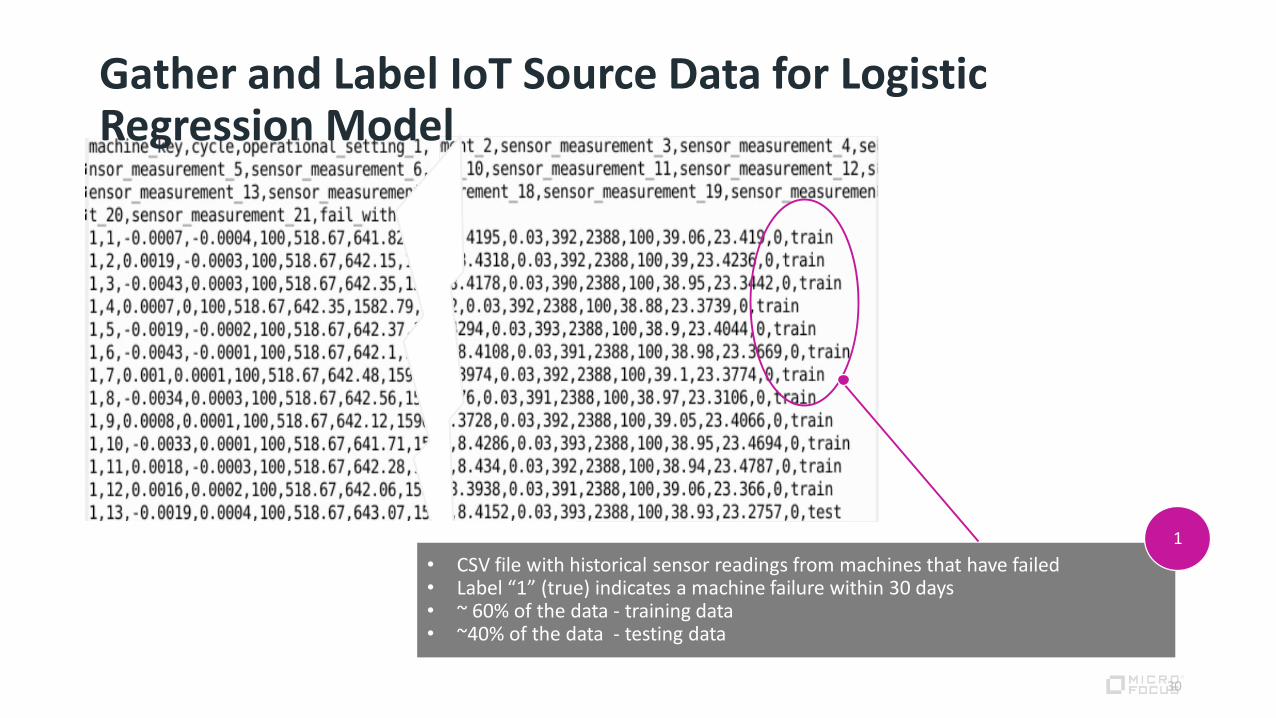
• CSV file with historical sensor readings from machines that have failed • Label “1” (true) indicates a machine failure within 30 days • ~ 60% of the data - training data • ~40% of the data - testing data
Gather and Label IoT Source Data for Logistic Regression Model
30
1
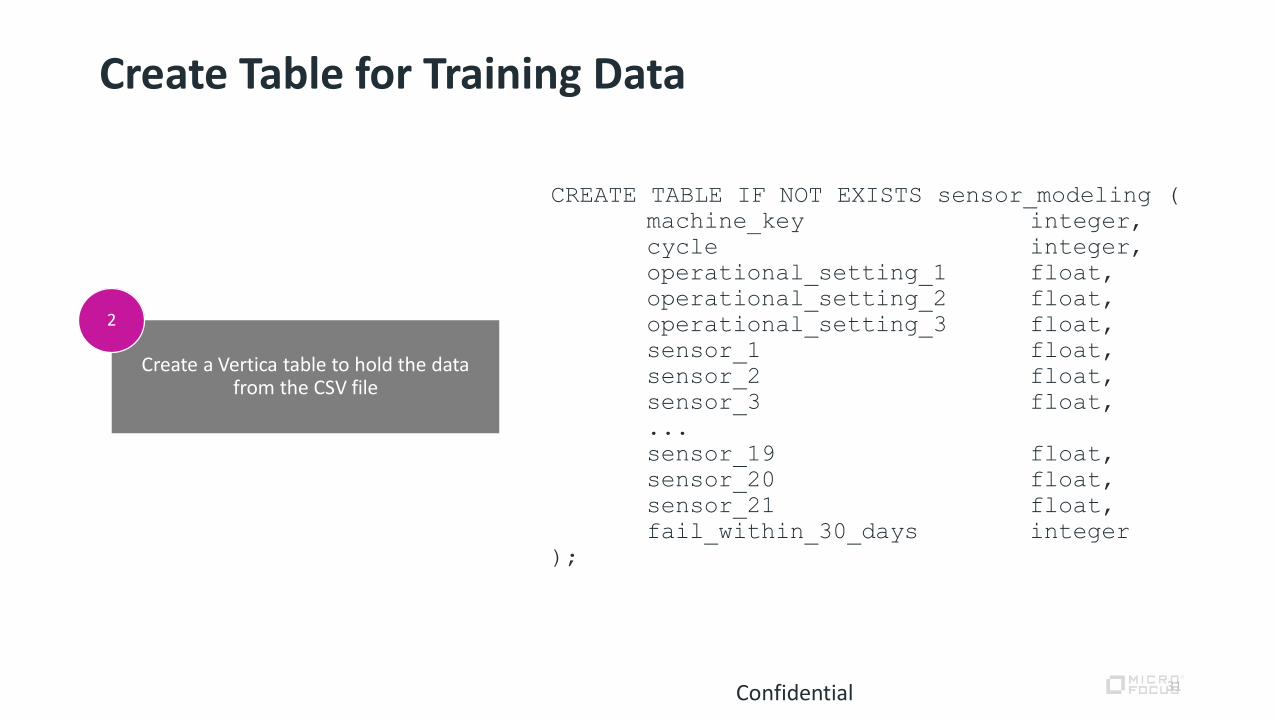
Create Table for Training Data
31
Create a Vertica table to hold the data from the CSV file
Confidential
2
CREATE TABLE IF NOT EXISTS sensor_modeling (
machine_key integer,
cycle integer,
operational_setting_1 float,
operational_setting_2 float,
operational_setting_3 float,
sensor_1 float,
sensor_2 float,
sensor_3 float,
...
sensor_19 float,
sensor_20 float,
sensor_21 float,
fail_within_30_days integer
);
Create table for testing
Create table for training
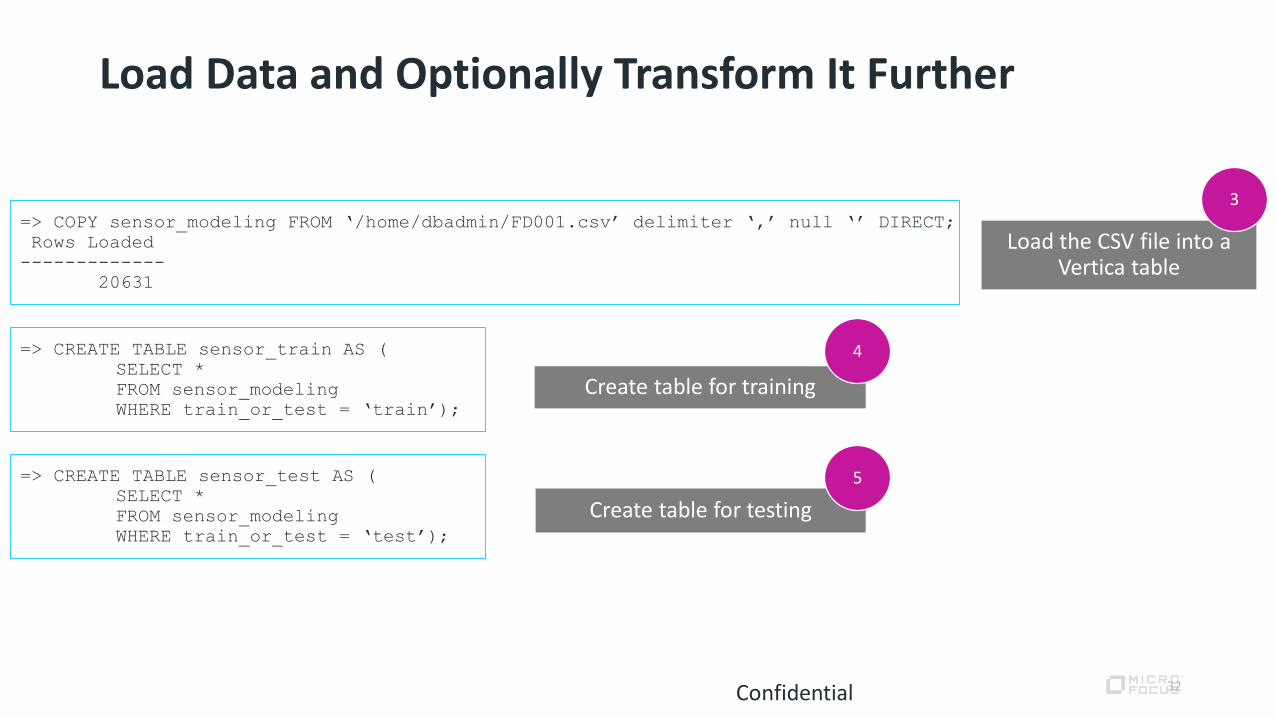
Load Data and Optionally Transform It Further
Load the CSV file into a Vertica table
Confidential 32
4
3
5
=> COPY sensor_modeling FROM ‘/home/dbadmin/FD001.csv’ delimiter ‘,’ null ‘’ DIRECT;
Rows Loaded
-------------
20631
=> CREATE TABLE sensor_train AS (
SELECT *
FROM sensor_modeling
WHERE train_or_test = ‘train’);
=> CREATE TABLE sensor_test AS (
SELECT *
FROM sensor_modeling
WHERE train_or_test = ‘test’);
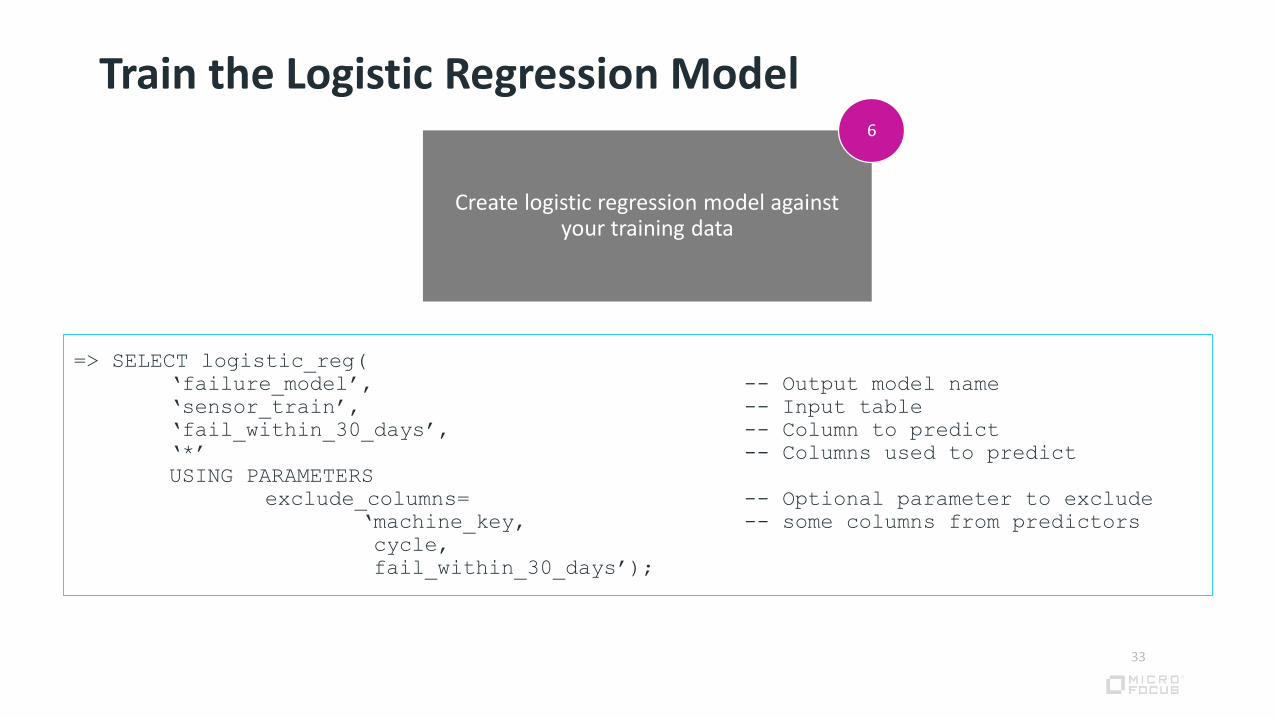
Train the Logistic Regression Model
33
Create logistic regression model against your training data
6
=> SELECT logistic_reg(
‘failure_model’, -- Output model name
‘sensor_train’, -- Input table
‘fail_within_30_days’, -- Column to predict
‘*’ -- Columns used to predict
USING PARAMETERS
exclude_columns= -- Optional parameter to exclude
‘machine_key, -- some columns from predictors
cycle,
fail_within_30_days’);
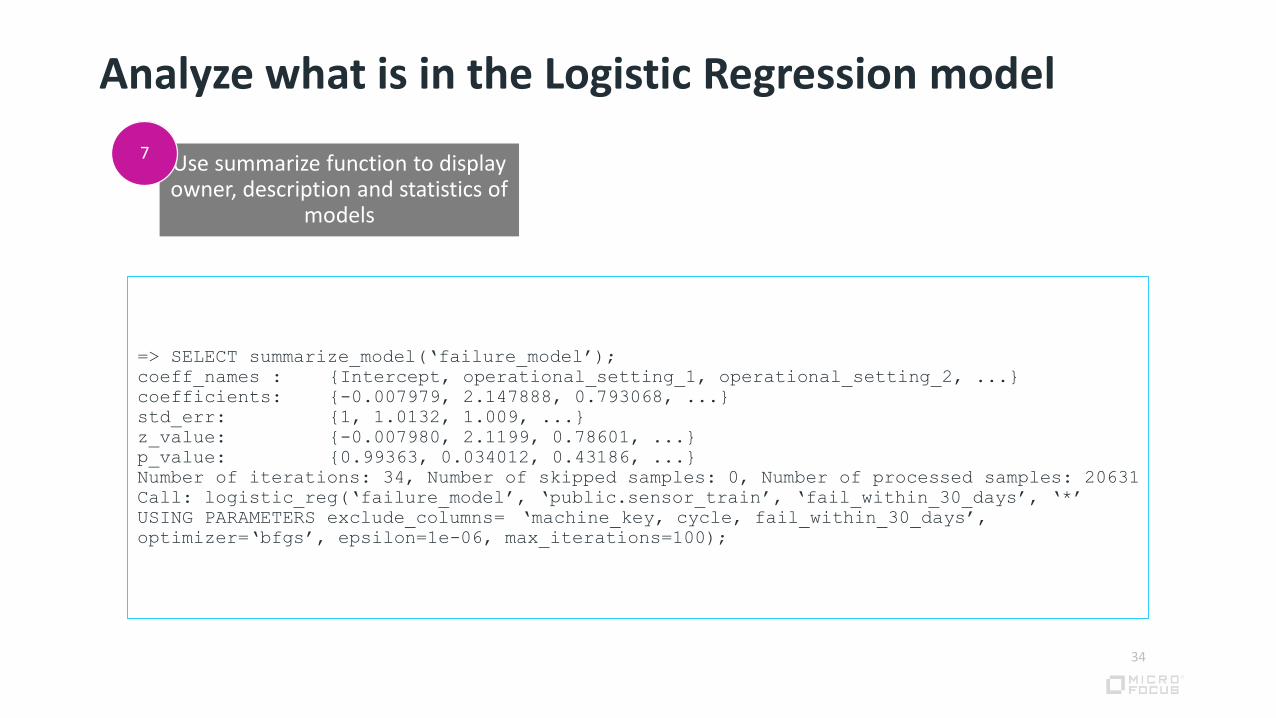
Analyze what is in the Logistic Regression model
34
Use summarize function to display owner, description and statistics of
models
7
=> SELECT summarize_model(‘failure_model’);
coeff_names : {Intercept, operational_setting_1, operational_setting_2, ...}
coefficients: {-0.007979, 2.147888, 0.793068, ...}
std_err: {1, 1.0132, 1.009, ...}
z_value: {-0.007980, 2.1199, 0.78601, ...}
p_value: {0.99363, 0.034012, 0.43186, ...}
Number of iterations: 34, Number of skipped samples: 0, Number of processed samples: 20631
Call: logistic_reg(‘failure_model’, ‘public.sensor_train’, ‘fail_within_30_days’, ‘*’
USING PARAMETERS exclude_columns= ‘machine_key, cycle, fail_within_30_days’,
optimizer=‘bfgs’, epsilon=1e-06, max_iterations=100);
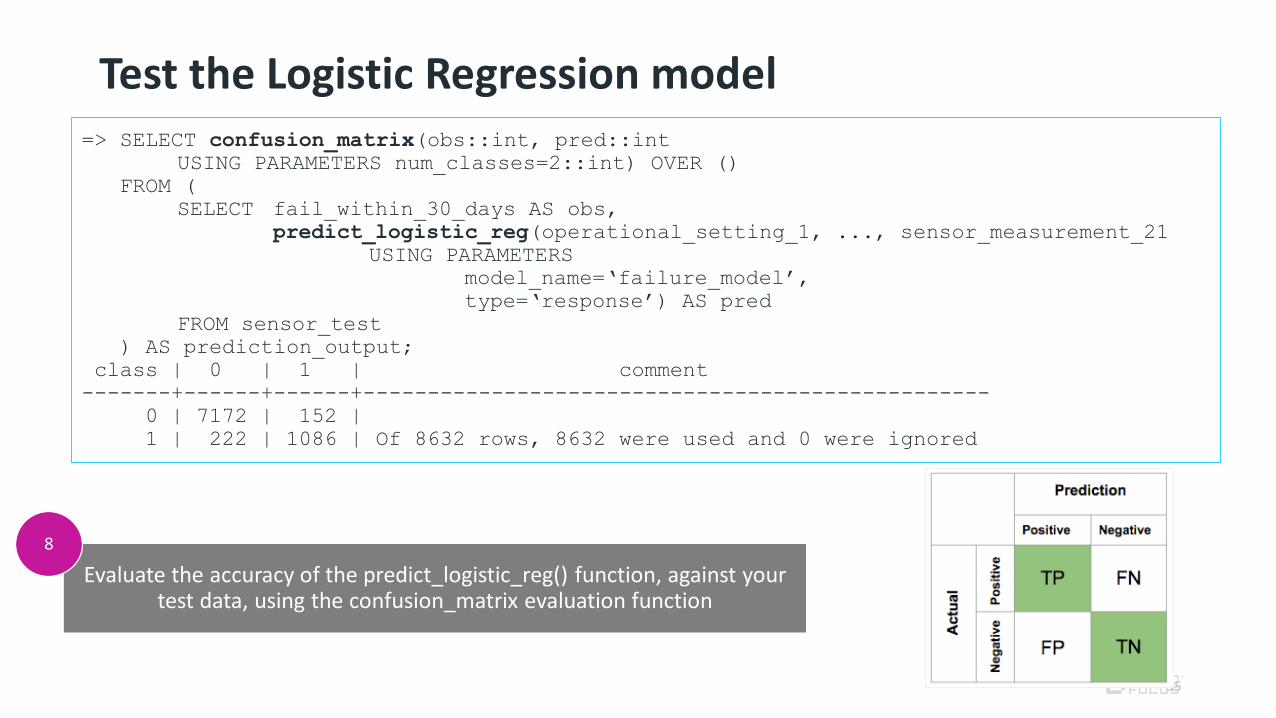
Test the Logistic Regression model
35
Evaluate the accuracy of the predict_logistic_reg() function, against your test data, using the confusion_matrix evaluation function
8
=> SELECT confusion_matrix(obs::int, pred::int
USING PARAMETERS num_classes=2::int) OVER ()
FROM (
SELECT fail_within_30_days AS obs,
predict_logistic_reg(operational_setting_1, ..., sensor_measurement_21
USING PARAMETERS
model_name=‘failure_model’,
type=‘response’) AS pred
FROM sensor_test
) AS prediction_output;
class | 0 | 1 | comment
-------+------+------+-------------------------------------------------
0 | 7172 | 152 |
1 | 222 | 1086 | Of 8632 rows, 8632 were used and 0 were ignored
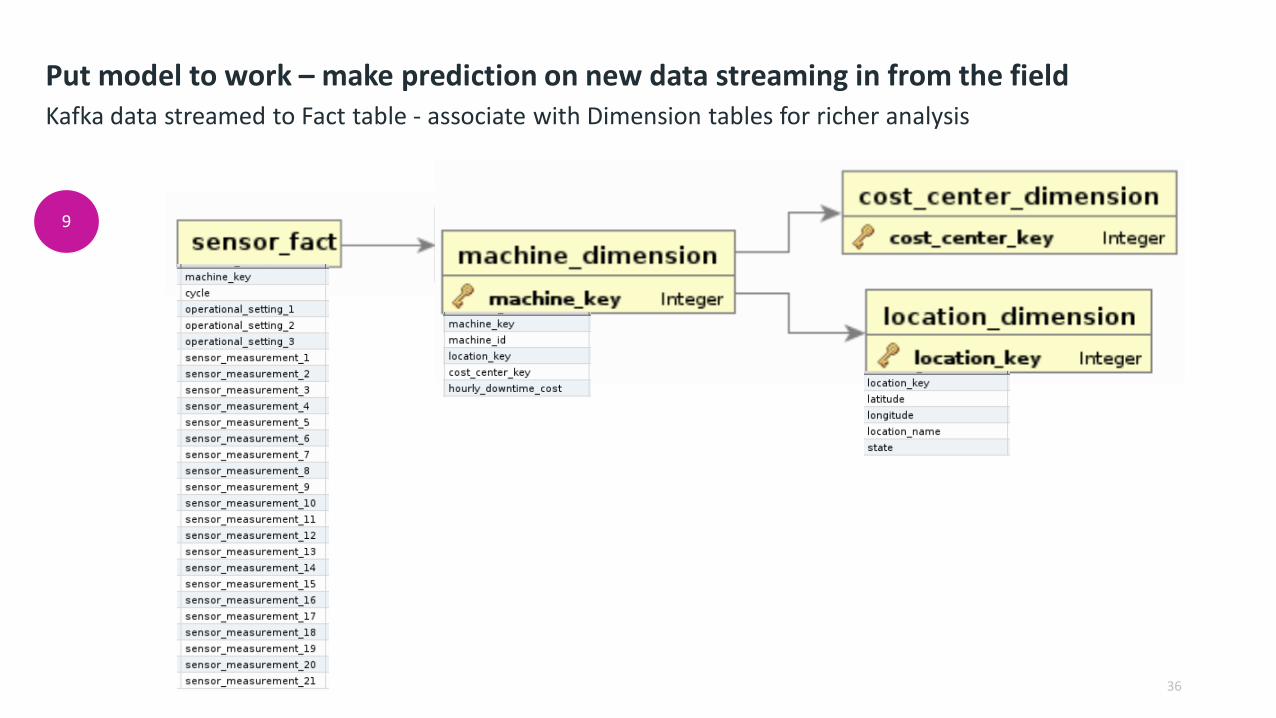
Put model to work – make prediction on new data streaming in from the fieldKafka data streamed to Fact table - associate with Dimension tables for richer analysis
36
9
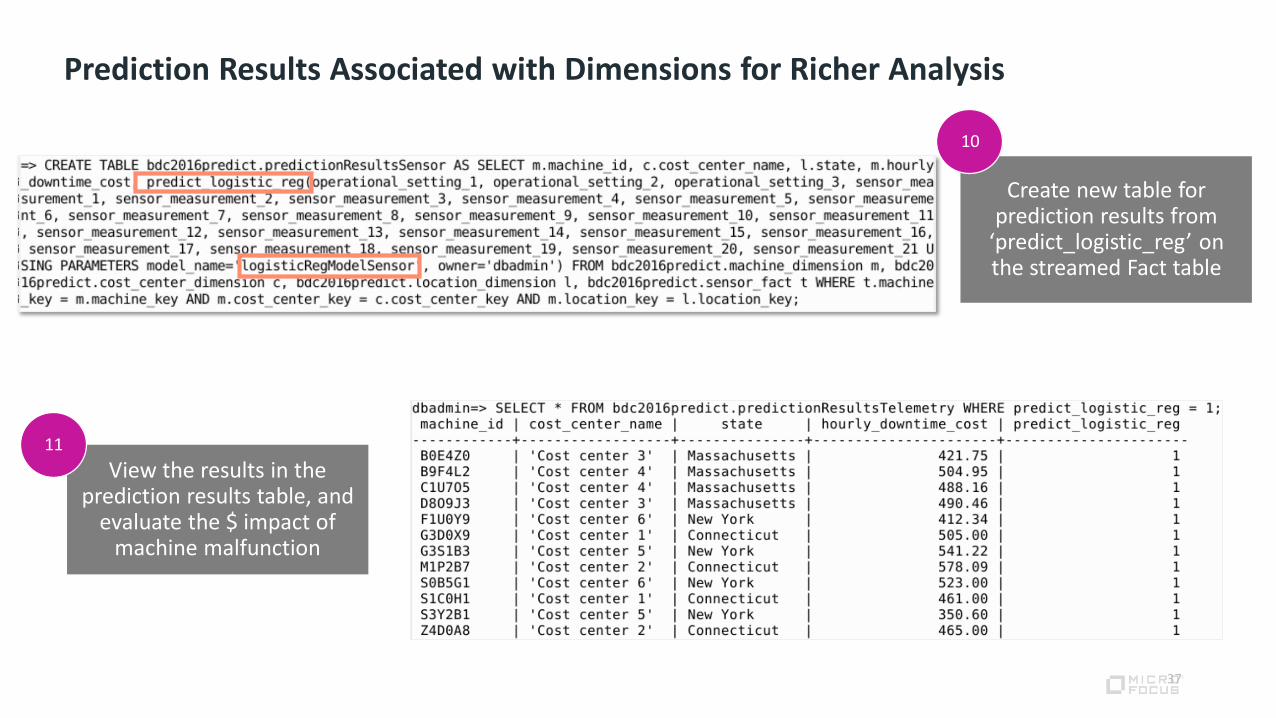
Prediction Results Associated with Dimensions for Richer Analysis
37
Create new table for prediction results from
‘predict_logistic_reg’ on the streamed Fact table
View the results in the prediction results table, and
evaluate the $ impact of machine malfunction
10
11

Looking for Opportunities?Vertica.com/careers

Web Site: www.vertica.comEmail: [email protected] Email: [email protected]
Learn More: www.vertica.com
Try it Free: www.vertica.com/try
Thank You
For Being Data Driven