Embed Size (px)
Citation preview
Submission to ECB Workshop on Big Data for Forecasting and statistics. Frankfurt 7/8 April
1
Big Data and Economic Forecasting: A Top-Down Approach
Using Directed Algorithmic Text Analysis1
Rickard Nyman, Paul Ormerod2, Robert Smith and David Tuckett
Centre for the Study of Decision-Making Uncertainty,
Faculty of Brain Sciences,
University College. London.
1 The authors wish to acknowledge financial support to the Centre from the Institute of New Economic Thinking and assistance from the Bank of England. We are grateful to Aikaterini Fotopoulou of University College London for assistance in clarifying some questions of neurobiology. 2 Corresponding author. [email protected]
Submission to ECB Workshop on Big Data for Forecasting and statistics. Frankfurt 7/8 April
2
1. Introduction
An important aim of economic forecasting is to make ex ante estimates of the
likely values for output, inflation, employment, spending, etc., which are useful
to guide action. Big Data provides many potentially exciting opportunities for
discovering knowledge that might be relevant to this task in hitherto
unconventional ways. However, it also raises important questions of theory and
method. On the theoretical side, there are questions about what the value of
data known today might be for what might be happening around now
(nowcasting) or to what might happen months or years out (forecasting). On the
method side, there is the need, to avoid drawing unreliable conclusions, to find
ways to reduce the dimensionality of the information in Big Data in ways which
enable it to be turned into meaningful knowledge.
The use of search engine data, for example, in an unstructured way can
readily lead to spurious results. The Google Trend service provides data for
millions of search queries and hundreds of search categories extending back to
January 1, 2004. Given the processing power readily available, relationships
which are apparently statistically significant can quite easily be discovered ex
post between search terms and some potential dependent variable. But as
Silver (2012), for example, points out, with so much data available and easy to
process, many relationships may exist which seem significant on standard
frequentist tests without there being any very satisfying explanation for them
being in any way causal.
Results obtained through data mining in this way can only be interpreted ex
post. Almost anything can be rationalised in this way. Without theoretical
guidance, there is no way of knowing in advance even what the sign of any
correlation ought to be. An example of data mining is a recent claim to have
found a trading strategy, based upon the frequency with which the word ‘debt’
appeared on Google Trends, which would have delivered a 326 per cent return
over the period 5 January 2004 until 22 February 2011 (Preis et al. 2013).
However, a return only marginally lower could have been obtained, using the
identical ex post strategy, based on the frequency with which the words ‘colour’
and ‘restaurant’ appeared
Submission to ECB Workshop on Big Data for Forecasting and statistics. Frankfurt 7/8 April
3
One alternative to mere data-mining is to examine big data such as Google
Trends or Twitter using judgmentally selected variables which might reasonably
be supposed to be of relevance to the particular problem. Bentley and Ormerod
(2010), for example, use Google Trends data in the context of effective
communication strategies regarding health issues. They fit a simple model to
characterise the effective degree of social transmission versus decisions made
individually in two rapidly-evolved issues, namely the world-wide interest in
avian influenza, or ‘bird flu’, in 2005, and in H1N1, or ‘swine flu’, from late April
to early May 2009.
Much more generally, Choi and Varian [2009a,b, 2011] describe how to use
such methods and there is already a literature referring to such work (for
example, Arola and Galan ,2012; McLaren and Shanbhoge, 2011; Hellerstein
and Middeldorp, 2012; Suhoy, 2009; and Carrié-Swallow and Labbé, (2011).
So, for instance, search engine queries in the “Vehicle Shopping" category could
be good candidates for forecasting automobile sales, while queries such as “file
for unemployment" could be useful in forecasting initial claims for unemployment
benefits (Scott and Varian, 2012)
But the difficulty with using human judgment to select predictors is that the
task does not easily scale to models where the number of possible predictors
exceeds the number of observations – known as the “fat regression” problem.
“Even if we restrict ourselves to using only categories of queries”, as Scott and
Varian (2012) point out, we will still have “several hundred possible predictors
for 100 months of data”.
Castle et al. [2009, 2010] describe and compare 21 techniques for variable
selection for time-series forecasting. They fall into 4 major categories:
Significance testing (forward and backward stepwise regression, Gets);
Information criteria (AIC, BIC); Principle component and factor models (e.g.
Stock and Watson [2010]) and Lasso, ridge regression and other penalized
regression models (e.g., Hastie et al. [2009]). Scott and Varian themselves
combine three Bayesian techniques: Kalman filtering, spike-and-slab regression,
and model averaging. In their paper they illustrate such techniques to show how
search engine query data may be selected less arbitrarily and more reliably as
predictors in various contexts.
Submission to ECB Workshop on Big Data for Forecasting and statistics. Frankfurt 7/8 April
4
In this paper, we describe a new approach to economic forecasting, which is
also based on the availability of “Big Data” and addresses the fundamental
question of how to reduce the dimensionality of the information in ways which
enable it to be turned into meaningful information. The econometric
methodologies discussed immediately above offer one type of approach. Here,
we offer a different one.
We describe a new methodological and statistical approach termed “Directed
Algorithmic Text Analysis” (DATA), and illustrate how its use can improve
considerably on consensus economic forecasts of the Michigan Consumer Index
Survey, a key variable in understanding the state of the US economy.
The approach is based, like others, upon searching for particular terms in
textual data bases. However, in contrast to the econometric approaches, our
methodology is based upon a theory of human decision making under radical
uncertainty. The search is directed by the theory. This direction dramatically
reduces the dimensionality of the search. We look for words which convey a very
limited number of emotions, two to be precise. As in other approaches, we also
use regression analysis, but the choice of variables comes from the underlying
theory of decision making.
In section 2, we introduce conviction narrative theory, a social-psychological
theory of agent behaviour, which provides a framework as to how to define and
measure sentiment relevant to forecasting macroeconomic events. In section 3
we set out the directed algorithmic text analysis (DATA) methodology we have
developed to extract relative sentiment shifts in conviction narratives over time
from textual data bases. We also describe the application of the technique to
the prediction of the Michigan Consumer Survey Index. We present results in
section 4, using as a benchmark the consensus forecasts made by economists
and reported by Reuters. We offer a brief discussion and conclusion in section 5.
2. Conviction Narrative Theory
The concept of conviction narratives (Chong and Tuckett, 2014) is based on a
social-psychological theory of action under uncertainty. It builds on the view of
emotion as a human resource (Stets and Osborn, 2008; Bandelj, 2009; Berezin,
2009; Stets, 2010) - for instance, to anticipate good or bad outcomes under
uncertainty (Kemper, 2006) - and narrative as a largely successful way of
Submission to ECB Workshop on Big Data for Forecasting and statistics. Frankfurt 7/8 April
5
apprehending complex situations - so that the imagined future course for events
has a sense of truth (Bruner, 1986, 1990, 1991; Mar and Oatley, 2008).
Embedded in local social contexts, conviction narratives enable agents to
overcome the ambivalence that is created by entering into any dependent
relationship where one can lose or gain as time unfolds (Smelser, 1998; Pixley,
2009; Tuckett and Taffler; 2008). Ambivalent relationships necessarily create
emotional conflict - between hope and fear or excitement and doubt. Any
economic agent required to act to begin such a relationship faces the fact that
their actions make them dependent on uncertain outcomes. The decision
necessarily generates both anxiety about possible future loss and excitement
about possible future profit. It is these two emotions, anxiety and excitement,
which play a central role in conviction narratives.
We can conceive of a conviction narrative as an internal representation of
each economic agent’s environment that creates enough excitement relative to
the level of anxiety to allow the agent to feel committed to actions that might
generate loss. We can then think of the collection of conviction narratives
existing within the economy and/or its different sectors as expressing the
current state of narrative confidence about the future. The measure we will
shortly introduce seeks to assess such shifting economic confidence about the
future by assessing shifts in the relative quantities of excitement and anxiety in
relevant texts thus allowing a time series to be constructed to track the shifts.
Conviction narrative theory draws on modern neurobiological theories in
which cognition is associated with the functions of observable brain networks
and allied neurobiological processes (Kasam et al, 2013). It is now well-
established that several aspects of cognition are predictive and anticipatory in
the sense that the brain mainly represents events by predicting the states of the
organism in the world and in so doing stimulates reactions such as approach or
flight that fulfill its predictions (Friston, 2010). In this view of mental
functioning, feelings, emotions and cognitions are not necessary mental events
in opposition but different facets of the predictive nature of brain functioning
that can support each other, ultimately allowing agents to commit to decisions
rapidly and effectively (Damasio, 1994). This is particularly the case where there
is uncertainty, and outcomes may not be confidently knowable for some time to
come.
Submission to ECB Workshop on Big Data for Forecasting and statistics. Frankfurt 7/8 April
6
Conviction narrative theory (Chong and Tuckett, 2014; Tuckett, Smith and
Nyman, 2014) provides the opportunity to go beyond simplisitic
“positive/negative”, “optimistic/pessimistic”, characterizations of economic
sentiment, which are essentially atheoretical, to specify precisely the kinds and
levels of human affect likely to be found in narrative texts when decisions are
taken to act.
3. Directed Algorithmic Text Analysis (DATA): An Empirical
Application
Machine learning algorithms offer the potential to carry out rigorous and
extensive analysis of textual material in order to derive knowledge (Hofmann,
2001; Ikonomakis, Kotsiantis & Tampakas, 2005; Pang, Lee & Vaithyanathan,
2002; Pang & Lee, 2005; Sebastiani, 2002; Turney, 2002). Our approach has
been to develop algorithms to analyse text archives (such as the daily Reuters
news feeds, company emails, internal memoranda or for this paper, broker
reports held on file at the Bank of England) to extract time series of relative
sentiment shifts that might forecast aspects of the economy.
A formal exposition of the methodology can be found in the appendix.
Essentially, our approach is to select variables, directed by the relevant theory of
decision making, for use as explanatory factors in a regression without making
any distributional assumptions. We can explore large text data sets, using a
causal hypothesis about what drives agents’ confidence in the economy, namely
the theory of conviction narratives.
We do search for the appearance of particular words. But the psychological
theory directs the search to words precisely indicative of just two emotions,
namely ‘excitement’ and ‘anxiety’. The selection of the sets of words which
convey such emotions is both grounded in and directed by the underlying theory
and validated in laboratory settings (for example, Strauss 2013).
We construct relative sentiment shift indicators directly and transparently
using our DATA methodology. We then assess the statistical significance of the
correlations that emerge rigorously, using a framework which is designed to
replicate a strict ex ante test.
Submission to ECB Workshop on Big Data for Forecasting and statistics. Frankfurt 7/8 April
7
In this example we analyse an archive of 14 brokers from June 2010 through
June 2013 consisting of documents of a primarily global economic focus. The
archive consists of approximately 111 documents per month. The documents are
very long (up to 50 pages in some cases), and so we pick up on a large number
of words. In total we arrive at 37 monthly data points. For each monthly
collection of articles we compute two emotional summary statistics, one for
excitement (the attractor) and one for anxiety (the repellor), by applying a
simple word count methodology. Two sets of emotion words, each of size
approximately 150, indicative of the relevant emotions have been defined. The
lists proved useful in other studies (Tuckett, Smith and Nyman, op cit.) and have
been validated in a laboratory setting (Strauss, 2013).
The relevant "emotion score” (excitement or anxiety) is computed as the
average number of defined emotion words per article found in the given monthly
collection of articles. The next step, to measure relative sentiment shifts in the
content of narratives within the collection, is to compute the difference between
the attractor (exciting) and repellor (anxiety) emotion scores. For the formal
definitions we refer to the appendix.
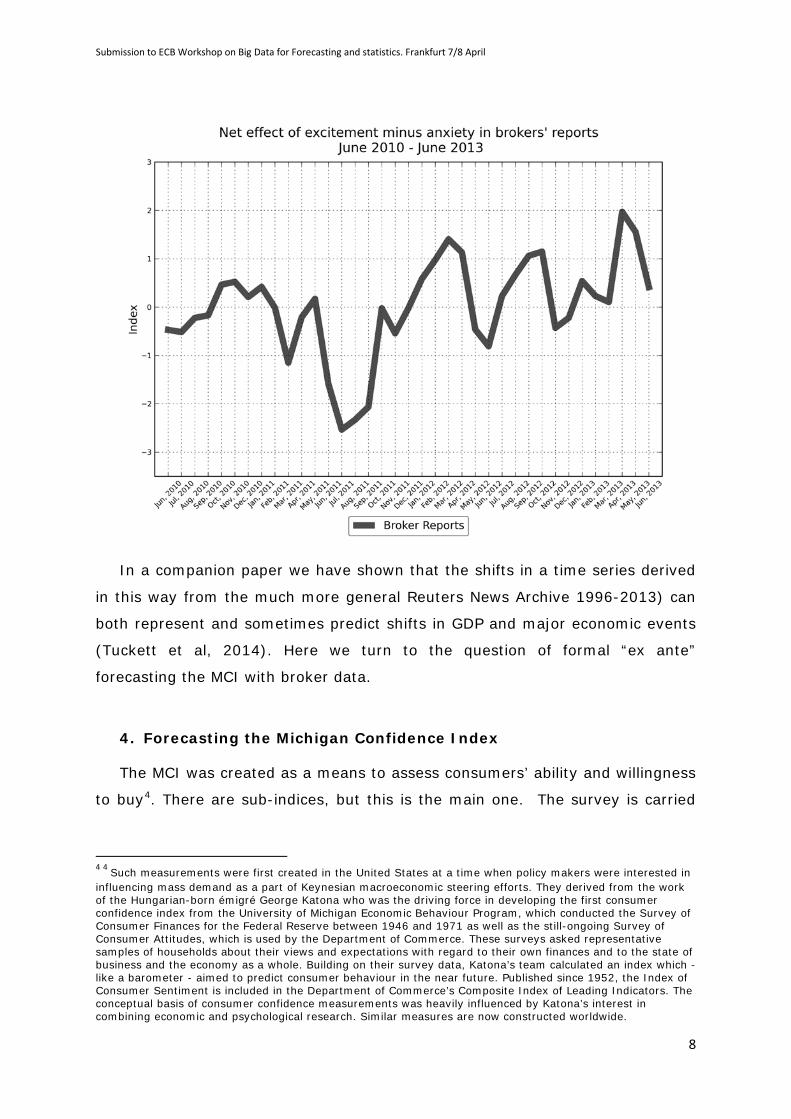
We construct from this a single measure of relative sentiment (BROKER)
which we use for analytical purposes, defined as the difference between the
frequency of excitement words and the frequency of anxiety words in any given
month, normalized by dividing by the total number of characters3 in the data
base. Figure 1 plots relative sentiment shifts over the period June 2010 through
June 2013.
Figure 1
3 In general, the total number of words or documents is the divisor, but in this particular instance some of the documents contain tables and others do not, so that the total number of characters is more appropriate
Submission to ECB Workshop on Big Data for Forecasting and statistics. Frankfurt 7/8 April
8
In a companion paper we have shown that the shifts in a time series derived
in this way from the much more general Reuters News Archive 1996-2013) can
both represent and sometimes predict shifts in GDP and major economic events
(Tuckett et al, 2014). Here we turn to the question of formal “ex ante”
forecasting the MCI with broker data.
4. Forecasting the Michigan Confidence Index
The MCI was created as a means to assess consumers’ ability and willingness
to buy4. There are sub-indices, but this is the main one. The survey is carried
4 4 Such measurements were first created in the United States at a time when policy makers were interested in influencing mass demand as a part of Keynesian macroeconomic steering efforts. They derived from the work of the Hungarian-born émigré George Katona who was the driving force in developing the first consumer confidence index from the University of Michigan Economic Behaviour Program, which conducted the Survey of Consumer Finances for the Federal Reserve between 1946 and 1971 as well as the still-ongoing Survey of Consumer Attitudes, which is used by the Department of Commerce. These surveys asked representative samples of households about their views and expectations with regard to their own finances and to the state of business and the economy as a whole. Building on their survey data, Katona’s team calculated an index which - like a barometer - aimed to predict consumer behaviour in the near future. Published since 1952, the Index of Consumer Sentiment is included in the Department of Commerce’s Composite Index of Leading Indicators. The conceptual basis of consumer confidence measurements was heavily influenced by Katona’s interest in combining economic and psychological research. Similar measures are now constructed worldwide.

Submission to ECB Workshop on Big Data for Forecasting and statistics. Frankfurt 7/8 April
9
out with at least 500 phone interviews, during a period of around 2 weeks, in
which approximately 50 questions are asked.
Survey results are released twice each month at 10.00 a.m. Eastern Time:
preliminary estimates are published usually (variations occur during the winter
season) on the second Friday of each month, and final results on the fourth
Friday.
There is a very high correlation of 0.966 between the preliminary and final
index. The correlation between the change in the preliminary index in any given
month from the final in the previous month, and change in the final itself
remains high, at 0.905. The challenge is therefore not so much to forecast the
change in the final estimate of the index at time t+1 from the final estimate at
time t. Rather, it is to predict the change in the preliminary index at time t+1
from the final estimate at time t. We refer to this latter variable as DIFFPRELIM.
As a benchmark against which to judge predictions made by Directed
Algorithmic Text Analysis, based an analysis on conviction narratives, we use the
consensus forecasts of DIFFPRELIM made by economists and reported by
Reuters. We consider the period May 2012 through July 2013. Over this
period, the consensus predictions of DIFFPRELIM were poor. Even the sign of
the variable was only predicted correctly on 7 out of the 15 months.
A linear regression of DIFFPRELIM on the change in the preliminary on the
previous final predicted by the consensus forecast (which we describe as
DIFFCONSENSUS)5.confirms the poor record.
Over the period May 2012 through July 2013,
(1) DIFFPRELIM = -1.293 + 1.972*DIFFCONSENSUS
(1.084) (1.178)
Residual standard error: 4.045 Adjusted R-squared 0.114
F-statistic: 2.804 on 1 and 13 degrees of freedom, p-value: 0.118
The figures in brackets are the estimated standard errors of the coefficients.
The explanatory power of the equation is very low. In fact, it is essentially 5 The autocorrelation function of each variable contains no lags which are significantly different from zero, so the two variables have the same order of integration
Submission to ECB Workshop on Big Data for Forecasting and statistics. Frankfurt 7/8 April
10
not significantly different from zero. In other words, the consensus forecasts
have very little value in terms of predicting the change in the preliminary index
from the level of the final index in the previous month.
Next, we compare predictions made by the consensus of economists for
DIFFPRELIM with the predictions generated by a simple regression of
DIFFPRELIM at time t on DIFFBROKER at time t-1, where DIFFBROKER is the
change in BROKER on the previous month.
The time stamp of the data is important to explain. It is crucial to
understanding the significance of the results.
Initially, we estimate the regression using the data on DIFFPRELIM from
August 2010 through April 2012. The first observation in this sample is the
value of the preliminary index in August 2010 minus the value of the final
observation in July 2010. The corresponding data point for the series BROKER is
the change in the value of BROKER between July and June 2010. In other
words, we regress DIFFPRELIM on information which would have been available
at the end of the previous month to which DIFFPRELIM relates.
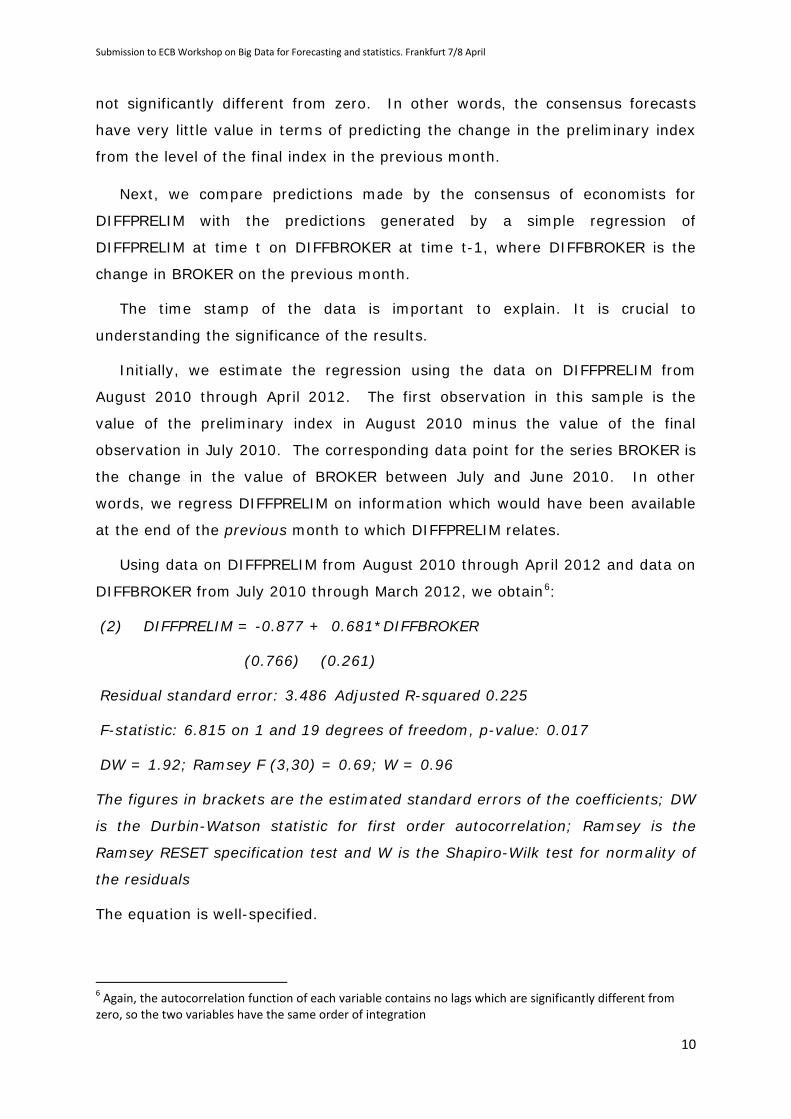
Using data on DIFFPRELIM from August 2010 through April 2012 and data on
DIFFBROKER from July 2010 through March 2012, we obtain6:
(2) DIFFPRELIM = -0.877 + 0.681*DIFFBROKER
(0.766) (0.261)
Residual standard error: 3.486 Adjusted R-squared 0.225
F-statistic: 6.815 on 1 and 19 degrees of freedom, p-value: 0.017
DW = 1.92; Ramsey F (3,30) = 0.69; W = 0.96
The figures in brackets are the estimated standard errors of the coefficients; DW
is the Durbin-Watson statistic for first order autocorrelation; Ramsey is the
Ramsey RESET specification test and W is the Shapiro-Wilk test for normality of
the residuals
The equation is well-specified.
6 Again, the autocorrelation function of each variable contains no lags which are significantly different from zero, so the two variables have the same order of integration
Submission to ECB Workshop on Big Data for Forecasting and statistics. Frankfurt 7/8 April
11
To generate forecasts of the preliminary estimates of the Michigan index
for May 2012, we use the coefficients in equation (2) above, and the data for
DIFFBROKER in April 2012. In other words, to predict the May value of the
index, we use information which was available at the end of April.
We then repeat the analysis, moving the sample forward one month at a
time, until we predict the index in July 2013 using the equation estimated with
DIFFPRELIM from August 2010 through June 2013 and DIFFBROKER July 2010
through May 2013. The prediction for July 2013 uses the value of DIFFBROKER
in June 2013. Again, to emphasise, when making the prediction we only use
information which was available at the previous month. This replicates as far as
possible an ex ante forecasting situation.
We also want to emphasise that the text analysis was only carried out
once. In other words, we applied our general methodology of DATA to this
particular text data base and used the results to make predictions, as described
above. We did not do repeated searches of the data base, using for example
only sub-sets of the complete set of words which represent excitement and
anxiety, or giving words different weights in order to improve the forecast
performance. Ex post, it would almost certainly be possible to achieve an
apparent improvement in ‘forecast’ performance by carrying out such
procedures, but as a way of replicating an ex ante forecasting situation, it would
be wholly invalid.
Further, we specified the very simple functional form in equation (2) and
then carried out the regressions. We did not modify this in any way in order for
the equations to perform better on statistical tests of validation. The test
statistics reported with the equations therefore satisfy completely the
requirements of statistical theory and their power can be relied upon. We make
this point because many regressions, especially on time series data, reported in
the academic econometric literature, appear to satisfy an impressive battery of
specification tests. But usually this is only achieved by modifying the
specification of the equation, either in terms of explanatory variables or in terms
of functional form, in order that the equation does in fact satisfy such tests. But
in these circumstances, the true power of the tests is in general unknown,
except that it is less than that suggested by statistical theory.
Submission to ECB Workshop on Big Data for Forecasting and statistics. Frankfurt 7/8 April
12
To recap, the consensus forecasts made by economists over the period
May 2012 through July 2013 only get the sign of the change correct on 7 out of
15 equations, and a regression of the actual value of DIFFPRELIM on the
changes implied by the consensus forecasts has effectively zero statistical
power. This is the benchmark against which we judge our predictions.
Our methodology captures the correct value of the sign of DIFFPRELIM on
12 out of 15 occasions.
The regression comparable to (1) using the BROKER data has an adjusted R
squared of 0.486 compared to the 0.114 of the consensus predictions of
DIFFPRELIM. It has genuine power and the predictions are very much better
than that achieved from consensus economic forecasts. The predictions are
unbiased, given that the intercept is not significantly different from zero and the
coefficient on the explanatory variable is not significantly different from one.
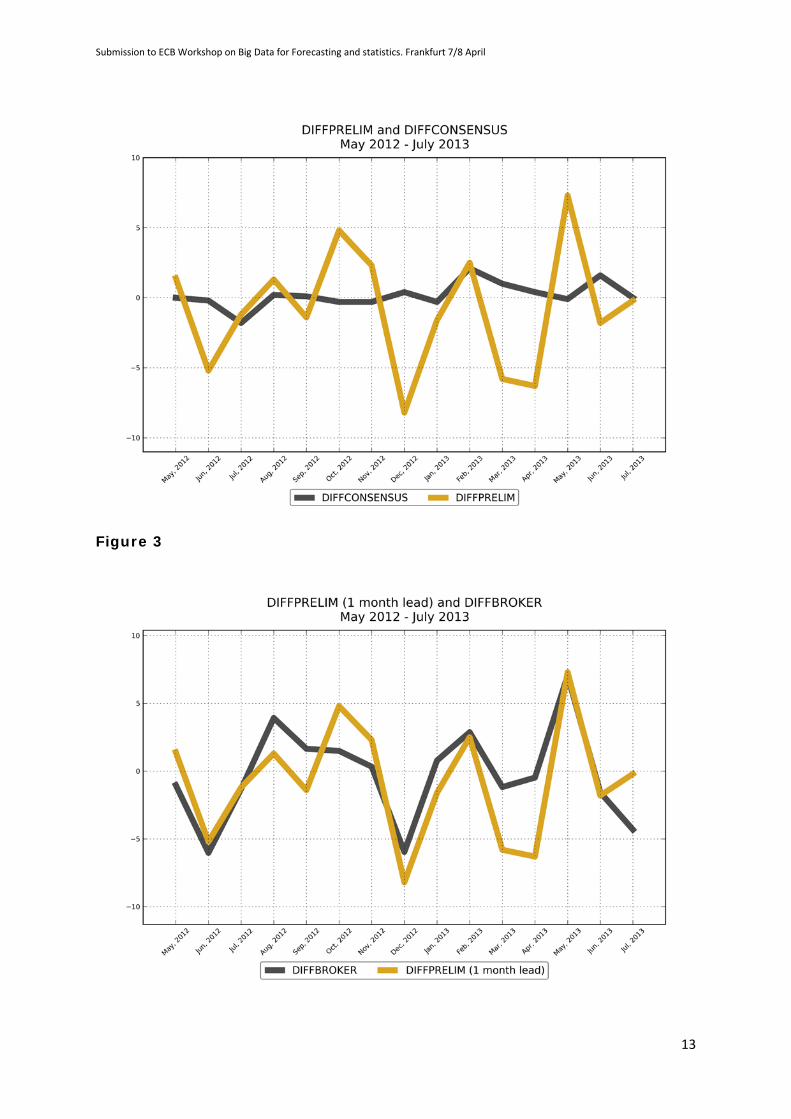
The difference in the forecasting performance of the consensus economic
forecasts (CONSENSUS) and BROKER is seen very clearly comparing Figures 2
and 3. Figure 2 plots the difference between the preliminary estimate and the
final value in the previous month and the prediction given by the consensus.
Figure 3 plots the difference between Broker and the preliminary estimate.
Figure 2
Submission to ECB Workshop on Big Data for Forecasting and statistics. Frankfurt 7/8 April
13
Figure 3
Submission to ECB Workshop on Big Data for Forecasting and statistics. Frankfurt 7/8 April
14
The results described above are forecasts rather than ‘nowcasts’. In other
words, they are forecasts about the value of a variable in the future rather than
an estimate at time to of the value of a variable at the same time. However, the
preliminary estimate of the MCI appears in the first half of the month, and we
use information up to and including the last day of the previous month. So the
prediction is very short-term (even though it could be used in trading
strategies).
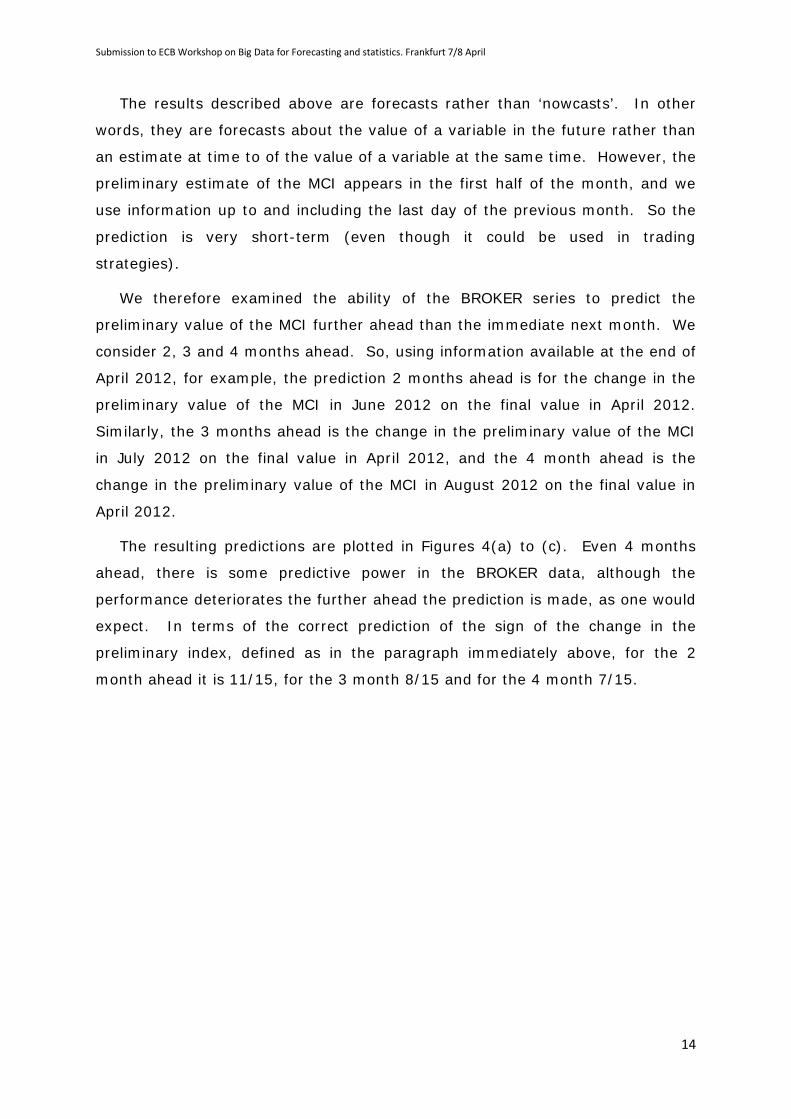
We therefore examined the ability of the BROKER series to predict the
preliminary value of the MCI further ahead than the immediate next month. We
consider 2, 3 and 4 months ahead. So, using information available at the end of
April 2012, for example, the prediction 2 months ahead is for the change in the
preliminary value of the MCI in June 2012 on the final value in April 2012.
Similarly, the 3 months ahead is the change in the preliminary value of the MCI
in July 2012 on the final value in April 2012, and the 4 month ahead is the
change in the preliminary value of the MCI in August 2012 on the final value in
April 2012.
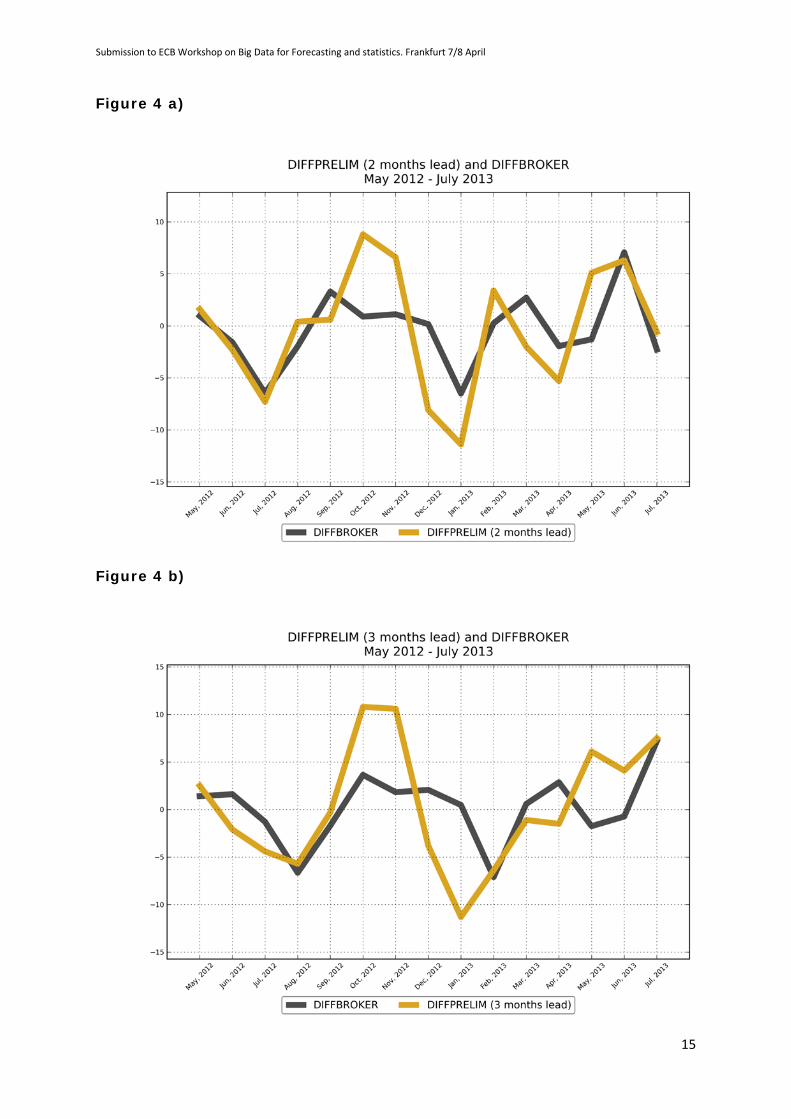
The resulting predictions are plotted in Figures 4(a) to (c). Even 4 months
ahead, there is some predictive power in the BROKER data, although the
performance deteriorates the further ahead the prediction is made, as one would
expect. In terms of the correct prediction of the sign of the change in the
preliminary index, defined as in the paragraph immediately above, for the 2
month ahead it is 11/15, for the 3 month 8/15 and for the 4 month 7/15.
Submission to ECB Workshop on Big Data for Forecasting and statistics. Frankfurt 7/8 April
15
Figure 4 a)
Figure 4 b)
Submission to ECB Workshop on Big Data for Forecasting and statistics. Frankfurt 7/8 April
16
Figure 4 c)
5. Discussion and Conclusion
The Michigan Consumer Sentiment Index is important not only in its own
right as an indicator of the current state of consumer confidence in America, but
it is also the focus of many trades on financial markets. Economists make
predictions of this index, month by month, and their views are polled by Reuters
and the consensus is published. The final value of the index for any given
month is published essentially at the end of the month, but a preliminary
estimate is also published in the first half of the month. This preliminary
estimate is very strongly correlated with the final value, and is available to the
economists when they make their predictions.
The real challenge, is therefore, to predict not the final, but the preliminary
value of the index. More specifically, the challenge is to predict the change in
the preliminary estimate from the final value of the previous month. The
performance of the economic consensus forecasts of this change over the 15

Submission to ECB Workshop on Big Data for Forecasting and statistics. Frankfurt 7/8 April
17
months from May 2012 through July 2013 is poor. Even the sign of the change
is correctly predicted on only 7 out of the 15 occasions, no better than a random
guess. A regression of the actual change on the predictive change has essentially
no predictive power.
The approach we have presented, grounded in the social-psychological theory
of conviction narratives and using directed algorithmic text analysis with a
database of brokers’ reports generates a time series which indicates the net
level of excitement minus anxiety found in the reports.
We replicate as far as possible a genuine ex ante forecasting situation over
the same 15 months from May 2012 through July 2013. These predictions give
the correct sign on 12 out of the 15 occasions, and have significant explanatory
power. The methodology can readily be applied to other text databases in the
same or other forecasting contexts. It can undoubtedly be refined. For
example, all documents are given equal weight in our analysis, even though in
practice some may be more influential than others.
Submission to ECB Workshop on Big Data for Forecasting and statistics. Frankfurt 7/8 April
18
Technical Appendix.
Relative Sentiment Shift Measurement
Prior to applying our measure of relative sentiment shifts, to be defined below, we extract the
documents relevant to the target topic. This is done by the use of ‘regular expressions’ – an
algorithmic concept of matching logical patterns of characters with text. In this particular case
no filtering has been applied - we have made use of the entire archive of broker reports
available to us.
Definition 1: Filtering Let D be the set of all database ‘objects’ having key, value pairs (example keys are ‘title’, ‘text’,
‘date’, ‘tags’ etc.), ‘
’ be logical conjunction and ‘
’ be set-inclusion. Let T denote the collection of
‘text’ fields (e.g., article body texts) within the set of database objects D. Thus,

Submission to ECB Workshop on Big Data for Forecasting and statistics. Frankfurt 7/8 April
19
Submission to ECB Workshop on Big Data for Forecasting and statistics. Frankfurt 7/8 April
20
References
Arola, Concha and Galan, Enrique (2012) Tracking the future on the web:
Construction of leading indicators using internet searches. Technical report, Bank
of Spain. URL http://www.bde.es/webbde/SES/Secciones/Publicaciones/
Publicaciones Seriadas/Documentos Ocasionales/12/Fich/do1203e.pdf.
Bandelj, N (2009) Emotions in economic action and interaction. Theor. Soc. 38:
Bentley, R. Alexander & Ormerod, Paul, 2010. "A rapid method for assessing
social versus independent interest in health issues: A case study of 'bird flu' and
'swine flu'," Social Science & Medicine, Elsevier, vol. 71(3), pages 482-485,
August.
Berezin, M. ________(2009) Exploring emotions and the economy: new
conributions from sociological theory. Theor. Soc. 38:335-346.
Bruner, Jerome. (1986) Actual Minds, Possible Worlds. Harvard University Press.
__________ (1990) Acts of Meaning. Harvard University Press.
__________( 1991) The Narrative Construction of Reality. Critical Inquiry, 18, 1,
1-21.
Carriere-Swallow, Yan and Labbé, Felipe.(2011) Nowcasting with google trends
in an emerging market. Journal of Forecasting. doi: 10.1002/for.1252. URL
http://ideas.repec. org/p/chb/bcchwp/588.html. Working Papers Central Bank of
Chile 588.
Castle, Jennifer L, Qin, Xiaochuan and Reed, W. Robert. How to pick the best
regression equation: A review and comparison of model selection algorithms.
Technical Report 13/2009, Department of Economics, University of Canterbury,
2009. URL http://www. econ.canterbury.ac.nz/RePEc/cbt/econwp/0913.pdf.
Castle, Jennifer L. and Fawcett, Nicholas W. P. and Hendry, David F. (2010).
Evaluating automatic model selection. Technical Report 474, Department of
Economics, University of Oxford, 2010. URL
http://economics.ouls.ox.ac.uk/14734/1/paper474.pdf.
Choi, Hyunyoung and Varian, Hal. (2009a) Predicting the present with Google
Trends. Tech- nical report, Google, 2009a. URL
http://google.com/googleblogs/pdfs/google_ predicting_the_present.pdf.

Submission to ECB Workshop on Big Data for Forecasting and statistics. Frankfurt 7/8 April
21
Choi, Hyunyoung and Varian, Hal. (2009b) Predicting initial claims for
unemployment insurance using Google Trends. Technical report, Google. URL
http://research.google.com/ archive/papers/initialclaimsUS.pdf.
Choi, Hyunyoung and Varian, Hal. (2011). Using search engine data for
nowcasting— an illustration.
–
Submission to ECB Workshop on Big Data for Forecasting and statistics. Frankfurt 7/8 April
22
Kemper, T. D. (2006). Power and status and the power-status theory of
emotions. In J. E. Stets & J. H. Turner (Eds.), Handbook of the sociology of
emotions (pp. 87–113). New York: Springer.
Mar, R. A. & Oatley, K. (2008) The function of fiction is the abstraction and
simulation of social experience. Perspectives on Psychological Science 3(3):173–
92
McLaren, Nick and Shanbhoge, Rachana. (2011) Using internet search data as
economic indicators. Bank of England Quarterly Bulletin, June 2011. URL
http://www.bankofengland.co. uk/publications/quarterlybulletin/qb110206.pdf.
Pixley, J. (2009) Exploring emotions and the economy: new conributions from
sociological theory. Theor. Soc. 38:335-346.
Pang, B., Lee, L., 2005. Seeing stars: Exploiting class relationships for sentiment
categorization with respect to rating scales. In: Proceedings of the ACL, 115-
124.
Preis, T., Moat, H.S. & Stanley, H.E. (2013). Quantifying Trading Behavior in
Financial Markets Using Google Trends. Scientific Reports, DOI:
10.1038/srep01684
Scott, Steven L. and Varian, Hal R. (2012). Bayesian Variable Selection for
Nowcasting Economic Time Series. December 31 Draft at
Sebastiani, F. (2002). Machine learning in automated text categorization. ACM
Computing Surveys (CSUR) Surveys. Volume 34 Issue 1, 1-47
Silver, N. (2012). The Signal and the Noise: Why Most Predictions Fail – but
Some Don’t. Penguin Press.
Smelser, N. (1998). ‘The Rational and the Ambivalent in the Social Sciences’.
American Sociological Review, 63, 1–16.
Stets, J. E., (2010) Future Directions in the Sociology of Emotions. 2: 265–268
Stets, J. E., & Osborn, S. N. (2008). Injustice and emotions using identity
theory. Advances in Group Processes, 25, 257–285.
Stock, James and Watson, Mark. (2010) Dynamic factor models. In M. Clements
and D. Hendry, editors, Oxford Handbook of Economic Forecasting. Oxford
Submission to ECB Workshop on Big Data for Forecasting and statistics. Frankfurt 7/8 April
23
University Press, 2010. URL
http://www.economics.harvard.edu/faculty/stock/files/DynamicFactorModels.pdf
Strauss, Viktor, M. (2013) Emotional Values of Words in Finance: Anxiety about
Losses and Excitement about Gains. M.Sc. thesis in Social Cognition, University
College London.
Suhoy, Tanya. (2009) Query indices and a 2008 downturn: Israeli data.
Technical report, Bank of Israel, 2009. URL
http://www.bankisrael.gov.il/deptdata/mehkar/papers/dp0906e. pdf.
Tuckett, David, and Taffler, R. J., (2008). Phantastic Objects and the Financial
Market's Sense of Reality: A Psychoanalytic Contribution to the Understanding of
Stock Market Instability. International Journal of Psychoanalysis, 89, 2, pp 389-
412.
Tuckett, D., Smith, R. E. & Nyman, R. (2013). Tracking Phantastic Objects: A
Computer Algorithmic Investigation of Narrative Evolution in Unstructured Data
Sources. Under review.
Tuckett, D., Ormerod, P., Smith, R.E., & Nyman, R. (2013). Bringing Social-
Psychological Variables into Economic Modelling: Uncertainty, Animal Spirits and
the Recovery from the Great Recession.
Turney, P.D. (2002). Thumbs Up or Thumbs Down? Semantic Orientation
Applied to Unsupervised Classification of Reviews. In: ACL '02 Proceedings of the
40th Annual Meeting on Association for Computational Linguistics,. 417-424.