Embed Size (px)
Citation preview

Alstom Grid Inc.- P 1
Big Data Analytics for Power Grid Operations
Manu Parashar, Corporate Power System Engineer IEEE-Northwest Energy Systems Symposium (NWESS)
May 1st, 2014

Alstom Grid Inc.- P 2
Agenda
Synchrophasor Data Analytics for Real Time Grid Operations
Synchrophasor Data Analytics for Offline Engineering Analysis
Solution Architecture for Managing Big Data Analytics
Big Data in the Energy Industry
Conclusions

Alstom Grid Inc.- P 3
Big Data in the Energy Industry
Field level PMU IED Meter DA DG CMU HAN Line sensor
Others photos,
videos,
labs analysis,
site reports,
Financial
Qty
Time
Resolution
Type
1k 100k 10k 100k 10k 10M 100M 10k
Weather
100k
1ms 100ms 10ms 1s 10min 1min
to 15min 100M 10k 100k
V I Ph
Hz
V I
Hz Sw MW MVA T°, Qual
MWh
V I ph
Hz
History
100M 10k 100k
Files
100Tb
Comm (AMI, Tcom)
Signal Processing and Local Automation
Grid Operations
Business Operations
Customer Engagement
Real Time
Data Management
Transactional
3
Scada PDC MDM

Alstom Grid Inc.- P 4
Big Data Analytics Measurement to Information Value Chain
1. Meters 2. Telecom infrastructure 3. Data concentrator and Head end 4. Data Aggregation, qualification, processing 5. Interaction with others utilities IT/OT systems
(scada, asset data, weather data, customers data, etc…) 6. Data analytics 7. Historian of large quantity of data from various sources 8. Utility Analytics 9. Presentation : User Interface, Business Intelligence
• Meter Data Management refers to layers 4 - 5 – 6
• MDM as Master Data Management refers to layers 7 – 8 –9
Concentrator
Telecom Backhaul
Aggregation and Qualification
1
3
2
3
4
5 6
Telecom last miles 2
Head End
Meter Analytics
9
7
Signals
Data
Information
meters M M
M M
M
4
Grid
Operations
Business
Operations Customer
Engagement Meter
Meter
MDM
IT and OT Systems
IT and OT Systems
Historian
Presentation UI & BI
Utility Analytics 8
Master
MDM
Information

Alstom Grid Inc.- P 5
Holistic Approach to Big Data Analytics A functional transverse layer that pull data from all sources and generate value to each domain
5
Field level PMU IED Meter DA
PDC Scada
Comm
Field
gateways
Applications DMS EMS OSS
DG
CIS ERP GIS
Geo - Spatial
MMS
CMU
Telecom and AMR
ACM
UI Op Stations Mobile UI
DR Planning
HAN
DER
Meter DM
Customer Services
Utility Perfor mance
Grid Operations
Data Transform and Load
Data to Information Additional
Value to Users
Data Segmentation and Storage
UMDM is a facility to integrate real time data, meter data, financial data, and analytics
to bring value to Network Operations, Network Planning, Customer Services and Company Efficiency
UI Information
Presentation
Grid Asset & Planning
HAN Mgr
Analytics
Containers
Collectors
UMDA
Others photos, videos, labs analysis, site reports …
Focus
Data
Data
Information

Alstom Grid Inc.- P 6
SynchroPhasor Technology
− Next generation measurement technology. (voltages, currents, frequency, frequency
rate-of-change, etc)
− Higher resolution scans (e.g. 30 samples/second). ─ Improved visibility into dynamic grid conditions. ─ Early warning detection alerts. − Precise GPS time stamping. ─ Wide-area Situational Awareness. ─ Faster Post-Event Analysis. ─ Coordinated Wide-area Control Actions.
“PMUs: MRI quality , color 3-D visibility compared to
X-ray quality , B&W 2-D visibility of SCADA” – Terry Boston (CEO, PJM)
PMU ‘Sub-second’ Resolution
SCADA ‘Seconds’ Resolution
Phasor Measurement Units (PMUs)
p6
Alstom Grid Inc.- P 7
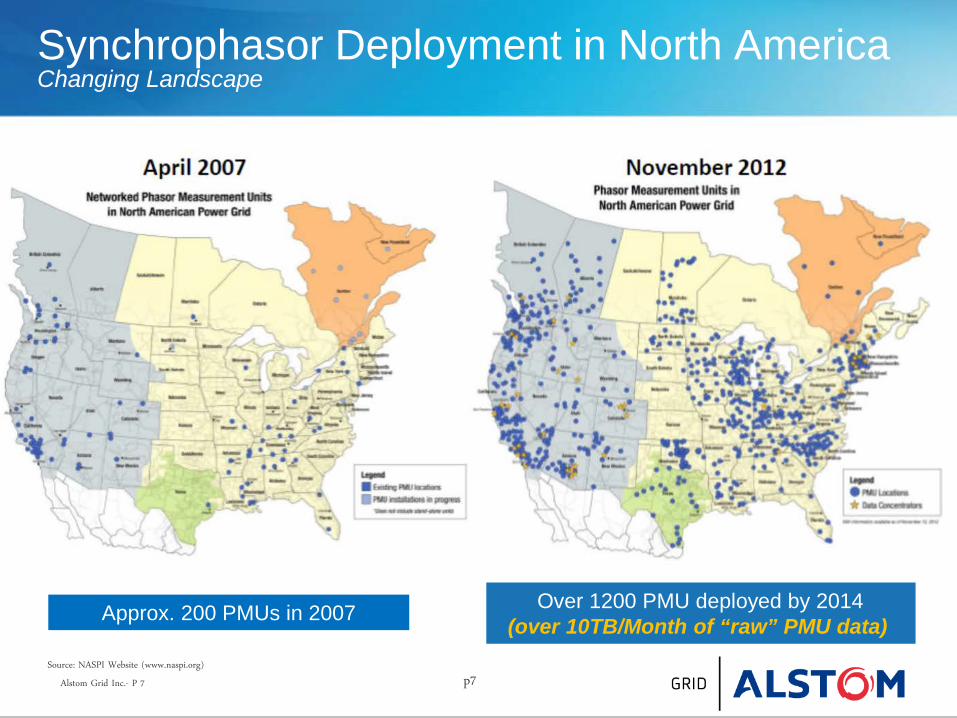
Synchrophasor Deployment in North America Changing Landscape
Source: NASPI Website (www.naspi.org)
p7
Approx. 200 PMUs in 2007 Over 1200 PMU deployed by 2014 (over 10TB/Month of “raw” PMU data)

Alstom Grid Inc.- P 8
Data Archiving
• Short Term Rolling Buffer (e.g. 3-12 months)
• Long Term Rolling Buffer (e.g. 1-5 years)
• Event Trigger (Snapshot)
• Transparent to user
• Limited only by hardware
• Flexible data rates
Short Term e.g. 50Hz
LongTerm e.g. 1Hz
Snapshot e.g. 50Hz
Search returns highest
resolution available

Alstom Grid Inc.- P 9
Data Compression (Lossy v.s. Lossless Compression)
(courtesy Dmitry Kosterev, BPA)

Alstom Grid Inc.- P 10
Approaches for Processing Big Data
• Temporal Processing (compression) – Pre-calculated analytics (results archived).
• Spatial Processing – Distributed Analytics (at substation & control center)
Control Center Analytics
RTUs IEDs PMUs
Control
Center
Analytics
Substation
Analytics
Meters
Data
Information

Alstom Grid Inc.- P 11
Control Center
Control Center Level Topology Processor
Control Center Level State EstimatorSystem
Topology
Power System Communication Network
RT-Database
SL-SESL-TP
Topology States
Substation
Substation
SubstationServer
Substation
SubstationServer
SubstationServer
Static-Database
SL-TP: Substation Level Topology Processor
SL-SE: Substation Level State Estimator
RT: Real Time
System-levelRT-Database
Control Center
Topology Processor
State Estimator
Real Time Database
Static Database
AnalogueMeasurements
DigitalStatus
CB/ND connections ND/Equip
Connections
EquipmentParameters
SystemTopology
SubstationRTU
SubstationRTU Substation
RTU
SCADA
Maintenance
Two-Level Linear State Estimator Example of distributed analytics
Currently underway in collaboration with WSU (Prof. Anjan Bose) Being deployed at PG&E under their Synchrophasor Project
Control Center
Substation

Alstom Grid Inc.- P 12
Data Analytics – Modes of Operation
REAL-TIME OFFLINE (AFTER-THE-FACT)
CONT
INUO
US
(PUS
H)
ON D
EMAN
D (P
ULL)
Centrally administered (modeled & configured). No end-user intervention.
Continually processed using a ‘Time-Window’ of data at periodic update rates.
View-only mode to review the results.
Analysis results may be archived.
Examples: Oscillatory Stability Monitoring. End-user or event triggered.
Little to none end-user intervention.
Single real-time view of the results.
Results are made available as soon as they are generated.
Examples: Event capture and reporting.
Typically ‘data mining’ analytics that “walk-through” large volumes of historical data in smaller chunks (i.e. batch processing).
May require initial metadata from end-user.
Results are presented once the entire processing is complete.
Examples: Baselining.
Locally processed by the end-user.
Fully interactive end-user experience; close feedback between data-analytics-UI.
Results are locally archived & presented to the end-user.
Examples: Post-Event Analysis.

Alstom Grid Inc.- P 13
WAMS IN OPERATIONS PLANNING
Examples of Real-Time Data Analytics
System Disturbance Characterization Oscillatory Stability Monitoring Understanding grid vulnerabilities Big data analytics
e-terra Phasor Point

Alstom Grid Inc.- P 14
System Disturbance Characterization Application Theory and Concepts
Concept: Illustration of Angle Movement in Response to a Disturbance
• Angle (δ) and Speed (ω) can’t change
instantaneously at a generator
• δ & ω near a generator influenced by generator angle
• δ & ω move more rapidly near the disturbance than far away
• Disturbance appears to propagate as a kind of “wave”
Alstom Grid Inc.- P 15
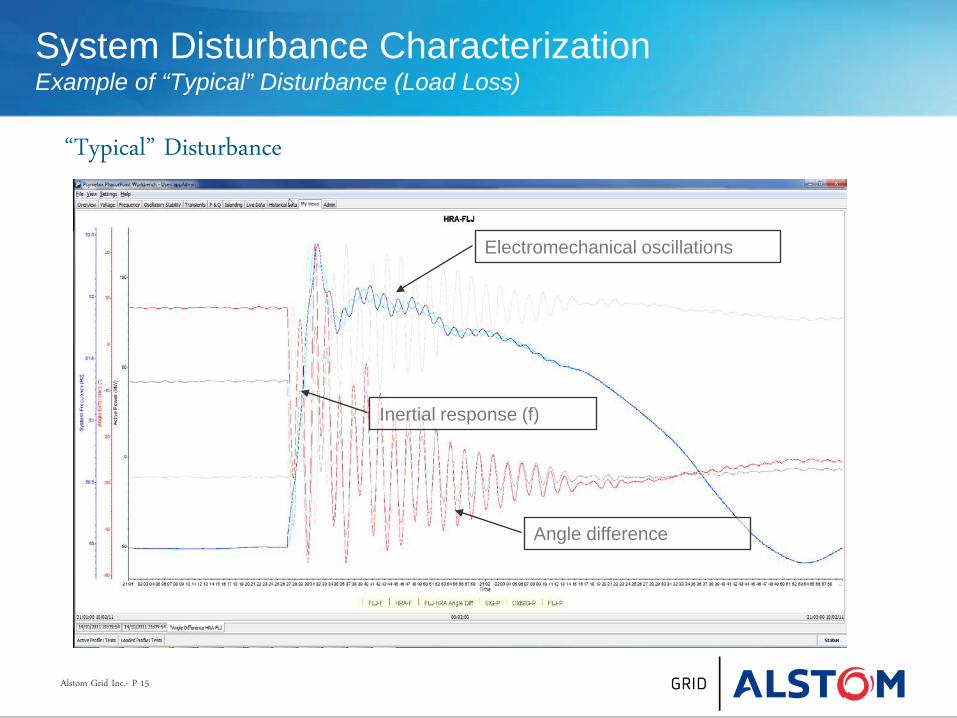
“Typical” Disturbance
Electromechanical oscillations
Inertial response (f)
Angle difference
System Disturbance Characterization Example of “Typical” Disturbance (Load Loss)

Alstom Grid Inc.- P 16
Freq (& angle) moves first close to disturbance
System Disturbance Characterization Example

Alstom Grid Inc.- P 17
Disturbance Characterization
Type Characteristics
Generation Trip - Frequency drops initially (RoC α amount of load loss) - First Angle/Frequency changes occurs near the disturbance - Oscillations due to the electromechanical responses
Load Loss - Similar to Generation Trip, but frequency moves upwards - Positive Frequency RoC
Line Trip - Increasing angle separation - Change in angle (with ringdown) - Frequency is not affected (but oscillations)
Cascading Failure Multiples types of disturbances in sequence: - Common mode generation loss - Sequential protection tripping - Storm damage
System Disturbance Characterization

Alstom Grid Inc.- P 18
System Disturbance Management
1) Detect disturbance
2) Locate trigger point
3) Detect event type
4) Estimate impact
1 sec

Alstom Grid Inc.- P 19
System Disturbance Characterization Analytic

Alstom Grid Inc.- P 20
Dynamic (Oscillatory) Stability Management
“The interconnected electric power grid is one of the largest dynamic system of today”
p20
• Numeric SCADA displays today
• With synchro-phasors – high resolution trend display
Rapidly changing digits on a numeric display
Oscillations seen by SCADA and PMU data
-5 0 5 10 15 20 2559.98
59.99
60
60.01
60.02
60.03
60.04
60.05
60.06
Time (sec)
Freq
uenc
y (Hz
)
Western Interconnection Frequencies - August 4 2000 Oscillation
Grand CouleeMalinDevers

Alstom Grid Inc.- P 21
Oscillatory Stability Monitoring Analytics
Mode Alarming: 3 min window, 5 sec update, for alarms
Mode Trending: 20-180 min window, 20 sec update, for analysis

Alstom Grid Inc.- P 22
Operational Warnings
• Observe mode behaviour
− Alarm if Abnormal, Near Instability
1/F MODE FREQUENCY
MODE DECAY TIME
EXP(-t/ ? )
Mode Freq
Mode decay time Exp(-t/τ) MODE AMPLITUDE
A
MODE PHASE
Mode Amplitude
Mode Phase In the Mode Selector Tabs the Frequency and
Damping of the poorest damped PDX result is
shown (5 seconds update rate)
Mode Shape, derived from the PDX, is shown
for each mode band
Return to Section Index

Alstom Grid Inc.- P 23
Example: Modes Observed in Colombia
• Ecuador Mode 0.49Hz
• Governor Mode 0.06Hz
Inter-area mode at 0.49Hz (Colombia-Ecuador).
Opposing phase in South
Governor common-mode: whole system oscillates
in coherent phase

Alstom Grid Inc.- P 24
WAMS IN OPERATIONS PLANNING
Examples of Offline Data Analytics
Model Validation (Ringdown Analysis) Dynamic Perfomance Baselining Automated Reporting

Alstom Grid Inc.- P 25
Offline Data Analytics
P25
Leveraging Synchrophasors in Operations Planning
Synchrophasor benefits for Post-Event Analysis
In the case of the 2007 Florida blackout, NERC investigators used
phasor data to create the sequence of events and determine the cause of
the blackout in only two days; in contrast, lacking high-speed, time-
synchronized disturbance data it took many engineer years of labor to
compile a correct sequence of events for the 2003 blackout in the
Northeast U.S. and Ontario.
NERC RAPIR Report, 2010.
• New Risk Indicators • Tune Real-Time Analytics • Quicker post-mortem analysis.
• Sequence of events & root cause analysis. Post Event Analysis
• Dynamic model verification.
• Generator model calibration.
• Load characterization.
Dynamic Model
Validation
• Assess dynamic performance of the grid.
• Steady-state angular separation.
• System disturbance impact measures.
Baselining
• Primary frequency (governing) response.
• Power System Stabilizer (PSS) tuning
Compliance
Monitoring

Alstom Grid Inc.- P 26
Model Validation – Comparison Modes Between PMU data and Simulation Data
Both PMU measured and simulated power contain 0.72Hz Mode
Original signals (in solid lines)
and reconstructed signals (in
dash lines)
Selected exactly same time period on both PMU measured power and simulated power.
PMU Observations (from PhasorPoint)
TSAT Simulations (from Powertech’s DSA)
Alstom Grid Inc.- P 27
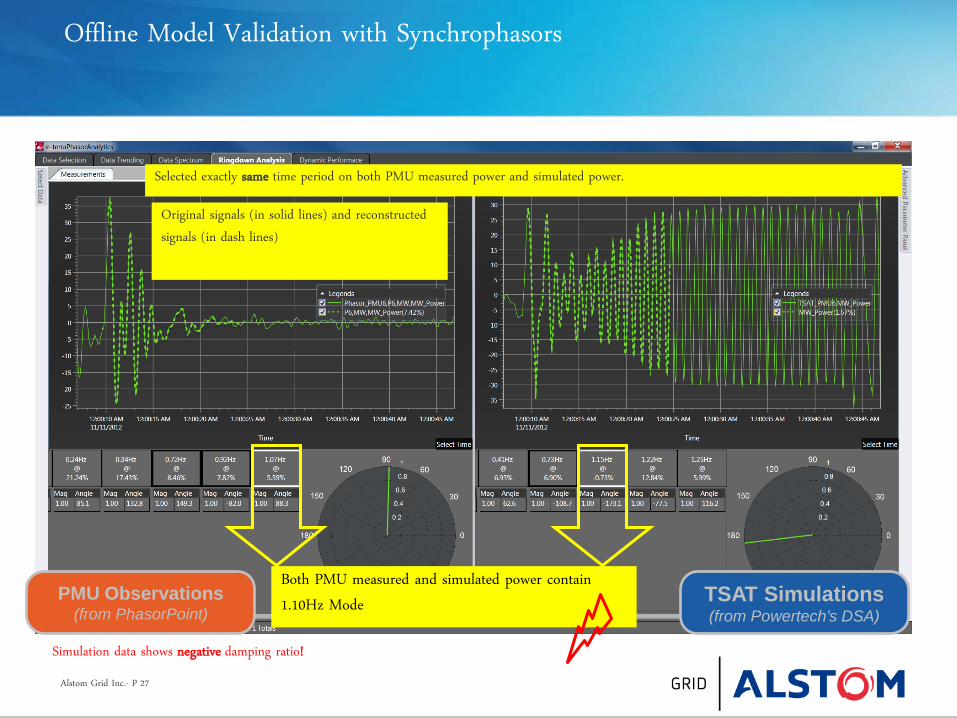
Offline Model Validation with Synchrophasors
Both PMU measured and simulated power contain
1.10Hz Mode
Simulation data shows negative damping ratio!
Selected exactly same time period on both PMU measured power and simulated power.
Original signals (in solid lines) and reconstructed
signals (in dash lines)
TSAT Simulations (from Powertech’s DSA)
PMU Observations (from PhasorPoint)

Alstom Grid Inc.- P 28
Offline Analysis Application (Dynamic Performance Trending)
Oscillatory mode trends
Apply post-analysis filters
“Filtered” oscillatory mode trends….

Alstom Grid Inc.- P 29
Monthly Performance Report
• Review of Modes of Oscillation − Baseline - normal behaviour patterns − Unusual events – source location
• Review Disturbances − Examples of Post-Event Analysis
• Threshold Settings (Statistics) − OSM Oscillation Alarms − SDM Disturbance parameters − Angle Behaviour Templates & Alarms
PSY-CLIENT-SDR1105-V1
CLIENT
May 2012
Regular Monthly Reporting

Alstom Grid Inc.- P 30
Closing Remarks
• Big data management/analytics require a holistic approach across multiple data sources serving different stakeholders.
• Synchrophasors are increasingly becoming a part of ‘Big Data’ within the energy industry (next generation SCADA)
• Approaches to handling big data include: − Temporal processing (compression) – i.e. pre-calculated results/stats. − Spatially distributed processing – i.e. processing at the meter/substation/control center
levels.
• Big data analytics operate in different modes including real-time, offline, continuous (automated), and on-demand. → combination of “push”/ “pull” mechanisms needed to satisfy these needs.