Embed Size (px)
Citation preview

Big Data Analysis for Air Connectivity and Competition
Toru Hasegawa Deputy Director, Economic Development, ICAO
5 December 2017 1
2
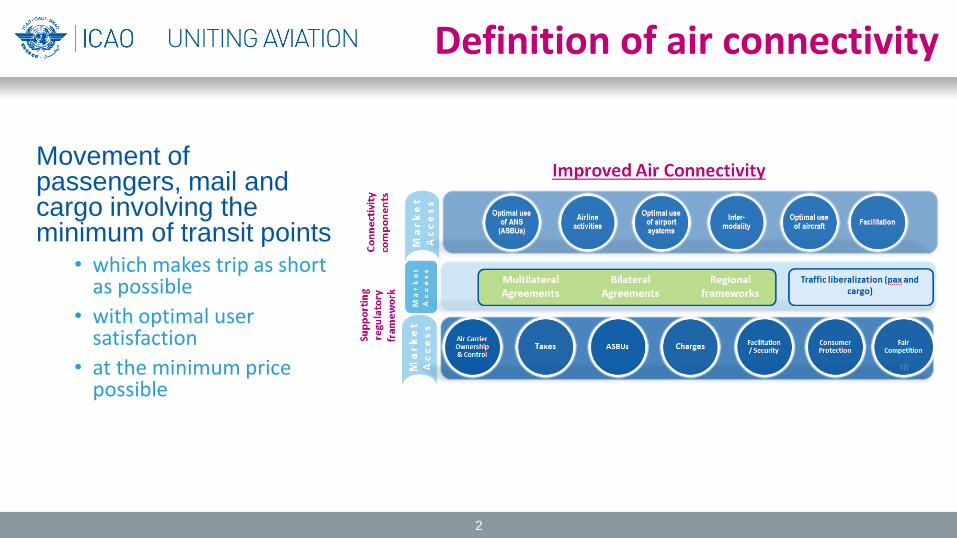
Definition of air connectivity
Movement of passengers, mail and cargo involving the minimum of transit points
• which makes trip as short as possible
• with optimal user satisfaction
• at the minimum price possible

Improved connectivity leads to economic growth
Passenger: 54% of international tourists arrive by air
3
Connectivity directly impacts UN Sustainable Development Goals (SDGs)
Cargo-Freight: 35% of the value of world trade shipped by air

Network dynamics: BOAC and Pan Am transatlantic system
1946-47 Mid-1950s
Anecdotal example 1
4
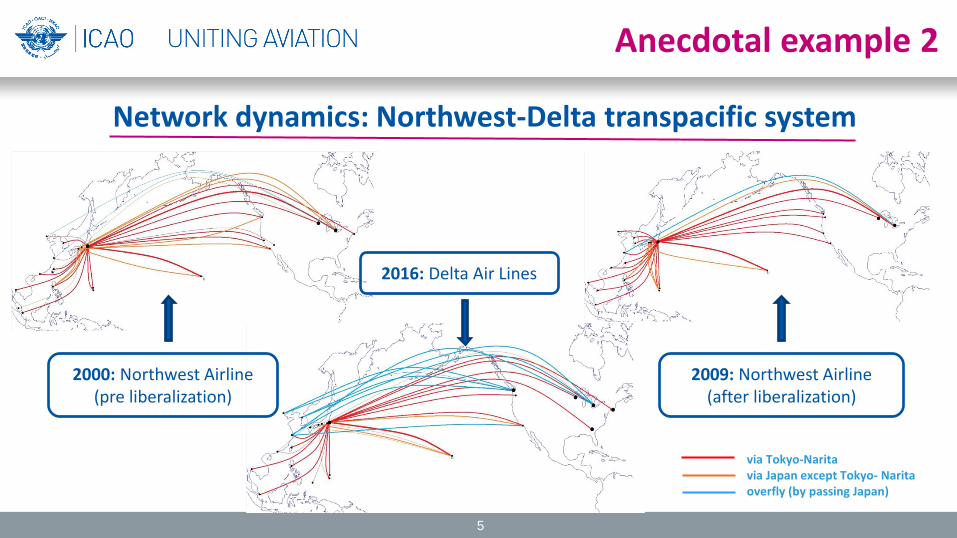
Network dynamics: Northwest-Delta transpacific system
2000: Northwest Airline (pre liberalization)
2016: Delta Air Lines
2009: Northwest Airline (after liberalization)
via Tokyo-Narita via Japan except Tokyo- Narita overfly (by passing Japan)
Anecdotal example 2
5
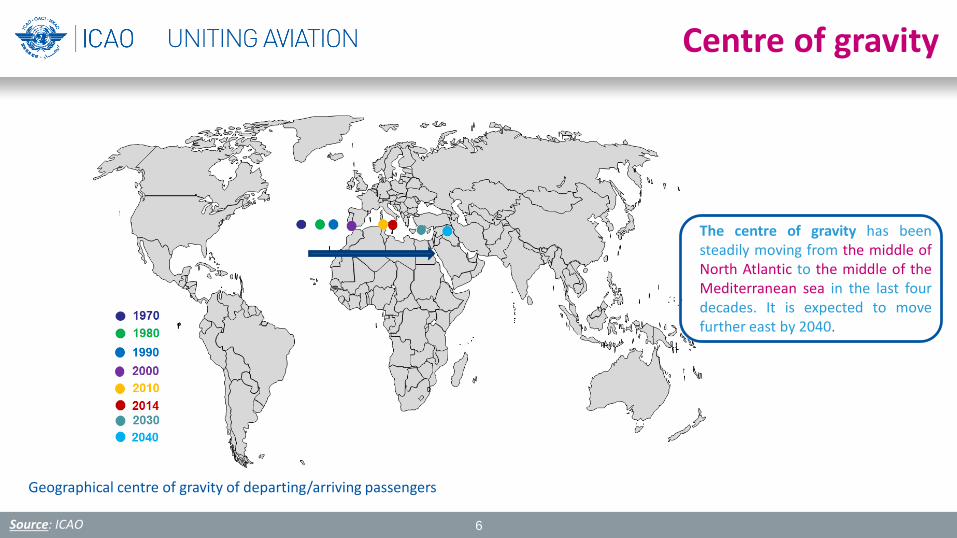
Centre of gravity
Geographical centre of gravity of departing/arriving passengers
Source: ICAO 6
The centre of gravity has been steadily moving from the middle of North Atlantic to the middle of the Mediterranean sea in the last four decades. It is expected to move further east by 2040.

7
Air route network 2015
Source: ICAO
8
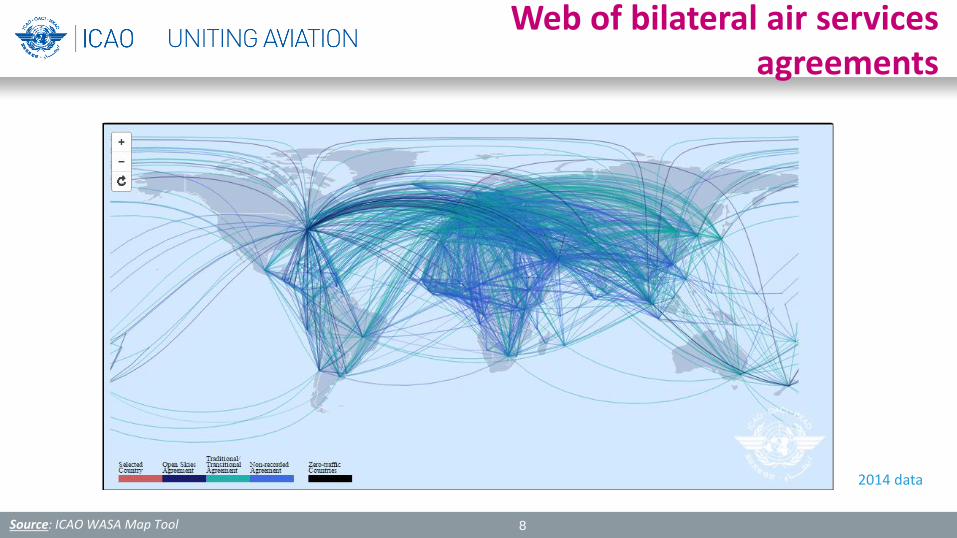
Web of bilateral air services agreements
Source: ICAO WASA Map Tool
2014 data
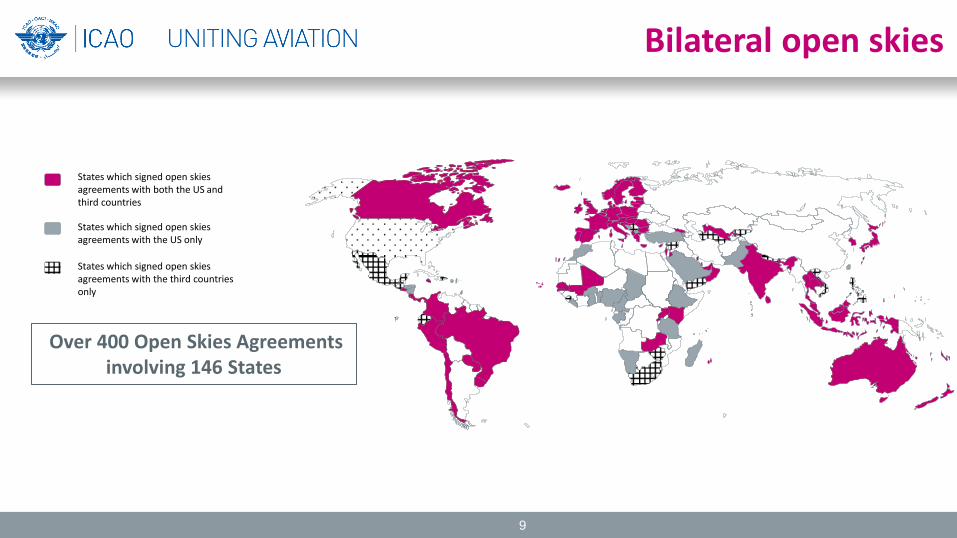
Bilateral open skies
States which signed open skies agreements with both the US and third countries
States which signed open skies agreements with the US only
States which signed open skies agreements with the third countries only
Over 400 Open Skies Agreements involving 146 States
9

Utilization of air connectivity
Comparing the number of markets made available by air transport liberalization (“available” or “reserved” connectivity) with the number of those markets having actual air services (“real” connectivity)
About 60% of available connectivity opportunities do not have direct flights
Source: ICAO 10
61%
45%
31%
28%
31%
40%
42%
24%
29%
45%
63%
56%
56%
47%
45%
55%
10%
6%
6%
16%
9%
10%
9%
18%
3%
3%
3%
3%
3%
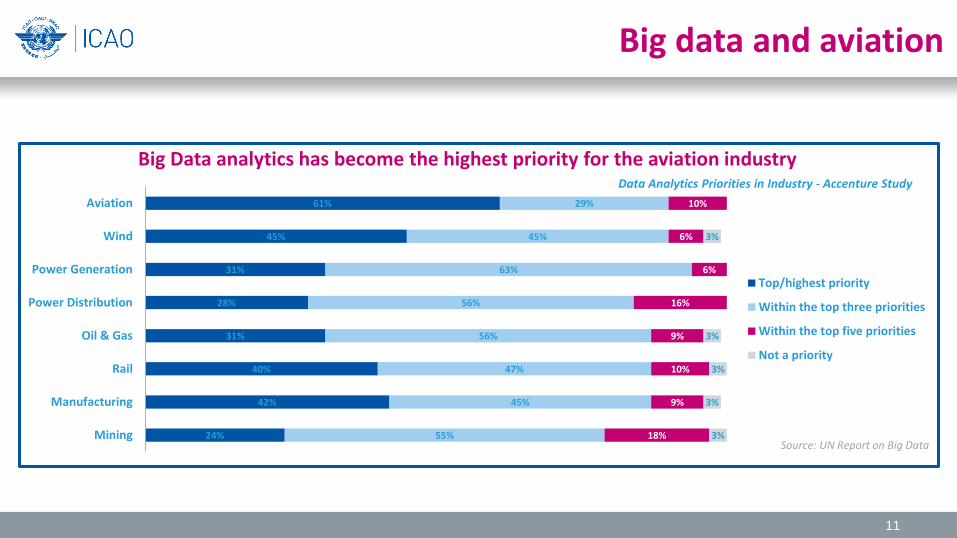
Aviation
Wind
Power Generation
Power Distribution
Oil & Gas
Rail
Manufacturing
Mining
Data Analytics Priorities in Industry - Accenture Study
Top/highest priority
Within the top three priorities
Within the top five priorities
Not a priority
Source : https://www.accenture.com/us-en/insight-industrial-internet-competitive-landscape-industries.aspx
Big Data analytics has become the highest priority for the aviation industry
Source: UN Report on Big Data
11
Big data and aviation
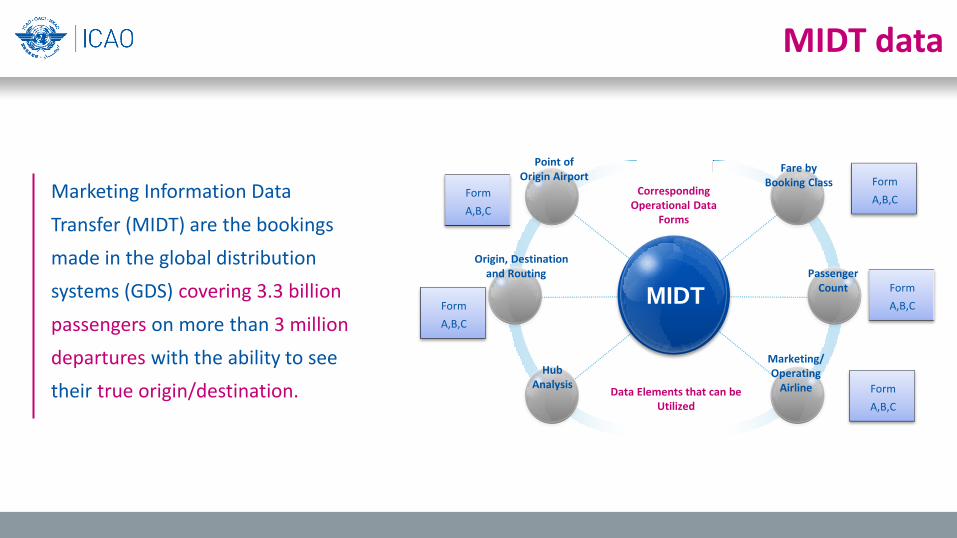
Marketing Information Data
Transfer (MIDT) are the bookings
made in the global distribution
systems (GDS) covering 3.3 billion
passengers on more than 3 million
departures with the ability to see
their true origin/destination.
12
Fare by Booking Class
Passenger Count
Marketing/ Operating
Airline
Point of Origin Airport
Origin, Destination and Routing
Hub Analysis
MIDT
Data Elements that can be Utilized
Corresponding Operational Data
Forms
Form
A,B,C
Form
A,B,C
Form
A,B,C
Form
A,B,C
Form
A,B,C
MIDT data
Reflections on Big Data
Big Data and the UN Big Data and Aviation ICAO’s Engagement Way Forward
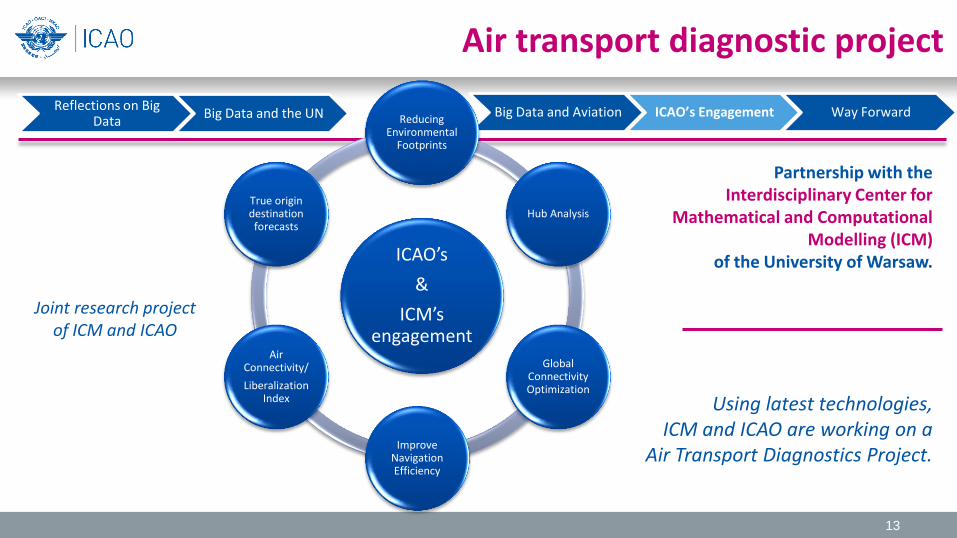
ICAO’s
&
ICM’s engagement
Reducing Environmental
Footprints
Hub Analysis
Global Connectivity Optimization
Improve Navigation Efficiency
Air Connectivity/
Liberalization Index
True origin destination forecasts
Using latest technologies, ICM and ICAO are working on a
Air Transport Diagnostics Project.
Partnership with the Interdisciplinary Center for
Mathematical and Computational Modelling (ICM)
of the University of Warsaw.
13
Joint research project of ICM and ICAO
Air transport diagnostic project
14
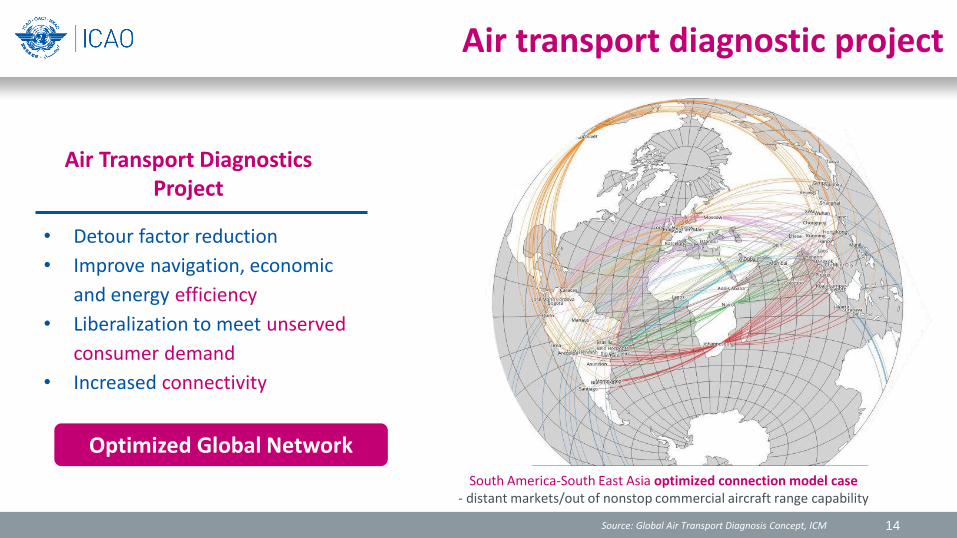
Air Transport Diagnostics Project
• Detour factor reduction
• Improve navigation, economic
and energy efficiency
• Liberalization to meet unserved
consumer demand
• Increased connectivity
South America-South East Asia optimized connection model case - distant markets/out of nonstop commercial aircraft range capability
Source: Global Air Transport Diagnosis Concept, ICM
Optimized Global Network
Air transport diagnostic project
Source: ICAO, ICM University of Warsaw 15
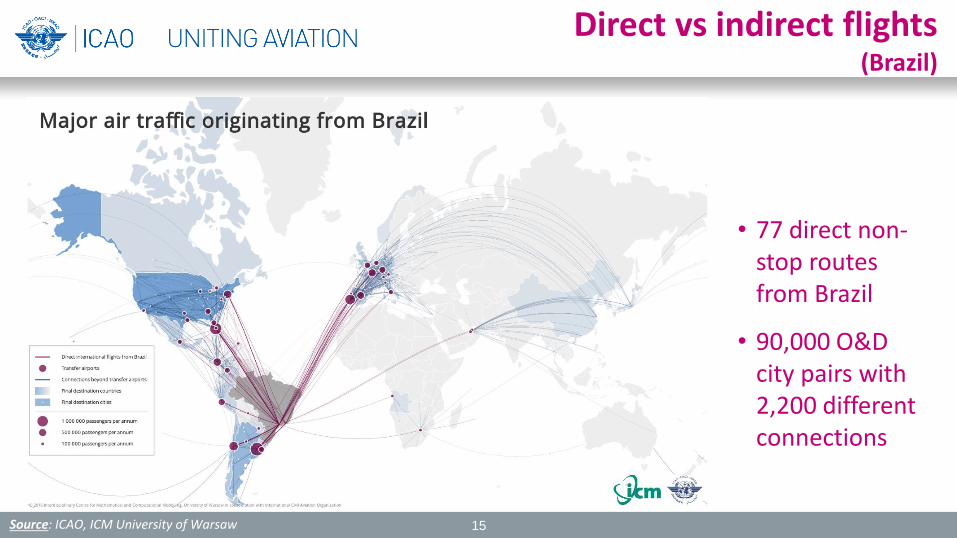
• 77 direct non-stop routes from Brazil
• 90,000 O&D city pairs with 2,200 different connections
Direct vs indirect flights (Brazil)
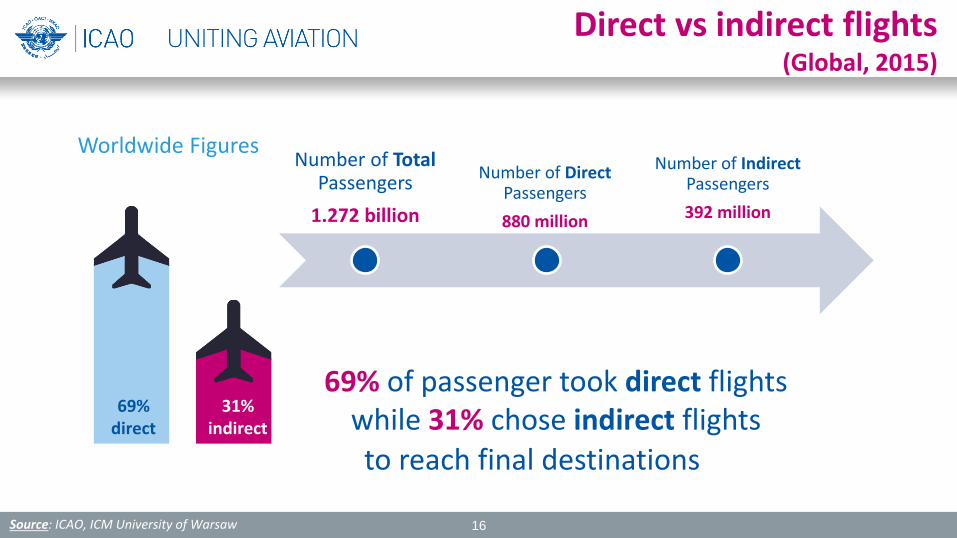
69% of passenger took direct flights while 31% chose indirect flights
69% direct
31% indirect
Number of Total Passengers
1.272 billion
Number of Direct Passengers
880 million
Number of Indirect Passengers
392 million
Direct vs indirect flights (Global, 2015)
Source: ICAO, ICM University of Warsaw 16
Worldwide Figures
to reach final destinations
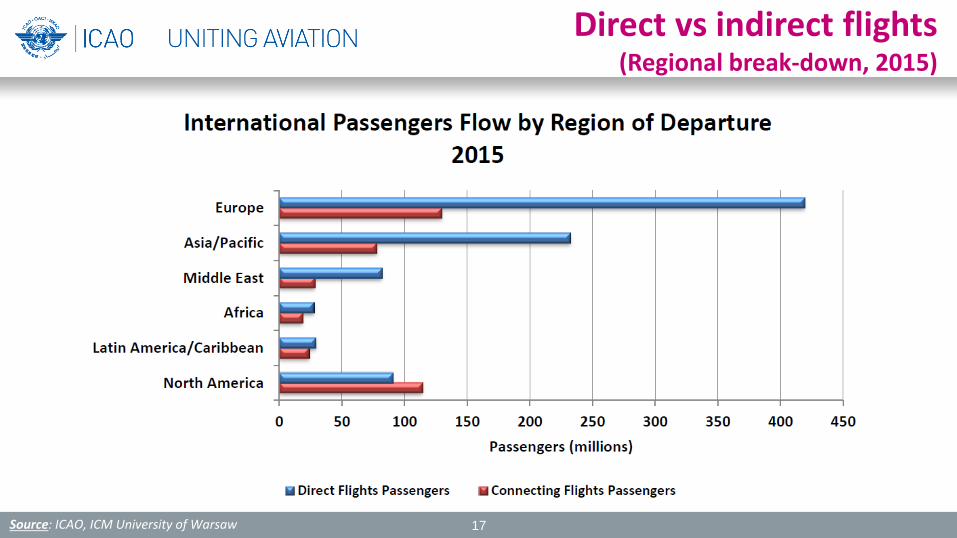
Direct vs indirect flights (Regional break-down, 2015)
Source: ICAO, ICM University of Warsaw 17
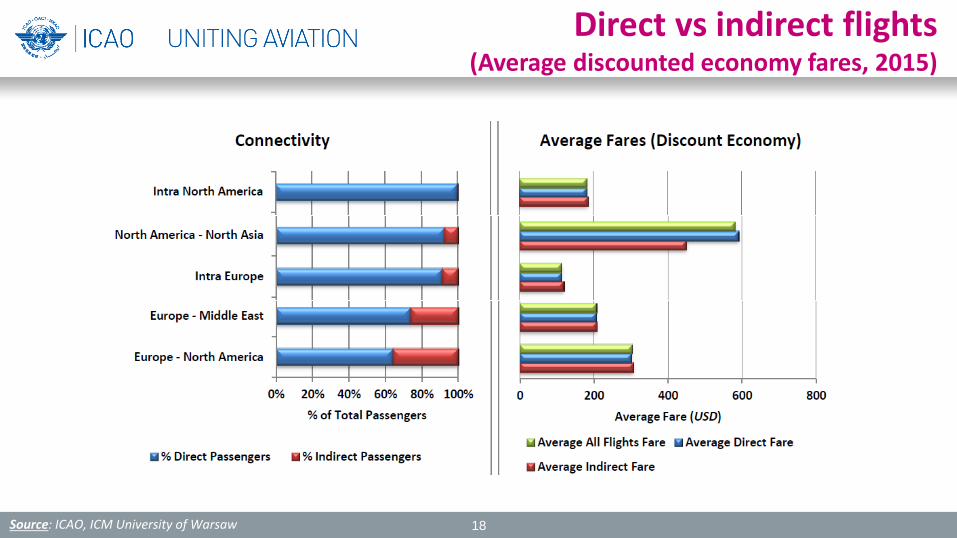
Direct vs indirect flights (Average discounted economy fares, 2015)
Source: ICAO, ICM University of Warsaw 18
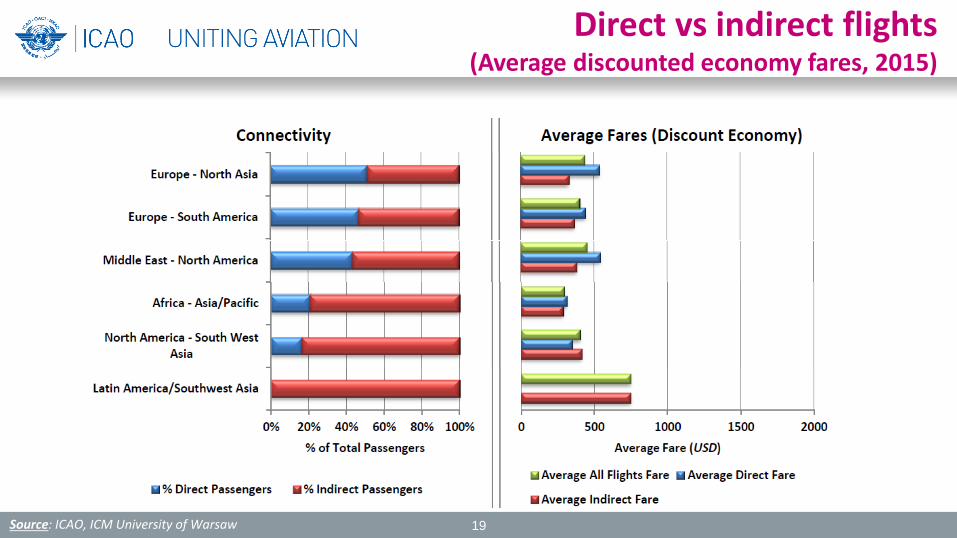
Direct vs indirect flights (Average discounted economy fares, 2015)
Source: ICAO, ICM University of Warsaw 19

Measurement of air connectivity by State
20
Global Air Connectivity Index
Source: MIDT Big data
The World Bank uses this connectivity index in it’s major report which focuses on understanding the role of connectivity in economic growth and development
Departure Destination Country Count
2015 Proportion of 2015
Pax 0 Stop (Direct)
2015 1 Stop 2015
2 Stops 2015
Weighted Average Stops 2015
United States 224 8.26% 43.03% 49.75% 7.22% 0.64
United Kingdom 222 6.72% 81.74% 16.78% 1.48% 0.20
Germany 219 5.13% 73.48% 24.57% 1.95% 0.28
Spain 215 4.61% 81.34% 16.77% 1.89% 0.21
China 215 4.38% 72.45% 25.70% 1.85% 0.29
France 217 3.72% 75.79% 22.51% 1.70% 0.26
Italy 213 3.66% 71.80% 25.67% 2.53% 0.31
Japan 215 2.80% 73.74% 23.21% 3.05% 0.29
United Arab Emirates 212 2.21% 85.58% 13.56% 0.86% 0.15
Republic of Korea 212 2.15% 84.70% 14.04% 1.26% 0.17
Canada 218 2.14% 51.79% 41.02% 7.18% 0.55
Thailand 214 2.13% 74.48% 23.01% 2.51% 0.28
India 213 1.99% 50.89% 43.04% 6.07% 0.55
Turkey 206 1.91% 75.22% 23.22% 1.56% 0.26
Hong Kong (China SAR) 213 1.86% 86.61% 12.76% 0.63% 0.14
Measurement of air connectivity by State
21
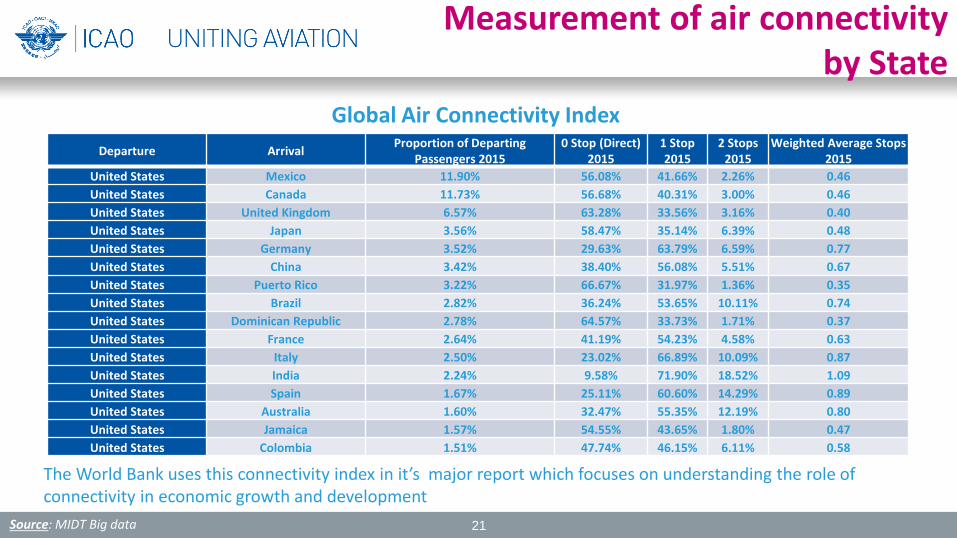
Global Air Connectivity Index
Source: MIDT Big data
Departure Arrival Proportion of Departing
Passengers 2015 0 Stop (Direct)
2015 1 Stop 2015
2 Stops 2015
Weighted Average Stops 2015
United States Mexico 11.90% 56.08% 41.66% 2.26% 0.46
United States Canada 11.73% 56.68% 40.31% 3.00% 0.46
United States United Kingdom 6.57% 63.28% 33.56% 3.16% 0.40
United States Japan 3.56% 58.47% 35.14% 6.39% 0.48
United States Germany 3.52% 29.63% 63.79% 6.59% 0.77
United States China 3.42% 38.40% 56.08% 5.51% 0.67
United States Puerto Rico 3.22% 66.67% 31.97% 1.36% 0.35
United States Brazil 2.82% 36.24% 53.65% 10.11% 0.74
United States Dominican Republic 2.78% 64.57% 33.73% 1.71% 0.37
United States France 2.64% 41.19% 54.23% 4.58% 0.63
United States Italy 2.50% 23.02% 66.89% 10.09% 0.87
United States India 2.24% 9.58% 71.90% 18.52% 1.09
United States Spain 1.67% 25.11% 60.60% 14.29% 0.89
United States Australia 1.60% 32.47% 55.35% 12.19% 0.80
United States Jamaica 1.57% 54.55% 43.65% 1.80% 0.47
United States Colombia 1.51% 47.74% 46.15% 6.11% 0.58
The World Bank uses this connectivity index in it’s major report which focuses on understanding the role of connectivity in economic growth and development
22
Case Study 1: China - Africa
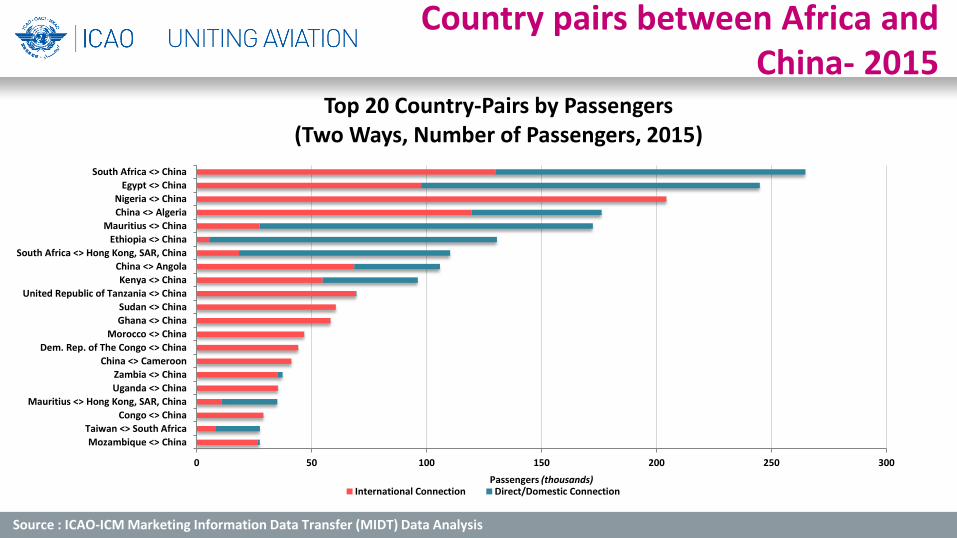
0 50 100 150 200 250 300
Mozambique <> China
Taiwan <> South Africa
Congo <> China
Mauritius <> Hong Kong, SAR, China
Uganda <> China
Zambia <> China
China <> Cameroon
Dem. Rep. of The Congo <> China
Morocco <> China
Ghana <> China
Sudan <> China
United Republic of Tanzania <> China
Kenya <> China
China <> Angola
South Africa <> Hong Kong, SAR, China
Ethiopia <> China
Mauritius <> China
China <> Algeria
Nigeria <> China
Egypt <> China
South Africa <> China
Passengers (thousands)
Top 20 Country-Pairs by Passengers (Two Ways, Number of Passengers, 2015)
International Connection Direct/Domestic Connection
Country pairs between Africa and China- 2015
Source : ICAO-ICM Marketing Information Data Transfer (MIDT) Data Analysis
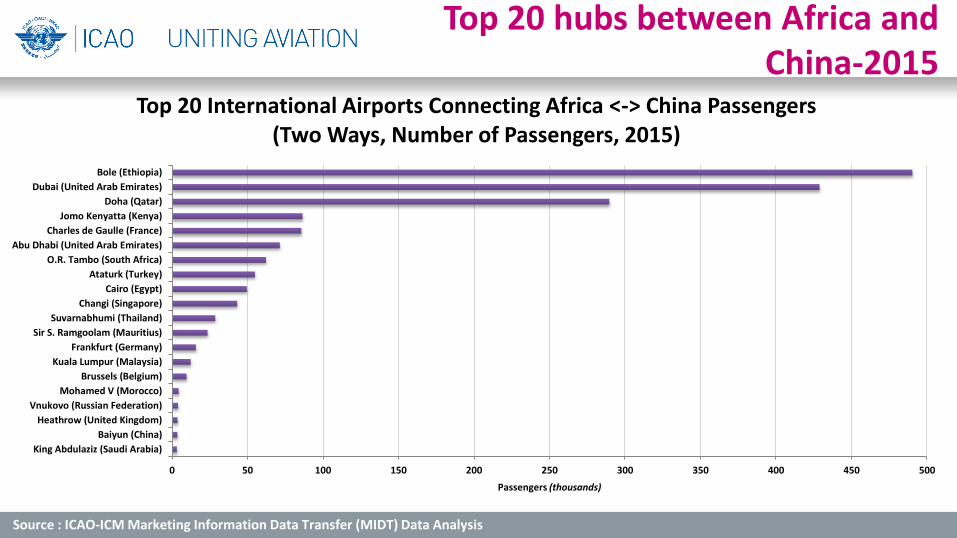
Top 20 hubs between Africa and China-2015
0 50 100 150 200 250 300 350 400 450 500
King Abdulaziz (Saudi Arabia)
Baiyun (China)
Heathrow (United Kingdom)
Vnukovo (Russian Federation)
Mohamed V (Morocco)
Brussels (Belgium)
Kuala Lumpur (Malaysia)
Frankfurt (Germany)
Sir S. Ramgoolam (Mauritius)
Suvarnabhumi (Thailand)
Changi (Singapore)
Cairo (Egypt)
Ataturk (Turkey)
O.R. Tambo (South Africa)
Abu Dhabi (United Arab Emirates)
Charles de Gaulle (France)
Jomo Kenyatta (Kenya)
Doha (Qatar)
Dubai (United Arab Emirates)
Bole (Ethiopia)
Passengers (thousands)
Top 20 International Airports Connecting Africa <-> China Passengers (Two Ways, Number of Passengers, 2015)
Source : ICAO-ICM Marketing Information Data Transfer (MIDT) Data Analysis
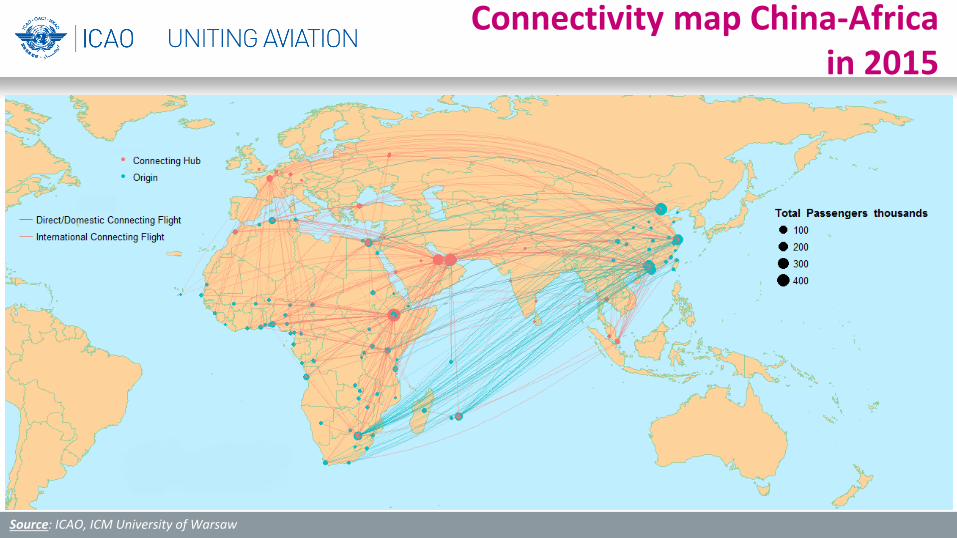
Connectivity map China-Africa in 2015
Source: ICAO, ICM University of Warsaw
26
Case Study 2: Dominican Republic

0
2
4
6
8
10
12
2011 2012 2013 2014 2015
Pas
sen
gers
(m
illio
ns)
International Traffic from/to Dominican Republic (All Carriers, Number of Passengers)
Direct Domestic Connection International Connection
Traffic development
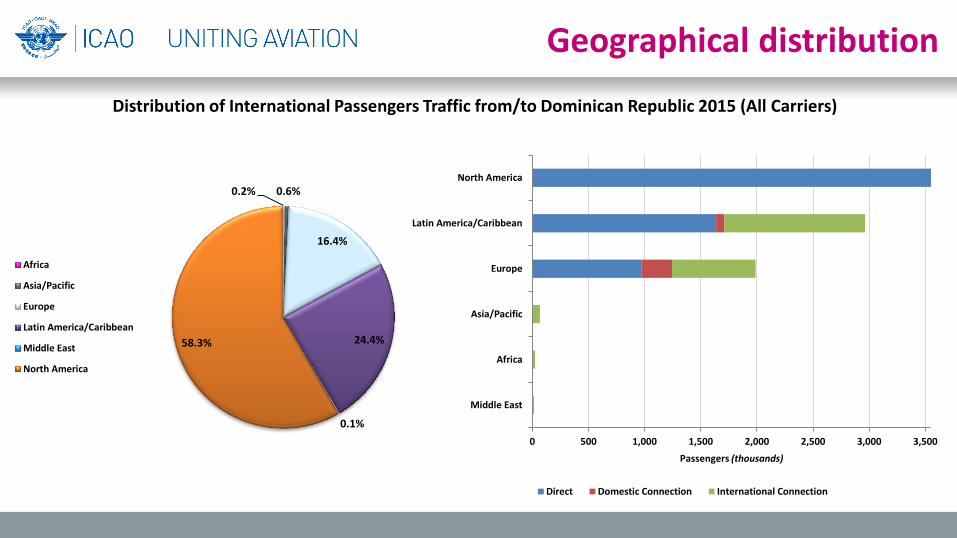
0.2% 0.6%
16.4%
24.4%
0.1%
58.3%
Africa
Asia/Pacific
Europe
Latin America/Caribbean
Middle East
North America
0 500 1,000 1,500 2,000 2,500 3,000 3,500
Middle East
Africa
Asia/Pacific
Europe
Latin America/Caribbean
North America
Passengers (thousands)
Direct Domestic Connection International Connection
Distribution of International Passengers Traffic from/to Dominican Republic 2015 (All Carriers)
Geographical distribution
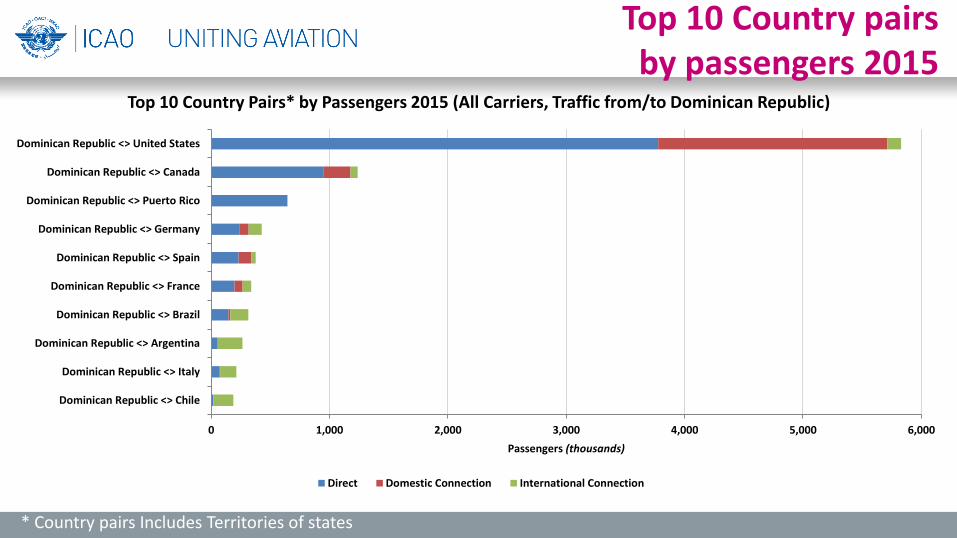
0 1,000 2,000 3,000 4,000 5,000 6,000
Dominican Republic <> Chile
Dominican Republic <> Italy
Dominican Republic <> Argentina
Dominican Republic <> Brazil
Dominican Republic <> France
Dominican Republic <> Spain
Dominican Republic <> Germany
Dominican Republic <> Puerto Rico
Dominican Republic <> Canada
Dominican Republic <> United States
Passengers (thousands)
Top 10 Country Pairs* by Passengers 2015 (All Carriers, Traffic from/to Dominican Republic)
Direct Domestic Connection International Connection
* Country pairs Includes Territories of states
Top 10 Country pairs by passengers 2015
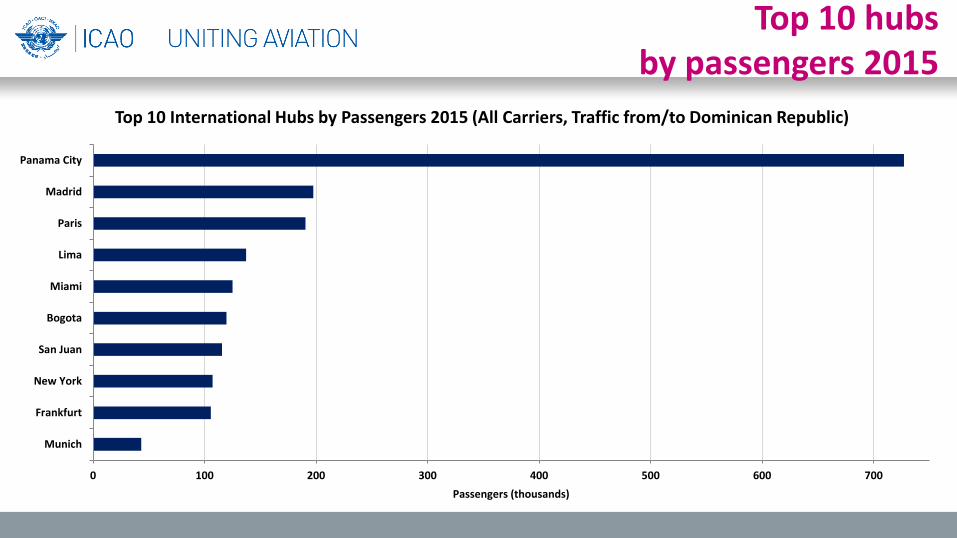
0 100 200 300 400 500 600 700
Munich
Frankfurt
New York
San Juan
Bogota
Miami
Lima
Paris
Madrid
Panama City
Passengers (thousands)
Top 10 International Hubs by Passengers 2015 (All Carriers, Traffic from/to Dominican Republic)
Top 10 hubs by passengers 2015
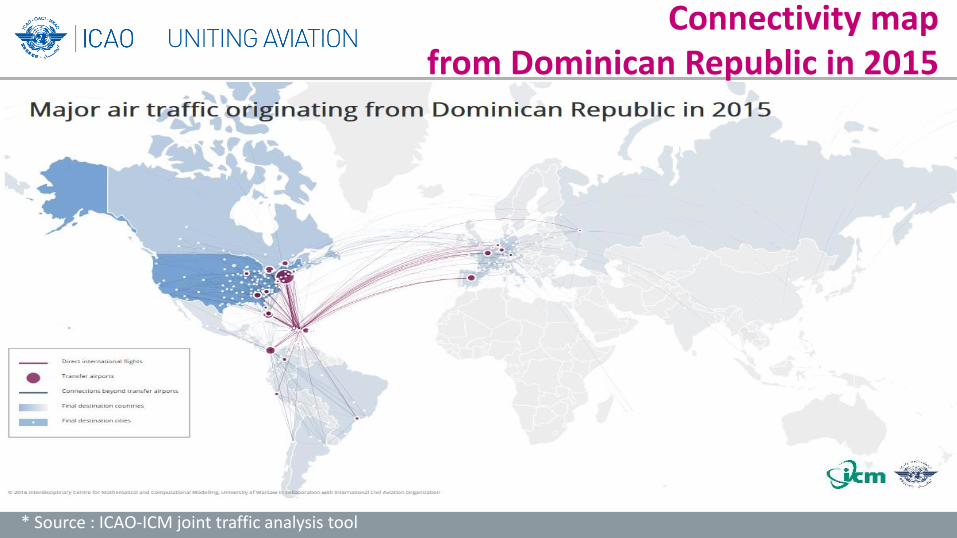
* Source : ICAO-ICM joint traffic analysis tool
Connectivity map from Dominican Republic in 2015
32
Case Study 3: Incheon Airport

Direct destinations of ICN-origin passengers
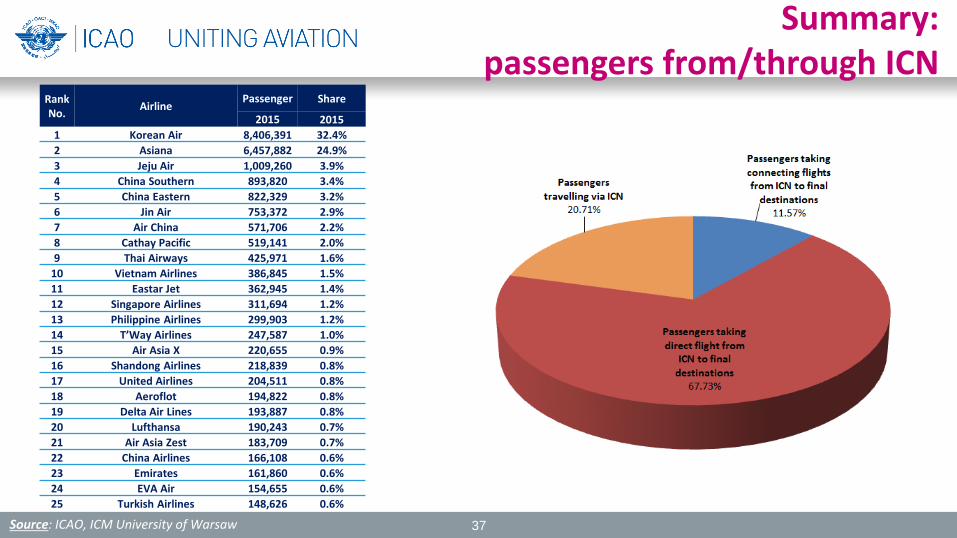
17.7 million passengers originating from ICN (67.7% of total passengers from/through ICN) took direct flights to reach 173 final destinations
Source: ICAO, ICM University of Warsaw 33
Rank Passenger Share Cumulative
No. 2015 2015 Share
1 Hong Kong (HKG) 1,214,541 6.9% 6.9%
2 Bangkok (BKK) 843,494 4.8% 11.6%
3 Shanghai (PVG) 765,602 4.3% 16.0%
4 Osaka (KIX) 721,018 4.1% 20.1%
5 Taipei (TPE) 635,905 3.6% 23.7%
6 Qingdao (TAO) 597,793 3.4% 27.0%
7 Tokyo (NRT) 565,643 3.2% 30.2%
8 Fukuoka (FUK) 487,705 2.8% 33.0%
9 Manilla (MNL) 483,088 2.7% 35.7%
10 Beijing (PEK) 467,604 2.6% 38.4%
11 Hanoi (HAN) 467,575 2.6% 41.0%
12 Singapore (SIN) 445,889 2.5% 43.5%
13 Guam (GUM) 342,077 1.9% 45.5%
14 Cebu (CEB) 332,264 1.9% 47.4%
15 Kuala Lumpur (KUL) 303,855 1.7% 49.1%
16 Guangzhou (CAN) 268,880 1.5% 50.6%
17 Los Angeles (LAX) 262,004 1.5% 52.1%
18 Ho Chi Minh City (SGN) 250,214 1.4% 53.5%
19 Tianjin (TSN) 243,473 1.4% 54.9%
20 Dalian (DLC) 229,488 1.3% 56.2%
21 Shenyang (SHE) 220,884 1.2% 57.4%
22 Shenzhen (SZX) 208,843 1.2% 58.6%
23 Yanji (YNJ) 208,444 1.2% 59.8%
24 Phuket (HKT) 196,833 1.1% 60.9%
25 Saipan (SPN) 188,655 1.1% 62.0%
From ICN to:
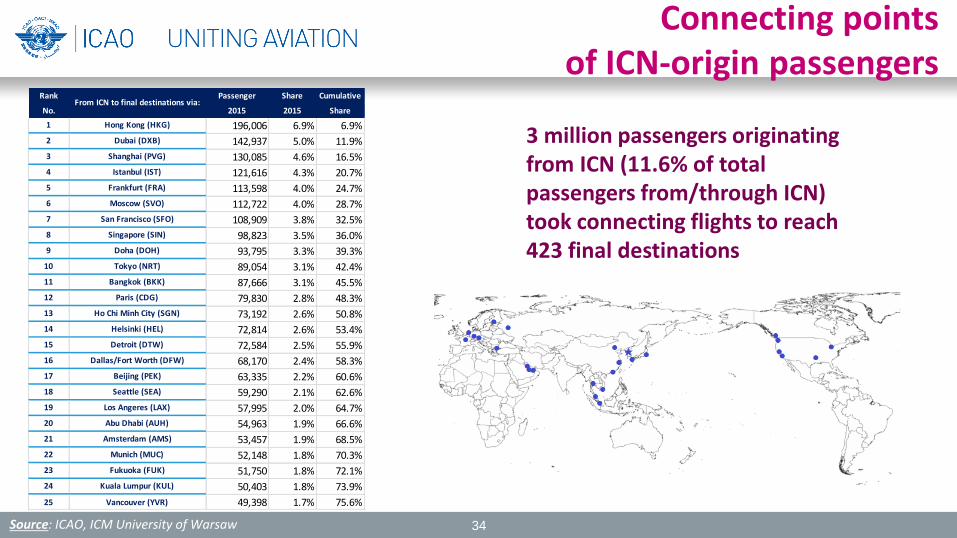
Connecting points of ICN-origin passengers
3 million passengers originating from ICN (11.6% of total passengers from/through ICN) took connecting flights to reach 423 final destinations
Source: ICAO, ICM University of Warsaw 34
Rank Passenger Share Cumulative
No. 2015 2015 Share
1 Hong Kong (HKG) 196,006 6.9% 6.9%
2 Dubai (DXB) 142,937 5.0% 11.9%
3 Shanghai (PVG) 130,085 4.6% 16.5%
4 Istanbul (IST) 121,616 4.3% 20.7%
5 Frankfurt (FRA) 113,598 4.0% 24.7%
6 Moscow (SVO) 112,722 4.0% 28.7%
7 San Francisco (SFO) 108,909 3.8% 32.5%
8 Singapore (SIN) 98,823 3.5% 36.0%
9 Doha (DOH) 93,795 3.3% 39.3%
10 Tokyo (NRT) 89,054 3.1% 42.4%
11 Bangkok (BKK) 87,666 3.1% 45.5%
12 Paris (CDG) 79,830 2.8% 48.3%
13 Ho Chi Minh City (SGN) 73,192 2.6% 50.8%
14 Helsinki (HEL) 72,814 2.6% 53.4%
15 Detroit (DTW) 72,584 2.5% 55.9%
16 Dallas/Fort Worth (DFW) 68,170 2.4% 58.3%
17 Beijing (PEK) 63,335 2.2% 60.6%
18 Seattle (SEA) 59,290 2.1% 62.6%
19 Los Angeres (LAX) 57,995 2.0% 64.7%
20 Abu Dhabi (AUH) 54,963 1.9% 66.6%
21 Amsterdam (AMS) 53,457 1.9% 68.5%
22 Munich (MUC) 52,148 1.8% 70.3%
23 Fukuoka (FUK) 51,750 1.8% 72.1%
24 Kuala Lumpur (KUL) 50,403 1.8% 73.9%
25 Vancouver (YVR) 49,398 1.7% 75.6%
From ICN to final destinations via:

Rank No.
Connecting point Final Destination Passenger
2015
1 Honolulu (HNL) Kahului (OGG) 20,353
2 Shanghai (PVG) Zhangjiajie (DYG) 18,920
3 Ho Chi Minh City (SGN) Singapore (SIN) 18,547
4 Bangkok (BKK) Phuket (HKT) 18,104
5 Singapore (SIN) Male (MLE) 14,867
6 Ho Chi Minh City (SGN) Siem Reap (REP) 14,610
7 Hong Kong (HKG) Singapore (SIN) 13,611
8 Vancouver (YVR) Toronto (YYZ) 13,005
9 San Francisco (SFO) Los Angeles (LAX) 12,811
10 Shanghai (PVG) Taipei (TPE) 12,151
11 Fukuoka (FUK) Busan (PUS) 11,940
12 Hong Kong (HKG) London (LHR) 11,054
13 Bangkok (BKK) Koh Samui (USM) 9,891
14 Moscow (SVO) Rome (FCO) 9,607
15 Shanghai (PVG) Wenzhou (WNZ) 9,422
16 Doha (DOH) Madrid (MAD) 9,294
17 Frankfurt (FRA) London (LHR) 9,048
18 Hanoi (HAN) Bangkok (BKK) 8,975
19 Moscow (SVO) Madrid (MAD) 8,922
20 Hong Kong (HKG) Melbourne (MEL) 8,726
21 Hong Kong (HKG) Bangkok (BKK) 8,616
22 Dallas/Fort Worth (DFW) Cancun (CUN) 8,603
23 Ho Chi Minh City (SGN) Bangkok (BKK) 8,483
24 San Francisco (SFO) Las Vegas (LAS) 8,446
25 Vancouver (YVR) Calgary (YYC) 8,330
Top 25 connecting routes from ICN
Source: ICAO, ICM University of Warsaw 35

Passengers travelling via ICN
5.4 million passengers connected at ICN (20.7% of total passengers from/through ICN) to reach 193 final destinations
Source: ICAO, ICM University of Warsaw 36
Rank Passenger Share Cumulative
No. 2015 2015 Share
1 Los Angeles (LAX) 208,483 4.2% 4.2%
2 Manilla (MNL) 194,365 3.9% 8.1%
3 Tokyo (NRT) 187,726 3.8% 11.9%
4 Busan (PUS) 163,250 3.3% 15.2%
5 Osaka (KIX) 160,880 3.3% 18.5%
6 Fukuoka (FUK) 134,240 2.7% 21.2%
7 Shanghai (PVG) 132,386 2.7% 23.9%
8 New York (JFK) 123,458 2.5% 26.4%
9 Bangkok (BKK) 121,569 2.5% 28.8%
10 Hong Kong (HKG) 117,563 2.4% 31.2%
11 Ho Chi Minh City (SGN) 112,662 2.3% 33.5%
12 Nagoya (NGO) 102,107 2.1% 35.5%
13 Honolulu (HNL) 95,860 1.9% 37.5%
14 Qingdao (TAO) 92,130 1.9% 39.3%
15 Beijing (PEK) 91,586 1.9% 41.2%
16 Denpasar (DPS) 82,003 1.7% 42.8%
17 Dalian (DLC) 80,047 1.6% 44.5%
18 Singapore (SIN) 79,760 1.6% 46.1%
19 Sapporo (CTS) 78,072 1.6% 47.7%
20 San Francisco (SFO) 75,679 1.5% 49.2%
21 Shenyang (SHE) 71,773 1.5% 50.6%
22 Vladivostok (VVO) 67,410 1.4% 52.0%
23 Saipan (SPN) 66,263 1.3% 53.3%
24 Seattle (SEA) 64,396 1.3% 54.6%
25 Jakarta (CGK) 59,786 1.2% 55.8%
Through ICN to:
Rank No.
Airline Passenger Share
2015 2015
1 Korean Air 8,406,391 32.4%
2 Asiana 6,457,882 24.9%
3 Jeju Air 1,009,260 3.9%
4 China Southern 893,820 3.4%
5 China Eastern 822,329 3.2%
6 Jin Air 753,372 2.9%
7 Air China 571,706 2.2%
8 Cathay Pacific 519,141 2.0%
9 Thai Airways 425,971 1.6%
10 Vietnam Airlines 386,845 1.5%
11 Eastar Jet 362,945 1.4%
12 Singapore Airlines 311,694 1.2%
13 Philippine Airlines 299,903 1.2%
14 T’Way Airlines 247,587 1.0%
15 Air Asia X 220,655 0.9%
16 Shandong Airlines 218,839 0.8%
17 United Airlines 204,511 0.8%
18 Aeroflot 194,822 0.8%
19 Delta Air Lines 193,887 0.8%
20 Lufthansa 190,243 0.7%
21 Air Asia Zest 183,709 0.7%
22 China Airlines 166,108 0.6%
23 Emirates 161,860 0.6%
24 EVA Air 154,655 0.6%
25 Turkish Airlines 148,626 0.6%
Summary: passengers from/through ICN
Source: ICAO, ICM University of Warsaw 37
38
Case Study 4: Country-Pair Analysis
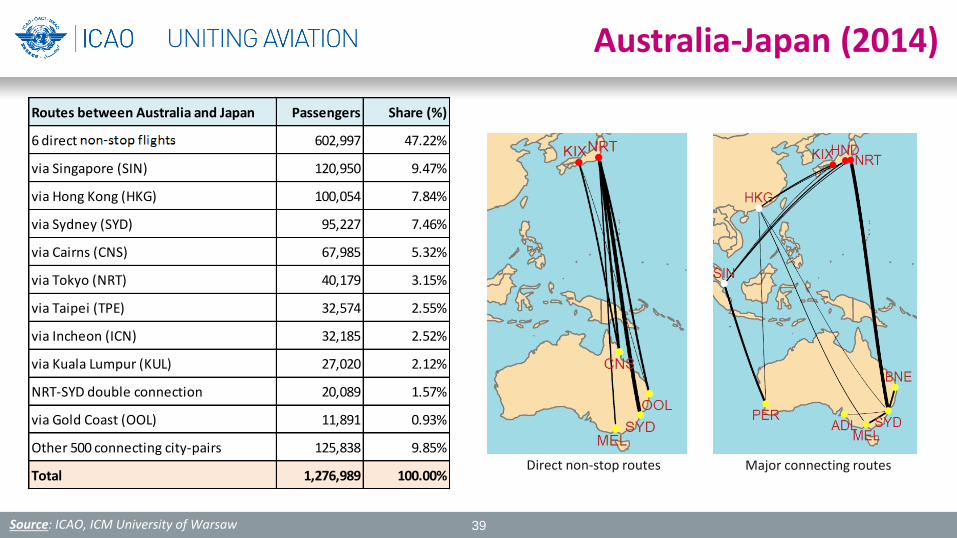
Australia-Japan (2014)
Source: ICAO, ICM University of Warsaw 39
Direct non-stop routes Major connecting routes
Routes between Australia and Japan Passengers Share (%)
6 direct on-stop flights 602,997 47.22%
via Singapore (SIN) 120,950 9.47%
via Hong Kong (HKG) 100,054 7.84%
via Sydney (SYD) 95,227 7.46%
via Cairns (CNS) 67,985 5.32%
via Tokyo (NRT) 40,179 3.15%
via Taipei (TPE) 32,574 2.55%
via Incheon (ICN) 32,185 2.52%
via Kuala Lumpur (KUL) 27,020 2.12%
NRT-SYD double connection 20,089 1.57%
via Gold Coast (OOL) 11,891 0.93%
Other 500 connecting city-pairs 125,838 9.85%
Total 1,276,989 100.00%
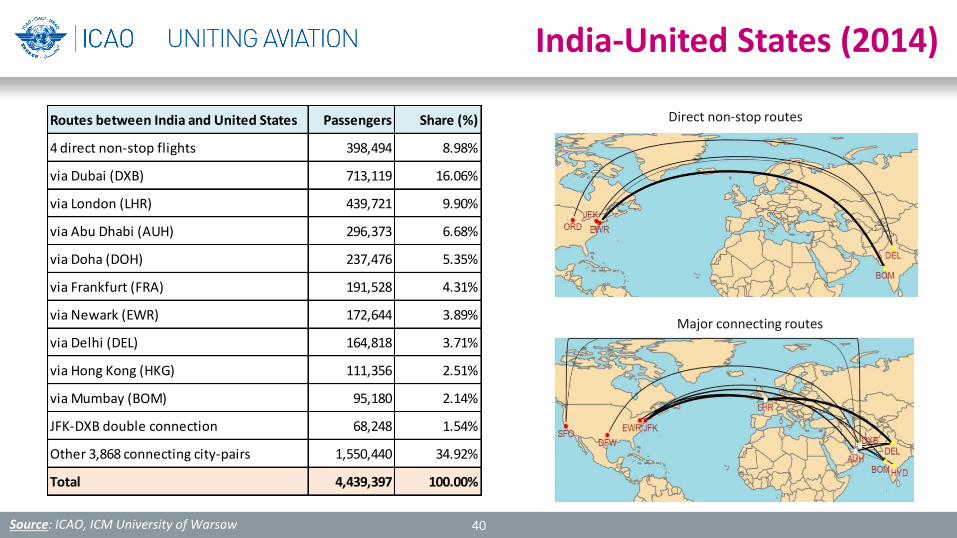
India-United States (2014)
Source: ICAO, ICM University of Warsaw 40
Direct non-stop routes
Major connecting routes
Routes between India and United States Passengers Share (%)
4 direct non-stop flights 398,494 8.98%
via Dubai (DXB) 713,119 16.06%
via London (LHR) 439,721 9.90%
via Abu Dhabi (AUH) 296,373 6.68%
via Doha (DOH) 237,476 5.35%
via Frankfurt (FRA) 191,528 4.31%
via Newark (EWR) 172,644 3.89%
via Delhi (DEL) 164,818 3.71%
via Hong Kong (HKG) 111,356 2.51%
via Mumbay (BOM) 95,180 2.14%
JFK-DXB double connection 68,248 1.54%
Other 3,868 connecting city-pairs 1,550,440 34.92%
Total 4,439,397 100.00%
41
Thank you
https://www4.icao.int/newdataplus Doc 7100 Airport Charges e-Product available soon