Embed Size (px)
Citation preview
E/ICEF/2003/AB/L.14
Distr.: Limited 14 October 2003
Original: English For action
United Nations Children’s Fund Executive Board Extraordinary budget session 2003 1-2 December 2003 Item 4 of the provisional agenda*
Biennial support budget for 2004-2005 Summary
The Executive Director presents the biennial support budget for 2004-2005, using the harmonized format agreed upon by the United Nations Development Programme, the United Nations Population Fund and UNICEF. The proposed gross biennial budget totals $684.9 million and reflects a volume increase of 7.9 per cent and cost increase of 13.0 per cent over the 2002-2003 support budget.
The proposed net biennial support budget totals $528.5 million and reflects an increase of $50.6 million, or 10.6 per cent over the 2002-2003 support budget.
The formal decision to be made on the basis of the present document is the adoption of the draft resolution relating to the budget proposal contained in chapter III, paragraph 80.
* E/ICEF/2003/14.
E/ICEF/2003/AB/L.14
2
Contents Paragraphs Page
Organization of the secretariat of UNICEF, 2004-2005 .....................................................
I. Executive summary ........................................................................................ 1-40
A. Financial framework................................................................................ 1-5
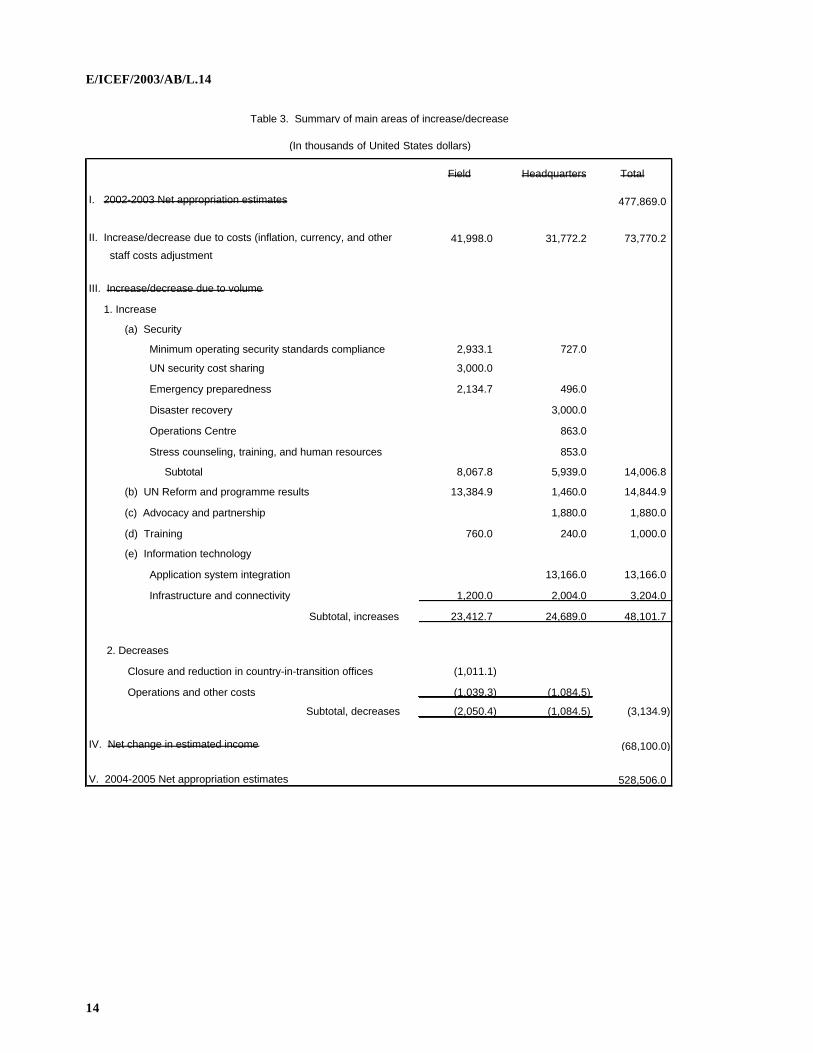
B. Objectives and strategy............................................................................ 6-33
C. Summary of proposals ............................................................................. 34-40
II. Proposals for the 2004-2005 biennial support budget ........................................ 41-79
A. General................................................................................................... 41-47
B. Programme support ................................................................................. 48-65
1. Country and regional offices............................................................. 49-57
2. Headquarters.................................................................................... 58-65
C. Management and administration of the organization .................................. 66-79
III. Draft appropriations decision........................................................................... 80
List of tables
1. Resource plan.................................................................................................................
2. Revised income projection for 2002-2003 and projection for 2004-2005 ............................
3. Summary of main areas of increase/decrease ......................................................
4. Budget estimates by appropriation line and by location .....................................................
5. Gross support budget appropriations: 1996-1997 to 2004-2005..........................................
6. Regular resources posts by category, appropriation line and location..................................
7. Distribution of recurrent costs and new investments, 2004-2005 ........................................
8. Estimated distribution of information technology requirements, 2004-2005 ........................
List of figures
A. Use of total resources, 2004-2005 ....................................................................................
B1. Trend of regular resources, other resources and total income .............................................
B2. Cumulative change of income from 1996-1997 to 2004-2005 ............................................
C. Regular resources posts by category and appropriation line, 2004-2005..............................
D. Regular support budget post changes, 1996-1997 through 2004-2005 biennia , international Professional, national Professional and General Service................................. E. Expenditures by category, 2004-2005 .....................................................................
E/ICEF/2003/AB/L.14
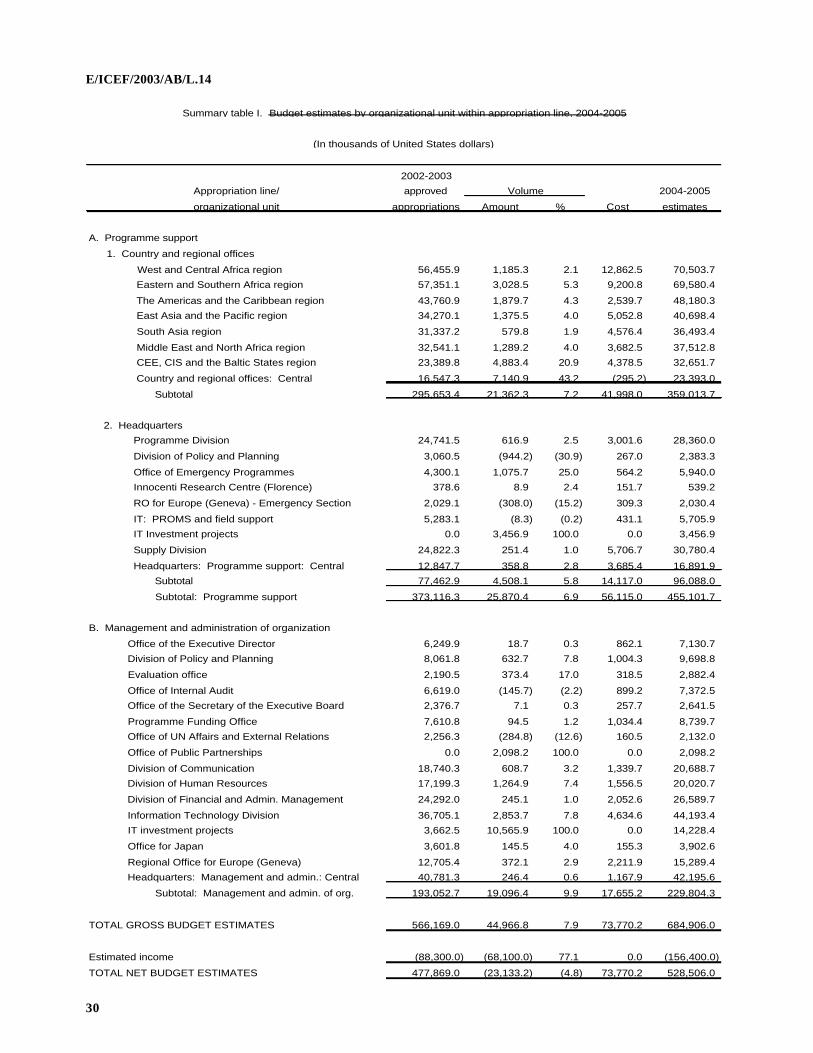
3
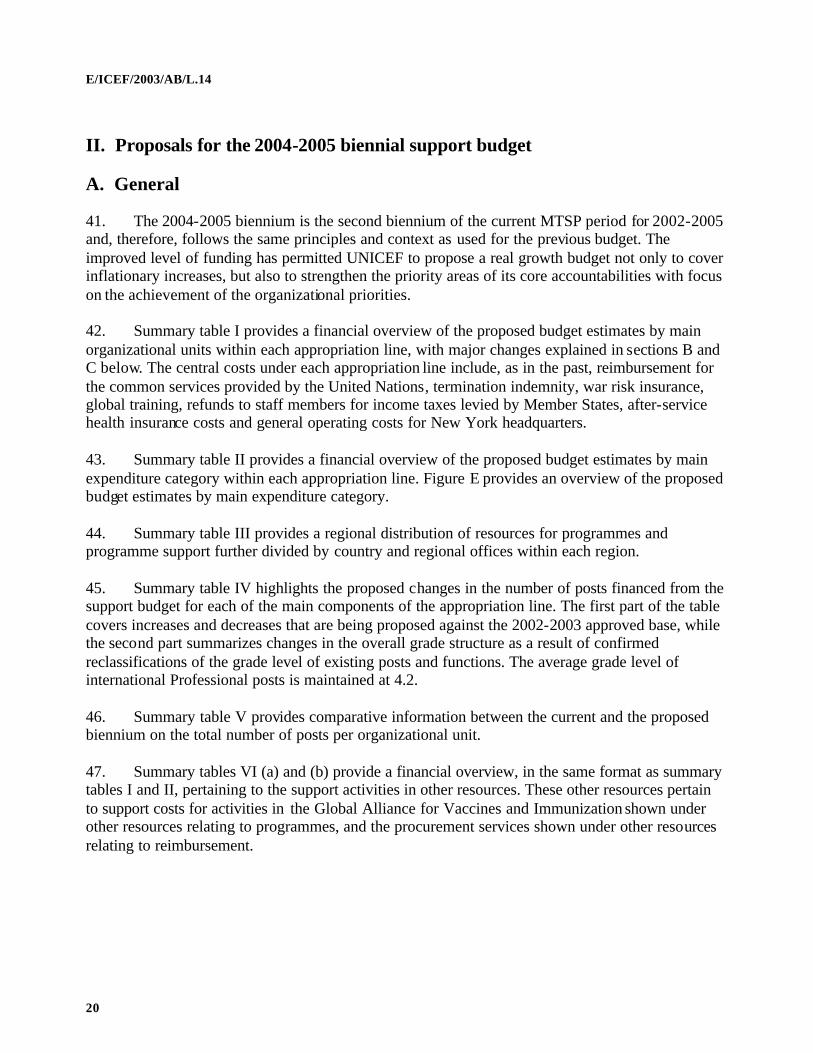
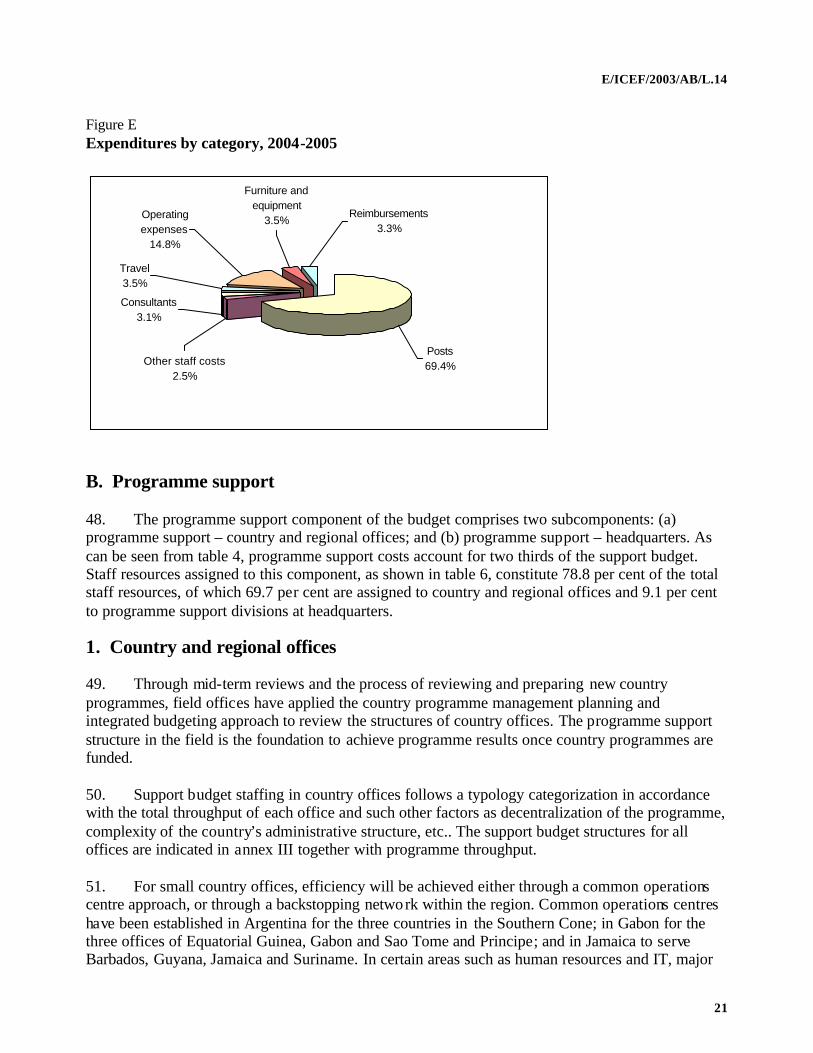
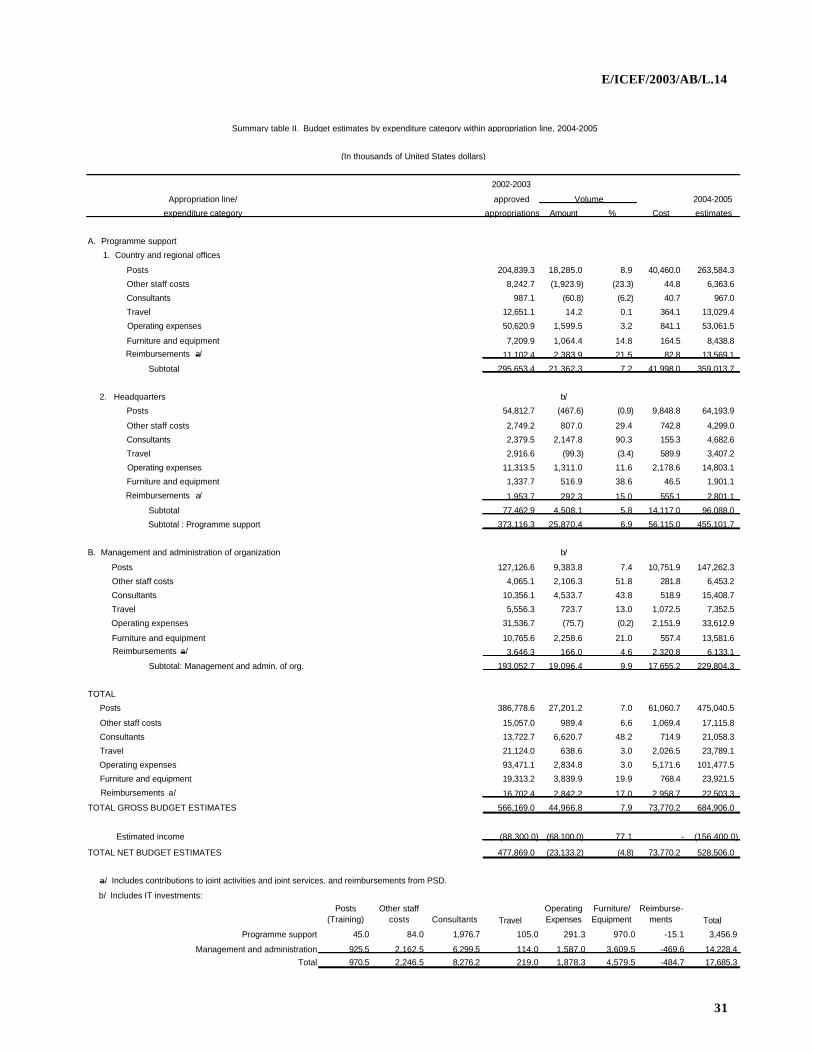
Summary tables
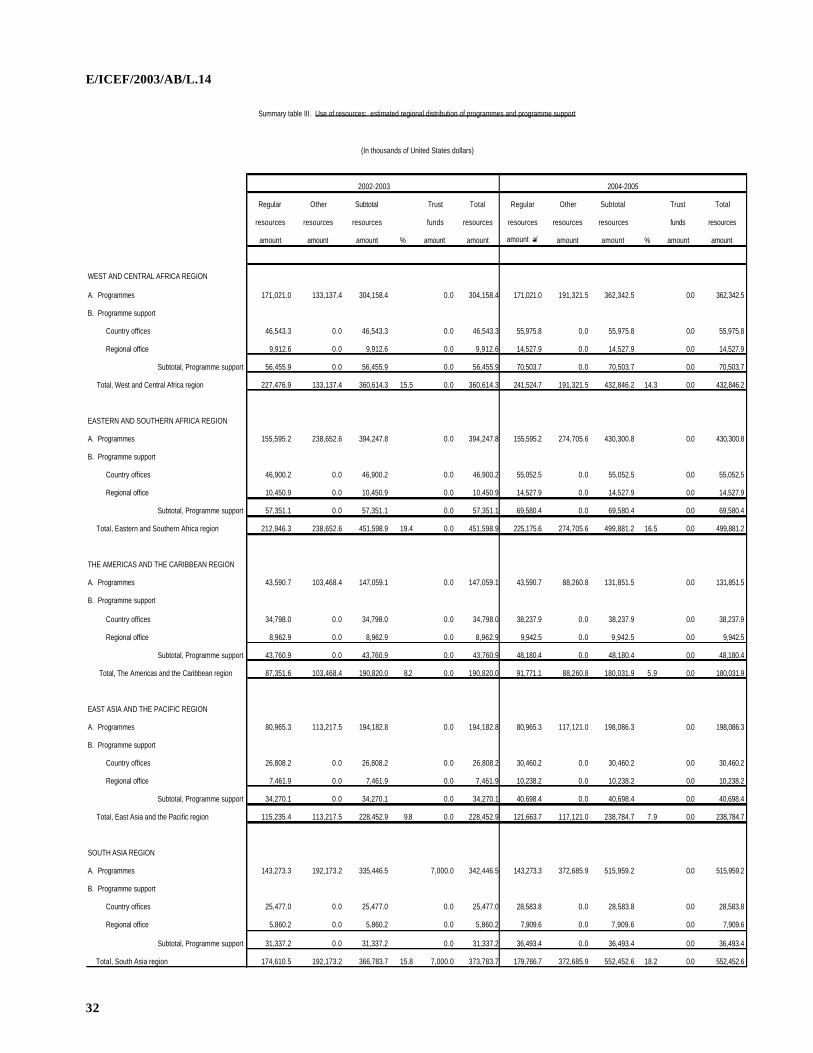
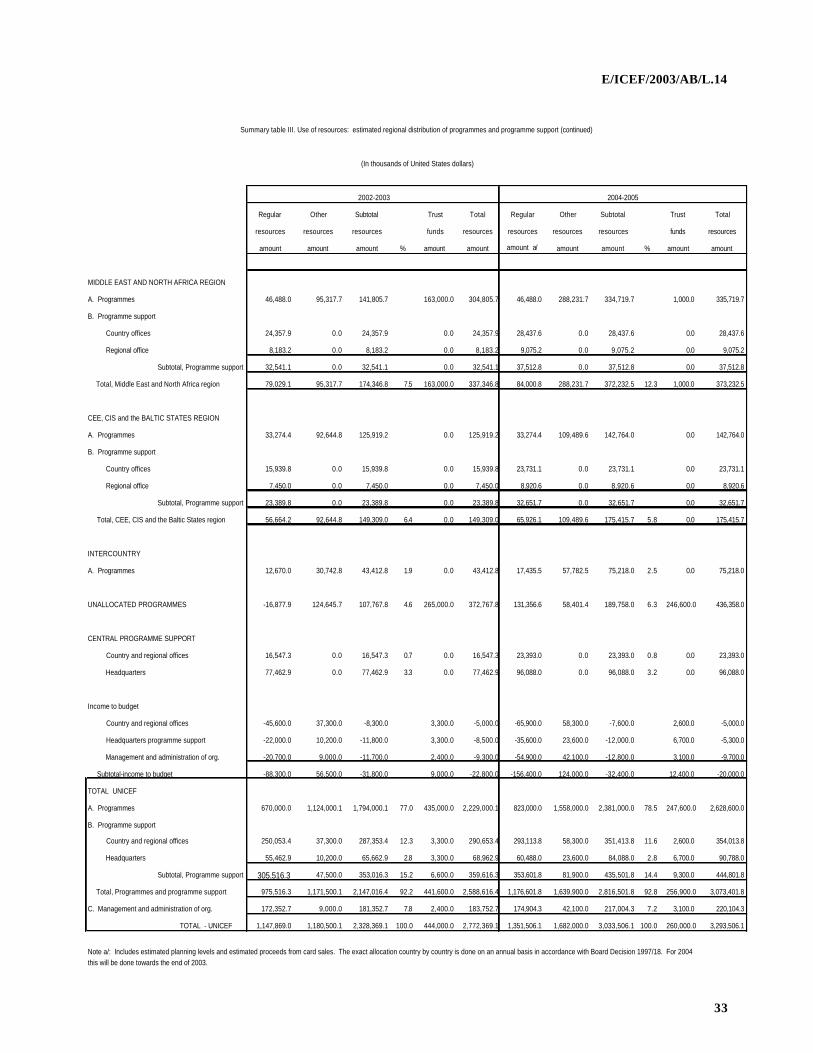
I. Budget estimates by organizational unit within appropriation line, 2004-2005 ....................
II. Budget estimates by expenditure category within appropriation line, 2004-2005.................
III. Use of resources: estimated regional distribution of programmes and programme support ...
IV. Proposed changes in regular resources post requirements, 2004-2005.................................
V. Estimated distribution of posts by source of funds and organizational unit, 2004-2005 ........
VI. (a) Other resources estimates by source of funds and organizational unit, 2004-2005 .........
(b) Other resources estimates by source of funds and expenditure category, 2004-2005.......
Annexes
I. Terminology ..................................................................................................................
II. Methodology ..................................................................................................................
III. Use of resources: estimated distribution of programmes and programme support by country within regions.................................................................................................................
IV. Private Sector Division income and expenditures 2003 revised and 2004-2005 plan............
V. Changes in Professional posts in the support budget during the biennium 2002-2003 ..........
VI. Revised recovery policy sliding scale ...............................................................................
E/ICEF/2003/AB/L.14
4
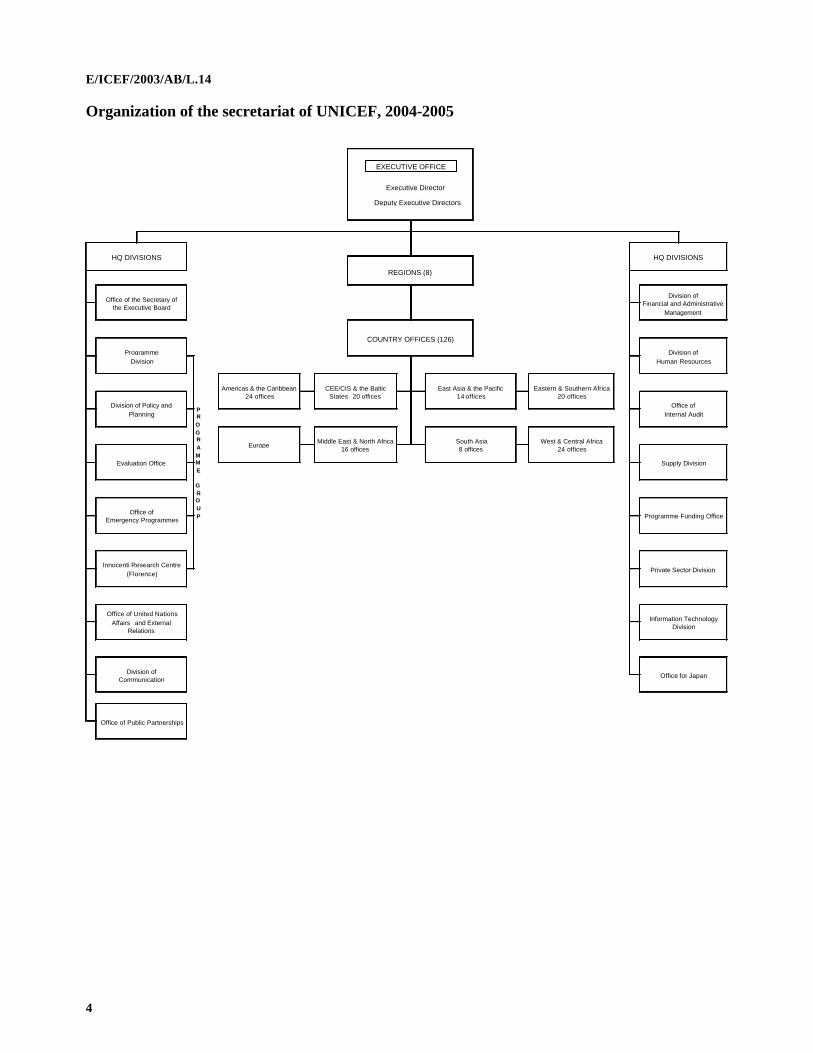
Organization of the secretariat of UNICEF, 2004-2005
Executive Director
Deputy Executive Directors
Office for Japan
Evaluation Office
PROGRAMME
GROUP
Americas & the Caribbean 24 offices
East Asia & the Pacific 14 offices
Middle East & North Africa 16 offices
Office of Internal Audit
Programme Funding Office
Private Sector Division
Information Technology Division
REGIONS (8)
COUNTRY OFFICES (126)
CEE/CIS & the Baltic States 20 offices
Supply Division
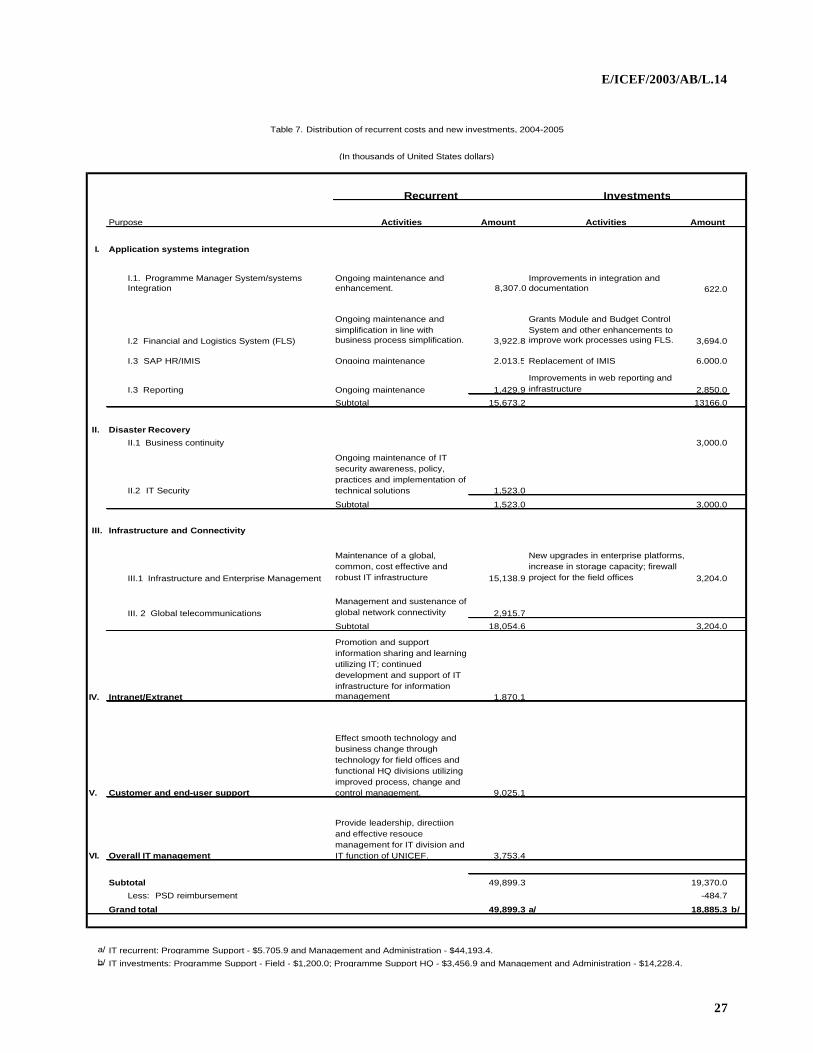
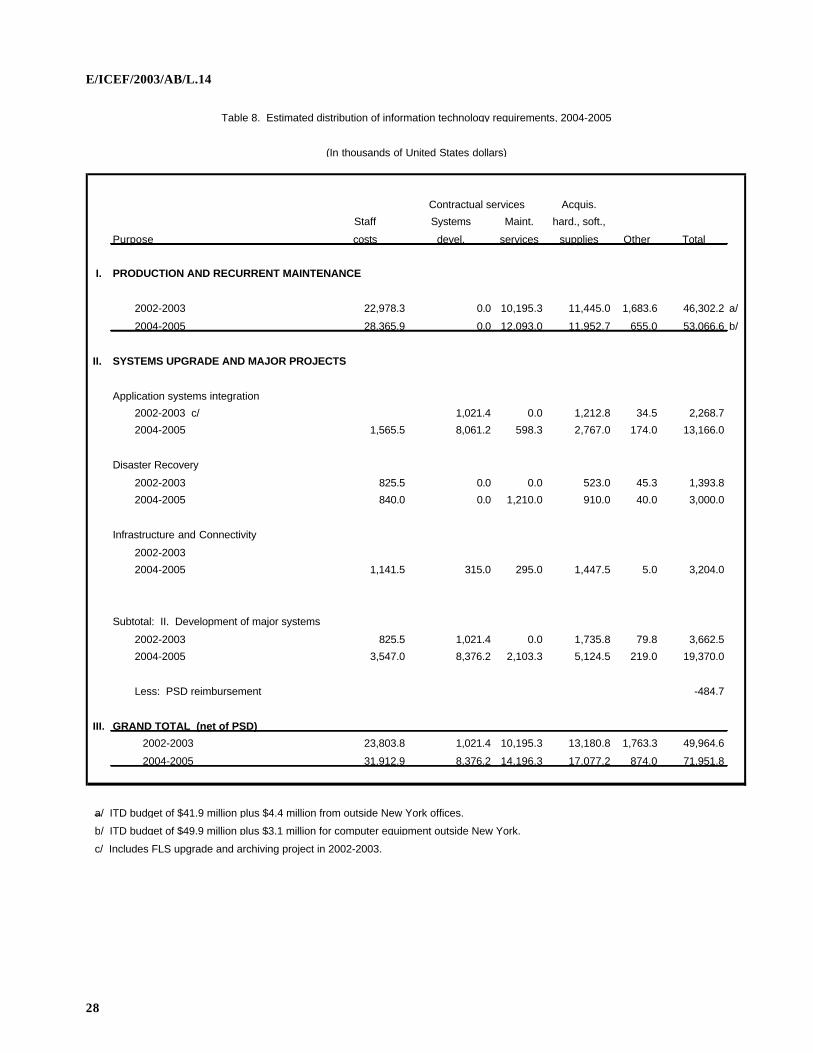
Eastern & Southern Africa 20 offices
West & Central Africa 24 offices
South Asia 8 offices
HQ DIVISIONS
Division of Financial and Administrative
Management
Division of Human Resources
HQ DIVISIONS
Office of the Secretary of the Executive Board
Programme Division
Division of Policy and Planning
Office of Public Partnerships
Europe
Innocenti Research Centre (Florence)
Office of United Nations Affairs and External
Relations
Division of Communication
Office of Emergency Programmes
EXECUTIVE OFFICE
E/ICEF/2003/AB/L.14
5
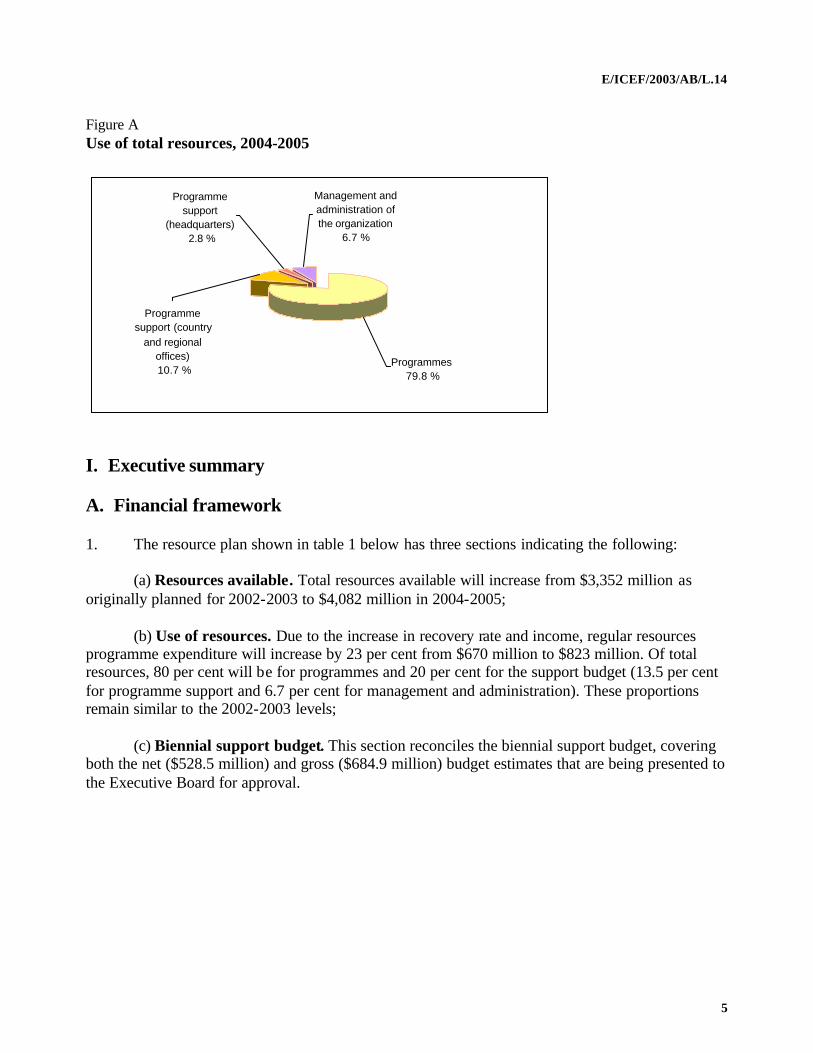
Figure A Use of total resources, 2004-2005
Programmes 79.8 %
Management and administration of the organization
6.7 %
Programme support
(headquarters) 2.8 %
Programme support (country
and regional offices) 10.7 %
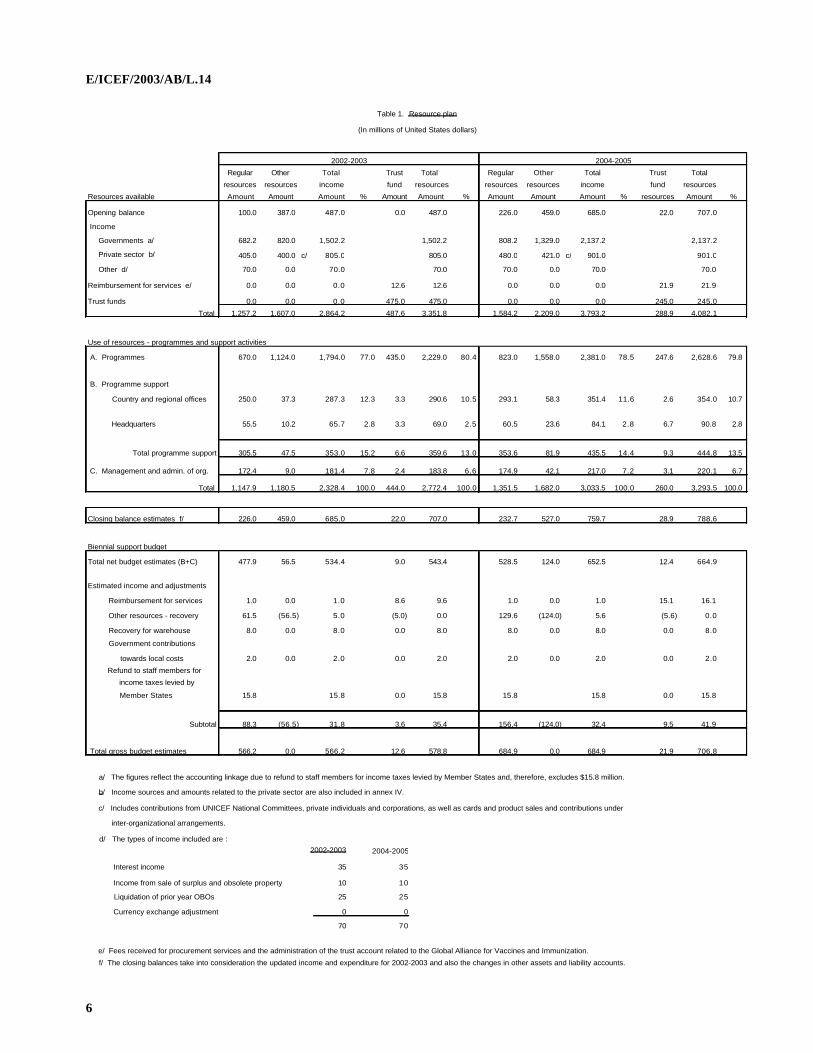
I. Executive summary A. Financial framework 1. The resource plan shown in table 1 below has three sections indicating the following: (a) Resources available. Total resources available will increase from $3,352 million as originally planned for 2002-2003 to $4,082 million in 2004-2005; (b) Use of resources. Due to the increase in recovery rate and income, regular resources programme expenditure will increase by 23 per cent from $670 million to $823 million. Of total resources, 80 per cent will be for programmes and 20 per cent for the support budget (13.5 per cent for programme support and 6.7 per cent for management and administration). These proportions remain similar to the 2002-2003 levels; (c) Biennial support budget. This section reconciles the biennial support budget, covering both the net ($528.5 million) and gross ($684.9 million) budget estimates that are being presented to the Executive Board for approval.
E/ICEF/2003/AB/L.14
6
2002-2003
Regular Other Total Trust Total Regular Other Total Trust Total
resources resources income fund resources resources resources income fund resources
Resources available Amount Amount Amount % Amount Amount % Amount Amount Amount % resources Amount %
Opening balance 100.0 387.0 487.0 0.0 487.0 226.0 459.0 685.0 22.0 707.0
Income
Governments a/ 682.2 820.0 1,502.2 1,502.2 808.2 1,329.0 2,137.2 2,137.2
Private sector b/ 405.0 400.0 c/ 805.0 805.0 480.0 421.0 c/ 901.0 901.0
Other d/ 70.0 0.0 70.0 70.0 70.0 0.0 70.0 70.0
Reimbursement for services e/ 0.0 0.0 0.0 12.6 12.6 0.0 0.0 0.0 21.9 21.9
Trust funds 0.0 0.0 0.0 475.0 475.0 0.0 0.0 0.0 245.0 245.0
Total 1,257.2 1,607.0 2,864.2 487.6 3,351.8 1,584.2 2,209.0 3,793.2 288.9 4,082.1
Use of resources - programmes and support activities
A. Programmes 670.0 1,124.0 1,794.0 77.0 435.0 2,229.0 80.4 823.0 1,558.0 2,381.0 78.5 247.6 2,628.6 79.8
B. Programme support
Country and regional offices 250.0 37.3 287.3 12.3 3.3 290.6 10.5 293.1 58.3 351.4 11.6 2.6 354.0 10.7
Headquarters 55.5 10.2 65.7 2.8 3.3 69.0 2.5 60.5 23.6 84.1 2.8 6.7 90.8 2.8
Total programme support 305.5 47.5 353.0 15.2 6.6 359.6 13.0 353.6 81.9 435.5 14.4 9.3 444.8 13.5
C. Management and admin. of org. 172.4 9.0 181.4 7.8 2.4 183.8 6.6 174.9 42.1 217.0 7.2 3.1 220.1 6.7
Total 1,147.9 1,180.5 2,328.4 100.0 444.0 2,772.4 100.0 1,351.5 1,682.0 3,033.5 100.0 260.0 3,293.5 100.0
Closing balance estimates f/ 226.0 459.0 685.0 22.0 707.0 232.7 527.0 759.7 28.9 788.6
Biennial support budget
Total net budget estimates (B+C) 477.9 56.5 534.4 9.0 543.4 528.5 124.0 652.5 12.4 664.9
Estimated income and adjustments
Reimbursement for services 1.0 0.0 1.0 8.6 9.6 1.0 0.0 1.0 15.1 16.1
Other resources - recovery 61.5 (56.5) 5.0 (5.0) 0.0 129.6 (124.0) 5.6 (5.6) 0.0
Recovery for warehouse 8.0 0.0 8.0 0.0 8.0 8.0 0.0 8.0 0.0 8.0
Government contributions
towards local costs 2.0 0.0 2.0 0.0 2.0 2.0 0.0 2.0 0.0 2.0
Refund to staff members for
income taxes levied by
Member States 15.8 15.8 0.0 15.8 15.8 15.8 0.0 15.8
Subtotal 88.3 (56.5) 31.8 3.6 35.4 156.4 (124.0) 32.4 9.5 41.9
Total gross budget estimates 566.2 0.0 566.2 12.6 578.8 684.9 0.0 684.9 21.9 706.8
a/ The figures reflect the accounting linkage due to refund to staff members for income taxes levied by Member States and, therefore, excludes $15.8 million.
b/ Income sources and amounts related to the private sector are also included in annex IV.
c/ Includes contributions from UNICEF National Committees, private individuals and corporations, as well as cards and product sales and contributions under
inter-organizational arrangements.
d/ The types of income included are : 2002-2003 2004-2005
Interest income 35 35
Income from sale of surplus and obsolete property 10 10
Liquidation of prior year OBOs 25 25
Currency exchange adjustment 0 0
70 70
e/ Fees received for procurement services and the administration of the trust account related to the Global Alliance for Vaccines and Immunization.
f/ The closing balances take into consideration the updated income and expenditure for 2002-2003 and also the changes in other assets and liability accounts.
Table 1. Resource plan
(In millions of United States dollars)
2004-2005
E/ICEF/2003/AB/L.14
7
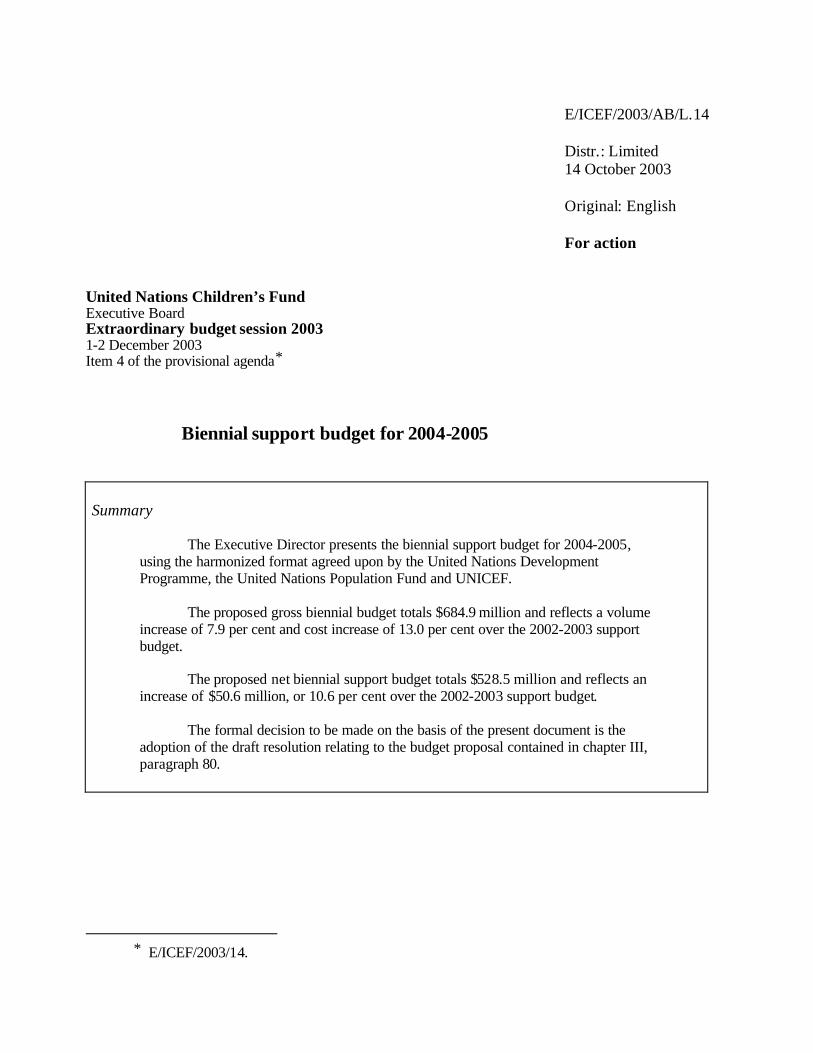
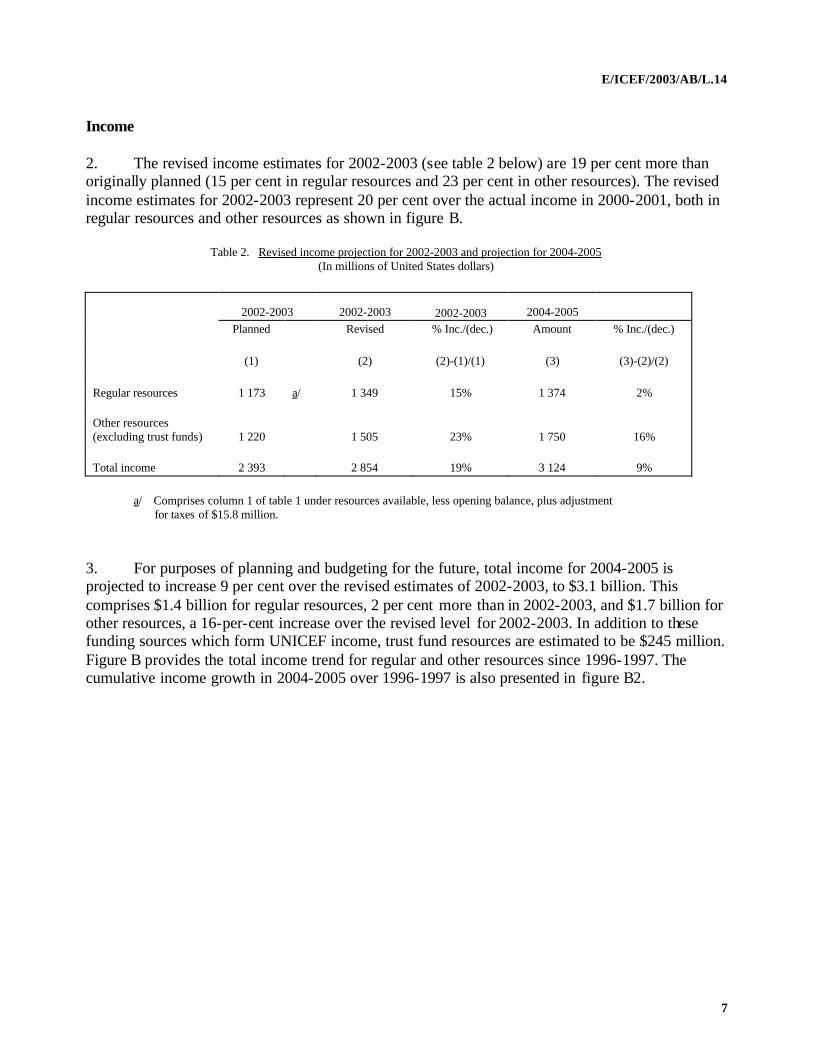
Income 2. The revised income estimates for 2002-2003 (see table 2 below) are 19 per cent more than originally planned (15 per cent in regular resources and 23 per cent in other resources). The revised income estimates for 2002-2003 represent 20 per cent over the actual income in 2000-2001, both in regular resources and other resources as shown in figure B.
Table 2. Revised income projection for 2002-2003 and projection for 2004-2005 (In millions of United States dollars)
2002-2003 2002-2003
2002-2003 2004-2005 Planned Revised % Inc./(dec.) Amount % Inc./(dec.) (1) (2) (2)-(1)/(1) (3) (3)-(2)/(2) Regular resources 1 173 a/ 1 349 15% 1 374 2% Other resources (excluding trust funds) 1 220 1 505 23% 1 750 16% Total income 2 393 2 854 19% 3 124 9%
a/ Comprises column 1 of table 1 under resources available, less opening balance, plus adjustment for taxes of $15.8 million.
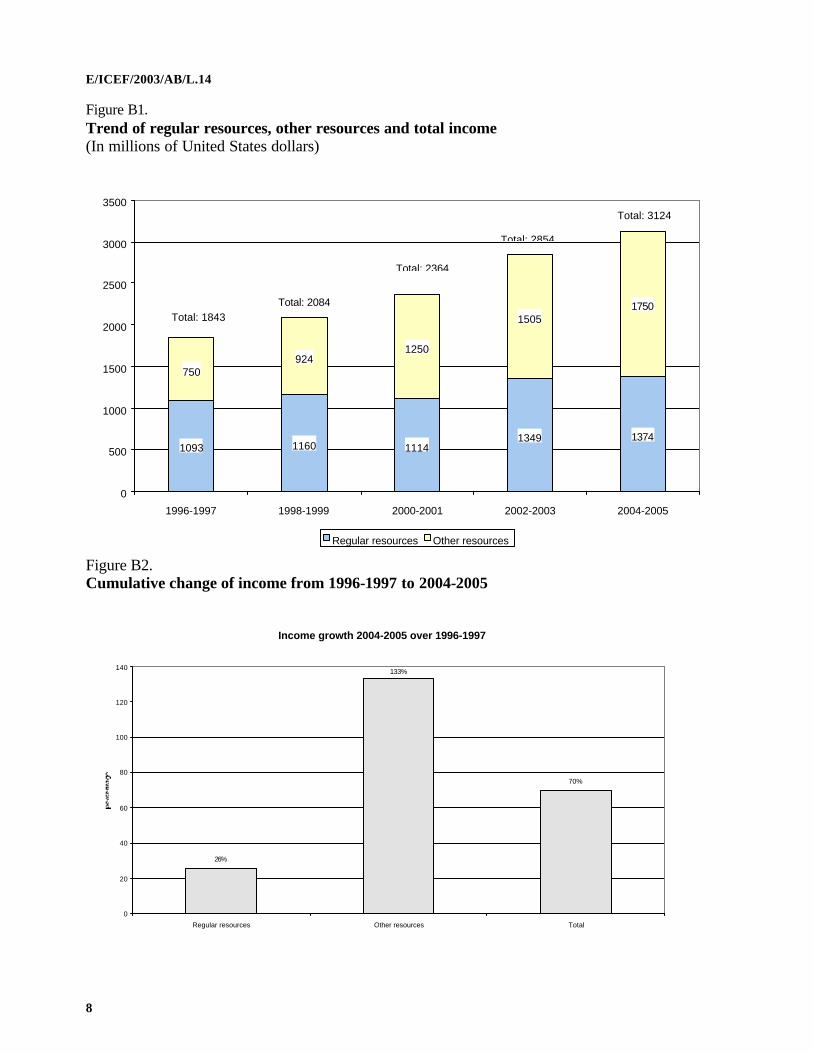
3. For purposes of planning and budgeting for the future, total income for 2004-2005 is projected to increase 9 per cent over the revised estimates of 2002-2003, to $3.1 billion. This comprises $1.4 billion for regular resources, 2 per cent more than in 2002-2003, and $1.7 billion for other resources, a 16-per-cent increase over the revised level for 2002-2003. In addition to these funding sources which form UNICEF income, trust fund resources are estimated to be $245 million. Figure B provides the total income trend for regular and other resources since 1996-1997. The cumulative income growth in 2004-2005 over 1996-1997 is also presented in figure B2.
E/ICEF/2003/AB/L.14
8
Figure B1. Trend of regular resources, other resources and total income (In millions of United States dollars)
1093 1160 11141349 1374
750924
1250
15051750
0
500
1000
1500
2000
2500
3000
3500
1996-1997 1998-1999 2000-2001 2002-2003 2004-2005
Regular resources Other resources
Total: 1843Total: 2084
Total: 2364
Total: 2854
Total: 3124
Figure B2. Cumulative change of income from 1996-1997 to 2004-2005
Income growth 2004-2005 over 1996-1997
70%
133%
26%
0
20
40
60
80
100
120
140
Regular resources Other resources Total
E/ICEF/2003/AB/L.14
9
Support budget 4. UNICEF consistently has used conservative income projections for planning and budgeting purposes. With an assumption of a modest growth in income for 2002-2003, the biennial support budget for 2002-2003 was planned at a non-growth level so as to maximize the resources available for programmes. For the first time since 1996-1997, UNICEF is preparing a real growth support budget for 2004-2005, which reflects volume increases in selected strategic areas described in the next section as well as inflationary increases to maintain the existing structure. Income to the budget 5. The revised recovery policy was approved by the Executive Board at the annual session of 2003 (decision 2003/9). The sliding scale ranging from 12 to 5 per cent is described in annex VI. For planning purposes, an average recovery rate of 8 per cent is used to estimate other resources recovery income. The other income to the budget item includes the refund to staff members for income taxes levied by Member States, government contribution to local costs, packing charges for goods from the Supply Division warehouse in Copenhagen and other reimbursements for services. Estimated income and adjustments to the gross budget will increase to $156 million for 2004-2005 from $88 million due to the increased recovery costs as explained above. B. Objectives and strategy Context 6. The biennial support budget for 2002-2003 was guided by the medium-term strategic plan (MTSP) for 2002-2005. In addition, A World Fit for Children, adopted by the General Assembly at the Special Session on Children, sets out concrete goals and target dates for ensuring the health, education and protection of children. It is a springboard to achieving the Millennium Development Goals. 7. General Assembly resolution 56/201 of 21 December 2001 on the triennial policy review of operational activities for development of the United Nations requested the funds and programmes to accord high priority to simplification and harmonization. This work encompasses programme implementation modalities, financial regulations and management, administrative rules and procedures including common premises and services, and national project personnel. In addition to the objectives of reducing transactional costs and harnessing national ownership of programmes, the outcome of United Nations reform will also offer improved opportunities to advance the respect and fulfilment of children’s rights. 8. The continued instability in many countries requires that UNICEF re-examine its budgetary provisions for security globally. In this area, where possible, UNICEF field offices share common security arrangements with other United Nations agencies. UNICEF also has reviewed carefully its emergency preparedness and global support systems to ensure continuous support and recovery ability for programme operations in a crisis situation.
E/ICEF/2003/AB/L.14
10
9. On the funding side, the improved level of income and expenditure in 2002-2003 and the revised recovery policy also provide opportunities for the UNICEF financial plan and budget. 10. The Advisory Committee on Administrative and Budgetary Questions, in its report on the biennial support budget for 2002-2003 (E/ICEF/2001/AB/L.11), recommended put ting in place effective tools to measure performance. In the Executive Director's annual report to the Executive Board (E/ICEF/2003/4 (Part II)), she reported on the results achieved in 2002, the first year of the MTSP period. The report also presented an improved focus on results-based management and reporting through the development of a set of baseline indicators against which progress can be assessed. The formulation of the support budget, an integral part of the multi-year funding framework, has been guided by the same process of planning, performance monitoring and reporting on results. 11. In the present budget proposal for the 2004-2005 biennium, additional requests are mostly for expansion of existing activities which, in some cases, are currently funded from other resources. The additional needs captured under section III.1 of table 3 below are described under the following categories: (a) mandatory costs in relation to security compliance and emergency preparedness; (b) continuation of work in relation to United Nations reform and additional actions to achieve programmatic results towards the MTSP and Millennium Development Goals; (c) training; (d) advocacy and partnership opportunities offered by A World Fit for Children to further child rights; and (e) further integration and improvements in global information technology (IT) systems. Security and emergency preparedness 12. UNICEF continues to participate in cost-sharing for the Office of the United Nations Security Coordinator (UNSECOORD). An increase of $3.0 million for cost-sharing, to $9.7 million, is included in this submission. In addition, this budget exercise reviewed compliance with minimum operating security standards throughout the organization. As a result of this review, overall additional costs of $2.9 million and $0.7 million for field offices and headquarters respectively have been included in the proposal. 13. At the regional level and in the Copenhagen and Geneva offices, capacity will be mainstreamed to provide support for country offices in emergency preparedness, including telecommunications readiness. This work was initiated in the current biennium using other resources funding. An additional $2.6 million is proposed in this budget for this purpose. 14. For system services globally, an investment of $3 million has been included in this submission to maintain business continuity and a disaster recovery capacity. This will provide a more resilient infrastructure to withstand some level of damage or the inability to operate IT facilities due to some form of disaster. This will also respond to the recommendation of the United Nations Board of Auditors in this regard. 15. UNICEF currently has an emergency operations centre which functions around the clock. This centre has been staffed partially by temporary assistance funded from other resources. The additional $0.9 million for these core functions will be covered from the support budget in 2004-2005. The operations centre has also provided additional back-up support to the operations centre in the United Nations Secretariat.
E/ICEF/2003/AB/L.14
11
16. A post for a stress counsellor, located in the Division of Human Resources (DHR) and initiated in the current biennium with funding from other resources, will be funded from the support budget, as will one post for the preparation of training materials for emergencies that was also funded from other resources in the current biennium. An amount of $0.9 million to strengthen DHR, including these posts, has been included in the proposal. 17. The above amounts to a total volume increase of $14.0 million for security and emergency preparedness as can be seen under table 3, item III.1(a). Additional security funding 18. In the context of the recent attacks on the United Nations offices in Baghdad, the vulnerability of United Nations personnel and premises in a number of locations around the world has increased. It is foreseen that cost-sharing for malicious act insurance will increase. Various other security-related costs, which cannot be estimated accurately, may also need to be increased on very short notice. These include provision for emergency movement of personnel and offices, blast mitigation and preventive measures to diminish possible acts of terrorism, additions to the current minimum operating security standards, additional costs related to field security officers and security guards, strengthening of premises access, etc.. In addressing the additional security-related requirements, UNICEF will ensure that the proposed budget for security-related costs will be utilized first. UNICEF will also continue to work closely with UNSECOORD to assess and review these requirements. In view of the importance and urgency of any such additional requirement, the Executive Director is exceptionally requesting that the Executive Board grant her the authority to spend up to $14 million in additional funding for security-related emergencies. United Nations reform and programme results 19. In the current biennium, UNICEF has constituted an interdivisional team to work on the inter-agency simplification and harmonization exercise coordinated by the United Nations Development Group. In the initial stages of the roll-out, one additional post will be created in the Field Support and Inter-Agency Collaboration Section of Programme Division to assist in the implementation phase. Training funds are also included as part of the increase in the global training budget mentioned below under “training”. 20. The UNICEF Child Info software has been adopted as a United Nations-wide system, DevInfo, for monitoring of the Millennium Development Goals by all UNICEF offices and United Nations country teams. Within UNICEF programme resources, funds will be provided for the use of the software package by country teams, together with related training and support to global monitoring. 21. The country programme of cooperation remains the core of UNICEF work and will be the primary means of pursuing the five organizational priorities of the MTSP. In previous biennia, due to resource constraints, UNICEF did not have full capacity in a number of low-income countries. In 2004-2005, most of these offices will be strengthened to a basic structure of four Professional posts in the areas of representation, programme management and coordination, operational management and communication.
E/ICEF/2003/AB/L.14
12
22. Some support-type posts previously funded from country programme resources will be converted to the support budget, thus relieving more funds in programme resources for achieving programmatic results. 23. At the headquarters and regional levels, most of the changes in the programme areas have been made with offsets in other areas, except in a few areas where more resources need to be made available to help build capacity in country offices. 24. A total of $14.8 million ($13.4 million for the field and $1.4 million for headquarters) has been provided in this proposal for the strengthening of capacities in the areas mentioned above. Training 25. Based upon the experiences from the current biennium and the priorities within the organization, particularly in the context of the MTSP and the Millennium Development Goals, learning and training priorities will focus on functional and substantive areas, and those that will be used or developed to support them, as well as the career development of staff. 26. In the functional and sustantative areas, priority will be given to help UNICEF staff develop competencies and skills to attain programme excellence, leadership development, organizational management, induction and orientation, and support for United Nations reform. These will be facilitated through strategic management of learning throughout the organization and by creating multiple learning opportunities for all staff. Emphasis will be placed on distance learning, especially e-learning, ongoing updating of the major UNICEF training manuals and other learning materials, and supporting the decentralization of learning management by building capacities of regional offices and headquarters divisions to manage learning more strategically. 27. In order to achieve the above, the budget allocation for training has been increased from $6 million in the current biennium to $7 million with an increase in the field allocation of $0.76 million and for headquarters programme support and management and administration by $0.24 million. With this increase, the total for the field and headquarters allocations will be $4.16 million and $2.84 million, respectively. Advocacy and partnership 28. It is evident from the Special Session for Children that civil society organizations (CSOs) exercise considerable influence in international policy dialogues concerning children. In the current biennium, UNICEF has transferred existing resources from different offices to establish a focal point office for this function. The redeployment of existing resources and additional resources for three posts have allowed the formation of a separate Office of Public Partnerships to expand and monitor the effectiveness of UNICEF’s strategic global partnerships with a broad range of CSOs. 29. Advocacy on behalf of children requires authoritative information and knowledge on public policy concerning children and young people. The State of the World’s Children report is the leading annual report on children’s issues published by UNICEF. To ensure the quality of
E/ICEF/2003/AB/L.14
13
information to be used for policy advocacy, a post will be created in the Division of Policy and Planning. Including the cost of UNICEF web content management, the volume increase for advocacy and partnerships comes to $1.9 million. Information technology - application system integration, infrastructure and global connectivity 30. UNICEF currently has three major systems: United Nations Integrated Management Information System (IMIS) for human resources management and payroll; SAP for the Financial and Logistics System (FLS) (including private sector product sales) at headquarters locations ; and the Programme Manager System (PROMS) for field offices. The human resources module of IMIS is limited to personnel administration. In order to carry out the full range of human resources management as indicated in the MTSP, e.g., development of competency profiles, career development, staff rotation and succession planning, including a commitment to gender balance and a broad representation of nationalities, a human resources system with a broader scope is needed. As reported in the Executive Director’s report (E/ICEF/2003/4 (Part II)), UNICEF has begun to use the SAP human resources module. The configuration will be completed in mid-2005 at an estimated cost of $6 million. 31. In this proposal, $4.3 million is budgeted for enhancing other SAP modules and the cost of necessary interfaces with PROMS. These include one module which will automate the tracking of donor proposals and their integration into the core financial system. One module for distribution and ordering of documents is also planned. 32. Special projects started during the current biennium, such as the FLS upgrade, IT security and archiving, all will have been completed by the end of 2003. To make information and improved reporting easily accessible globally, $2.9 million is budgeted in the next biennium for enhancing the reporting structure. 33. An amount of $2.0 million has been budgeted at headquarters to replace or upgrade some of the core IT platform and corporate licenses which serve the whole organization. For field offices, $1.2 million is budgeted to ensure firewalls in all offices for IT systems security.
E/ICEF/2003/AB/L.14
14
Field Headquarters Total
I. 2002-2003 Net appropriation estimates 477,869.0
II. Increase/decrease due to costs (inflation, currency, and other 41,998.0 31,772.2 73,770.2
staff costs adjustment
III. Increase/decrease due to volume
1. Increase
(a) Security
Minimum operating security standards compliance 2,933.1 727.0
UN security cost sharing 3,000.0
Emergency preparedness 2,134.7 496.0
Disaster recovery 3,000.0
Operations Centre 863.0
Stress counseling, training, and human resources 853.0
Subtotal 8,067.8 5,939.0 14,006.8
(b) UN Reform and programme results 13,384.9 1,460.0 14,844.9
(c) Advocacy and partnership 1,880.0 1,880.0
(d) Training 760.0 240.0 1,000.0
(e) Information technology
Application system integration 13,166.0 13,166.0
Infrastructure and connectivity 1,200.0 2,004.0 3,204.0
Subtotal, increases 23,412.7 24,689.0 48,101.7
2. Decreases
Closure and reduction in country-in-transition offices (1,011.1)
Operations and other costs (1,039.3) (1,084.5)
Subtotal, decreases (2,050.4) (1,084.5) (3,134.9)
IV. Net change in estimated income (68,100.0)
V. 2004-2005 Net appropriation estimates 528,506.0
Table 3. Summary of main areas of increase/decrease
(In thousands of United States dollars)
E/ICEF/2003/AB/L.14
15
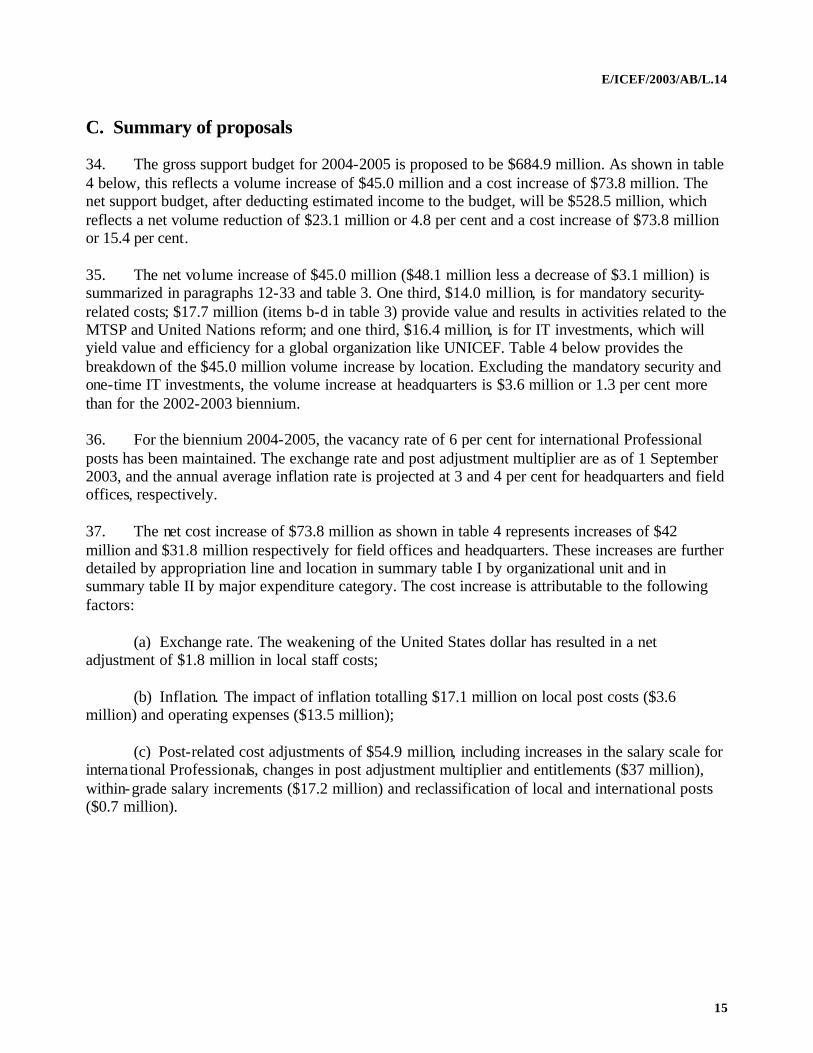
C. Summary of proposals 34. The gross support budget for 2004-2005 is proposed to be $684.9 million. As shown in table 4 below, this reflects a volume increase of $45.0 million and a cost increase of $73.8 million. The net support budget, after deducting estimated income to the budget, will be $528.5 million, which reflects a net volume reduction of $23.1 million or 4.8 per cent and a cost increase of $73.8 million or 15.4 per cent. 35. The net volume increase of $45.0 million ($48.1 million less a decrease of $3.1 million) is summarized in paragraphs 12-33 and table 3. One third, $14.0 million, is for mandatory security-related costs; $17.7 million (items b-d in table 3) provide value and results in activities related to the MTSP and United Nations reform; and one third, $16.4 million, is for IT investments, which will yield value and efficiency for a global organization like UNICEF. Table 4 below provides the breakdown of the $45.0 million volume increase by location. Excluding the mandatory security and one-time IT investments, the volume increase at headquarters is $3.6 million or 1.3 per cent more than for the 2002-2003 biennium. 36. For the biennium 2004-2005, the vacancy rate of 6 per cent for international Professional posts has been maintained. The exchange rate and post adjustment multiplier are as of 1 September 2003, and the annual average inflation rate is projected at 3 and 4 per cent for headquarters and field offices, respectively. 37. The net cost increase of $73.8 million as shown in table 4 represents increases of $42 million and $31.8 million respectively for field offices and headquarters. These increases are further detailed by appropriation line and location in summary table I by organizational unit and in summary table II by major expenditure category. The cost increase is attributable to the following factors: (a) Exchange rate. The weakening of the United States dollar has resulted in a net adjustment of $1.8 million in local staff costs; (b) Inflation. The impact of inflation totalling $17.1 million on local post costs ($3.6 million) and operating expenses ($13.5 million); (c) Post-related cost adjustments of $54.9 million, including increases in the salary scale for international Professionals, changes in post adjustment multiplier and entitlements ($37 million), within-grade salary increments ($17.2 million) and reclassification of local and international posts ($0.7 million).
E/ICEF/2003/AB/L.14
16
Table 4. Budget estimates by appropriation line and by location
(In thousands of United States dollars)
2002-2003 Changes 2004-2005
Approved % Volume Cost Proposed %
Gross budget estimates appropriations of
total Inc./(dec.) % Inc./(dec.) % estimates of
total By appropriation line Programme support Country and regional offices 295 653.4 52.2 21 362.3 7.2 41 998.0 14.2 359 013.7 52.4 Headquarters 77 462.9 13.7 4 508.1 5.8 14 117.0 18.2 96 088.0 14.0 Subtotal 373 116.3 65.9 25 870.4 6.9 56 115.0 15.0 455 101.7 66.4 Management and admin. of org. 193 052.7 34.1 19 096.4 9.9 17 655.2 9.1 229 804.3 33.6 Total 566 69.0 100.0 44 966.8 7.9 73 770.2 13.0 684 906.0 100.0
By location Country offices 236 740.3 41.8 18 506.8 7.8 29 795.7 12.6 285 042.8 41.6 Regional offices 58 913.1 10.5 2 855.5 4.8 12 202.3 20.7 73 970.9 10.9 Headquarters a/ 270 515.6 47.8 23 604.5 8.7 31 772.2 11.7 325 892.3 47.6 Total 566 169.0 100.0 44 966.8 7.9 73 770.2 13.0 684 906.0 100.0
Estimated income (88 300.0) (68 100.0) 77.1 0.0 (156 400.0) Net budget estimates 477 869.0 (23 33.2) (4.8) 73 770.2 15.4 528 506.0
a/ Includes Regional Office for Europe.
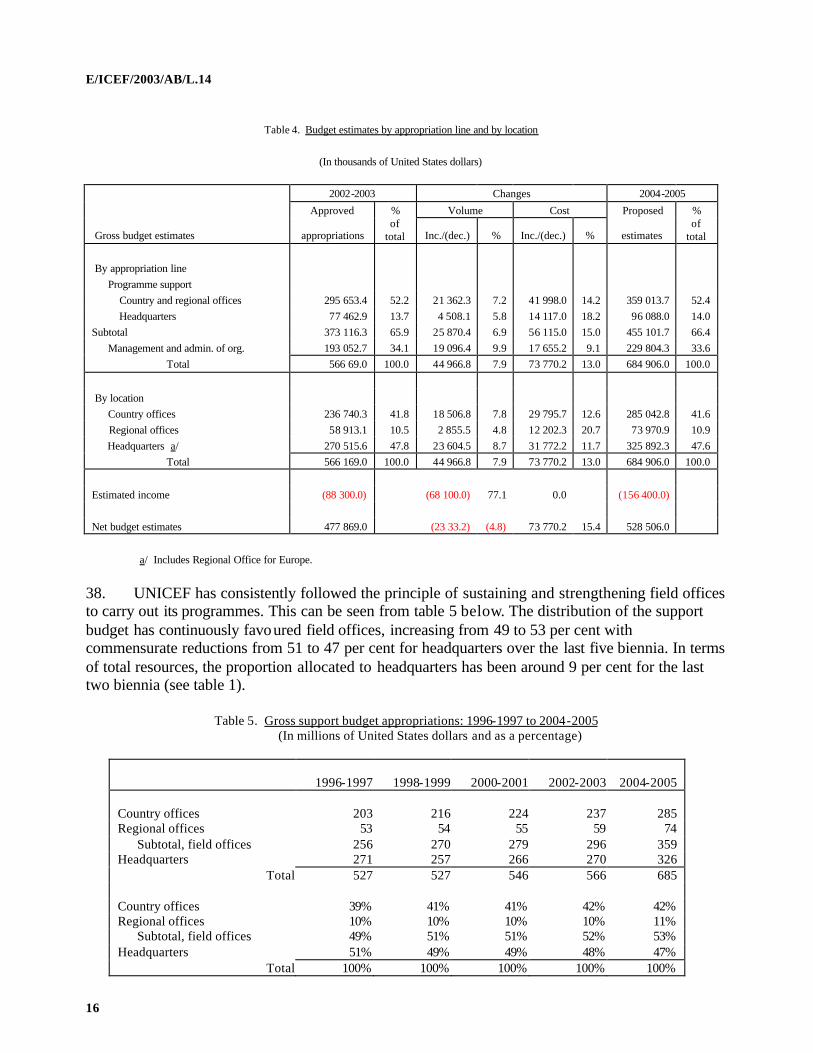
38. UNICEF has consistently followed the principle of sustaining and strengthening field offices to carry out its programmes. This can be seen from table 5 below. The distribution of the support budget has continuously favoured field offices, increasing from 49 to 53 per cent with commensurate reductions from 51 to 47 per cent for headquarters over the last five biennia. In terms of total resources, the proportion allocated to headquarters has been around 9 per cent for the last two biennia (see table 1).
Table 5. Gross support budget appropriations: 1996-1997 to 2004-2005 (In millions of United States dollars and as a percentage)
1996-1997
1998-1999
2000-2001
2002-2003
2004-2005 Country offices
203
216
224
237
285
Regional offices 53 54 55 59 74 Subtotal, field offices 256 270 279 296 359 Headquarters 271 257 266 270 326
Total 527 527 546 566 685
Country offices 39% 41% 41% 42% 42% Regional offices 10% 10% 10% 10% 11% Subtotal, field offices 49% 51% 51% 52% 53% Headquarters 51% 49% 49% 48% 47%
Total 100% 100% 100% 100% 100%
E/ICEF/2003/AB/L.14
17
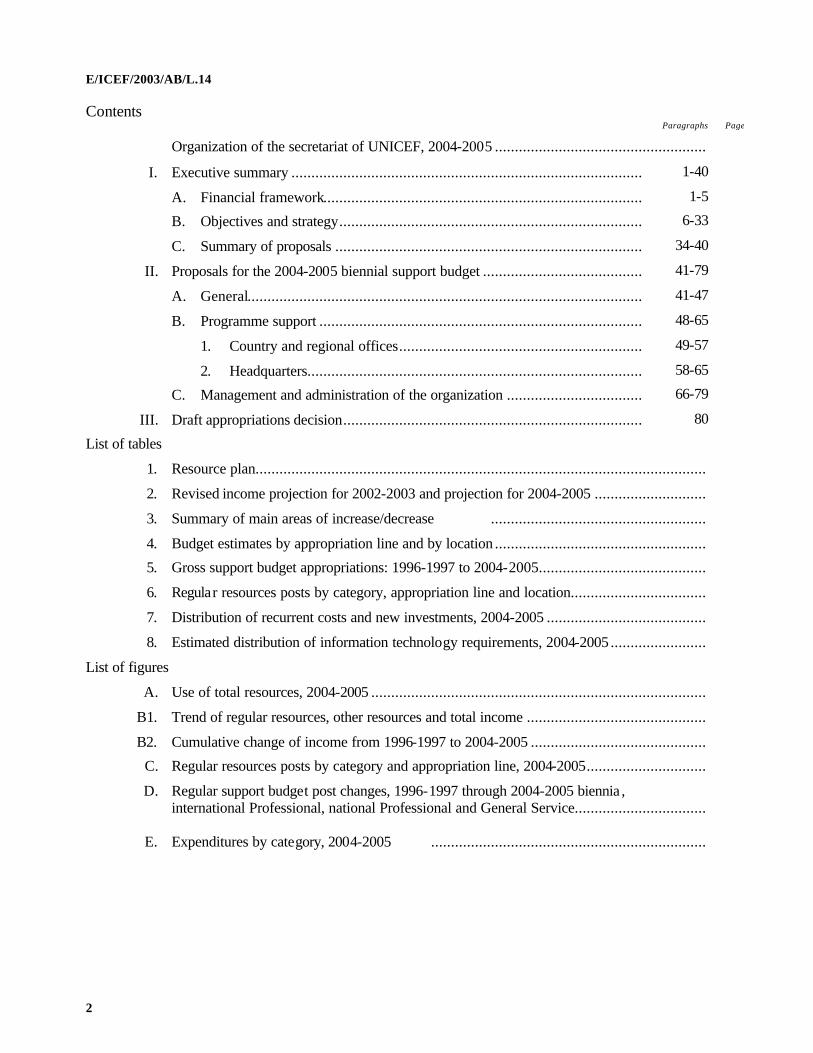
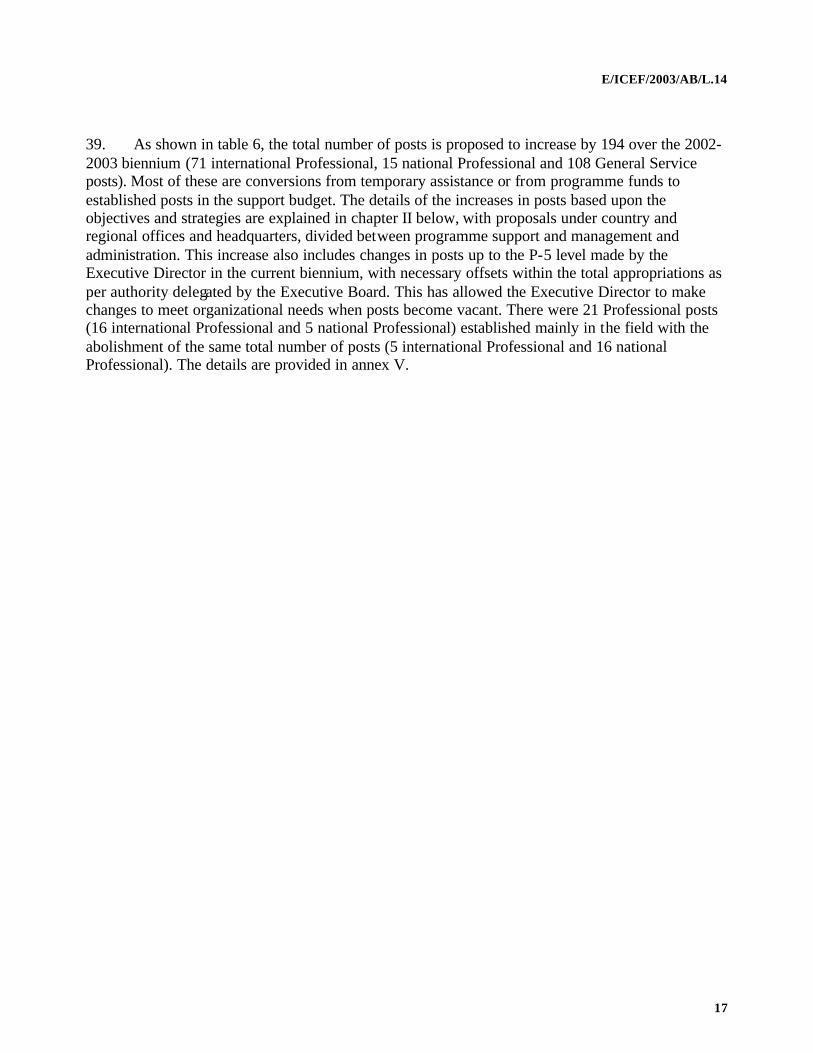
39. As shown in table 6, the total number of posts is proposed to increase by 194 over the 2002-2003 biennium (71 international Professional, 15 national Professional and 108 General Service posts). Most of these are conversions from temporary assistance or from programme funds to established posts in the support budget. The details of the increases in posts based upon the objectives and strategies are explained in chapter II below, with proposals under country and regional offices and headquarters, divided between programme support and management and administration. This increase also includes changes in posts up to the P-5 level made by the Executive Director in the current biennium, with necessary offsets within the total appropriations as per authority delegated by the Executive Board. This has allowed the Executive Director to make changes to meet organizational needs when posts become vacant. There were 21 Professional posts (16 international Professional and 5 national Professional) established mainly in the field with the abolishment of the same total number of posts (5 international Professional and 16 national Professional). The details are provided in annex V.
E/ICEF/2003/AB/L.14
18
2002-2003 approved posts Changes 2004-2005 proposed posts
% Increase/(decrease) %
Posts IP NP GS/Oth. Total of total IP NP GS/Oth. Total IP NP GS/Oth. Total of total
By appropriation line
Programme support
Country and regional offices 452 242 1,036 1,730 68.6 43 16 104 163 495 258 1,140 1,893 69.7
Headquarters 131 0 121 252 10.0 1 0 (6) (5) 132 0 115 247 9.1
Subtotal 583 242 1,157 1,982 78.6 44 16 98 158 627 258 1,255 2,140 78.8
Management and admin. of org. 276 1 264 541 21.4 27 (1) 10 36 303 0 274 577 21.2
TOTAL 859 243 1,421 2,523 100.0 71 15 108 194 930 258 1,529 2,717 100.0
By location
Country offices 333 214 872 1,419 56.3 30 18 100 148 363 232 972 1,567 57.7
Regional offices 119 28 164 311 12.3 13 (2) 4 15 132 26 168 326 12.0
Headquarters 407 1 385 793 31.4 28 (1) 4 31 435 0 389 824 30.3
TOTAL 859 243 1,421 2,523 100.0 71 15 108 194 930 258 1,529 2,717 100.0
Table 6. Regular resources posts by category, appropriation line and location
Figure C Regular resources posts by category and appropriation line, 2004-2005
1140
258
495
1150
132274
0
303
1529
258
930
0
500
1000
1500
2000
2500
IP
NP
GS and other
Programme support(country and regional offices)
Programme support (headquarters)
Management and administration of the organization (HQ)
Total
Total: 1893
Total: 247
Total: 577
Total: 2717
E/ICEF/2003/AB/L.14
19
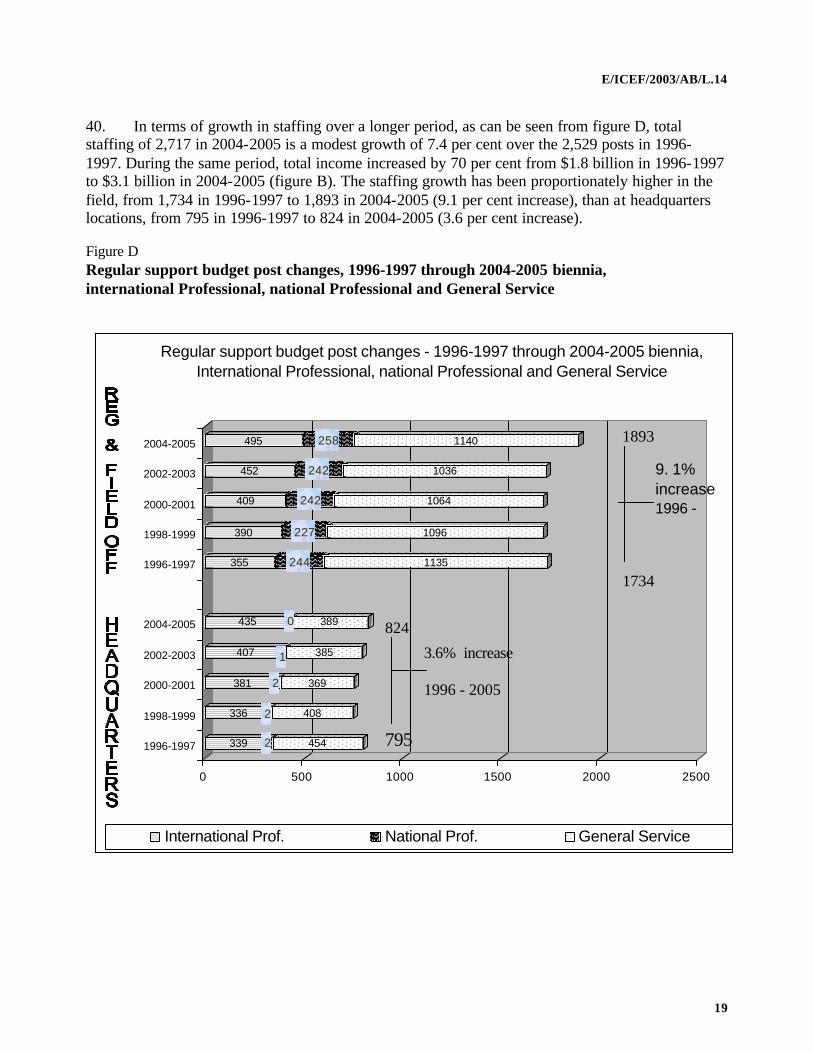
40. In terms of growth in staffing over a longer period, as can be seen from figure D, total staffing of 2,717 in 2004-2005 is a modest growth of 7.4 per cent over the 2,529 posts in 1996-1997. During the same period, total income increased by 70 per cent from $1.8 billion in 1996-1997 to $3.1 billion in 2004-2005 (figure B). The staffing growth has been proportionately higher in the field, from 1,734 in 1996-1997 to 1,893 in 2004-2005 (9.1 per cent increase), than at headquarters locations, from 795 in 1996-1997 to 824 in 2004-2005 (3.6 per cent increase). Figure D Regular support budget post changes, 1996-1997 through 2004-2005 biennia, international Professional, national Professional and General Service
339 2 454
336 2 408
381 2 369
407 1 385
435 0 389
355 244 1135
390 227 1096
409 242 1064
452 242 1036
495 258 1140
0 500 1000 1500 2000 2500
1996-1997
1998-1999
2000-2001
2002-2003
2004-2005
1996-1997
1998-1999
2000-2001
2002-2003
2004-2005
International Prof. National Prof. General Service
Regular support budget post changes - 1996-1997 through 2004-2005 biennia,International Professional, national Professional and General Service
1893
9. 1% increase1996 -
1734
824
795
3.6% increase
1996 - 2005
E/ICEF/2003/AB/L.14
20
II. Proposals for the 2004-2005 biennial support budget
A. General 41. The 2004-2005 biennium is the second biennium of the current MTSP period for 2002-2005 and, therefore, follows the same principles and context as used for the previous budget. The improved level of funding has permitted UNICEF to propose a real growth budget not only to cover inflationary increases, but also to strengthen the priority areas of its core accountabilities with focus on the achievement of the organizational priorities. 42. Summary table I provides a financial overview of the proposed budget estimates by main organizational units within each appropriation line, with major changes explained in sections B and C below. The central costs under each appropriation line include, as in the past, reimbursement for the common services provided by the United Nations, termination indemnity, war risk insurance, global training, refunds to staff members for income taxes levied by Member States, after-service health insurance costs and general operating costs for New York headquarters. 43. Summary table II provides a financial overview of the proposed budget estimates by main expenditure category within each appropriation line. Figure E provides an overview of the proposed budget estimates by main expenditure category. 44. Summary table III provides a regional distribution of resources for programmes and programme support further divided by country and regional offices within each region. 45. Summary table IV highlights the proposed changes in the number of posts financed from the support budget for each of the main components of the appropriation line. The first part of the table covers increases and decreases that are being proposed against the 2002-2003 approved base, while the second part summarizes changes in the overall grade structure as a result of confirmed reclassifications of the grade level of existing posts and functions. The average grade level of international Professional posts is maintained at 4.2. 46. Summary table V provides comparative information between the current and the proposed biennium on the total number of posts per organizational unit. 47. Summary tables VI (a) and (b) provide a financial overview, in the same format as summary tables I and II, pertaining to the support activities in other resources. These other resources pertain to support costs for activities in the Global Alliance for Vaccines and Immunization shown under other resources relating to programmes, and the procurement services shown under other resources relating to reimbursement.
E/ICEF/2003/AB/L.14
21
Figure E Expenditures by category, 2004-2005
Other staff costs2.5%
Consultants3.1%
Travel3.5%
Operating expenses
14.8%
Furniture and equipment
3.5%Reimbursements
3.3%
Posts69.4%
B. Programme support 48. The programme support component of the budget comprises two subcomponents: (a) programme support – country and regional offices; and (b) programme support – headquarters. As can be seen from table 4, programme support costs account for two thirds of the support budget. Staff resources assigned to this component, as shown in table 6, constitute 78.8 per cent of the total staff resources, of which 69.7 per cent are assigned to country and regional offices and 9.1 per cent to programme support divisions at headquarters. 1. Country and regional offices 49. Through mid-term reviews and the process of reviewing and preparing new country programmes, field offices have applied the country programme management planning and integrated budgeting approach to review the structures of country offices. The programme support structure in the field is the foundation to achieve programme results once country programmes are funded. 50. Support budget staffing in country offices follows a typology categorization in accordance with the total throughput of each office and such other factors as decentralization of the programme, complexity of the country’s administrative structure, etc.. The support budget structures for all offices are indicated in annex III together with programme throughput. 51. For small country offices, efficiency will be achieved either through a common operations centre approach, or through a backstopping network within the region. Common operations centres have been established in Argentina for the three countries in the Southern Cone; in Gabon for the three offices of Equatorial Guinea, Gabon and Sao Tome and Principe; and in Jamaica to serve Barbados, Guyana, Jamaica and Suriname. In certain areas such as human resources and IT, major
E/ICEF/2003/AB/L.14
22
support will be provided from regional offices. In order to have adequate capacity in the area of emergency communications and preparedness, seven international Professional posts are proposed to be converted from temporary assistance and other resources to established support budget posts in the regional offices. 52. The capacity for essential programme functions has been strengthened to improve advocacy and effectiveness of the country programmes with small offices, e.g., Armenia, Dominican Republic, El Salvador, Georgia, Guyana, Jamaica, Kyrgyzstan, Lebanon, Moldova, Occupied Palestinian Territory, Papua New Guinea and Turkmenistan. These will bring the minimum core capacit ies in these offices to be in line with those of similar offices.
53. The number of General Service posts has gone through continuous reduction in the last four biennia. In view of increased throughput, some of the functions have been carried out through temporary assistance or fixed-duration posts charged to programme funds. These are proposed to be converted to established posts funded from the support budget, which will free programme funds for programme activities. 54. The Representative posts in Iraq, Niger, Occupied Palestinian Territory and South Africa are reclassified from the P-5 to the D-1 level, and that of the Kazakhstan office from the D-1 to the P-5 level in view of the restructuring of the Area Office for Central Asia. The Representative posts in Afghanistan and the Democratic Republic of Congo are reclassified from the D-1 to the D-2 level. 55. At the end of 2003, the Mauritius country office will be closed to coincide with the end of the country programme. One Representative post will be established in Bulgaria where the office will be sharing common services with the United Nations Development Programme to support the country programme. 56. Programme functions in the regional offices are reviewed in light of the progress made against programme priorities. Necessary changes are made within the existing staffing structure. It is proposed that six posts, previously carried out through temporary assistance and posts charged to other resources programme funds, be converted to established posts in the support budget. These are: one advisory position for malaria in the Eastern and Southern Africa Regional Office; two advisers for social policy and HIV/AIDS in the Regional Office for South Asia; one programme officer for youth in the East Asia and the Pacific Regional Office; one child protection adviser in the Middle East and North Africa Regional Office; and one HIV/AIDS adviser in the Central and Eastern Europe (CEE), the Commonwealth of Independent States (CIS) and the Baltic States Regional Office. 57. Increased operating costs in field offices are mainly for security, such as cost-sharing for UNSECOORD and IT firewalls in the central costs, and necessary compliance to the minimum operating security standards. The central costs for country and regional offices of $23.4 million includes termination costs ($6.6 million), training ($4.2 million), security cost-sharing with UNSECOORD ($9.7 million), after-service health insurance ($2.7 million), malicious acts insurance ($1.2 million), IT firewalls ($1.2 million), reimbursement of taxes ($3 million), miscellaneous services ($0.6 million) and a reduction for anticipated vacancy ($5.8 million).
E/ICEF/2003/AB/L.14
23
2. Headquarters 58. Headquarters provides overall strategic direction and guidance that reflect linkages to the United Nations system and the policy guidance of the Executive Board, with responsibility for strategic planning, advocacy and oversight for the organization as a whole. Headquarters also provides leadership in developing the global UNICEF perspective by integrating the experiences and contributions of all parts of the organization and by ensuring that the global perspective informs planning, policy development and guidelines for management and quality assurance. Headquarters programme support 59. Programme support divisions and sections at headquarters are Programme Division, the Office of Emergency Programmes, the Innocenti Research Centre, Supply Division and the Strategic Planning and Programme Guidance Section of the Division of Policy and Planning. 60. For headquarters programme support, the total budget has been increased by $18.6 million. This comprises a volume increase of $4.5 million and a cost increase of $14.1 million. 61. The Office of Emergency Programmes has an increase of five posts. The post of chief of the Humanitarian Policy Unit is offset by the transfer of a P-5 post from Geneva. The operations centre has been strengthened with the remaining four posts at the P-2 level, formerly under temporary assistance paid from programme funds, to maintain a 24-hour communication and coordination hub for managing humanitarian, staff security and crisis information, and related communication throughout the organization. The operations centre also provides back-up support for the operations centre in the United Nations Secretariat. 62. While Supply Division has also been provided with a senior logistics capacity for emergencies at the P-5 level, there is a net decrease of four posts in the support budget to reduce the cost increases through efficiency measures. The self- financed warehouse capacity is being strengthened with the additional cost of $1.6 million for the next biennium, which will be fully covered from the handling fees of the supplies issued out of the Copenhagen warehouse. The warehouse also provides a storage facility for stockpiles of such other agencies as the Office of the United Nations High Commissioner for Refugees and the International Federation of Red Cross and Red Crescent Societies. 63. The procurement services throughput has increased from $190 million in 2002-2003 to an estimate of over $300 million in the next biennium. Taking this into account, the budget covered from the handling fees for procurement services has been increased from $8.6 million to $15.1 million as indicated in summary table VI (a). These costs will vary in accordance with the throughput of procurement services. The staffing table, however, does not indicate increases in the number of staff funded by other resources relating to reimbursement as these will be reviewed periodically by the Procurement Services Management Group based upon actual throughputs. 64. Following the reorganization of the Programme Group in the last biennium, minimal changes are proposed in Programme Division. An additional P-5 level post is proposed for
E/ICEF/2003/AB/L.14
24
conversion from other resources to the support budget to strengthen the core capacity in the MTSP priority area of child protection. Through a prioritization exercise, the Division has redeployed posts to add capacity in the Child Protection Section and in the Field Support and Inter-agency Collaboration Section to support United Nations reform on simplification and harmonization. The total number of posts remains at the current level of 93. 65. For more coherence within the Division of Policy and Planning and to ensure better interaction with the rest of the organization and external partners, the Strategic Planning and Programme Guidance Units have been combined into one section. Staff responsible for global policy and partnerships have been redeployed, decreasing the total number of posts in this unit from 11 to 7. C. Management and administration of the organization 66. The offices and divisions grouped under the management and administration budget are the Office of the Executive Director, the Division of Policy and Planning, the Evaluation Office, the Office of Internal Audit, the Office of the Secretary of the Executive Board, the Programme Funding Office, the Office of United Nations Affairs and External Relations, the Office of Public Partnerships, the Division of Communication, the Division of Human Resources, the Division of Financial and Administrative Management, the Information Technology Division (ITD), the Office for Japan and the Regional Office for Europe in Geneva. 67. In the Office of the Executive Director, it is proposed to upgrade the post of Director and Chief of Staff to the D-1 level to reflect the duties and responsibilities of the post. The position provides support and strategic advice to the Executive Director, helps to guide the decision-making processes at the executive level, provides support to ensure follow-up to decisions, deals with matters requiring coordination or delegation from the Office of the Executive Director, and ensures effective and efficient management of the Office. 68. The Division of Policy and Planning has been strengthened with the addition of one P-5 position in the Policy Section, with the responsibility of assuring the technical quality of the content of the UNICEF flagship publication, The State of the World’s Children report, published annually to report on children’s issues in the world. With this additional post, the Division’s staffing level would have been 40. However, the redeployment of three posts dealing with public partnerships to the new Office of Public Partnerships brings the total number of posts to 37. 69. In order to ensure the accountability of UNICEF and establish a credible system of results-based programming and management, which is one of the key requirements identified in the MTSP, it is proposed to add a P-5 level position in the Evaluation Office. This post will strengthen the use of the evaluation function at the strategic and policy-related levels, especially in relation to the MTSP, by conducting thematic evaluations and evaluations of organizational effectiveness, and by contributing to country programme evaluations. 70. The Programme Funding Office’s Contributions Management Unit has been strengthened with the addition of a General Service post. In addition, one post has been converted from temporary assistance to establish an additional fund-raising cluster. Through internal
E/ICEF/2003/AB/L.14
25
redeployments, the Strategic Information and Analysis Unit has also been strengthened to provide enhanced monitoring and analysis of strategic fund-raising information. 71. Following the Special Session on Children the adoption of A World Fit for Children, UNICEF needed to reinforce its work with CSOs to promote the process of social transformation that benefits children and young people. In order to strengthen, expand and monitor the effectiveness of strategic global partnerships to support the achievement of the MTSP, an Office of Public Partnerships was initiated in 2002 through the redeployment of four posts from the Division of Policy and Planning and the Office of United Nations Affairs and External Re lations. The current proposal is to formalize the establishment of this office with a total of six positions in New York and one in Geneva to provide the minimum capacity required to deliver its targets. The proposal includes the reclassification of the post of Director of the office from the P-5 to the D-1 level. 72. UNICEF has refreshed its brand to strengthen its efforts to act and advocate for children. The brand is directly related to the UNICEF vision, mission and values. The Division of Communication needs to devote sustained support to the implementation of the new brand, and complete the redevelopment of the UNICEF website. Taking the dynamic working environment into account, some structural changes in the Division have been made with a net increase of two posts from the current biennium. Of these two, the cost of one post has been absorbed through savings from internal restructuring. The second is a technical addition. In order to ensure a transparent structure showing total staffing to meet the accountability of functional divisions/offices, all posts providing services to the Private Sector Division (PSD) were transferred to the post tables of the respective offices with reimbursement from PSD during the last biennium. In the current biennium, one senior communication advisor post at the P-5 level in the Brand, Design and Photography Section has been added to the Division of Communication with reimbursement from PSD. 73. In DHR, critical capacity has been created at the global level with the conversion of four posts currently funded from other resources and through temporary assistance: a stress counsellor to create a core advisory capacity in this area; an emergency learning officer to coordinate the further development and implementation of the learning programme for staff in dealing with emergencies; and two posts to support implementation of IMIS payroll by UNICEF to perform several functions previously performed by the United Nations Payroll Section under the legacy payroll. 74. The Division of Financial and Administrative Management has begun to see the benefits of the introduction of integrated global systems and through internal efficiency measures proposes a reduction of two posts. The addition of one post for additional treasury functions transferred from Supply Division in Copenhagen brings the net reduction of posts to one. 75. With the move of PSD from New York to Geneva completed in 2002, the responsibilities of the Regional Office for Europe in Geneva to manage relations with 37 National Committees for UNICEF are further consolidated to promote resource mobilization and advocacy in support of the MTSP. The Office for Europe has a total increase of four international Professional and four General Service posts. One post has been added in Geneva to deal with CSOs as an outposting of the Office of Public Partnerships, as mentioned under paragraph 71 above. The second post is for the functions related to the work of the Committee on the Rights of the Child, which is based in
E/ICEF/2003/AB/L.14
26
Geneva. This is done in close collaboration with the Division of Policy and Planning at New York headquarters. A Common Services Section provides support to all the Geneva-based offices in the areas of finance and office administration, human resources management, and IT systems and services. In this section, two international Professional posts will strengthen the human resources and emergency telecommunications capacities. The addition of General Service positions in the IT Unit of the Common Services Section is cost-neutral conversion of these functions currently provided through temporary fixed-term contracts. 76. In continuation of the strategic decision to invest in IT to create the enabling environment for better business processes and effectiveness, the top priority in ITD has been to protect the investments and stabilize the systems, improve integration between the systems, build staffing capacity and contain the growth of maintenance costs in an environment of increasing demand and usage. The core ITD budget of $49.9 million proposed for 2004-2005 includes only cost increases and the maintenance cost of investment projects approved in the last biennium. 77. Within this budget, and in line with the policy of converting key functions currently performed by consultants in investment areas that will continue as recurrent costs, a total of six international Professional and six General Service positions have been converted to support budget posts in ITD. 78. As described under paragraphs 14 and 30-33 above, an additional one-time investment of $19.4 million is proposed for the next biennium. The detailed distribution of the ITD recurrent budget ($49.9 million) and new investments are provided in table 7 together with an itemized breakdown of key activities. The recurrent budget reflects a volume increase of $2.9 million for additional maintenance costs of previously approved investment projects and a cost increase of $5.1 million over the approved ITD budget of $41.9 million in 2002-2003. Table 8 provides the estimated distribution of IT requirements broken down by category of expenses and includes hardware and software requirements of offices outside New York. 79. Apart from the division/office level allocations for headquarters (summary table I), the proposal includes a total of $59.1 million ($16.9 million for programme support and $42.2 million for management and administration) of such centrally administered costs as common operating costs, central communications, reimbursements and cost-sharing, termination, taxes, training and after-service health insurance offset by anticipated savings due to vacancies. This represents cost increases of $4.9 million and volume increases of $0.6 million in security-related costs over the 2002-2003 allocations.
E/ICEF/2003/AB/L.14
27
Purpose Activities Amount Activities Amount
I. Application systems integration
I.1. Programme Manager System/systems Integration
Ongoing maintenance and enhancement. 8,307.0
Improvements in integration and documentation 622.0
I.2 Financial and Logistics System (FLS)
Ongoing maintenance and simplification in line with business process simplification. 3,922.8
Grants Module and Budget Control System and other enhancements to improve work processes using FLS. 3,694.0
I.3 SAP HR/IMIS Ongoing maintenance 2,013.5 Replacement of IMIS 6,000.0
I.3 Reporting Ongoing maintenance 1,429.9Improvements in web reporting and infrastructure 2,850.0
Subtotal 15,673.2 13166.0
II. Disaster Recovery
II.1 Business continuity 3,000.0
II.2 IT Security
Ongoing maintenance of IT security awareness, policy, practices and implementation of technical solutions 1,523.0
Subtotal 1,523.0 3,000.0
III. Infrastructure and Connectivity
III.1 Infrastructure and Enterprise Management
Maintenance of a global, common, cost effective and robust IT infrastructure 15,138.9
New upgrades in enterprise platforms, increase in storage capacity; firewall project for the field offices 3,204.0
III. 2 Global telecommunicationsManagement and sustenance of global network connectivity 2,915.7
Subtotal 18,054.6 3,204.0
IV. Intranet/Extranet
Promotion and support information sharing and learning utilizing IT; continued development and support of IT infrastructure for information management 1,870.1
V. Customer and end-user support
Effect smooth technology and business change through technology for field offices and functional HQ divisions utilizing improved process, change and control management. 9,025.1
VI. Overall IT management
Provide leadership, directiion and effective resouce management for IT division and IT function of UNICEF. 3,753.4
Subtotal 49,899.3 19,370.0
Less: PSD reimbursement -484.7
Grand total 49,899.3 a/ 18,885.3 b/
a/ IT recurrent: Programme Support - $5.705.9 and Management and Administration - $44,193.4.b/ IT investments: Programme Support - Field - $1,200.0; Programme Support HQ - $3,456.9 and Management and Administration - $14,228.4.
Recurrent Investments
Table 7. Distribution of recurrent costs and new investments, 2004-2005
(In thousands of United States dollars)
E/ICEF/2003/AB/L.14
28
Contractual services Acquis.
Staff Systems Maint. hard., soft.,
Purpose costs devel. services supplies Other Total
I. PRODUCTION AND RECURRENT MAINTENANCE
2002-2003 22,978.3 0.0 10,195.3 11,445.0 1,683.6 46,302.2 a/
2004-2005 28,365.9 0.0 12,093.0 11,952.7 655.0 53,066.6 b/
II. SYSTEMS UPGRADE AND MAJOR PROJECTS
Application systems integration
2002-2003 c/ 1,021.4 0.0 1,212.8 34.5 2,268.7
2004-2005 1,565.5 8,061.2 598.3 2,767.0 174.0 13,166.0
Disaster Recovery
2002-2003 825.5 0.0 0.0 523.0 45.3 1,393.8
2004-2005 840.0 0.0 1,210.0 910.0 40.0 3,000.0
Infrastructure and Connectivity
2002-2003
2004-2005 1,141.5 315.0 295.0 1,447.5 5.0 3,204.0
Subtotal: II. Development of major systems
2002-2003 825.5 1,021.4 0.0 1,735.8 79.8 3,662.5
2004-2005 3,547.0 8,376.2 2,103.3 5,124.5 219.0 19,370.0
Less: PSD reimbursement -484.7
III. GRAND TOTAL (net of PSD)
2002-2003 23,803.8 1,021.4 10,195.3 13,180.8 1,763.3 49,964.6
2004-2005 31,912.9 8,376.2 14,196.3 17,077.2 874.0 71,951.8
a/ ITD budget of $41.9 million plus $4.4 million from outside New York offices.
b/ ITD budget of $49.9 million plus $3.1 million for computer equipment outside New York.
c/ Includes FLS upgrade and archiving project in 2002-2003.
Table 8. Estimated distribution of information technology requirements, 2004-2005
(In thousands of United States dollars)
E/ICEF/2003/AB/L.14
29
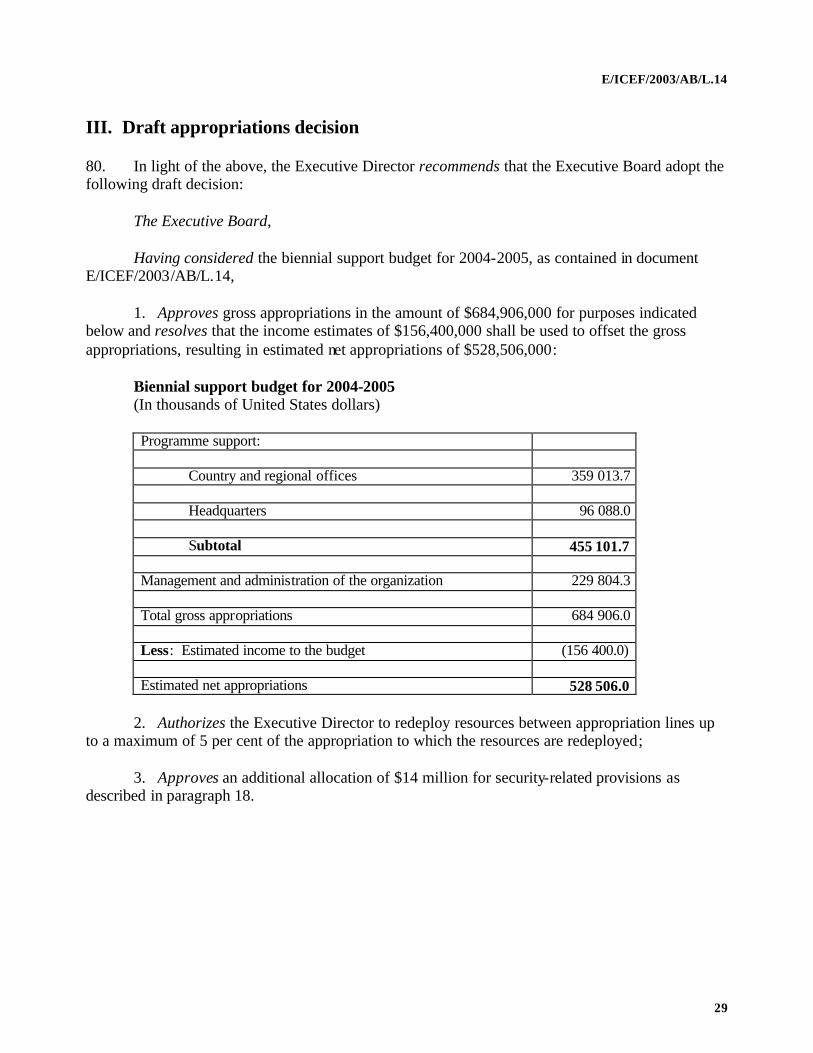
III. Draft appropriations decision 80. In light of the above, the Executive Director recommends that the Executive Board adopt the following draft decision:
The Executive Board, Having considered the biennial support budget for 2004-2005, as contained in document
E/ICEF/2003/AB/L.14,
1. Approves gross appropriations in the amount of $684,906,000 for purposes indicated below and resolves that the income estimates of $156,400,000 shall be used to offset the gross appropriations, resulting in estimated net appropriations of $528,506,000:
Biennial support budget for 2004-2005 (In thousands of United States dollars) Programme support: Country and regional offices 359 013.7 Headquarters 96 088.0 Subtotal 455 101.7 Management and administration of the organization 229 804.3 Total gross appropriations 684 906.0 Less: Estimated income to the budget (156 400.0) Estimated net appropriations 528 506.0
2. Authorizes the Executive Director to redeploy resources between appropriation lines up
to a maximum of 5 per cent of the appropriation to which the resources are redeployed; 3. Approves an additional allocation of $14 million for security-related provisions as
described in paragraph 18.
E/ICEF/2003/AB/L.14
30
2002-2003
Appropriation line/ approved Volume 2004-2005
organizational unit appropriations Amount % Cost estimates
A. Programme support
1. Country and regional offices
West and Central Africa region 56,455.9 1,185.3 2.1 12,862.5 70,503.7
Eastern and Southern Africa region 57,351.1 3,028.5 5.3 9,200.8 69,580.4
The Americas and the Caribbean region 43,760.9 1,879.7 4.3 2,539.7 48,180.3
East Asia and the Pacific region 34,270.1 1,375.5 4.0 5,052.8 40,698.4
South Asia region 31,337.2 579.8 1.9 4,576.4 36,493.4
Middle East and North Africa region 32,541.1 1,289.2 4.0 3,682.5 37,512.8
CEE, CIS and the Baltic States region 23,389.8 4,883.4 20.9 4,378.5 32,651.7
Country and regional offices: Central 16,547.3 7,140.9 43.2 (295.2) 23,393.0
Subtotal 295,653.4 21,362.3 7.2 41,998.0 359,013.7
2. Headquarters
Programme Division 24,741.5 616.9 2.5 3,001.6 28,360.0
Division of Policy and Planning 3,060.5 (944.2) (30.9) 267.0 2,383.3
Office of Emergency Programmes 4,300.1 1,075.7 25.0 564.2 5,940.0
Innocenti Research Centre (Florence) 378.6 8.9 2.4 151.7 539.2
RO for Europe (Geneva) - Emergency Section 2,029.1 (308.0) (15.2) 309.3 2,030.4
IT: PROMS and field support 5,283.1 (8.3) (0.2) 431.1 5,705.9
IT Investment projects 0.0 3,456.9 100.0 0.0 3,456.9
Supply Division 24,822.3 251.4 1.0 5,706.7 30,780.4
Headquarters: Programme support: Central 12,847.7 358.8 2.8 3,685.4 16,891.9
Subtotal 77,462.9 4,508.1 5.8 14,117.0 96,088.0
Subtotal: Programme support 373,116.3 25,870.4 6.9 56,115.0 455,101.7
B. Management and administration of organization
Office of the Executive Director 6,249.9 18.7 0.3 862.1 7,130.7
Division of Policy and Planning 8,061.8 632.7 7.8 1,004.3 9,698.8
Evaluation office 2,190.5 373.4 17.0 318.5 2,882.4
Office of Internal Audit 6,619.0 (145.7) (2.2) 899.2 7,372.5
Office of the Secretary of the Executive Board 2,376.7 7.1 0.3 257.7 2,641.5
Programme Funding Office 7,610.8 94.5 1.2 1,034.4 8,739.7
Office of UN Affairs and External Relations 2,256.3 (284.8) (12.6) 160.5 2,132.0
Office of Public Partnerships 0.0 2,098.2 100.0 0.0 2,098.2
Division of Communication 18,740.3 608.7 3.2 1,339.7 20,688.7
Division of Human Resources 17,199.3 1,264.9 7.4 1,556.5 20,020.7
Division of Financial and Admin. Management 24,292.0 245.1 1.0 2,052.6 26,589.7
Information Technology Division 36,705.1 2,853.7 7.8 4,634.6 44,193.4
IT investment projects 3,662.5 10,565.9 100.0 0.0 14,228.4
Office for Japan 3,601.8 145.5 4.0 155.3 3,902.6
Regional Office for Europe (Geneva) 12,705.4 372.1 2.9 2,211.9 15,289.4
Headquarters: Management and admin.: Central 40,781.3 246.4 0.6 1,167.9 42,195.6
Subtotal: Management and admin. of org. 193,052.7 19,096.4 9.9 17,655.2 229,804.3
TOTAL GROSS BUDGET ESTIMATES 566,169.0 44,966.8 7.9 73,770.2 684,906.0
Estimated income (88,300.0) (68,100.0) 77.1 0.0 (156,400.0)
TOTAL NET BUDGET ESTIMATES 477,869.0 (23,133.2) (4.8) 73,770.2 528,506.0
Summary table I. Budget estimates by organizational unit within appropriation line, 2004-2005
(In thousands of United States dollars)
E/ICEF/2003/AB/L.14
31
2002-2003
Appropriation line/ approved Volume 2004-2005
expenditure category appropriations Amount % Cost estimates
A. Programme support
1. Country and regional offices
Posts 204,839.3 18,285.0 8.9 40,460.0 263,584.3
Other staff costs 8,242.7 (1,923.9) (23.3) 44.8 6,363.6
Consultants 987.1 (60.8) (6.2) 40.7 967.0
Travel 12,651.1 14.2 0.1 364.1 13,029.4
Operating expenses 50,620.9 1,599.5 3.2 841.1 53,061.5
Furniture and equipment 7,209.9 1,064.4 14.8 164.5 8,438.8 Reimbursements a/ 11,102.4 2,383.9 21.5 82.8 13,569.1
Subtotal 295,653.4 21,362.3 7.2 41,998.0 359,013.7
2. Headquarters b/
Posts 54,812.7 (467.6) (0.9) 9,848.8 64,193.9
Other staff costs 2,749.2 807.0 29.4 742.8 4,299.0
Consultants 2,379.5 2,147.8 90.3 155.3 4,682.6
Travel 2,916.6 (99.3) (3.4) 589.9 3,407.2
Operating expenses 11,313.5 1,311.0 11.6 2,178.6 14,803.1
Furniture and equipment 1,337.7 516.9 38.6 46.5 1,901.1
Reimbursements a/ 1,953.7 292.3 15.0 555.1 2,801.1
Subtotal 77,462.9 4,508.1 5.8 14,117.0 96,088.0
Subtotal : Programme support 373,116.3 25,870.4 6.9 56,115.0 455,101.7
B. Management and administration of organization b/
Posts 127,126.6 9,383.8 7.4 10,751.9 147,262.3
Other staff costs 4,065.1 2,106.3 51.8 281.8 6,453.2
Consultants 10,356.1 4,533.7 43.8 518.9 15,408.7
Travel 5,556.3 723.7 13.0 1,072.5 7,352.5
Operating expenses 31,536.7 (75.7) (0.2) 2,151.9 33,612.9
Furniture and equipment 10,765.6 2,258.6 21.0 557.4 13,581.6 Reimbursements a/ 3,646.3 166.0 4.6 2,320.8 6,133.1
Subtotal: Management and admin. of org. 193,052.7 19,096.4 9.9 17,655.2 229,804.3
TOTAL
Posts 386,778.6 27,201.2 7.0 61,060.7 475,040.5
Other staff costs 15,057.0 989.4 6.6 1,069.4 17,115.8
Consultants 13,722.7 6,620.7 48.2 714.9 21,058.3
Travel 21,124.0 638.6 3.0 2,026.5 23,789.1
Operating expenses 93,471.1 2,834.8 3.0 5,171.6 101,477.5
Furniture and equipment 19,313.2 3,839.9 19.9 768.4 23,921.5
Reimbursements a/ 16,702.4 2,842.2 17.0 2,958.7 22,503.3
TOTAL GROSS BUDGET ESTIMATES 566,169.0 44,966.8 7.9 73,770.2 684,906.0
Estimated income (88,300.0) (68,100.0) 77.1 - (156,400.0)
TOTAL NET BUDGET ESTIMATES 477,869.0 (23,133.2) (4.8) 73,770.2 528,506.0
a/ Includes contributions to joint activities and joint services, and reimbursements from PSD.
b/ Includes IT investments:Posts
(Training)Other staff
costs Consultants Travel Operating Expenses
Furniture/ Equipment
Reimburse-ments Total
Programme support 45.0 84.0 1,976.7 105.0 291.3 970.0 -15.1 3,456.9
Management and administration 925.5 2,162.5 6,299.5 114.0 1,587.0 3,609.5 -469.6 14,228.4 Total 970.5 2,246.5 8,276.2 219.0 1,878.3 4,579.5 -484.7 17,685.3
Summary table II. Budget estimates by expenditure category within appropriation line, 2004-2005
(In thousands of United States dollars)
E/ICEF/2003/AB/L.14
32
2002-2003 2004-2005
Regular Other Subtotal Trust Total Regular Other Subtotal Trust Total
resources resources resources funds resources resources resources resources funds resources
amount amount amount % amount amount amount a/ amount amount % amount amount
WEST AND CENTRAL AFRICA REGION
A. Programmes 171,021.0 133,137.4 304,158.4 0.0 304,158.4 171,021.0 191,321.5 362,342.5 0.0 362,342.5
B. Programme support
Country offices 46,543.3 0.0 46,543.3 0.0 46,543.3 55,975.8 0.0 55,975.8 0.0 55,975.8
Regional office 9,912.6 0.0 9,912.6 0.0 9,912.6 14,527.9 0.0 14,527.9 0.0 14,527.9
Subtotal, Programme support 56,455.9 0.0 56,455.9 0.0 56,455.9 70,503.7 0.0 70,503.7 0.0 70,503.7
Total, West and Central Africa region 227,476.9 133,137.4 360,614.3 15.5 0.0 360,614.3 241,524.7 191,321.5 432,846.2 14.3 0.0 432,846.2
EASTERN AND SOUTHERN AFRICA REGION
A. Programmes 155,595.2 238,652.6 394,247.8 0.0 394,247.8 155,595.2 274,705.6 430,300.8 0.0 430,300.8
B. Programme support
Country offices 46,900.2 0.0 46,900.2 0.0 46,900.2 55,052.5 0.0 55,052.5 0.0 55,052.5
Regional office 10,450.9 0.0 10,450.9 0.0 10,450.9 14,527.9 0.0 14,527.9 0.0 14,527.9
Subtotal, Programme support 57,351.1 0.0 57,351.1 0.0 57,351.1 69,580.4 0.0 69,580.4 0.0 69,580.4
Total, Eastern and Southern Africa region 212,946.3 238,652.6 451,598.9 19.4 0.0 451,598.9 225,175.6 274,705.6 499,881.2 16.5 0.0 499,881.2
THE AMERICAS AND THE CARIBBEAN REGION
A. Programmes 43,590.7 103,468.4 147,059.1 0.0 147,059.1 43,590.7 88,260.8 131,851.5 0.0 131,851.5
B. Programme support
Country offices 34,798.0 0.0 34,798.0 0.0 34,798.0 38,237.9 0.0 38,237.9 0.0 38,237.9
Regional office 8,962.9 0.0 8,962.9 0.0 8,962.9 9,942.5 0.0 9,942.5 0.0 9,942.5
Subtotal, Programme support 43,760.9 0.0 43,760.9 0.0 43,760.9 48,180.4 0.0 48,180.4 0.0 48,180.4
Total, The Americas and the Caribbean region 87,351.6 103,468.4 190,820.0 8.2 0.0 190,820.0 91,771.1 88,260.8 180,031.9 5.9 0.0 180,031.9
EAST ASIA AND THE PACIFIC REGION
A. Programmes 80,965.3 113,217.5 194,182.8 0.0 194,182.8 80,965.3 117,121.0 198,086.3 0.0 198,086.3
B. Programme support
Country offices 26,808.2 0.0 26,808.2 0.0 26,808.2 30,460.2 0.0 30,460.2 0.0 30,460.2
Regional office 7,461.9 0.0 7,461.9 0.0 7,461.9 10,238.2 0.0 10,238.2 0.0 10,238.2
Subtotal, Programme support 34,270.1 0.0 34,270.1 0.0 34,270.1 40,698.4 0.0 40,698.4 0.0 40,698.4
Total, East Asia and the Pacific region 115,235.4 113,217.5 228,452.9 9.8 0.0 228,452.9 121,663.7 117,121.0 238,784.7 7.9 0.0 238,784.7
SOUTH ASIA REGION
A. Programmes 143,273.3 192,173.2 335,446.5 7,000.0 342,446.5 143,273.3 372,685.9 515,959.2 0.0 515,959.2
B. Programme support
Country offices 25,477.0 0.0 25,477.0 0.0 25,477.0 28,583.8 0.0 28,583.8 0.0 28,583.8
Regional office 5,860.2 0.0 5,860.2 0.0 5,860.2 7,909.6 0.0 7,909.6 0.0 7,909.6
Subtotal, Programme support 31,337.2 0.0 31,337.2 0.0 31,337.2 36,493.4 0.0 36,493.4 0.0 36,493.4
Total, South Asia region 174,610.5 192,173.2 366,783.7 15.8 7,000.0 373,783.7 179,766.7 372,685.9 552,452.6 18.2 0.0 552,452.6
Summary table III. Use of resources: estimated regional distribution of programmes and programme support
(In thousands of United States dollars)
E/ICEF/2003/AB/L.14
33
2002-2003 2004-2005
Regular Other Subtotal Trust Total Regular Other Subtotal Trust Total
resources resources resources funds resources resources resources resources funds resources
amount amount amount % amount amount amount a/ amount amount % amount amount
MIDDLE EAST AND NORTH AFRICA REGION
A. Programmes 46,488.0 95,317.7 141,805.7 163,000.0 304,805.7 46,488.0 288,231.7 334,719.7 1,000.0 335,719.7
B. Programme support
Country offices 24,357.9 0.0 24,357.9 0.0 24,357.9 28,437.6 0.0 28,437.6 0.0 28,437.6
Regional office 8,183.2 0.0 8,183.2 0.0 8,183.2 9,075.2 0.0 9,075.2 0.0 9,075.2
Subtotal, Programme support 32,541.1 0.0 32,541.1 0.0 32,541.1 37,512.8 0.0 37,512.8 0.0 37,512.8
Total, Middle East and North Africa region 79,029.1 95,317.7 174,346.8 7.5 163,000.0 337,346.8 84,000.8 288,231.7 372,232.5 12.3 1,000.0 373,232.5
CEE, CIS and the BALTIC STATES REGION
A. Programmes 33,274.4 92,644.8 125,919.2 0.0 125,919.2 33,274.4 109,489.6 142,764.0 0.0 142,764.0
B. Programme support
Country offices 15,939.8 0.0 15,939.8 0.0 15,939.8 23,731.1 0.0 23,731.1 0.0 23,731.1
Regional office 7,450.0 0.0 7,450.0 0.0 7,450.0 8,920.6 0.0 8,920.6 0.0 8,920.6
Subtotal, Programme support 23,389.8 0.0 23,389.8 0.0 23,389.8 32,651.7 0.0 32,651.7 0.0 32,651.7
Total, CEE, CIS and the Baltic States region 56,664.2 92,644.8 149,309.0 6.4 0.0 149,309.0 65,926.1 109,489.6 175,415.7 5.8 0.0 175,415.7
INTERCOUNTRY
A. Programmes 12,670.0 30,742.8 43,412.8 1.9 0.0 43,412.8 17,435.5 57,782.5 75,218.0 2.5 0.0 75,218.0
UNALLOCATED PROGRAMMES -16,877.9 124,645.7 107,767.8 4.6 265,000.0 372,767.8 131,356.6 58,401.4 189,758.0 6.3 246,600.0 436,358.0
CENTRAL PROGRAMME SUPPORT
Country and regional offices 16,547.3 0.0 16,547.3 0.7 0.0 16,547.3 23,393.0 0.0 23,393.0 0.8 0.0 23,393.0
Headquarters 77,462.9 0.0 77,462.9 3.3 0.0 77,462.9 96,088.0 0.0 96,088.0 3.2 0.0 96,088.0
Income to budget
Country and regional offices -45,600.0 37,300.0 -8,300.0 3,300.0 -5,000.0 -65,900.0 58,300.0 -7,600.0 2,600.0 -5,000.0
Headquarters programme support -22,000.0 10,200.0 -11,800.0 3,300.0 -8,500.0 -35,600.0 23,600.0 -12,000.0 6,700.0 -5,300.0
Management and administration of org. -20,700.0 9,000.0 -11,700.0 2,400.0 -9,300.0 -54,900.0 42,100.0 -12,800.0 3,100.0 -9,700.0
Subtotal-income to budget -88,300.0 56,500.0 -31,800.0 9,000.0 -22,800.0 -156,400.0 124,000.0 -32,400.0 12,400.0 -20,000.0
TOTAL UNICEF
A. Programmes 670,000.0 1,124,000.1 1,794,000.1 77.0 435,000.0 2,229,000.1 823,000.0 1,558,000.0 2,381,000.0 78.5 247,600.0 2,628,600.0
B. Programme support
Country and regional offices 250,053.4 37,300.0 287,353.4 12.3 3,300.0 290,653.4 293,113.8 58,300.0 351,413.8 11.6 2,600.0 354,013.8
Headquarters 55,462.9 10,200.0 65,662.9 2.8 3,300.0 68,962.9 60,488.0 23,600.0 84,088.0 2.8 6,700.0 90,788.0
Subtotal, Programme support 305,516.3 47,500.0 353,016.3 15.2 6,600.0 359,616.3 353,601.8 81,900.0 435,501.8 14.4 9,300.0 444,801.8
Total, Programmes and programme support 975,516.3 1,171,500.1 2,147,016.4 92.2 441,600.0 2,588,616.4 1,176,601.8 1,639,900.0 2,816,501.8 92.8 256,900.0 3,073,401.8
C. Management and administration of org. 172,352.7 9,000.0 181,352.7 7.8 2,400.0 183,752.7 174,904.3 42,100.0 217,004.3 7.2 3,100.0 220,104.3
TOTAL - UNICEF 1,147,869.0 1,180,500.1 2,328,369.1 100.0 444,000.0 2,772,369.1 1,351,506.1 1,682,000.0 3,033,506.1 100.0 260,000.0 3,293,506.1
Note a/: Includes estimated planning levels and estimated proceeds from card sales. The exact allocation country by country is done on an annual basis in accordance with Board Decision 1997/18. For 2004 this will be done towards the end of 2003.
Summary table III. Use of resources: estimated regional distribution of programmes and programme support (continued)
(In thousands of United States dollars)
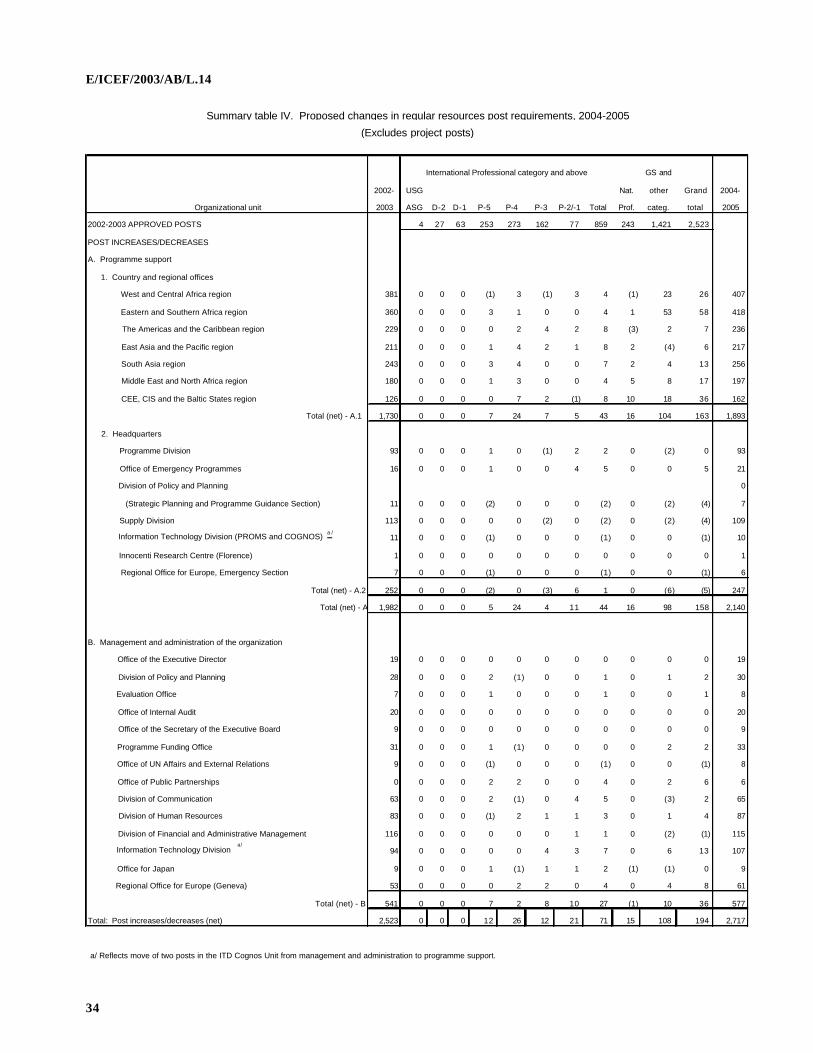
E/ICEF/2003/AB/L.14
34
International Professional category and above GS and
2002- USG Nat. other Grand 2004-
Organizational unit 2003 ASG D-2 D-1 P-5 P-4 P-3 P-2/-1 Total Prof. categ. total 2005
2002-2003 APPROVED POSTS 4 27 63 253 273 162 77 859 243 1,421 2,523
POST INCREASES/DECREASES
A. Programme support
1. Country and regional offices
West and Central Africa region 381 0 0 0 (1) 3 (1) 3 4 (1) 23 26 407
Eastern and Southern Africa region 360 0 0 0 3 1 0 0 4 1 53 58 418
The Americas and the Caribbean region 229 0 0 0 0 2 4 2 8 (3) 2 7 236
East Asia and the Pacific region 211 0 0 0 1 4 2 1 8 2 (4) 6 217
South Asia region 243 0 0 0 3 4 0 0 7 2 4 13 256
Middle East and North Africa region 180 0 0 0 1 3 0 0 4 5 8 17 197
CEE, CIS and the Baltic States region 126 0 0 0 0 7 2 (1) 8 10 18 36 162
Total (net) - A.1 1,730 0 0 0 7 24 7 5 43 16 104 163 1,893
2. Headquarters
Programme Division 93 0 0 0 1 0 (1) 2 2 0 (2) 0 93
Office of Emergency Programmes 16 0 0 0 1 0 0 4 5 0 0 5 21
Division of Policy and Planning 0
(Strategic Planning and Programme Guidance Section) 11 0 0 0 (2) 0 0 0 (2) 0 (2) (4) 7
Supply Division 113 0 0 0 0 0 (2) 0 (2) 0 (2) (4) 109
Information Technology Division (PROMS and COGNOS) a /
11 0 0 0 (1) 0 0 0 (1) 0 0 (1) 10
Innocenti Research Centre (Florence) 1 0 0 0 0 0 0 0 0 0 0 0 1
Regional Office for Europe, Emergency Section 7 0 0 0 (1) 0 0 0 (1) 0 0 (1) 6
Total (net) - A.2 252 0 0 0 (2) 0 (3) 6 1 0 (6) (5) 247
Total (net) - A 1,982 0 0 0 5 24 4 11 44 16 98 158 2,140
B. Management and administration of the organization
Office of the Executive Director 19 0 0 0 0 0 0 0 0 0 0 0 19
Division of Policy and Planning 28 0 0 0 2 (1) 0 0 1 0 1 2 30
Evaluation Office 7 0 0 0 1 0 0 0 1 0 0 1 8
Office of Internal Audit 20 0 0 0 0 0 0 0 0 0 0 0 20
Office of the Secretary of the Executive Board 9 0 0 0 0 0 0 0 0 0 0 0 9
Programme Funding Office 31 0 0 0 1 (1) 0 0 0 0 2 2 33
Office of UN Affairs and External Relations 9 0 0 0 (1) 0 0 0 (1) 0 0 (1) 8
Office of Public Partnerships 0 0 0 0 2 2 0 0 4 0 2 6 6
Division of Communication 63 0 0 0 2 (1) 0 4 5 0 (3) 2 65
Division of Human Resources 83 0 0 0 (1) 2 1 1 3 0 1 4 87
Division of Financial and Administrative Management 116 0 0 0 0 0 0 1 1 0 (2) (1) 115
Information Technology Division a/
94 0 0 0 0 0 4 3 7 0 6 13 107
Office for Japan 9 0 0 0 1 (1) 1 1 2 (1) (1) 0 9
Regional Office for Europe (Geneva) 53 0 0 0 0 2 2 0 4 0 4 8 61
Total (net) - B 541 0 0 0 7 2 8 10 27 (1) 10 36 577
Total: Post increases/decreases (net) 2,523 0 0 0 12 26 12 21 71 15 108 194 2,717
a/ Reflects move of two posts in the ITD Cognos Unit from management and administration to programme support.
Summary table IV. Proposed changes in regular resources post requirements, 2004-2005
(Excludes project posts)
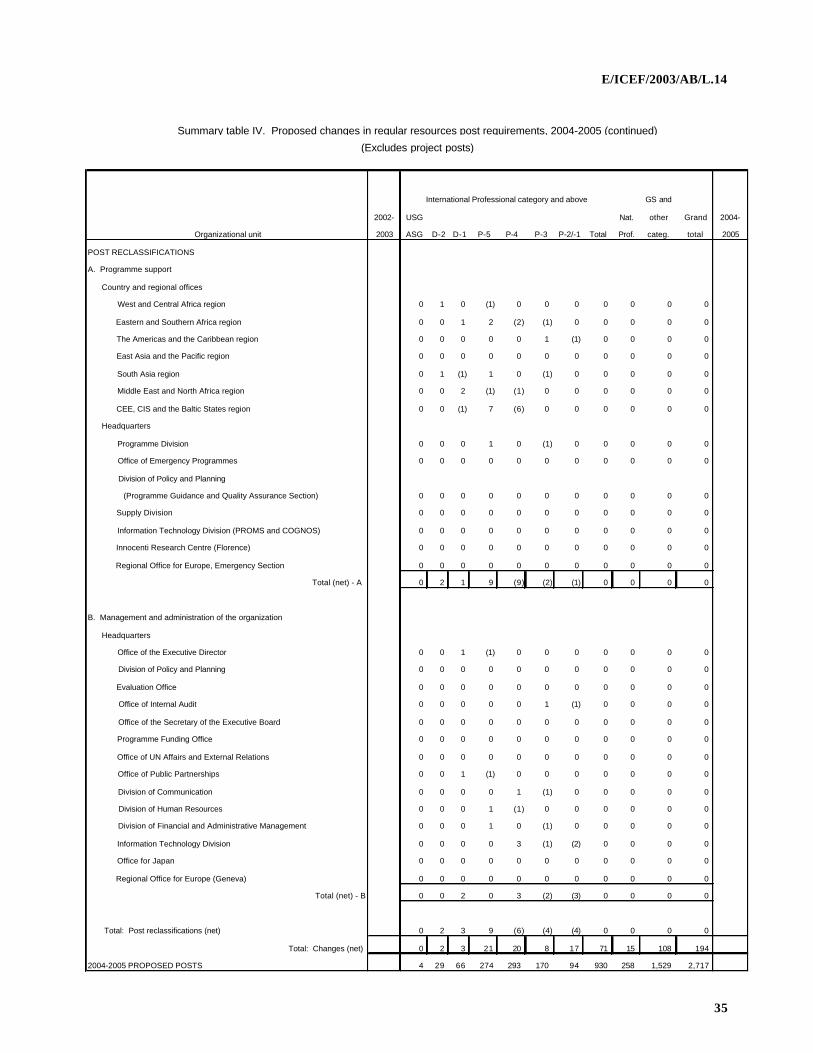
E/ICEF/2003/AB/L.14
35
International Professional category and above GS and
2002- USG Nat. other Grand 2004-
Organizational unit 2003 ASG D-2 D-1 P-5 P-4 P-3 P-2/-1 Total Prof. categ. total 2005
POST RECLASSIFICATIONS
A. Programme support
Country and regional offices
West and Central Africa region 0 1 0 (1) 0 0 0 0 0 0 0
Eastern and Southern Africa region 0 0 1 2 (2) (1) 0 0 0 0 0
The Americas and the Caribbean region 0 0 0 0 0 1 (1) 0 0 0 0
East Asia and the Pacific region 0 0 0 0 0 0 0 0 0 0 0
South Asia region 0 1 (1) 1 0 (1) 0 0 0 0 0
Middle East and North Africa region 0 0 2 (1) (1) 0 0 0 0 0 0
CEE, CIS and the Baltic States region 0 0 (1) 7 (6) 0 0 0 0 0 0
Headquarters
Programme Division 0 0 0 1 0 (1) 0 0 0 0 0
Office of Emergency Programmes 0 0 0 0 0 0 0 0 0 0 0
Division of Policy and Planning
(Programme Guidance and Quality Assurance Section) 0 0 0 0 0 0 0 0 0 0 0
Supply Division 0 0 0 0 0 0 0 0 0 0 0
Information Technology Division (PROMS and COGNOS) 0 0 0 0 0 0 0 0 0 0 0
Innocenti Research Centre (Florence) 0 0 0 0 0 0 0 0 0 0 0
Regional Office for Europe, Emergency Section 0 0 0 0 0 0 0 0 0 0 0
Total (net) - A 0 2 1 9 (9) (2) (1) 0 0 0 0
B. Management and administration of the organization
Headquarters
Office of the Executive Director 0 0 1 (1) 0 0 0 0 0 0 0
Division of Policy and Planning 0 0 0 0 0 0 0 0 0 0 0
Evaluation Office 0 0 0 0 0 0 0 0 0 0 0
Office of Internal Audit 0 0 0 0 0 1 (1) 0 0 0 0
Office of the Secretary of the Executive Board 0 0 0 0 0 0 0 0 0 0 0
Programme Funding Office 0 0 0 0 0 0 0 0 0 0 0
Office of UN Affairs and External Relations 0 0 0 0 0 0 0 0 0 0 0
Office of Public Partnerships 0 0 1 (1) 0 0 0 0 0 0 0
Division of Communication 0 0 0 0 1 (1) 0 0 0 0 0
Division of Human Resources 0 0 0 1 (1) 0 0 0 0 0 0
Division of Financial and Administrative Management 0 0 0 1 0 (1) 0 0 0 0 0
Information Technology Division 0 0 0 0 3 (1) (2) 0 0 0 0
Office for Japan 0 0 0 0 0 0 0 0 0 0 0
Regional Office for Europe (Geneva) 0 0 0 0 0 0 0 0 0 0 0
Total (net) - B 0 0 2 0 3 (2) (3) 0 0 0 0
Total: Post reclassifications (net) 0 2 3 9 (6) (4) (4) 0 0 0 0
Total: Changes (net) 0 2 3 21 20 8 17 71 15 108 194
2004-2005 PROPOSED POSTS 4 29 66 274 293 170 94 930 258 1,529 2,717
Summary table IV. Proposed changes in regular resources post requirements, 2004-2005 (continued)
(Excludes project posts)
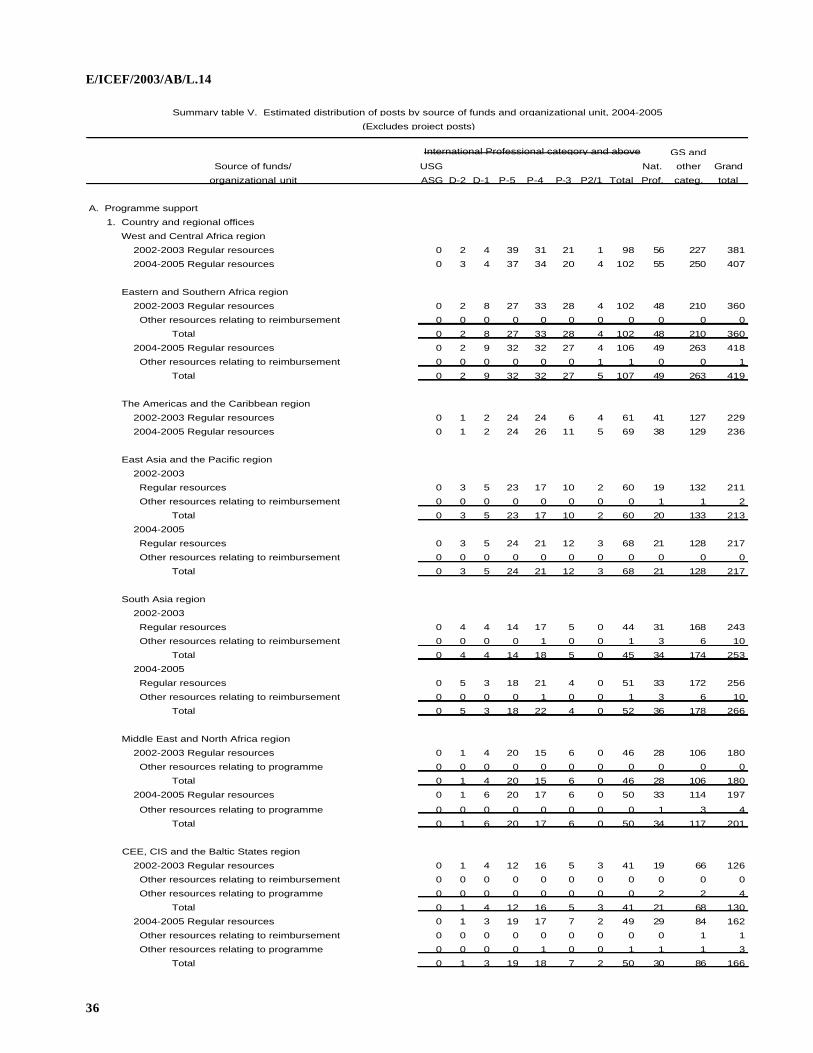
E/ICEF/2003/AB/L.14
36
International Professional category and above GS and
Source of funds/ USG Nat. other Grand
organizational unit ASG D-2 D-1 P-5 P-4 P-3 P2/1 Total Prof. categ. total
A. Programme support
1. Country and regional offices
West and Central Africa region
2002-2003 Regular resources 0 2 4 39 31 21 1 98 56 227 381
2004-2005 Regular resources 0 3 4 37 34 20 4 102 55 250 407
Eastern and Southern Africa region
2002-2003 Regular resources 0 2 8 27 33 28 4 102 48 210 360
Other resources relating to reimbursement 0 0 0 0 0 0 0 0 0 0 0
Total 0 2 8 27 33 28 4 102 48 210 360
2004-2005 Regular resources 0 2 9 32 32 27 4 106 49 263 418
Other resources relating to reimbursement 0 0 0 0 0 0 1 1 0 0 1
Total 0 2 9 32 32 27 5 107 49 263 419
The Americas and the Caribbean region
2002-2003 Regular resources 0 1 2 24 24 6 4 61 41 127 229
2004-2005 Regular resources 0 1 2 24 26 11 5 69 38 129 236
East Asia and the Pacific region
2002-2003
Regular resources 0 3 5 23 17 10 2 60 19 132 211
Other resources relating to reimbursement 0 0 0 0 0 0 0 0 1 1 2
Total 0 3 5 23 17 10 2 60 20 133 213
2004-2005
Regular resources 0 3 5 24 21 12 3 68 21 128 217
Other resources relating to reimbursement 0 0 0 0 0 0 0 0 0 0 0
Total 0 3 5 24 21 12 3 68 21 128 217
South Asia region
2002-2003
Regular resources 0 4 4 14 17 5 0 44 31 168 243
Other resources relating to reimbursement 0 0 0 0 1 0 0 1 3 6 10
Total 0 4 4 14 18 5 0 45 34 174 253
2004-2005
Regular resources 0 5 3 18 21 4 0 51 33 172 256
Other resources relating to reimbursement 0 0 0 0 1 0 0 1 3 6 10
Total 0 5 3 18 22 4 0 52 36 178 266
Middle East and North Africa region
2002-2003 Regular resources 0 1 4 20 15 6 0 46 28 106 180
Other resources relating to programme 0 0 0 0 0 0 0 0 0 0 0
Total 0 1 4 20 15 6 0 46 28 106 180
2004-2005 Regular resources 0 1 6 20 17 6 0 50 33 114 197
Other resources relating to programme 0 0 0 0 0 0 0 0 1 3 4
Total 0 1 6 20 17 6 0 50 34 117 201
CEE, CIS and the Baltic States region
2002-2003 Regular resources 0 1 4 12 16 5 3 41 19 66 126
Other resources relating to reimbursement 0 0 0 0 0 0 0 0 0 0 0
Other resources relating to programme 0 0 0 0 0 0 0 0 2 2 4
Total 0 1 4 12 16 5 3 41 21 68 130
2004-2005 Regular resources 0 1 3 19 17 7 2 49 29 84 162
Other resources relating to reimbursement 0 0 0 0 0 0 0 0 0 1 1
Other resources relating to programme 0 0 0 0 1 0 0 1 1 1 3
Total 0 1 3 19 18 7 2 50 30 86 166
Summary table V. Estimated distribution of posts by source of funds and organizational unit, 2004-2005
(Excludes project posts)
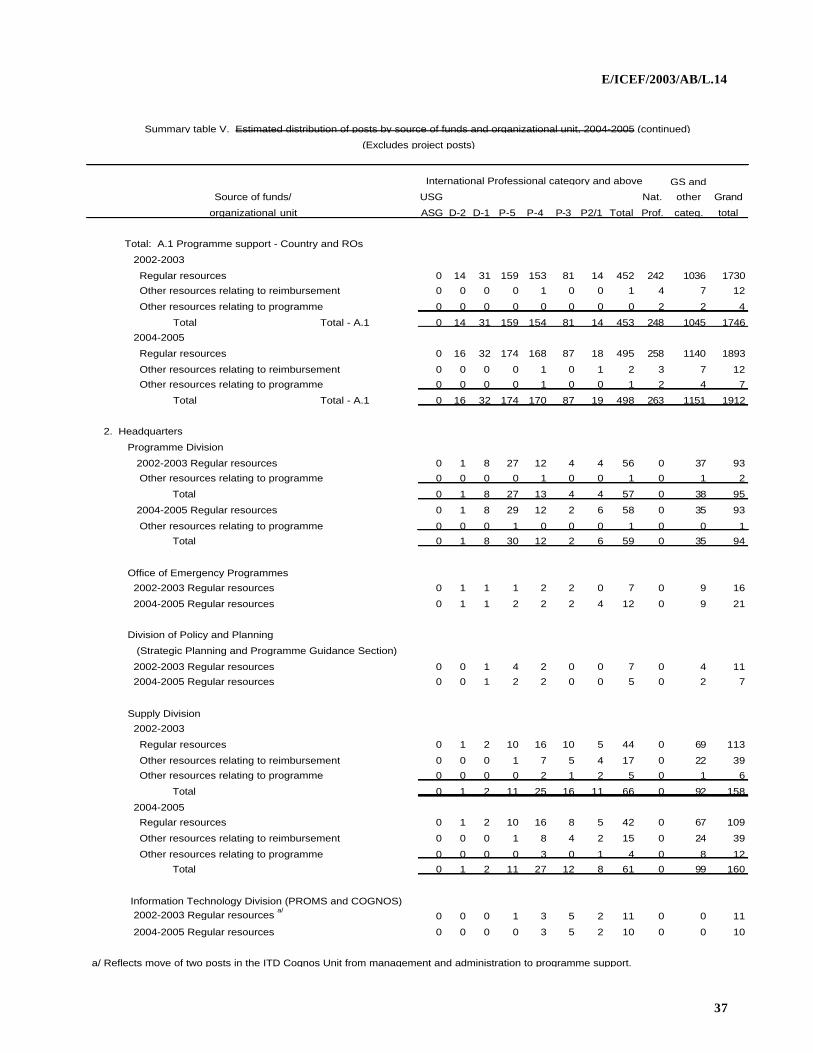
E/ICEF/2003/AB/L.14
37
International Professional category and above GS and
Source of funds/ USG Nat. other Grand
organizational unit ASG D-2 D-1 P-5 P-4 P-3 P2/1 Total Prof. categ. total
Total: A.1 Programme support - Country and ROs
2002-2003
Regular resources 0 14 31 159 153 81 14 452 242 1036 1730
Other resources relating to reimbursement 0 0 0 0 1 0 0 1 4 7 12
Other resources relating to programme 0 0 0 0 0 0 0 0 2 2 4
Total Total - A.1 0 14 31 159 154 81 14 453 248 1045 1746
2004-2005
Regular resources 0 16 32 174 168 87 18 495 258 1140 1893
Other resources relating to reimbursement 0 0 0 0 1 0 1 2 3 7 12
Other resources relating to programme 0 0 0 0 1 0 0 1 2 4 7
Total Total - A.1 0 16 32 174 170 87 19 498 263 1151 1912
2. Headquarters
Programme Division
2002-2003 Regular resources 0 1 8 27 12 4 4 56 0 37 93
Other resources relating to programme 0 0 0 0 1 0 0 1 0 1 2
Total 0 1 8 27 13 4 4 57 0 38 95
2004-2005 Regular resources 0 1 8 29 12 2 6 58 0 35 93
Other resources relating to programme 0 0 0 1 0 0 0 1 0 0 1
Total 0 1 8 30 12 2 6 59 0 35 94
Office of Emergency Programmes
2002-2003 Regular resources 0 1 1 1 2 2 0 7 0 9 16
2004-2005 Regular resources 0 1 1 2 2 2 4 12 0 9 21
Division of Policy and Planning
(Strategic Planning and Programme Guidance Section)
2002-2003 Regular resources 0 0 1 4 2 0 0 7 0 4 11
2004-2005 Regular resources 0 0 1 2 2 0 0 5 0 2 7
Supply Division
2002-2003
Regular resources 0 1 2 10 16 10 5 44 0 69 113
Other resources relating to reimbursement 0 0 0 1 7 5 4 17 0 22 39
Other resources relating to programme 0 0 0 0 2 1 2 5 0 1 6
Total 0 1 2 11 25 16 11 66 0 92 158
2004-2005
Regular resources 0 1 2 10 16 8 5 42 0 67 109
Other resources relating to reimbursement 0 0 0 1 8 4 2 15 0 24 39
Other resources relating to programme 0 0 0 0 3 0 1 4 0 8 12
Total 0 1 2 11 27 12 8 61 0 99 160
Information Technology Division (PROMS and COGNOS) 2002-2003 Regular resources
a/0 0 0 1 3 5 2 11 0 0 11
2004-2005 Regular resources 0 0 0 0 3 5 2 10 0 0 10
a/ Reflects move of two posts in the ITD Cognos Unit from management and administration to programme support.
Summary table V. Estimated distribution of posts by source of funds and organizational unit, 2004-2005 (continued)
(Excludes project posts)
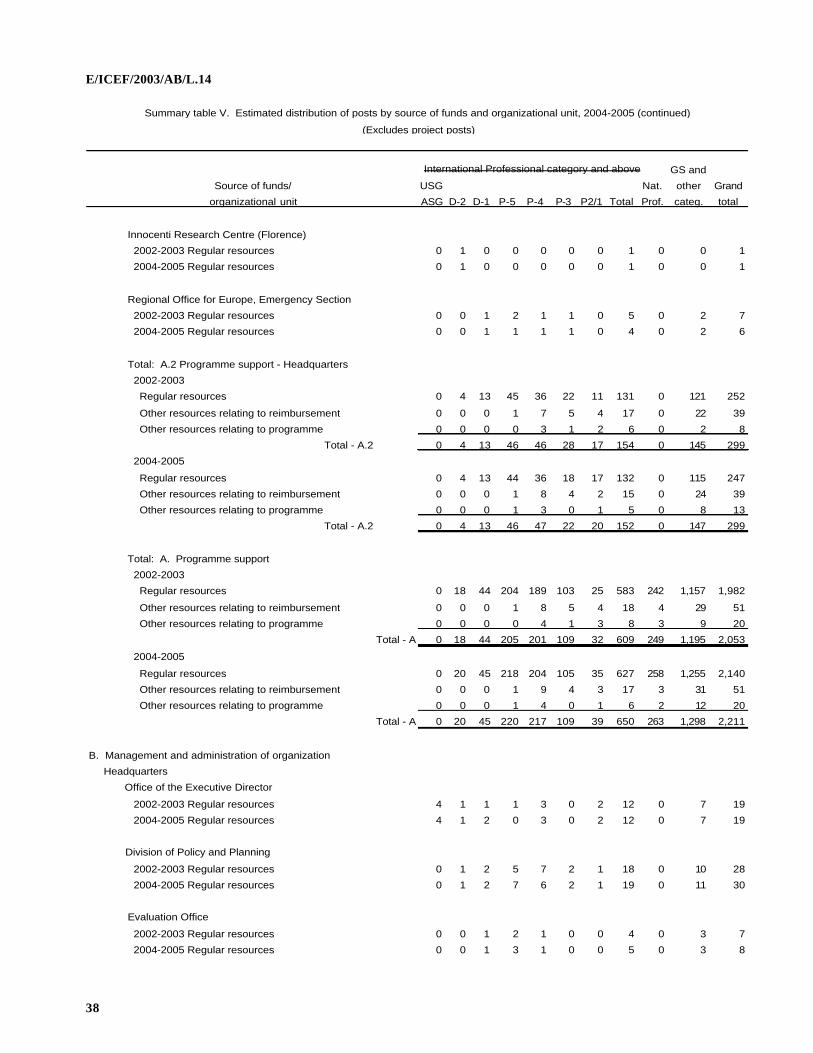
E/ICEF/2003/AB/L.14
38
International Professional category and above GS and
Source of funds/ USG Nat. other Grand
organizational unit ASG D-2 D-1 P-5 P-4 P-3 P2/1 Total Prof. categ. total
Innocenti Research Centre (Florence)
2002-2003 Regular resources 0 1 0 0 0 0 0 1 0 0 1
2004-2005 Regular resources 0 1 0 0 0 0 0 1 0 0 1
Regional Office for Europe, Emergency Section
2002-2003 Regular resources 0 0 1 2 1 1 0 5 0 2 7
2004-2005 Regular resources 0 0 1 1 1 1 0 4 0 2 6
Total: A.2 Programme support - Headquarters
2002-2003
Regular resources 0 4 13 45 36 22 11 131 0 121 252
Other resources relating to reimbursement 0 0 0 1 7 5 4 17 0 22 39
Other resources relating to programme 0 0 0 0 3 1 2 6 0 2 8
Total - A.2 0 4 13 46 46 28 17 154 0 145 299
2004-2005
Regular resources 0 4 13 44 36 18 17 132 0 115 247
Other resources relating to reimbursement 0 0 0 1 8 4 2 15 0 24 39
Other resources relating to programme 0 0 0 1 3 0 1 5 0 8 13
Total - A.2 0 4 13 46 47 22 20 152 0 147 299
Total: A. Programme support
2002-2003
Regular resources 0 18 44 204 189 103 25 583 242 1,157 1,982
Other resources relating to reimbursement 0 0 0 1 8 5 4 18 4 29 51
Other resources relating to programme 0 0 0 0 4 1 3 8 3 9 20
Total - A 0 18 44 205 201 109 32 609 249 1,195 2,053
2004-2005
Regular resources 0 20 45 218 204 105 35 627 258 1,255 2,140
Other resources relating to reimbursement 0 0 0 1 9 4 3 17 3 31 51
Other resources relating to programme 0 0 0 1 4 0 1 6 2 12 20
Total - A 0 20 45 220 217 109 39 650 263 1,298 2,211
B. Management and administration of organization
Headquarters
Office of the Executive Director
2002-2003 Regular resources 4 1 1 1 3 0 2 12 0 7 19
2004-2005 Regular resources 4 1 2 0 3 0 2 12 0 7 19
Division of Policy and Planning
2002-2003 Regular resources 0 1 2 5 7 2 1 18 0 10 28
2004-2005 Regular resources 0 1 2 7 6 2 1 19 0 11 30
Evaluation Office
2002-2003 Regular resources 0 0 1 2 1 0 0 4 0 3 7
2004-2005 Regular resources 0 0 1 3 1 0 0 5 0 3 8
Summary table V. Estimated distribution of posts by source of funds and organizational unit, 2004-2005 (continued)
(Excludes project posts)
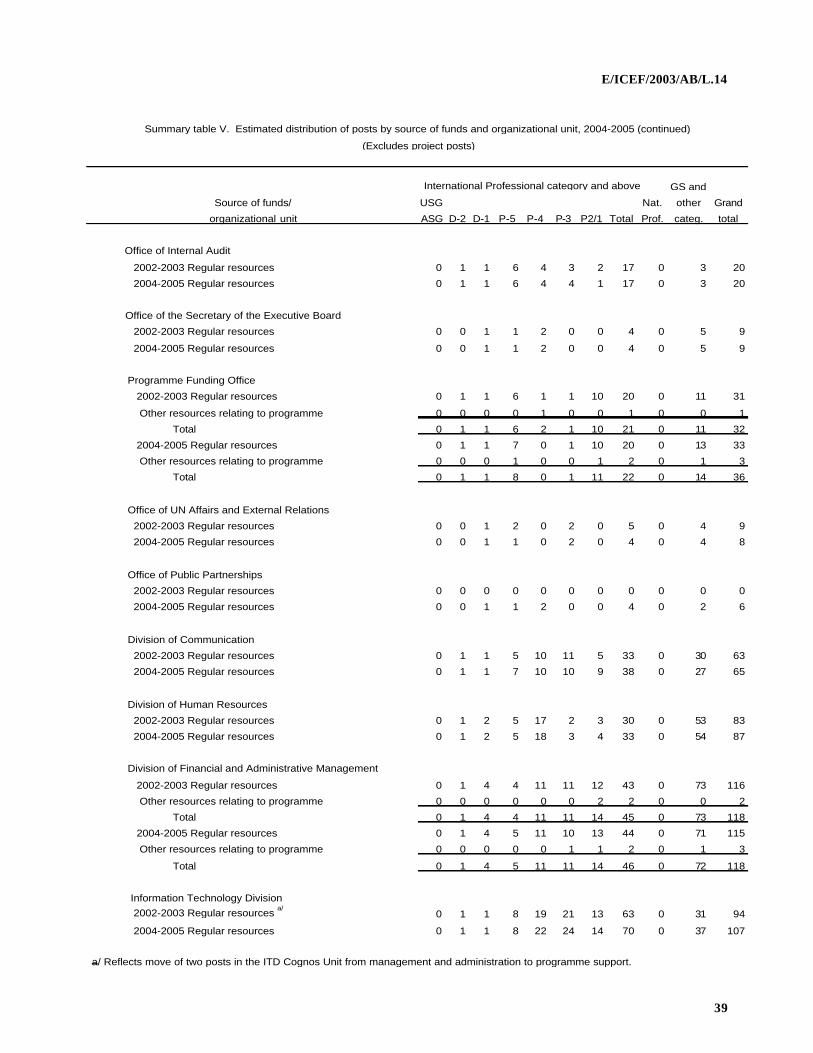
E/ICEF/2003/AB/L.14
39
International Professional category and above GS and
Source of funds/ USG Nat. other Grand
organizational unit ASG D-2 D-1 P-5 P-4 P-3 P2/1 Total Prof. categ. total
Office of Internal Audit
2002-2003 Regular resources 0 1 1 6 4 3 2 17 0 3 20
2004-2005 Regular resources 0 1 1 6 4 4 1 17 0 3 20
Office of the Secretary of the Executive Board
2002-2003 Regular resources 0 0 1 1 2 0 0 4 0 5 9
2004-2005 Regular resources 0 0 1 1 2 0 0 4 0 5 9
Programme Funding Office
2002-2003 Regular resources 0 1 1 6 1 1 10 20 0 11 31
Other resources relating to programme 0 0 0 0 1 0 0 1 0 0 1
Total 0 1 1 6 2 1 10 21 0 11 32
2004-2005 Regular resources 0 1 1 7 0 1 10 20 0 13 33
Other resources relating to programme 0 0 0 1 0 0 1 2 0 1 3
Total 0 1 1 8 0 1 11 22 0 14 36
Office of UN Affairs and External Relations
2002-2003 Regular resources 0 0 1 2 0 2 0 5 0 4 9
2004-2005 Regular resources 0 0 1 1 0 2 0 4 0 4 8
Office of Public Partnerships
2002-2003 Regular resources 0 0 0 0 0 0 0 0 0 0 0
2004-2005 Regular resources 0 0 1 1 2 0 0 4 0 2 6
Division of Communication
2002-2003 Regular resources 0 1 1 5 10 11 5 33 0 30 63
2004-2005 Regular resources 0 1 1 7 10 10 9 38 0 27 65
Division of Human Resources
2002-2003 Regular resources 0 1 2 5 17 2 3 30 0 53 83
2004-2005 Regular resources 0 1 2 5 18 3 4 33 0 54 87
Division of Financial and Administrative Management
2002-2003 Regular resources 0 1 4 4 11 11 12 43 0 73 116
Other resources relating to programme 0 0 0 0 0 0 2 2 0 0 2
Total 0 1 4 4 11 11 14 45 0 73 118
2004-2005 Regular resources 0 1 4 5 11 10 13 44 0 71 115
Other resources relating to programme 0 0 0 0 0 1 1 2 0 1 3
Total 0 1 4 5 11 11 14 46 0 72 118
Information Technology Division 2002-2003 Regular resources a/
0 1 1 8 19 21 13 63 0 31 94
2004-2005 Regular resources 0 1 1 8 22 24 14 70 0 37 107
a/ Reflects move of two posts in the ITD Cognos Unit from management and administration to programme support.
Summary table V. Estimated distribution of posts by source of funds and organizational unit, 2004-2005 (continued)
(Excludes project posts)
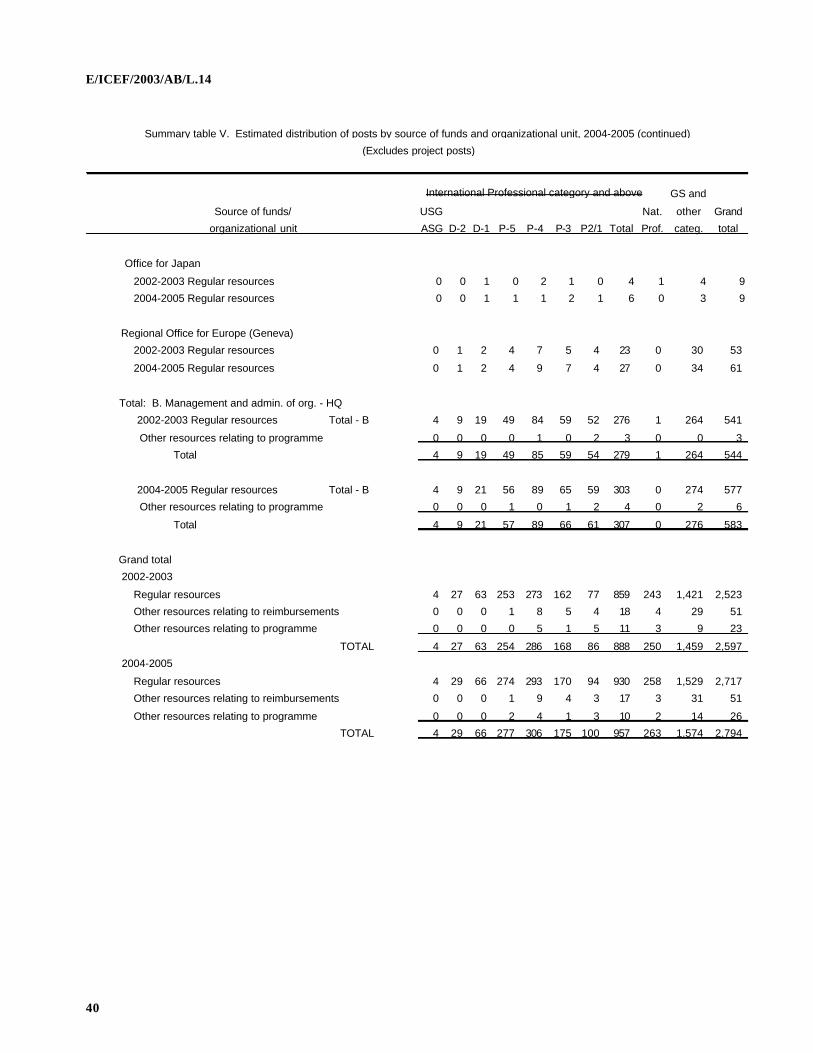
E/ICEF/2003/AB/L.14
40
International Professional category and above GS and
Source of funds/ USG Nat. other Grand
organizational unit ASG D-2 D-1 P-5 P-4 P-3 P2/1 Total Prof. categ. total
Office for Japan
2002-2003 Regular resources 0 0 1 0 2 1 0 4 1 4 9
2004-2005 Regular resources 0 0 1 1 1 2 1 6 0 3 9
Regional Office for Europe (Geneva)
2002-2003 Regular resources 0 1 2 4 7 5 4 23 0 30 53
2004-2005 Regular resources 0 1 2 4 9 7 4 27 0 34 61
Total: B. Management and admin. of org. - HQ
2002-2003 Regular resources Total - B 4 9 19 49 84 59 52 276 1 264 541
Other resources relating to programme 0 0 0 0 1 0 2 3 0 0 3
Total 4 9 19 49 85 59 54 279 1 264 544
2004-2005 Regular resources Total - B 4 9 21 56 89 65 59 303 0 274 577
Other resources relating to programme 0 0 0 1 0 1 2 4 0 2 6
Total 4 9 21 57 89 66 61 307 0 276 583
Grand total
2002-2003
Regular resources 4 27 63 253 273 162 77 859 243 1,421 2,523
Other resources relating to reimbursements 0 0 0 1 8 5 4 18 4 29 51
Other resources relating to programme 0 0 0 0 5 1 5 11 3 9 23
TOTAL 4 27 63 254 286 168 86 888 250 1,459 2,597
2004-2005
Regular resources 4 29 66 274 293 170 94 930 258 1,529 2,717
Other resources relating to reimbursements 0 0 0 1 9 4 3 17 3 31 51
Other resources relating to programme 0 0 0 2 4 1 3 10 2 14 26
TOTAL 4 29 66 277 306 175 100 957 263 1,574 2,794
(Excludes project posts)
Summary table V. Estimated distribution of posts by source of funds and organizational unit, 2004-2005 (continued)
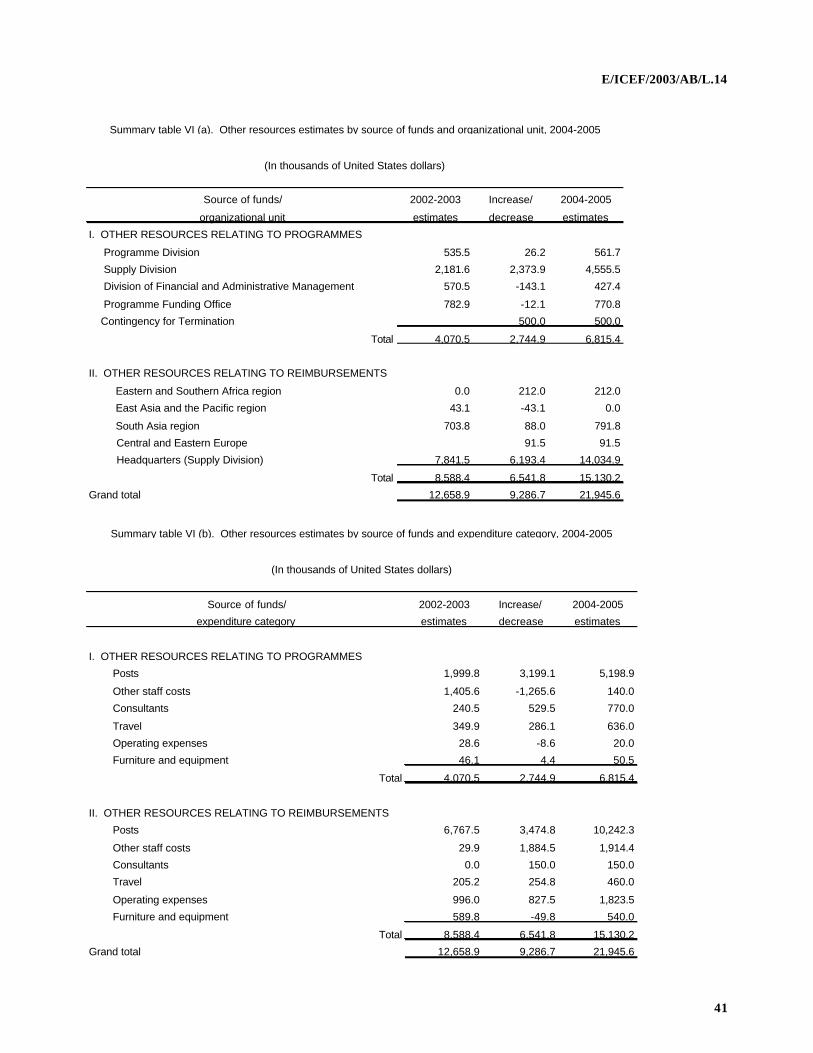
E/ICEF/2003/AB/L.14
41
Summary table VI (a). Other resources estimates by source of funds and organizational unit, 2004-2005
(In thousands of United States dollars)
Source of funds/ 2002-2003 Increase/ 2004-2005
organizational unit estimates decrease estimates
I. OTHER RESOURCES RELATING TO PROGRAMMES
Programme Division 535.5 26.2 561.7
Supply Division 2,181.6 2,373.9 4,555.5
Division of Financial and Administrative Management 570.5 -143.1 427.4
Programme Funding Office 782.9 -12.1 770.8
Contingency for Termination 500.0 500.0
Total 4,070.5 2,744.9 6,815.4
II. OTHER RESOURCES RELATING TO REIMBURSEMENTS
Eastern and Southern Africa region 0.0 212.0 212.0
East Asia and the Pacific region 43.1 -43.1 0.0
South Asia region 703.8 88.0 791.8
Central and Eastern Europe 91.5 91.5
Headquarters (Supply Division) 7,841.5 6,193.4 14,034.9
Total 8,588.4 6,541.8 15,130.2
Grand total 12,658.9 9,286.7 21,945.6
Summary table VI (b). Other resources estimates by source of funds and expenditure category, 2004-2005
(In thousands of United States dollars)
Source of funds/ 2002-2003 Increase/ 2004-2005
expenditure category estimates decrease estimates
I. OTHER RESOURCES RELATING TO PROGRAMMES
Posts 1,999.8 3,199.1 5,198.9
Other staff costs 1,405.6 -1,265.6 140.0
Consultants 240.5 529.5 770.0
Travel 349.9 286.1 636.0
Operating expenses 28.6 -8.6 20.0
Furniture and equipment 46.1 4.4 50.5
Total 4,070.5 2,744.9 6,815.4
II. OTHER RESOURCES RELATING TO REIMBURSEMENTS
Posts 6,767.5 3,474.8 10,242.3
Other staff costs 29.9 1,884.5 1,914.4
Consultants 0.0 150.0 150.0
Travel 205.2 254.8 460.0
Operating expenses 996.0 827.5 1,823.5
Furniture and equipment 589.8 -49.8 540.0
Total 8,588.4 6,541.8 15,130.2
Grand total 12,658.9 9,286.7 21,945.6
E/ICEF/2003/AB/L.14
42
Annex I Terminology
Terms upon which common agreement has been reached and their corresponding definitions
are given below. Appropriation line - definition similar to those included in the Financial Regulations of UNDP, UNFPA and UNICEF 1. A subdivision of the appropriation for which a specific amount is shown in the appropriation decision and within which the executive head of an organization is authorized to make transfers without prior approval. Biennial support budget 2. The budget of an organization covering programme support and management and administration of the organization. Cost (increase/decrease) - Administrative Committee on Coordination definition 3. Any increase or decrease in the cost of a resource input in the budget period compared with that in the previous budget period, arising from changes in costs, prices and exchange rates. Gross budget 4. For voluntary-funded organizations, the budget in which staff costs are estimated on a net basis (i.e., exclusive of staff assessment) and all other costs are estimated on a gross basis, e.g. inclusive of income tax payments for staff, total local office costs and costs of services to be rendered. Management and administration of organization 5. Organizational units whose primary function is the maintenance of the identity, direction and well-being of an organization. This will typically include units that carry out the functions of executive direction, organizational policy and evaluation, external relations, information, administration and audit. Net budget 6. For voluntary-funded organizations, the budget which reflects estimates of payments to be received which offset, in whole or in part, the related gross budget estimates.
E/ICEF/2003/AB/L.14
43
Other resources 7. Resources of a voluntarily-funded organization, other than regular resources, which are received for a specific programme purpose consistent with the mandate of the organization and for the provision of specific services to third parties. Other resources relating to programmes 8. Resources of a voluntarily-funded organization, other than regular resources, which are received for a specific programme purpose that is consistent with the mandate of the organization. These will include voluntary contributions, other governmental or intergovernmental payments, and donations from non-governmental sources. Other resources relating to reimbursements 9. Resources of a voluntarily-funded organization that are received from third parties to cover the cost of providing specific services not related to carrying out programmes entrusted to it for implementation. Programme(s) 10. (a) Those activities associated directly with the preparation, implementation and monitoring and evaluation of the organization’s development cooperation activities; (b) For the purpose of related financial information, direct inputs needed to achieve the objectives of a specific project or programme for development cooperation. This may typically include experts, support personnel, supplies and equipment, subcontracts, cash assistance and individual or group training. Programme support 11. Organizational units whose primary function is the development, formulation, delivery and evaluation of an organization’s programmes. This will typically include units that provide backstopping of programmes either on a technical, thematic, geographic, logistical or administrative basis. Regular resources 12. Resources of a voluntarily-funded organization that are co-mingled and untied. These will include pledges of voluntary contributions, other governmental or intergovernmental payments, donations from non-governmental sources, and related interest earnings and miscellaneous income.
E/ICEF/2003/AB/L.14
44
Various cost adjustments 13. Cost increases/decreases attributable to changes in rates or conditions not tied to currency or annual inflation adjustments. Volume (increase/decrease) 14. Any increase or decrease in resource requirements attributable to changes in the level or nature of activities carried out by an organization during the current budget period and those proposed for the forthcoming budget period. Volume is expressed using the same cost factors applicable for the approved appropriations to permit direct comparison of these changes relative to the level of activities approved for the current budget period.
E/ICEF/2003/AB/L.14
45
Annex II Methodology 1. The methodology involves several sequential steps in calculating estimates. These calculations are effected separately for each year of a biennium. Essentially, the methodology is to take the approved appropriations for the first year of the current biennium and add the volume and cost adjustments, which results in the estimates required for the first year of the proposed biennium. Similarly, the approved appropriations for the second year of the current biennium are updated to result in the estimates required for the second year of the proposed biennium. It should be borne in mind that, normally, the time during which estimates are prepared for the proposed biennial support budget is during the first months of the second year of the current biennium. A description of each sequential step follows. I. Volume adjustments 2. First, using the approved appropriations as a base, the real increases or decreases in requirements are calculated and designated as volume changes. Volume changes, as defined, represent the controllable elements in the estimates, subject to the executive head’s assessment of what the organization requires to perform the task with which it is entrusted. Such volume changes are calculated at the same price levels as the approved appropriations in order to facilitate comparison with the currently approved base. II. Various cost adjustments 3. To the approved appropriations and volume changes are added cost increases or decreases attributable to changes in rates or conditions not tied to currency or annual inflation adjustments. Except for within-grade increments, they reflect only known changes that have occurred in the two years since the preparation of the last biennial support budget. Such cost factors include, for example, International Civil Service Commission decisions on a variety of staff entitlements (e.g. dependency allowance, education grant), and changes in the average step of posts by grade level. These adjustments may also include estimates to cover within-grade increments for staff if the experience of the organization so warrants. Normally, but not exclusively, such cost adjustments apply to staff costs. An example of this type of cost adjustment for operating expenses would be a change in rate per square foot on relocation of premises. III. Currency adjustments 4. Currency adjustments are then calculated, by year, on the total of approved appropriations, volume and various cost adjustments. These currency adjustments would normally be the difference between the United Nations operational rate of exchange in effect on, for example, 1 April of the year preceding the current biennium and, for example, on 1 April of the second year of the current biennium, i.e., the time of preparation of the proposed biennial support budget. This factor is of particular importance given the extent of the field offices of the organization, where operating costs vary greatly with the strength or otherwise of the United States dollar.
E/ICEF/2003/AB/L.14
46
IV. Inflation adjustment 5. Finally, to complete the picture and develop the final estimate of requirements for the next biennium, the organization must adjust or estimate, as appropriate, inflation over a four-year period. These adjustments are calculated, by year, on the total of approved appropriations, volume and various cost adjustments, as adjusted for currency as follows: (a) For the first year of the current biennium to the first year of the proposed biennium. The existing estimates already embody earlier estimates of inflation. Therefore, the inflation adjustment for this transition includes: (i) The difference between the application of earlier estimates and the actual inflation for the first year of the current biennium; (ii) The difference between the application of earlier estimates and the revised inflation projection for the second year of the current biennium; (iii) The inflation projection for the first year of the proposed biennium; (b) For the second year of the current biennium to the second year of the proposed biennium: (i) Same as (a) (i)-(iii) above; (ii) The inflation projection for the second year of the proposed biennium. 6. In order to arrive at these estimates of inflation, four inflation factors for each location are adopted for each year: (a) The first inflation factor pertains to the estimated movement of post adjustment for international Professional staff; (b) The second inflation factor pertains to international travel and common staff costs for international Professional staff (this is the same for all locations); (c) The third factor encompasses salaries and common staff costs for local staff, i.e., in the national Professional category and General Service and other categories, which may vary significantly from location to location; (d) The fourth factor relates to all other costs, such as operating expenses. 7. Within this general framework, New York headquarters and the regional Office for Europe in Geneva are treated separately from field offices. For these two locations, the rates used are the same as those used by the United Nations unless specific contractual commitments differ. 8. Apart from a limited number of cost elements, such as international travel and the common staff costs of international staff, the inflation factors for field offices must be location-specific.

E/ICEF/2003/AB/L.14
47
Estimates are compared with past experience and current global patterns and/or information that is available and published before being applied to the budget estimates.
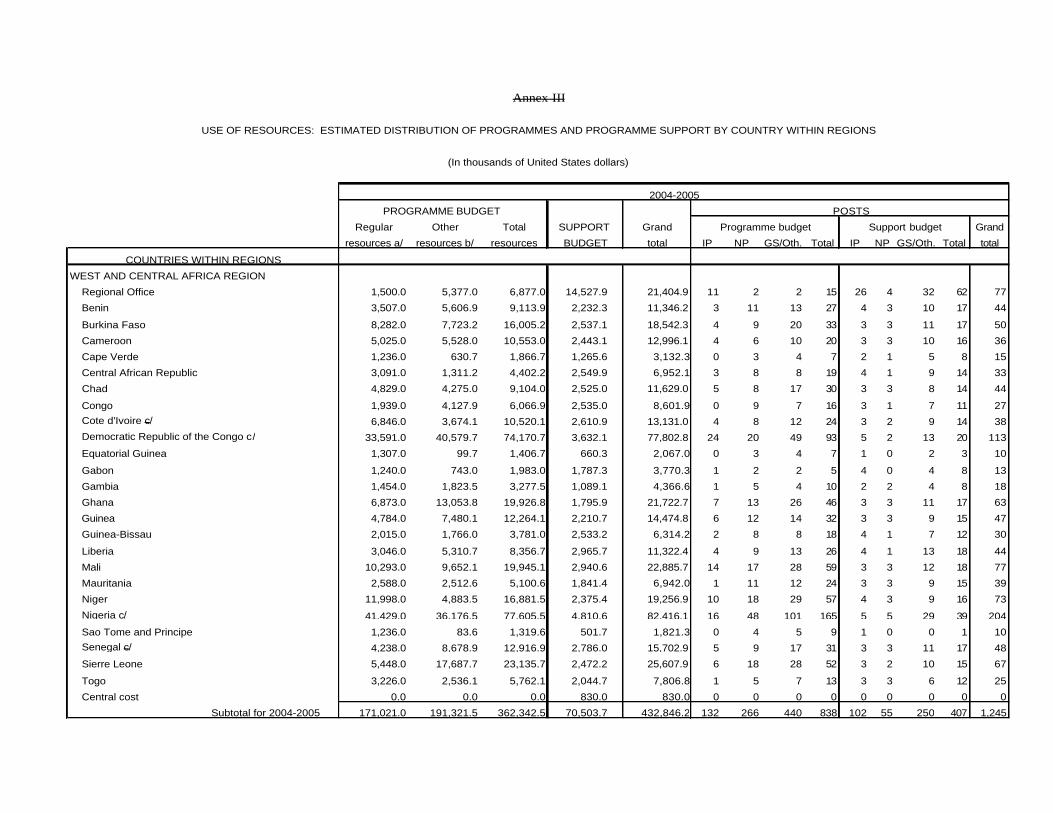
USE OF RESOURCES: ESTIMATED DISTRIBUTION OF PROGRAMMES AND PROGRAMME SUPPORT BY COUNTRY WITHIN REGIONS
(In thousands of United States dollars)
2004-2005
PROGRAMME BUDGET POSTS
Regular Other Total SUPPORT Grand Programme budget Support budget Grand
resources a/ resources b/ resources total IP NP GS/Oth. Total IP NP GS/Oth. Total total
COUNTRIES WITHIN REGIONS
WEST AND CENTRAL AFRICA REGION
Regional Office 1,500.0 5,377.0 6,877.0 14,527.9 21,404.9 11 2 2 15 26 4 32 62 77
Benin 3,507.0 5,606.9 9,113.9 2,232.3 11,346.2 3 11 13 27 4 3 10 17 44
Burkina Faso 8,282.0 7,723.2 16,005.2 2,537.1 18,542.3 4 9 20 33 3 3 11 17 50
Cameroon 5,025.0 5,528.0 10,553.0 2,443.1 12,996.1 4 6 10 20 3 3 10 16 36
Cape Verde 1,236.0 630.7 1,866.7 1,265.6 3,132.3 0 3 4 7 2 1 5 8 15
Central African Republic 3,091.0 1,311.2 4,402.2 2,549.9 6,952.1 3 8 8 19 4 1 9 14 33
Chad 4,829.0 4,275.0 9,104.0 2,525.0 11,629.0 5 8 17 30 3 3 8 14 44
Congo 1,939.0 4,127.9 6,066.9 2,535.0 8,601.9 0 9 7 16 3 1 7 11 27 Cote d'Ivoire c/ 6,846.0 3,674.1 10,520.1 2,610.9 13,131.0 4 8 12 24 3 2 9 14 38 Democratic Republic of the Congo c/ 33,591.0 40,579.7 74,170.7 3,632.1 77,802.8 24 20 49 93 5 2 13 20 113
Equatorial Guinea 1,307.0 99.7 1,406.7 660.3 2,067.0 0 3 4 7 1 0 2 3 10
Gabon 1,240.0 743.0 1,983.0 1,787.3 3,770.3 1 2 2 5 4 0 4 8 13
Gambia 1,454.0 1,823.5 3,277.5 1,089.1 4,366.6 1 5 4 10 2 2 4 8 18
Ghana 6,873.0 13,053.8 19,926.8 1,795.9 21,722.7 7 13 26 46 3 3 11 17 63
Guinea 4,784.0 7,480.1 12,264.1 2,210.7 14,474.8 6 12 14 32 3 3 9 15 47
Guinea-Bissau 2,015.0 1,766.0 3,781.0 2,533.2 6,314.2 2 8 8 18 4 1 7 12 30
Liberia 3,046.0 5,310.7 8,356.7 2,965.7 11,322.4 4 9 13 26 4 1 13 18 44
Mali 10,293.0 9,652.1 19,945.1 2,940.6 22,885.7 14 17 28 59 3 3 12 18 77
Mauritania 2,588.0 2,512.6 5,100.6 1,841.4 6,942.0 1 11 12 24 3 3 9 15 39
Niger 11,998.0 4,883.5 16,881.5 2,375.4 19,256.9 10 18 29 57 4 3 9 16 73
Nigeria c/ 41,429.0 36,176.5 77,605.5 4,810.6 82,416.1 16 48 101 165 5 5 29 39 204
Sao Tome and Principe 1,236.0 83.6 1,319.6 501.7 1,821.3 0 4 5 9 1 0 0 1 10 Senegal c/ 4,238.0 8,678.9 12,916.9 2,786.0 15,702.9 5 9 17 31 3 3 11 17 48
Sierre Leone 5,448.0 17,687.7 23,135.7 2,472.2 25,607.9 6 18 28 52 3 2 10 15 67
Togo 3,226.0 2,536.1 5,762.1 2,044.7 7,806.8 1 5 7 13 3 3 6 12 25
Central cost 0.0 0.0 0.0 830.0 830.0 0 0 0 0 0 0 0 0 0
Subtotal for 2004-2005 171,021.0 191,321.5 362,342.5 70,503.7 432,846.2 132 266 440 838 102 55 250 407 1,245
Annex III
BUDGET
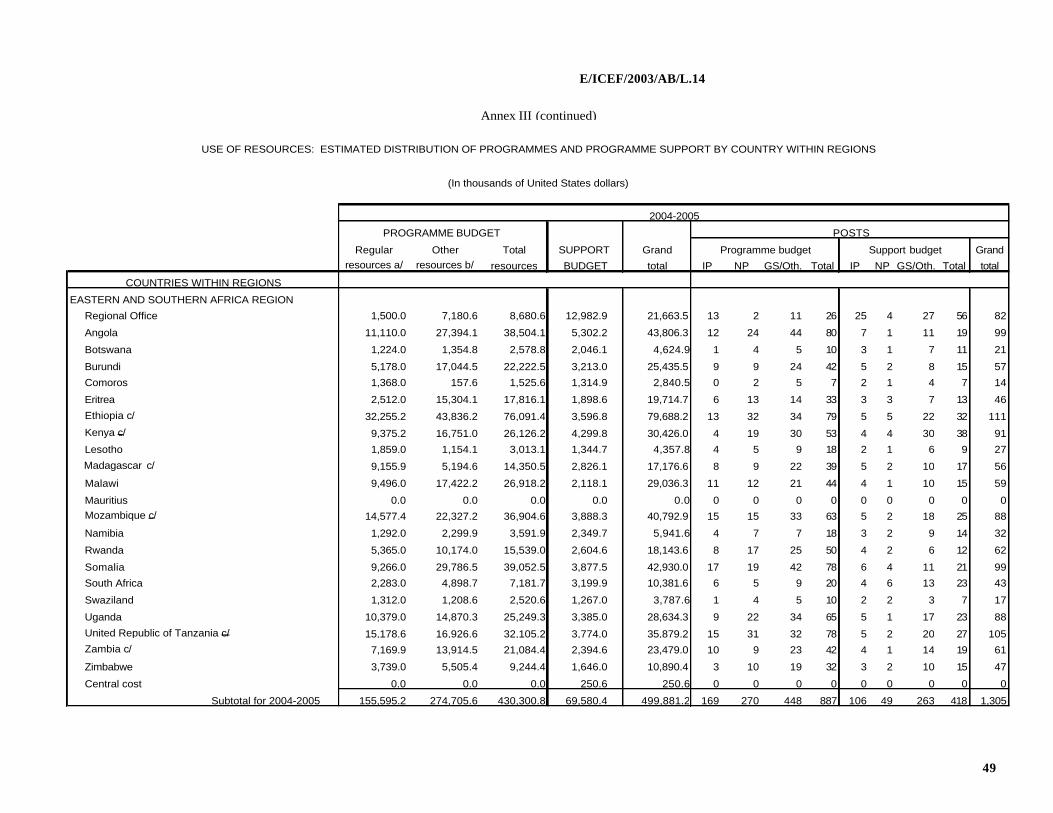
E/ICEF/2003/AB/L.14
49
USE OF RESOURCES: ESTIMATED DISTRIBUTION OF PROGRAMMES AND PROGRAMME SUPPORT BY COUNTRY WITHIN REGIONS
(In thousands of United States dollars)
2004-2005
PROGRAMME BUDGET POSTS
Regular Other Total SUPPORT Grand Programme budget Support budget Grandresources a/ resources b/ resources total IP NP GS/Oth. Total IP NP GS/Oth. Total total
COUNTRIES WITHIN REGIONS
EASTERN AND SOUTHERN AFRICA REGION
Regional Office 1,500.0 7,180.6 8,680.6 12,982.9 21,663.5 13 2 11 26 25 4 27 56 82
Angola 11,110.0 27,394.1 38,504.1 5,302.2 43,806.3 12 24 44 80 7 1 11 19 99
Botswana 1,224.0 1,354.8 2,578.8 2,046.1 4,624.9 1 4 5 10 3 1 7 11 21
Burundi 5,178.0 17,044.5 22,222.5 3,213.0 25,435.5 9 9 24 42 5 2 8 15 57
Comoros 1,368.0 157.6 1,525.6 1,314.9 2,840.5 0 2 5 7 2 1 4 7 14
Eritrea 2,512.0 15,304.1 17,816.1 1,898.6 19,714.7 6 13 14 33 3 3 7 13 46
Ethiopia c/ 32,255.2 43,836.2 76,091.4 3,596.8 79,688.2 13 32 34 79 5 5 22 32 111
Kenya c/ 9,375.2 16,751.0 26,126.2 4,299.8 30,426.0 4 19 30 53 4 4 30 38 91
Lesotho 1,859.0 1,154.1 3,013.1 1,344.7 4,357.8 4 5 9 18 2 1 6 9 27
Madagascar c/ 9,155.9 5,194.6 14,350.5 2,826.1 17,176.6 8 9 22 39 5 2 10 17 56
Malawi 9,496.0 17,422.2 26,918.2 2,118.1 29,036.3 11 12 21 44 4 1 10 15 59
Mauritius 0.0 0.0 0.0 0.0 0.0 0 0 0 0 0 0 0 0 0 Mozambique c/ 14,577.4 22,327.2 36,904.6 3,888.3 40,792.9 15 15 33 63 5 2 18 25 88
Namibia 1,292.0 2,299.9 3,591.9 2,349.7 5,941.6 4 7 7 18 3 2 9 14 32
Rwanda 5,365.0 10,174.0 15,539.0 2,604.6 18,143.6 8 17 25 50 4 2 6 12 62
Somalia 9,266.0 29,786.5 39,052.5 3,877.5 42,930.0 17 19 42 78 6 4 11 21 99
South Africa 2,283.0 4,898.7 7,181.7 3,199.9 10,381.6 6 5 9 20 4 6 13 23 43
Swaziland 1,312.0 1,208.6 2,520.6 1,267.0 3,787.6 1 4 5 10 2 2 3 7 17
Uganda 10,379.0 14,870.3 25,249.3 3,385.0 28,634.3 9 22 34 65 5 1 17 23 88
United Republic of Tanzania c/ 15,178.6 16,926.6 32,105.2 3,774.0 35,879.2 15 31 32 78 5 2 20 27 105 Zambia c/ 7,169.9 13,914.5 21,084.4 2,394.6 23,479.0 10 9 23 42 4 1 14 19 61
Zimbabwe 3,739.0 5,505.4 9,244.4 1,646.0 10,890.4 3 10 19 32 3 2 10 15 47
Central cost 0.0 0.0 0.0 250.6 250.6 0 0 0 0 0 0 0 0 0
Subtotal for 2004-2005 155,595.2 274,705.6 430,300.8 69,580.4 499,881.2 169 270 448 887 106 49 263 418 1,305
Annex III (continued)
BUDGET
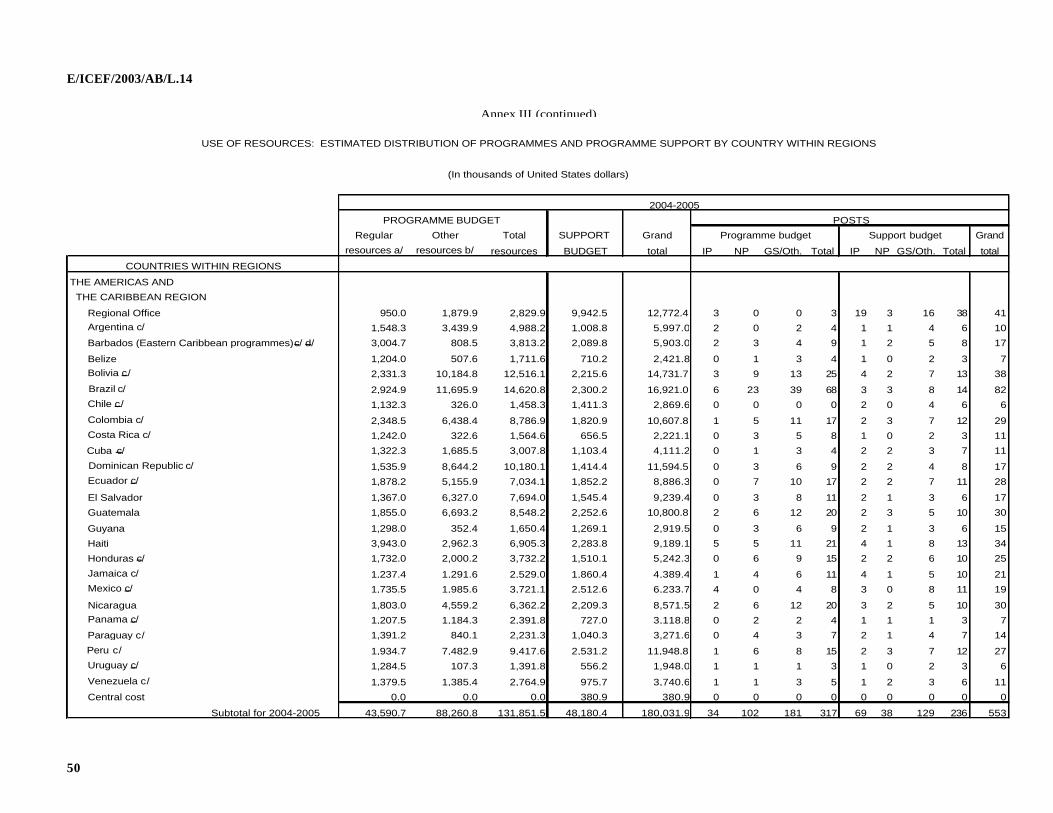
E/ICEF/2003/AB/L.14
50
USE OF RESOURCES: ESTIMATED DISTRIBUTION OF PROGRAMMES AND PROGRAMME SUPPORT BY COUNTRY WITHIN REGIONS
(In thousands of United States dollars)
2004-2005
PROGRAMME BUDGET POSTS
Regular Other Total SUPPORT Grand Programme budget Support budget Grand
resources a/ resources b/ resources total IP NP GS/Oth. Total IP NP GS/Oth. Total total
COUNTRIES WITHIN REGIONS
THE AMERICAS AND
THE CARIBBEAN REGION
Regional Office 950.0 1,879.9 2,829.9 9,942.5 12,772.4 3 0 0 3 19 3 16 38 41 Argentina c/ 1,548.3 3,439.9 4,988.2 1,008.8 5,997.0 2 0 2 4 1 1 4 6 10
Barbados (Eastern Caribbean programmes)c/ d/ 3,004.7 808.5 3,813.2 2,089.8 5,903.0 2 3 4 9 1 2 5 8 17
Belize 1,204.0 507.6 1,711.6 710.2 2,421.8 0 1 3 4 1 0 2 3 7 Bolivia c/ 2,331.3 10,184.8 12,516.1 2,215.6 14,731.7 3 9 13 25 4 2 7 13 38
Brazil c/ 2,924.9 11,695.9 14,620.8 2,300.2 16,921.0 6 23 39 68 3 3 8 14 82 Chile c/ 1,132.3 326.0 1,458.3 1,411.3 2,869.6 0 0 0 0 2 0 4 6 6
Colombia c/ 2,348.5 6,438.4 8,786.9 1,820.9 10,607.8 1 5 11 17 2 3 7 12 29 Costa Rica c/ 1,242.0 322.6 1,564.6 656.5 2,221.1 0 3 5 8 1 0 2 3 11
Cuba c/ 1,322.3 1,685.5 3,007.8 1,103.4 4,111.2 0 1 3 4 2 2 3 7 11
Dominican Republic c/ 1,535.9 8,644.2 10,180.1 1,414.4 11,594.5 0 3 6 9 2 2 4 8 17 Ecuador c/ 1,878.2 5,155.9 7,034.1 1,852.2 8,886.3 0 7 10 17 2 2 7 11 28
El Salvador 1,367.0 6,327.0 7,694.0 1,545.4 9,239.4 0 3 8 11 2 1 3 6 17
Guatemala 1,855.0 6,693.2 8,548.2 2,252.6 10,800.8 2 6 12 20 2 3 5 10 30
Guyana 1,298.0 352.4 1,650.4 1,269.1 2,919.5 0 3 6 9 2 1 3 6 15
Haiti 3,943.0 2,962.3 6,905.3 2,283.8 9,189.1 5 5 11 21 4 1 8 13 34
Honduras c/ 1,732.0 2,000.2 3,732.2 1,510.1 5,242.3 0 6 9 15 2 2 6 10 25
Jamaica c/ 1,237.4 1,291.6 2,529.0 1,860.4 4,389.4 1 4 6 11 4 1 5 10 21 Mexico c/ 1,735.5 1,985.6 3,721.1 2,512.6 6,233.7 4 0 4 8 3 0 8 11 19
Nicaragua 1,803.0 4,559.2 6,362.2 2,209.3 8,571.5 2 6 12 20 3 2 5 10 30 Panama c/ 1,207.5 1,184.3 2,391.8 727.0 3,118.8 0 2 2 4 1 1 1 3 7
Paraguay c/ 1,391.2 840.1 2,231.3 1,040.3 3,271.6 0 4 3 7 2 1 4 7 14
Peru c/ 1,934.7 7,482.9 9,417.6 2,531.2 11,948.8 1 6 8 15 2 3 7 12 27 Uruguay c/ 1,284.5 107.3 1,391.8 556.2 1,948.0 1 1 1 3 1 0 2 3 6
Venezuela c/ 1,379.5 1,385.4 2,764.9 975.7 3,740.6 1 1 3 5 1 2 3 6 11
Central cost 0.0 0.0 0.0 380.9 380.9 0 0 0 0 0 0 0 0 0
Subtotal for 2004-2005 43,590.7 88,260.8 131,851.5 48,180.4 180,031.9 34 102 181 317 69 38 129 236 553
Annex III (continued)
BUDGET
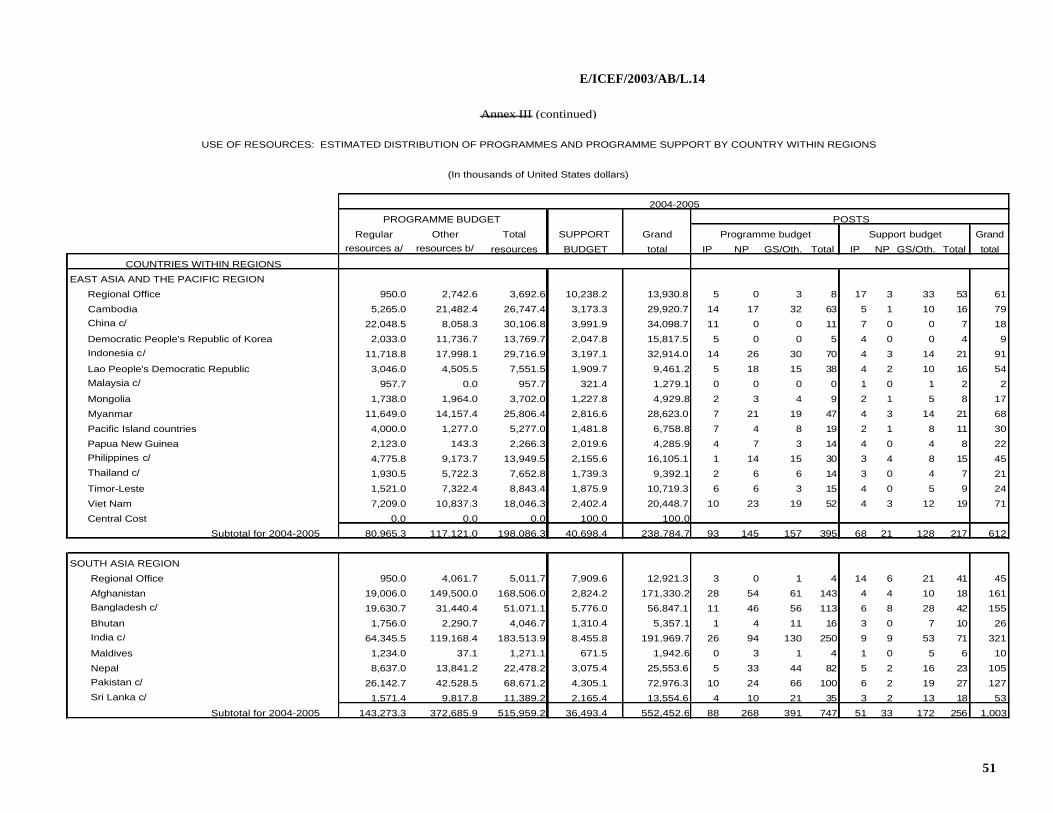
E/ICEF/2003/AB/L.14
51
USE OF RESOURCES: ESTIMATED DISTRIBUTION OF PROGRAMMES AND PROGRAMME SUPPORT BY COUNTRY WITHIN REGIONS
(In thousands of United States dollars)
2004-2005
PROGRAMME BUDGET POSTS
Regular Other Total SUPPORT Grand Programme budget Support budget Grand
resources a/ resources b/ resources total IP NP GS/Oth. Total IP NP GS/Oth. Total total
COUNTRIES WITHIN REGIONS
EAST ASIA AND THE PACIFIC REGION
Regional Office 950.0 2,742.6 3,692.6 10,238.2 13,930.8 5 0 3 8 17 3 33 53 61
Cambodia 5,265.0 21,482.4 26,747.4 3,173.3 29,920.7 14 17 32 63 5 1 10 16 79
China c/ 22,048.5 8,058.3 30,106.8 3,991.9 34,098.7 11 0 0 11 7 0 0 7 18
Democratic People's Republic of Korea 2,033.0 11,736.7 13,769.7 2,047.8 15,817.5 5 0 0 5 4 0 0 4 9
Indonesia c/ 11,718.8 17,998.1 29,716.9 3,197.1 32,914.0 14 26 30 70 4 3 14 21 91
Lao People's Democratic Republic 3,046.0 4,505.5 7,551.5 1,909.7 9,461.2 5 18 15 38 4 2 10 16 54
Malaysia c/ 957.7 0.0 957.7 321.4 1,279.1 0 0 0 0 1 0 1 2 2
Mongolia 1,738.0 1,964.0 3,702.0 1,227.8 4,929.8 2 3 4 9 2 1 5 8 17
Myanmar 11,649.0 14,157.4 25,806.4 2,816.6 28,623.0 7 21 19 47 4 3 14 21 68
Pacific Island countries 4,000.0 1,277.0 5,277.0 1,481.8 6,758.8 7 4 8 19 2 1 8 11 30
Papua New Guinea 2,123.0 143.3 2,266.3 2,019.6 4,285.9 4 7 3 14 4 0 4 8 22
Philippines c/ 4,775.8 9,173.7 13,949.5 2,155.6 16,105.1 1 14 15 30 3 4 8 15 45
Thailand c/ 1,930.5 5,722.3 7,652.8 1,739.3 9,392.1 2 6 6 14 3 0 4 7 21
Timor-Leste 1,521.0 7,322.4 8,843.4 1,875.9 10,719.3 6 6 3 15 4 0 5 9 24
Viet Nam 7,209.0 10,837.3 18,046.3 2,402.4 20,448.7 10 23 19 52 4 3 12 19 71
Central Cost 0.0 0.0 0.0 100.0 100.0
Subtotal for 2004-2005 80,965.3 117,121.0 198,086.3 40,698.4 238,784.7 93 145 157 395 68 21 128 217 612
SOUTH ASIA REGION
Regional Office 950.0 4,061.7 5,011.7 7,909.6 12,921.3 3 0 1 4 14 6 21 41 45
Afghanistan 19,006.0 149,500.0 168,506.0 2,824.2 171,330.2 28 54 61 143 4 4 10 18 161
Bangladesh c/ 19,630.7 31,440.4 51,071.1 5,776.0 56,847.1 11 46 56 113 6 8 28 42 155
Bhutan 1,756.0 2,290.7 4,046.7 1,310.4 5,357.1 1 4 11 16 3 0 7 10 26
India c/ 64,345.5 119,168.4 183,513.9 8,455.8 191,969.7 26 94 130 250 9 9 53 71 321
Maldives 1,234.0 37.1 1,271.1 671.5 1,942.6 0 3 1 4 1 0 5 6 10
Nepal 8,637.0 13,841.2 22,478.2 3,075.4 25,553.6 5 33 44 82 5 2 16 23 105
Pakistan c/ 26,142.7 42,528.5 68,671.2 4,305.1 72,976.3 10 24 66 100 6 2 19 27 127
Sri Lanka c/ 1,571.4 9,817.8 11,389.2 2,165.4 13,554.6 4 10 21 35 3 2 13 18 53
Subtotal for 2004-2005 143,273.3 372,685.9 515,959.2 36,493.4 552,452.6 88 268 391 747 51 33 172 256 1,003
Annex III (continued)
BUDGET
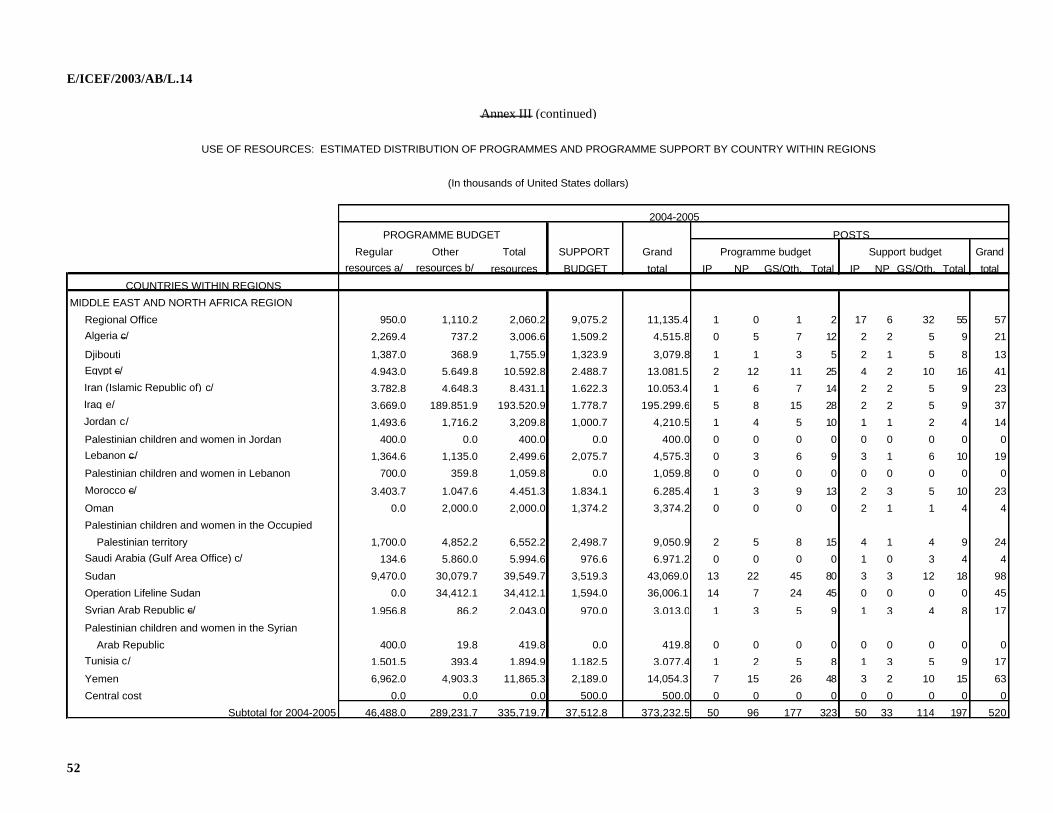
E/ICEF/2003/AB/L.14
52
USE OF RESOURCES: ESTIMATED DISTRIBUTION OF PROGRAMMES AND PROGRAMME SUPPORT BY COUNTRY WITHIN REGIONS
(In thousands of United States dollars)
2004-2005
PROGRAMME BUDGET POSTS
Regular Other Total SUPPORT Grand Programme budget Support budget Grand
resources a/ resources b/ resources total IP NP GS/Oth. Total IP NP GS/Oth. Total total
COUNTRIES WITHIN REGIONS
MIDDLE EAST AND NORTH AFRICA REGION
Regional Office 950.0 1,110.2 2,060.2 9,075.2 11,135.4 1 0 1 2 17 6 32 55 57
Algeria c/ 2,269.4 737.2 3,006.6 1,509.2 4,515.8 0 5 7 12 2 2 5 9 21
Djibouti 1,387.0 368.9 1,755.9 1,323.9 3,079.8 1 1 3 5 2 1 5 8 13
Egypt c/ 4,943.0 5,649.8 10,592.8 2,488.7 13,081.5 2 12 11 25 4 2 10 16 41
Iran (Islamic Republic of) c/ 3,782.8 4,648.3 8,431.1 1,622.3 10,053.4 1 6 7 14 2 2 5 9 23
Iraq e/ 3,669.0 189,851.9 193,520.9 1,778.7 195,299.6 5 8 15 28 2 2 5 9 37
Jordan c/ 1,493.6 1,716.2 3,209.8 1,000.7 4,210.5 1 4 5 10 1 1 2 4 14
Palestinian children and women in Jordan 400.0 0.0 400.0 0.0 400.0 0 0 0 0 0 0 0 0 0
Lebanon c/ 1,364.6 1,135.0 2,499.6 2,075.7 4,575.3 0 3 6 9 3 1 6 10 19
Palestinian children and women in Lebanon 700.0 359.8 1,059.8 0.0 1,059.8 0 0 0 0 0 0 0 0 0
Morocco c/ 3,403.7 1,047.6 4,451.3 1,834.1 6,285.4 1 3 9 13 2 3 5 10 23
Oman 0.0 2,000.0 2,000.0 1,374.2 3,374.2 0 0 0 0 2 1 1 4 4
Palestinian children and women in the Occupied Palestinian territory 1,700.0 4,852.2 6,552.2 2,498.7 9,050.9 2 5 8 15 4 1 4 9 24
Saudi Arabia (Gulf Area Office) c/ 134.6 5,860.0 5,994.6 976.6 6,971.2 0 0 0 0 1 0 3 4 4
Sudan 9,470.0 30,079.7 39,549.7 3,519.3 43,069.0 13 22 45 80 3 3 12 18 98
Operation Lifeline Sudan 0.0 34,412.1 34,412.1 1,594.0 36,006.1 14 7 24 45 0 0 0 0 45
Syrian Arab Republic c/ 1,956.8 86.2 2,043.0 970.0 3,013.0 1 3 5 9 1 3 4 8 17
Palestinian children and women in the Syrian
Arab Republic 400.0 19.8 419.8 0.0 419.8 0 0 0 0 0 0 0 0 0
Tunisia c/ 1,501.5 393.4 1,894.9 1,182.5 3,077.4 1 2 5 8 1 3 5 9 17
Yemen 6,962.0 4,903.3 11,865.3 2,189.0 14,054.3 7 15 26 48 3 2 10 15 63
Central cost 0.0 0.0 0.0 500.0 500.0 0 0 0 0 0 0 0 0 0
Subtotal for 2004-2005 46,488.0 289,231.7 335,719.7 37,512.8 373,232.5 50 96 177 323 50 33 114 197 520
BUDGET
Annex III (continued)
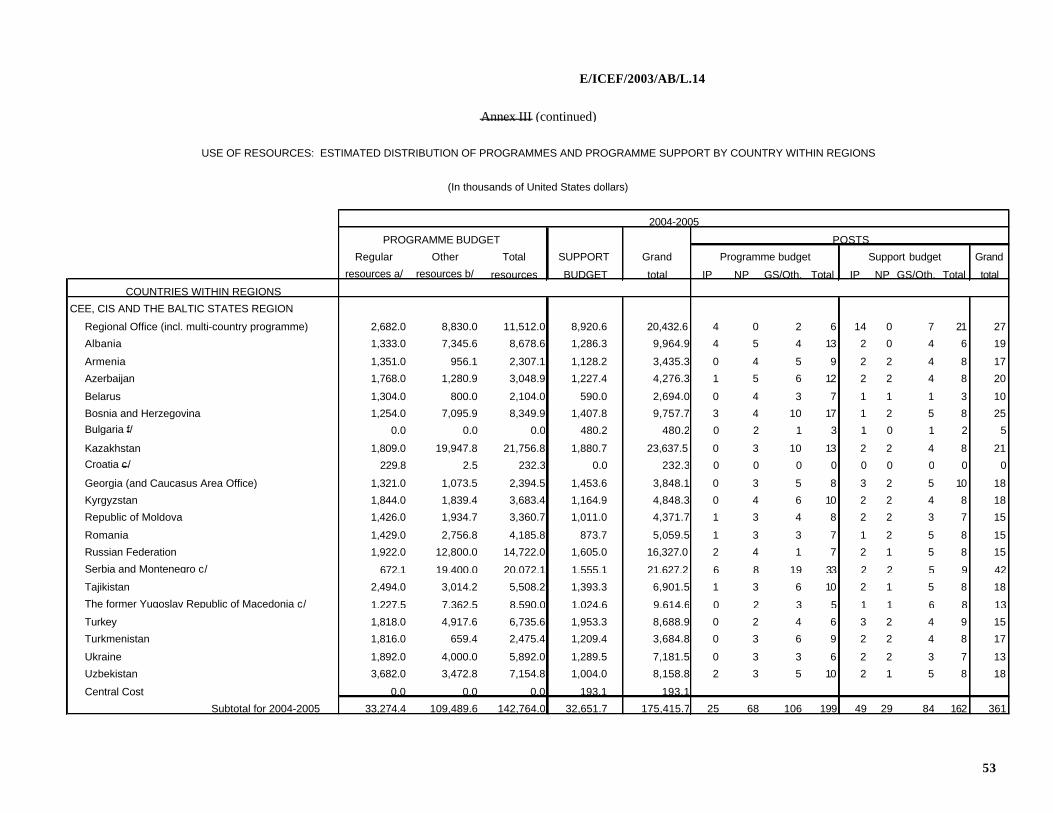
E/ICEF/2003/AB/L.14
53
USE OF RESOURCES: ESTIMATED DISTRIBUTION OF PROGRAMMES AND PROGRAMME SUPPORT BY COUNTRY WITHIN REGIONS
(In thousands of United States dollars)
2004-2005
PROGRAMME BUDGET POSTS
Regular Other Total SUPPORT Grand Programme budget Support budget Grand
resources a/ resources b/ resources total IP NP GS/Oth. Total IP NP GS/Oth. Total total
COUNTRIES WITHIN REGIONS
CEE, CIS AND THE BALTIC STATES REGION
Regional Office (incl. multi-country programme) 2,682.0 8,830.0 11,512.0 8,920.6 20,432.6 4 0 2 6 14 0 7 21 27
Albania 1,333.0 7,345.6 8,678.6 1,286.3 9,964.9 4 5 4 13 2 0 4 6 19
Armenia 1,351.0 956.1 2,307.1 1,128.2 3,435.3 0 4 5 9 2 2 4 8 17
Azerbaijan 1,768.0 1,280.9 3,048.9 1,227.4 4,276.3 1 5 6 12 2 2 4 8 20
Belarus 1,304.0 800.0 2,104.0 590.0 2,694.0 0 4 3 7 1 1 1 3 10
Bosnia and Herzegovina 1,254.0 7,095.9 8,349.9 1,407.8 9,757.7 3 4 10 17 1 2 5 8 25 Bulgaria f/ 0.0 0.0 0.0 480.2 480.2 0 2 1 3 1 0 1 2 5
Kazakhstan 1,809.0 19,947.8 21,756.8 1,880.7 23,637.5 0 3 10 13 2 2 4 8 21 Croatia c/ 229.8 2.5 232.3 0.0 232.3 0 0 0 0 0 0 0 0 0
Georgia (and Caucasus Area Office) 1,321.0 1,073.5 2,394.5 1,453.6 3,848.1 0 3 5 8 3 2 5 10 18
Kyrgyzstan 1,844.0 1,839.4 3,683.4 1,164.9 4,848.3 0 4 6 10 2 2 4 8 18
Republic of Moldova 1,426.0 1,934.7 3,360.7 1,011.0 4,371.7 1 3 4 8 2 2 3 7 15
Romania 1,429.0 2,756.8 4,185.8 873.7 5,059.5 1 3 3 7 1 2 5 8 15
Russian Federation 1,922.0 12,800.0 14,722.0 1,605.0 16,327.0 2 4 1 7 2 1 5 8 15
Serbia and Montenegro c/ 672.1 19,400.0 20,072.1 1,555.1 21,627.2 6 8 19 33 2 2 5 9 42
Tajikistan 2,494.0 3,014.2 5,508.2 1,393.3 6,901.5 1 3 6 10 2 1 5 8 18
The former Yugoslav Republic of Macedonia c/ 1,227.5 7,362.5 8,590.0 1,024.6 9,614.6 0 2 3 5 1 1 6 8 13
Turkey 1,818.0 4,917.6 6,735.6 1,953.3 8,688.9 0 2 4 6 3 2 4 9 15
Turkmenistan 1,816.0 659.4 2,475.4 1,209.4 3,684.8 0 3 6 9 2 2 4 8 17
Ukraine 1,892.0 4,000.0 5,892.0 1,289.5 7,181.5 0 3 3 6 2 2 3 7 13
Uzbekistan 3,682.0 3,472.8 7,154.8 1,004.0 8,158.8 2 3 5 10 2 1 5 8 18
Central Cost 0.0 0.0 0.0 193.1 193.1
Subtotal for 2004-2005 33,274.4 109,489.6 142,764.0 32,651.7 175,415.7 25 68 106 199 49 29 84 162 361
BUDGET
Annex III (continued)
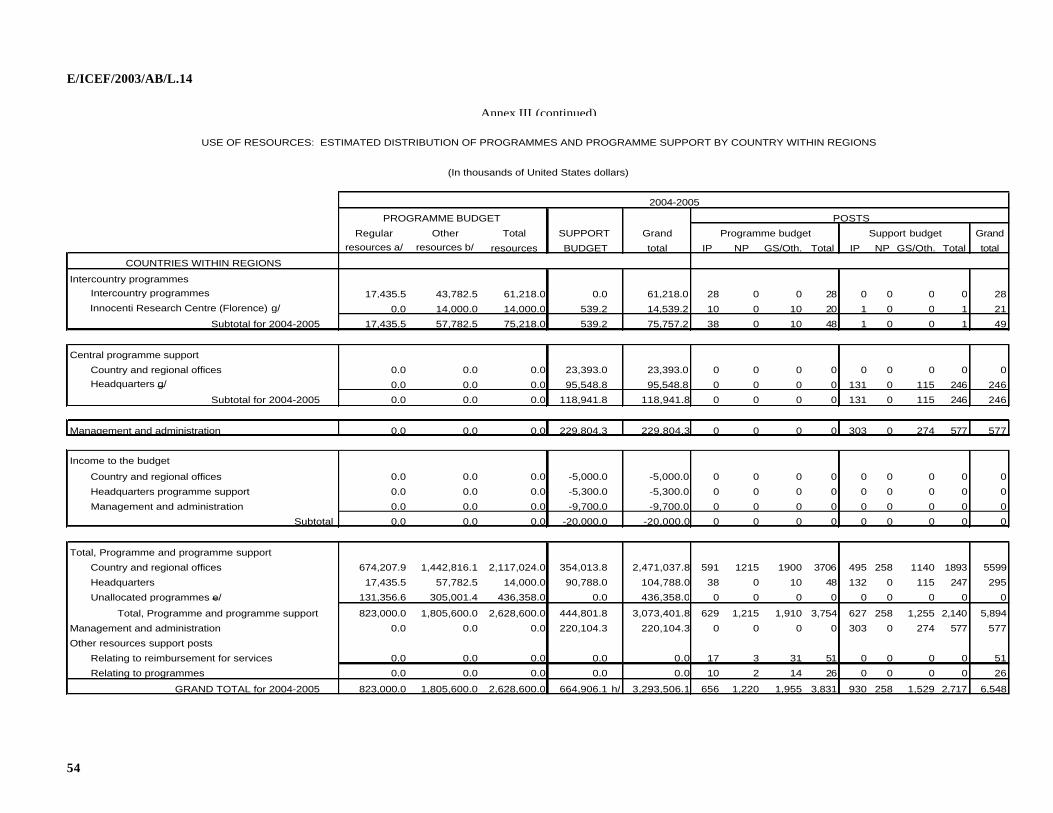
E/ICEF/2003/AB/L.14
54
USE OF RESOURCES: ESTIMATED DISTRIBUTION OF PROGRAMMES AND PROGRAMME SUPPORT BY COUNTRY WITHIN REGIONS
(In thousands of United States dollars)
2004-2005
PROGRAMME BUDGET POSTS
Regular Other Total SUPPORT Grand Programme budget Support budget Grandresources a/ resources b/ resources total IP NP GS/Oth. Total IP NP GS/Oth. Total total
COUNTRIES WITHIN REGIONS
Intercountry programmes Intercountry programmes 17,435.5 43,782.5 61,218.0 0.0 61,218.0 28 0 0 28 0 0 0 0 28 Innocenti Research Centre (Florence) g/ 0.0 14,000.0 14,000.0 539.2 14,539.2 10 0 10 20 1 0 0 1 21
Subtotal for 2004-2005 17,435.5 57,782.5 75,218.0 539.2 75,757.2 38 0 10 48 1 0 0 1 49
Central programme support
Country and regional offices 0.0 0.0 0.0 23,393.0 23,393.0 0 0 0 0 0 0 0 0 0 Headquarters g/ 0.0 0.0 0.0 95,548.8 95,548.8 0 0 0 0 131 0 115 246 246
Subtotal for 2004-2005 0.0 0.0 0.0 118,941.8 118,941.8 0 0 0 0 131 0 115 246 246
Management and administration 0.0 0.0 0.0 229,804.3 229,804.3 0 0 0 0 303 0 274 577 577
Income to the budget
Country and regional offices 0.0 0.0 0.0 -5,000.0 -5,000.0 0 0 0 0 0 0 0 0 0
Headquarters programme support 0.0 0.0 0.0 -5,300.0 -5,300.0 0 0 0 0 0 0 0 0 0
Management and administration 0.0 0.0 0.0 -9,700.0 -9,700.0 0 0 0 0 0 0 0 0 0
Subtotal 0.0 0.0 0.0 -20,000.0 -20,000.0 0 0 0 0 0 0 0 0 0
Total, Programme and programme support
Country and regional offices 674,207.9 1,442,816.1 2,117,024.0 354,013.8 2,471,037.8 591 1215 1900 3706 495 258 1140 1893 5599
Headquarters 17,435.5 57,782.5 14,000.0 90,788.0 104,788.0 38 0 10 48 132 0 115 247 295
Unallocated programmes e/ 131,356.6 305,001.4 436,358.0 0.0 436,358.0 0 0 0 0 0 0 0 0 0
Total, Programme and programme support 823,000.0 1,805,600.0 2,628,600.0 444,801.8 3,073,401.8 629 1,215 1,910 3,754 627 258 1,255 2,140 5,894
Management and administration 0.0 0.0 0.0 220,104.3 220,104.3 0 0 0 0 303 0 274 577 577
Other resources support posts
Relating to reimbursement for services 0.0 0.0 0.0 0.0 0.0 17 3 31 51 0 0 0 0 51
Relating to programmes 0.0 0.0 0.0 0.0 0.0 10 2 14 26 0 0 0 0 26
GRAND TOTAL for 2004-2005 823,000.0 1,805,600.0 2,628,600.0 664,906.1 h/ 3,293,506.1 656 1,220 1,955 3,831 930 258 1,529 2,717 6,548
BUDGET
Annex III (continued)
E/ICEF/2003/AB/L.14
55
Notes a Includes estimated planning levels and estimated proceeds from card sales. The exact allocation country-by-country is done on an annual basis in accordance with Executive Board decision 1997/18. For 2004, this will be done towards the end of 2003. b Estimates for other resources are extrapolated using 2001-2002 estimated expenditures and recent indicators. The estimates include trust funds. c Programme budget for regular resources includes proceeds from cards sales. d The estimate for other resources includes Suriname. e Proposed budget for other resources includes trust funds. f Included in the multi-country programme above. g Programme support budget for the Innocenti Research Centre is excluded from total programme support for headquarters in this table. h Comprising net support budget proposal from regular resources of $528.5 million and $136.4 million recovery funded from other resources and trust funds (see table 1).
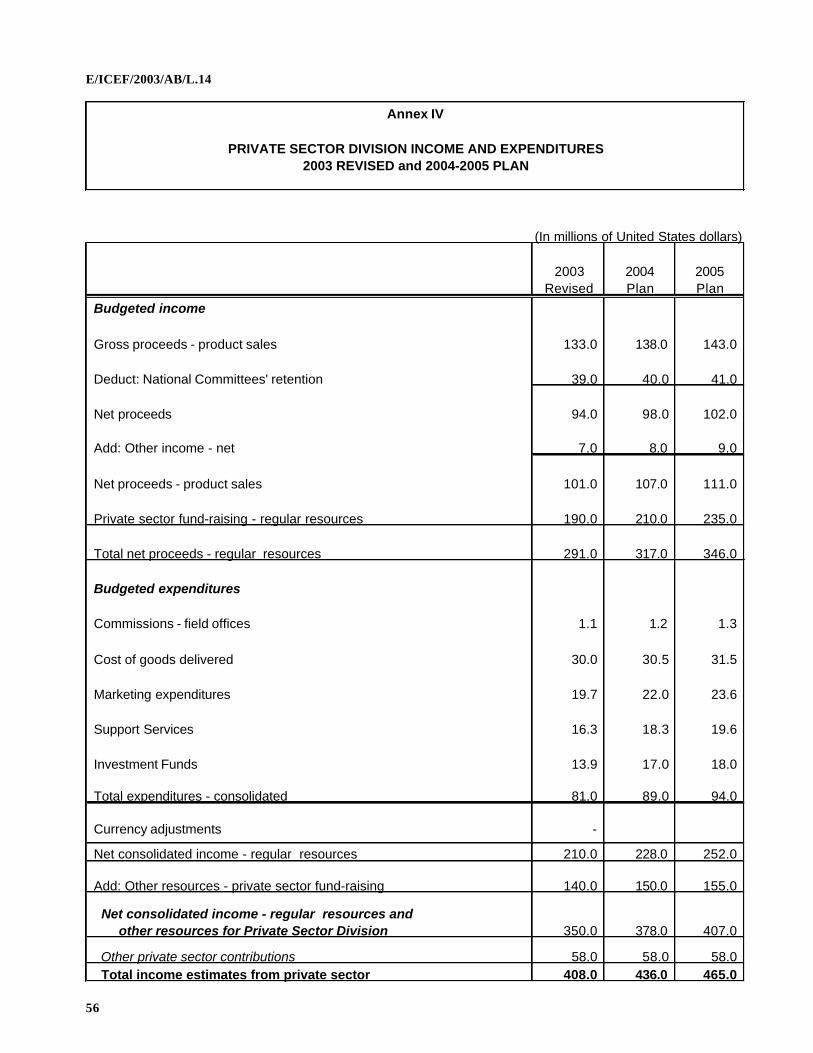
E/ICEF/2003/AB/L.14
56
PRIVATE SECTOR DIVISION INCOME AND EXPENDITURES 2003 REVISED and 2004-2005 PLAN
(In millions of United States dollars)
2003 2004 2005Revised Plan Plan
Budgeted income
Gross proceeds - product sales 133.0 138.0 143.0
Deduct: National Committees' retention 39.0 40.0 41.0
Net proceeds 94.0 98.0 102.0
Add: Other income - net 7.0 8.0 9.0
Net proceeds - product sales 101.0 107.0 111.0
Private sector fund-raising - regular resources 190.0 210.0 235.0
Total net proceeds - regular resources 291.0 317.0 346.0
Budgeted expenditures
Commissions - field offices 1.1 1.2 1.3
Cost of goods delivered 30.0 30.5 31.5
Marketing expenditures 19.7 22.0 23.6
Support Services 16.3 18.3 19.6
Investment Funds 13.9 17.0 18.0
Total expenditures - consolidated 81.0 89.0 94.0
Currency adjustments -
Net consolidated income - regular resources 210.0 228.0 252.0
Add: Other resources - private sector fund-raising 140.0 150.0 155.0
Net consolidated income - regular resources and other resources for Private Sector Division 350.0 378.0 407.0
Other private sector contributions 58.0 58.0 58.0 Total income estimates from private sector 408.0 436.0 465.0
Annex IV
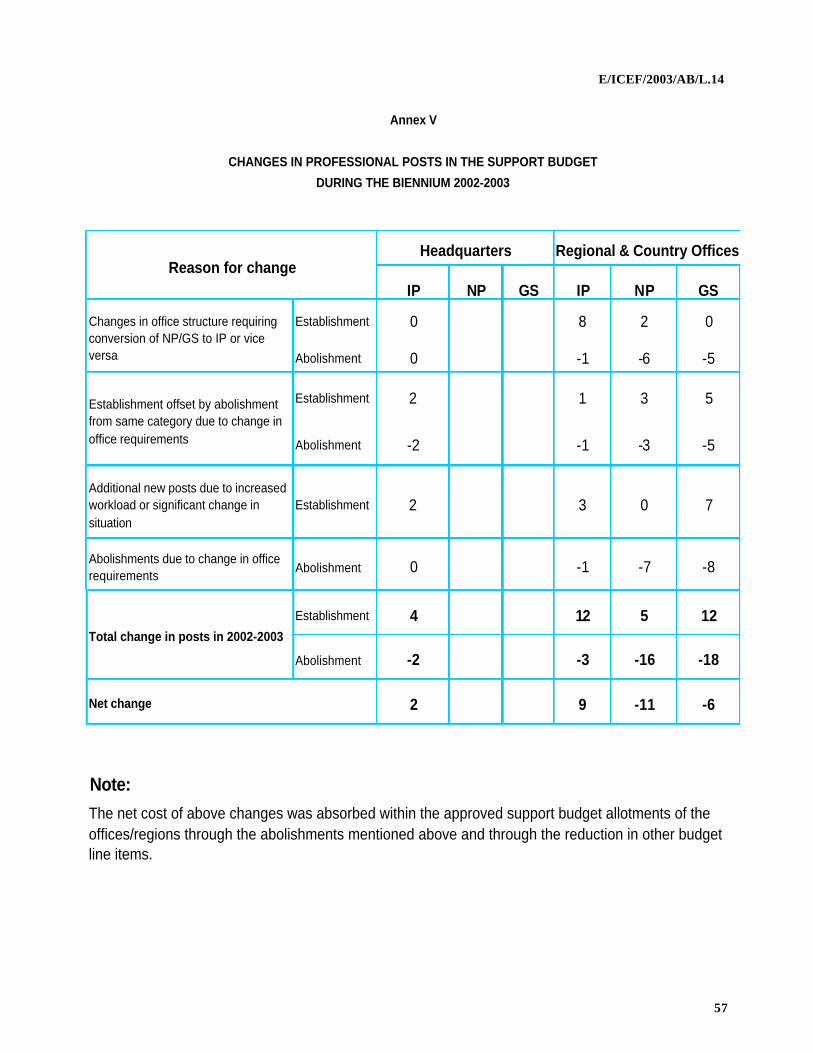
E/ICEF/2003/AB/L.14
57
Annex V
CHANGES IN PROFESSIONAL POSTS IN THE SUPPORT BUDGET
DURING THE BIENNIUM 2002-2003
Headquarters Regional & Country Offices
IP NP GS IP NP GS
Establishment 0 8 2 0
Abolishment 0 -1 -6 -5
Establishment 2 1 3 5
Abolishment -2 -1 -3 -5
Additional new posts due to increased workload or significant change in situation
Establishment 2 3 0 7
Abolishments due to change in office requirements Abolishment 0 -1 -7 -8
Establishment 4 12 5 12
Abolishment -2 -3 -16 -18
2 9 -11 -6
Note:The net cost of above changes was absorbed within the approved support budget allotments of the offices/regions through the abolishments mentioned above and through the reduction in other budget line items.
Reason for change
Changes in office structure requiring conversion of NP/GS to IP or vice versa
Establishment offset by abolishment from same category due to change in office requirements
Total change in posts in 2002-2003
Net change
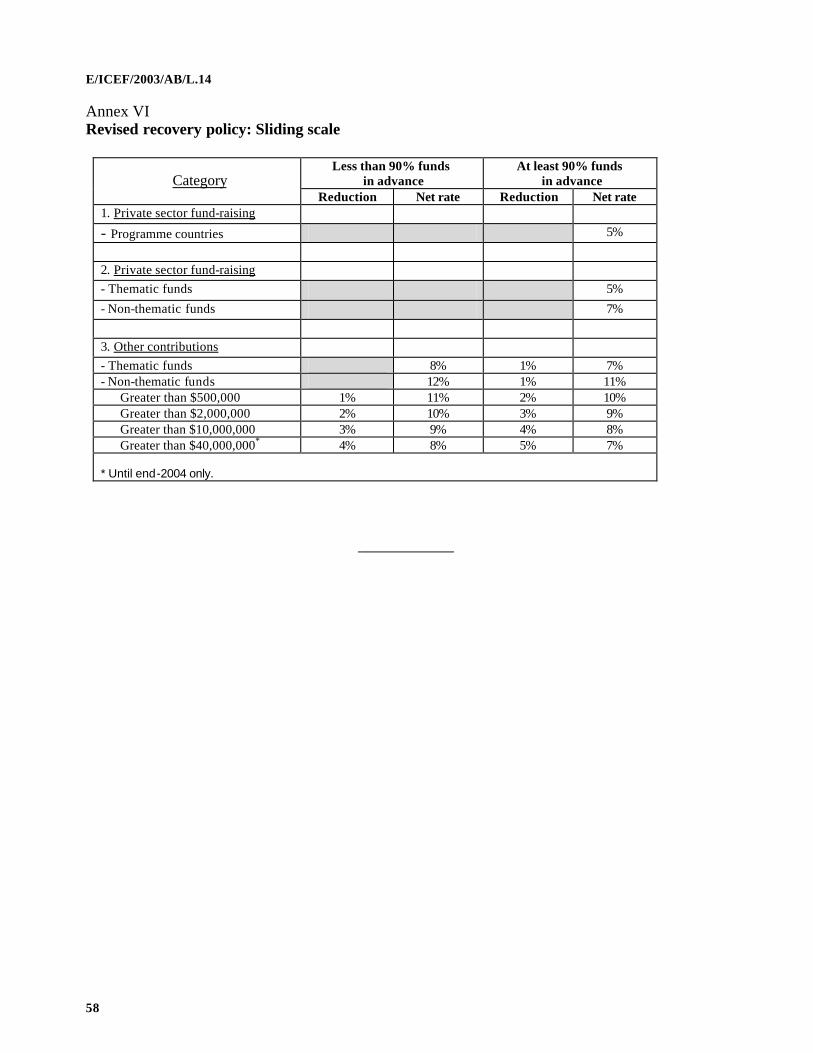
E/ICEF/2003/AB/L.14
58
Annex VI Revised recovery policy: Sliding scale
Less than 90% funds in advance
At least 90% funds in advance
Category
Reduction Net rate Reduction Net rate 1. Private sector fund-raising - Programme countries 5%
2. Private sector fund-raising - Thematic funds 5%
- Non-thematic funds 7%
3. Other contributions - Thematic funds 8% 1% 7% - Non-thematic funds 12% 1% 11% Greater than $500,000 1% 11% 2% 10% Greater than $2,000,000 2% 10% 3% 9% Greater than $10,000,000 3% 9% 4% 8% Greater than $40,000,000* 4% 8% 5% 7% * Until end-2004 only.
____________