Embed Size (px)
Citation preview

BIE: Dropout Prevention Initiative: “Graduation for All”
A Collaboration with the National Dropout Prevention Center for Students with Disabilities, an OSEP funded TA&D Center
Dr. Sandra Covington SmithDr. Marilyn Johnson
Sue Bement
BIE Special Education AcademySeptember, 2011
Tampa, FL
1
2
National Dropout Prevention Center for Students with Disabilities
National Dropout Prevention Center for Students with Disabilities
A national specialty center funded by OSEP to support states in increasing school completion rates for students with disabilitiesFirst funded by OSEP in January 2004Re-funded by OSEP in January 2009

3
NDPC-SD Assists States in…• Identifying evidence-based dropout
prevention interventions, programs, and practices
• Producing evidence-based knowledge that is useful to school practitioners
• Providing targeted technical assistance to states in a variety of formats
Risk FactorsEducation, Sociology, and Economics
Demographic characteristics and family background
Past school performance Personal/psychological characteristics Adult responsibilities School or neighborhood characteristics
4

Risk FactorsDemographic Characteristics
African American, American Indian/Native American, Hispanic/Latino American Approximately half of African American students do not receive
diplomas with their cohort. Less than 50% of Native American Students graduate each year
(Faircloth & Tippeconnic, 2010). Native students have the highest dropout rate in the nation (Indian
Nation At Risk, 1991). Hispanic students are the largest minority group in our Nation’s
schools. Fewer than half of all Hispanic children participate in early
childhood education programs, and far too few Hispanics students graduate from high school.
5
Risk FactorsFamily Background
Family income, SES, family involvement, families who receive welfare, parents’ educational attainment, single parent home, limited English proficiency, parent or sibling dropped out Students from low SES families are four times more
likely to drop out than their peers from higher a SES
Past School Performance Low grades, poor test scores, retention & age, disciplinary
problems, truancy, spending little time on homework
6
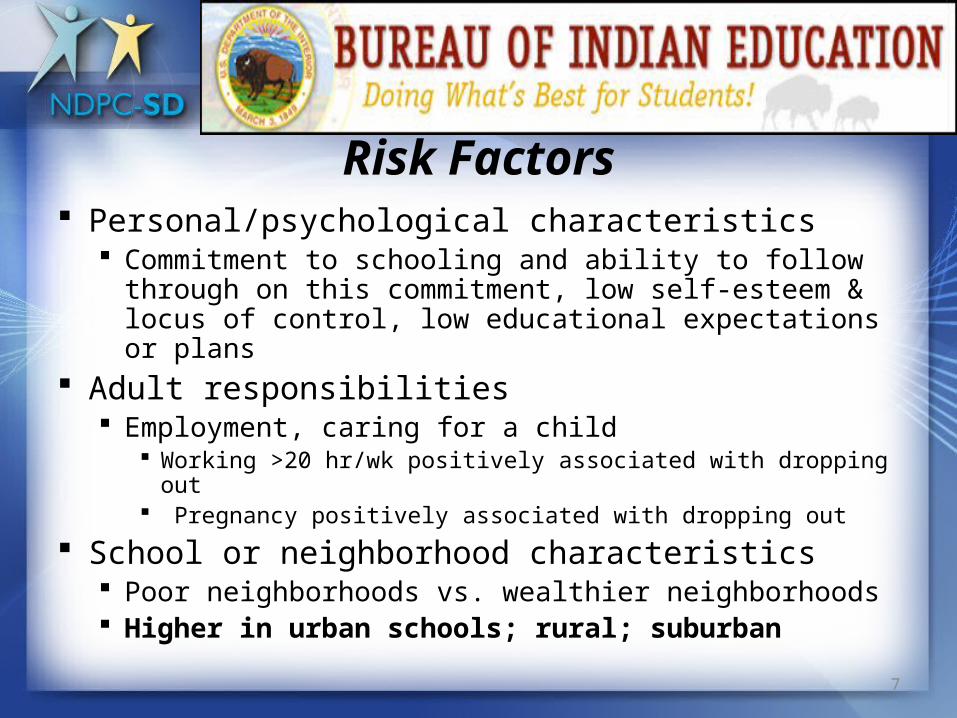
Risk Factors Personal/psychological characteristics
Commitment to schooling and ability to follow through on this commitment, low self-esteem & locus of control, low educational expectations or plans
Adult responsibilities Employment, caring for a child
Working >20 hr/wk positively associated with dropping out Pregnancy positively associated with dropping out
School or neighborhood characteristics Poor neighborhoods vs. wealthier neighborhoods Higher in urban schools; rural; suburban
7


9

Program Development & Support• Promote and facilitate the implementation of evidence-
based strategies that :– Promote a positive school climate– Increase school attendance– Promote prosocial behaviors– Promote academic success– Increase family engagement– Increase student engagement
10
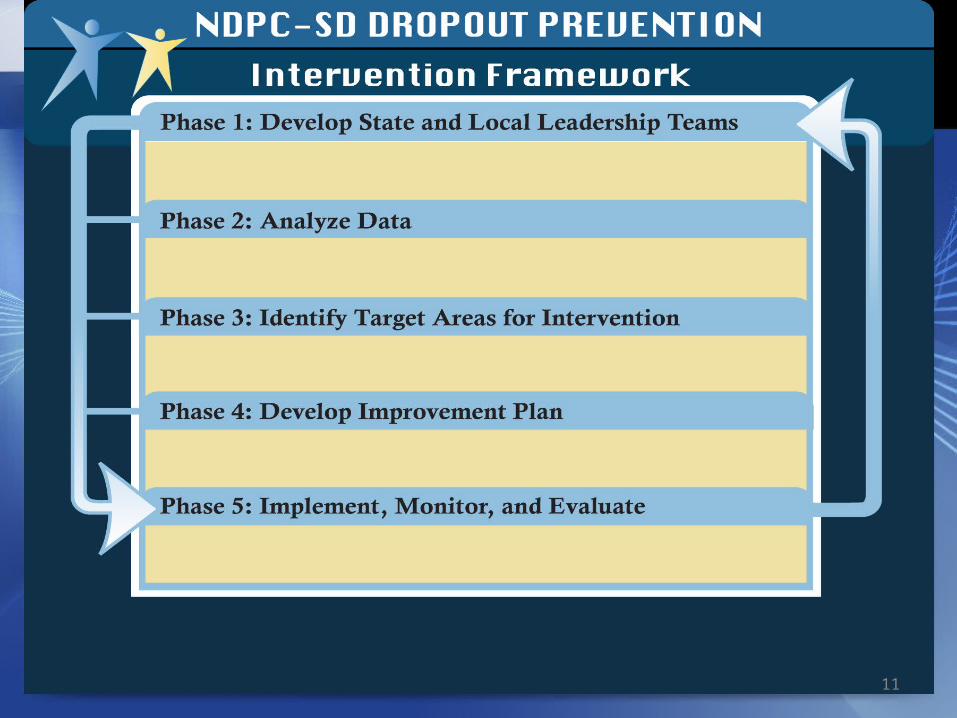
11

12
Understanding Dropout:
A Process of Disengagement
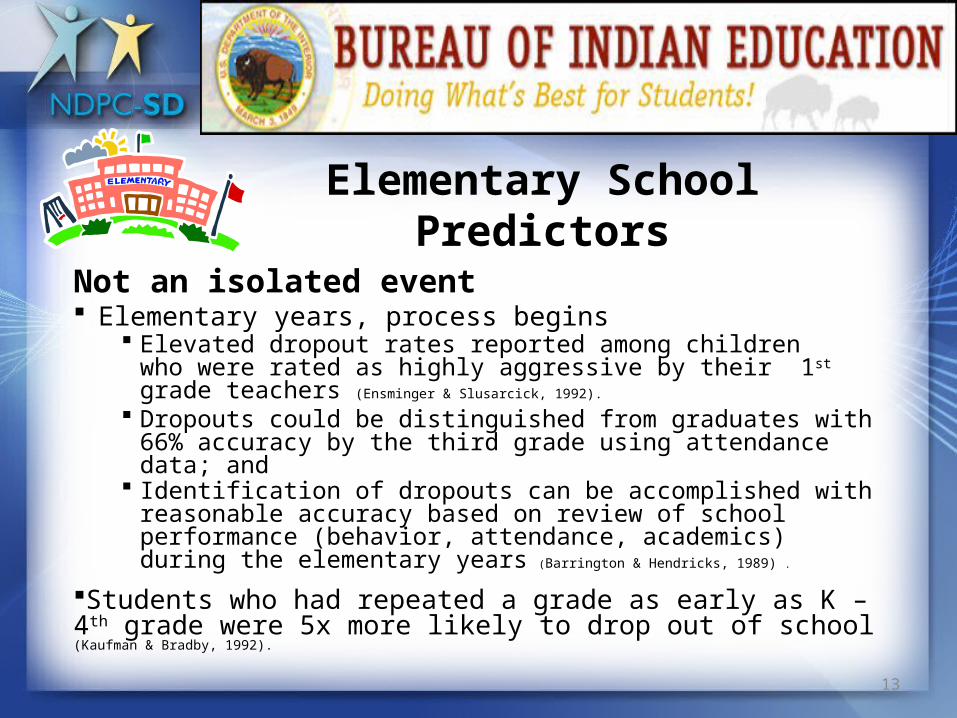
Elementary School Predictors
Not an isolated event Elementary years, process begins
Elevated dropout rates reported among children who were rated as highly aggressive by their 1st grade teachers (Ensminger & Slusarcick, 1992).
Dropouts could be distinguished from graduates with 66% accuracy by the third grade using attendance data; and
Identification of dropouts can be accomplished with reasonable accuracy based on review of school performance (behavior, attendance, academics) during the elementary years (Barrington & Hendricks, 1989) .
Students who had repeated a grade as early as K – 4th grade were 5x more likely to drop out of school (Kaufman & Bradby, 1992).
13

Middle School Predictors of Dropout (Balfanz & Herzog, 2005; 2006)
The four strongest predictors – determined by the end of sixth grade
1. Poor attendance (14%)2. Failing English (16%)3. Poor behavior (17%)4. Failing math (21%)
Sixth graders who do not attend school regularly, receive poor behavior marks, or fail math or English
10% chance of graduating on time 20% chance of graduating a year late
14

15
Middle School Predictors of Dropout (Balfanz & Herzog, 2005; 2006)
Students who repeat middle school grades are 11 times more likely to drop out than students who had not repeated
A student who is retained two grades increases their risk of dropping out of high school by 90% (Roderick, 1995).
Transition between schools Middle school/junior high school to high school

16
High School Predictors of Dropout (Balfanz & Herzog, 2006)
• Students who enter ninth grade two or more grade levels behind their peers have only a one in two chance of being promoted to the tenth grade on time
• Ninth grade retention is the biggest predictor of dropouts
• The biggest fall off for students is between ninth and tenth grade

Graduation Rate (60 BIE high schools)Range: 19.74% to 100%•4 – 90 to 100%•5 – 80-90%•7 – 70-80%•18 – 50-70%•20 – less than 50%
17
18
Preventing Dropout:
The Process of Re-engaging Students

Student AchievementAssociation among achievement, engagement, and school behavior– Engaged students tend to earn higher grades,
perform better on tests, report a sense of belonging, can set or respond to personal goals, persist on tasks
– Engaged students perceive more support from teachers, practitioners, and peers, which leads to increased levels of engagement and adult support (Furrer et al., 2006)
19

2020
The Effects of Engagement (Finn, 1993)
School Completion = Engagement in School and LearningKEY ELEMENTS1.Student Participation2.Identification with School3.Social Bonding4.Personal Investment in Learning

2121
Types of Engagement & Associated Factors
1.Academic engagement - time on task, academically engaged time, or credit accrual
2.Behavioral engagement - attendance, avoidance of suspension, classroom participation, and involvement in extracurricular activities
3.Cognitive engagement -processing academic information or becoming a self-regulated learner
4.Psychological engagement - identification with school or a sense of belonging
5.Social/Emotional engagement -feelings of safety and security and expressions of support and inclusion

22
Lessons Learned
What Do We Know & What Have We Learned

LESSONS LEARNEDCauses
Problem behaviors coupled with academic difficulties or prior academic failures are key risk factors that are predictive of school dropout.
Repeated use of exclusionary discipline practices, such as suspension is one of the major factors contributing to dropout.
High absenteeism and retention are serious risk factors for dropping out that can be monitored by schools.
23
24
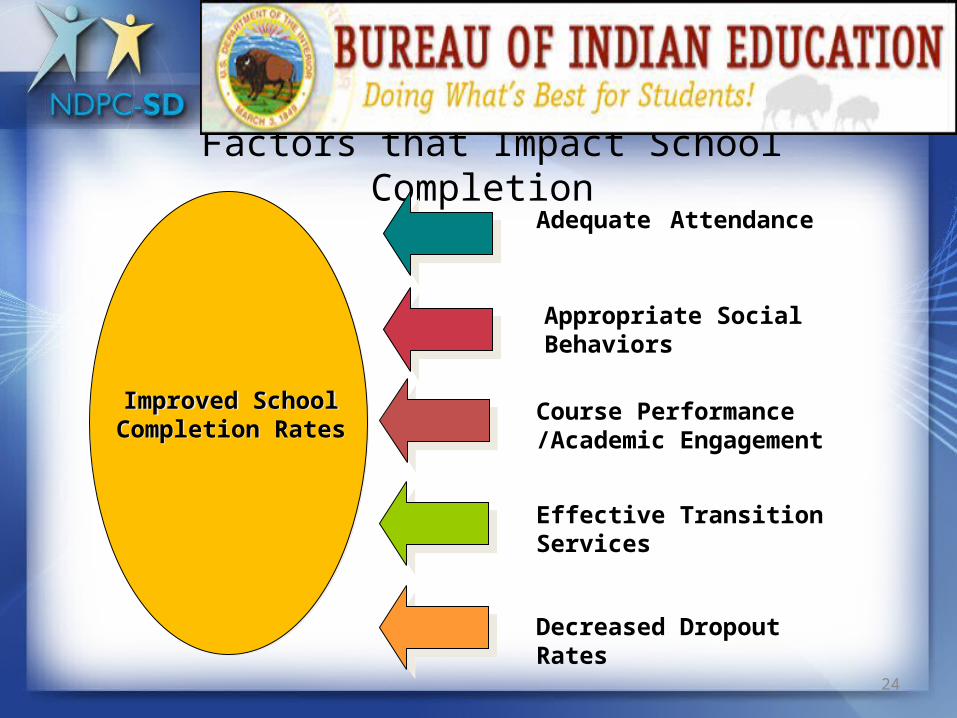
Factors that Impact School Completion
Improved School Completion RatesImproved School Completion Rates
Adequate Attendance
Appropriate Social Behaviors
Course Performance /Academic Engagement
Decreased Dropout Rates
Effective Transition Services

LESSONS LEARNEDConsequences
Students who drop out are more likely to be unemployed or under employed.
Dropouts are more likely than high school graduates to need the support of living with parents in early adulthood, experience health problems, engage in criminal activities, and become dependent on welfare and other government programs.
Three to five years after dropping out, the cumulative arrest rate for youth with SED is 73%.
25

26
Desired Outcomes
Increase the transfer of knowledge
Enhanced understanding
Expanded practices
Improved capacity
Increased School Completion
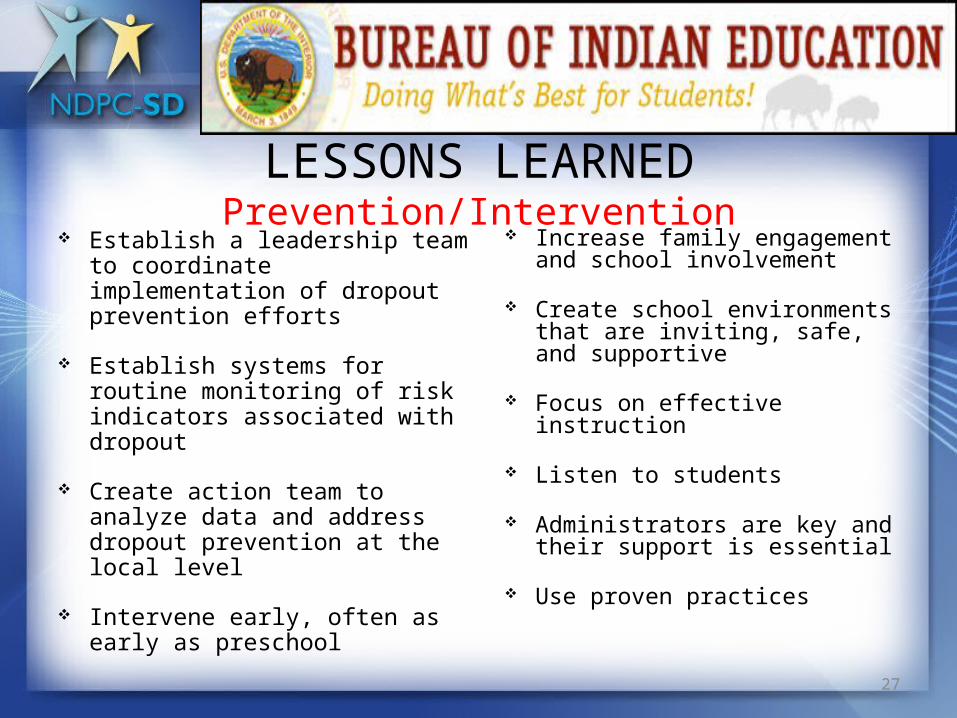
LESSONS LEARNEDPrevention/Intervention
Establish a leadership team to coordinate implementation of dropout prevention efforts
Establish systems for routine monitoring of risk indicators associated with dropout
Create action team to analyze data and address dropout prevention at the local level
Intervene early, often as early as preschool
Increase family engagement and school involvement
Create school environments that are inviting, safe, and supportive
Focus on effective instruction
Listen to students
Administrators are key and their support is essential
Use proven practices
27
28
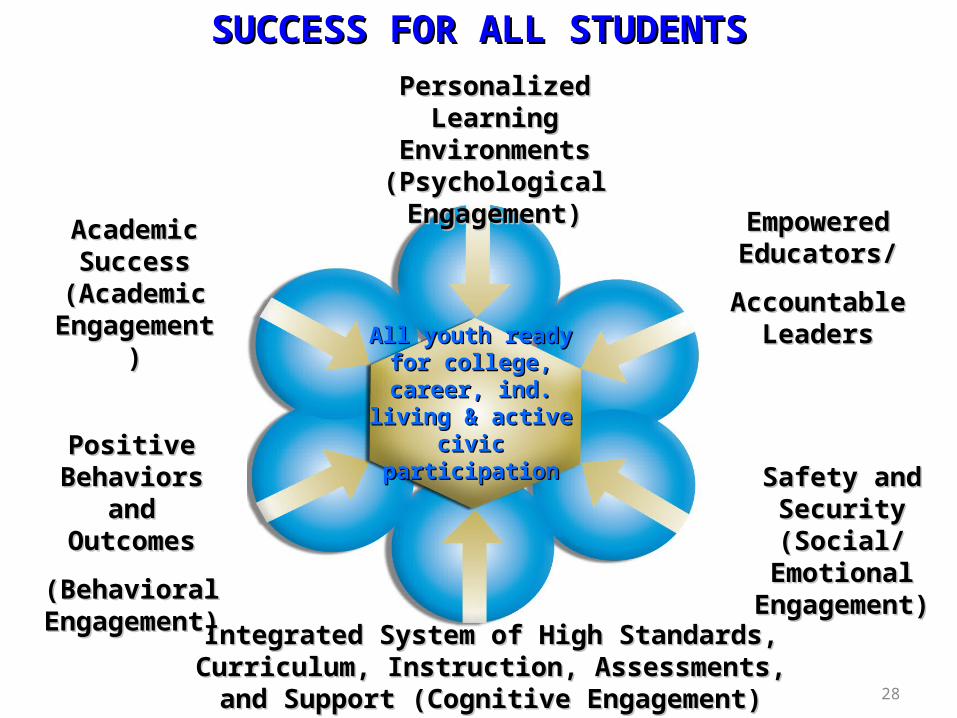
All youth ready for All youth ready for college, career, college, career,
ind. living & active ind. living & active civic participationcivic participationPositive Positive
Behaviors Behaviors and and
OutcomesOutcomes
(Behavioral (Behavioral Engagement)Engagement) Integrated System of High Standards, Integrated System of High Standards,
Curriculum, Instruction, Assessments, and Curriculum, Instruction, Assessments, and Support (Cognitive Engagement)Support (Cognitive Engagement)
Safety and Safety and Security Security (Social/ (Social/
Emotional Emotional Engagement)Engagement)
Empowered Empowered Educators/Educators/
Accountable Accountable LeadersLeaders
Personalized Learning Personalized Learning Environments Environments (Psychological (Psychological Engagement)Engagement)
Academic Academic Success Success
(Academic (Academic Engagement)Engagement)
SUCCESS FOR ALL STUDENTSSUCCESS FOR ALL STUDENTS
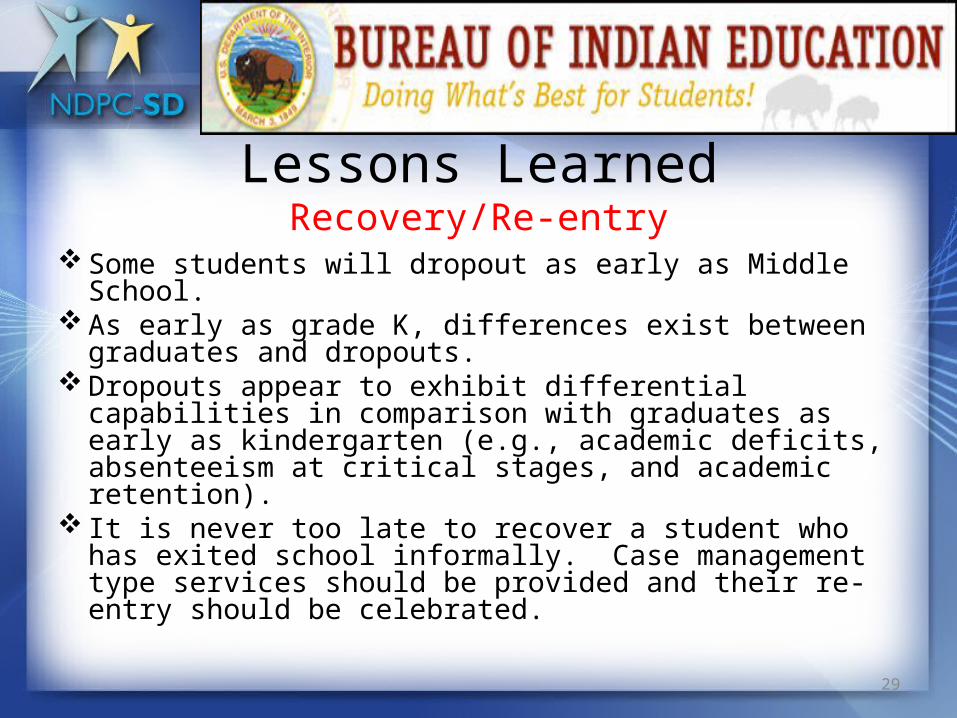
Lessons LearnedRecovery/Re-entry
Some students will dropout as early as Middle School. As early as grade K, differences exist between graduates
and dropouts. Dropouts appear to exhibit differential capabilities in
comparison with graduates as early as kindergarten (e.g., academic deficits, absenteeism at critical stages, and academic retention).
It is never too late to recover a student who has exited school informally. Case management type services should be provided and their re-entry should be celebrated.
29
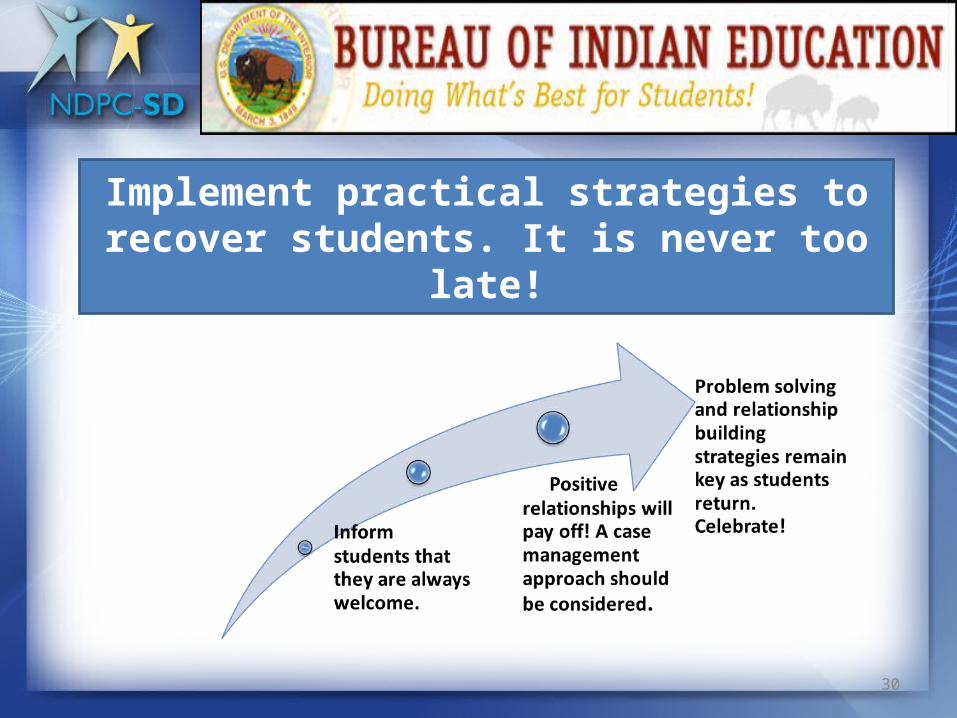
Implement practical strategies to recover students. It is never too late!
30
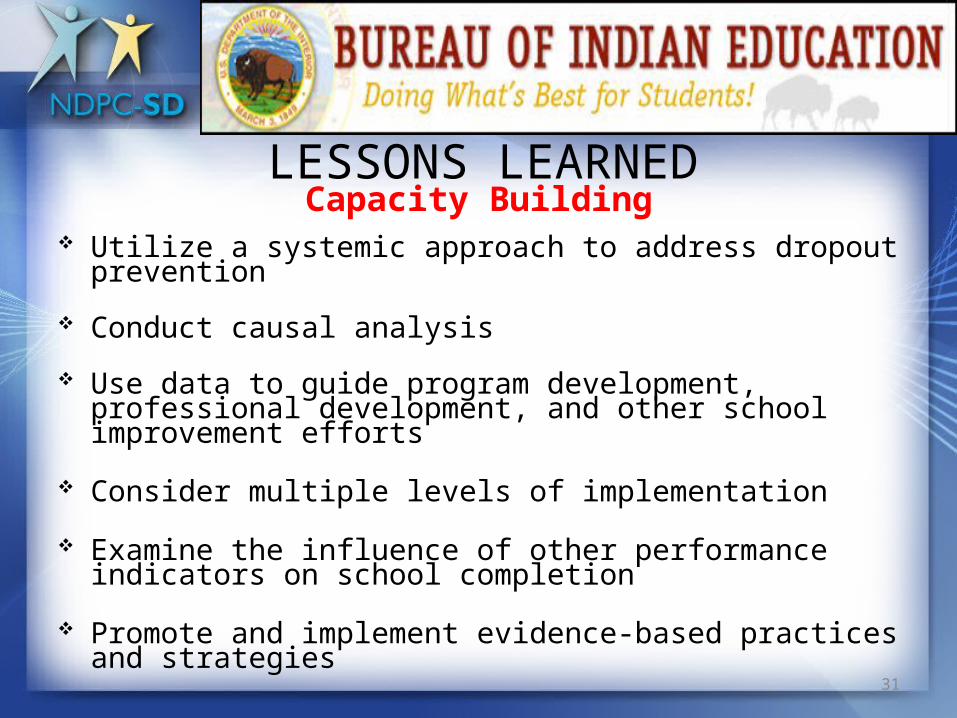
LESSONS LEARNEDCapacity Building
Utilize a systemic approach to address dropout prevention
Conduct causal analysis
Use data to guide program development, professional development, and other school improvement efforts
Consider multiple levels of implementation
Examine the influence of other performance indicators on school completion
Promote and implement evidence-based practices and strategies
31

LESSONS LEARNED
32
Effective intervention practices +
Effective implementation practices =
Positive outcomes for youth with disabilities

33
Achieving Success:
Improving Outcomes

Effective Leadership At the Local LevelInitiate, Support, and Maintain School Completion Initiatives
– Recognize Impetus for Change– Design & Development of an Effective Leadership Team– Dropout Prevention Initiative and Efforts are Vested in a Place of Authority– Analysis of Valid and Reliable Data / Analysis of Policies and Procedures– Professional Development, Training, and Technical Assistance – Endorsement of Evidence-Based Practices– Development of Early Warning Systems– Development of An Action Plan with Concrete and Reasonable Goals and Measures – Rolling Out Your Initiative– Parent Engagement Implementation of Action Plan– Community Partnerships– Implementation Efforts (Assess, Evaluate, Maintain, Celebrate)– Acquisition and Allocation of Adequate Resources (New & Existing)– Sustainability and Scaling-Up & Celebrating Successes!
34

Achieving student success requires breakthrough thinking.
However, knowledge alone does not translate into action.
35

“We will never be able to turn the tide on the graduation crisis in this country if we don’t take the time to engage young people and their counsel as part of the solution.”America’s Promise Alliance 2010
36


BIE Dropout Prevention Committee:•Gloria Yepa, BIE DPA•Dr. Marilyn Johnson, BIE DPA•Sally Hollow Horn, BIE DPA•Sue Bement, BIE DPA•Dr. Jeff Hamley, BIE, DPA•Roxanne Brown, ADD East•Casey Sovo, ELO, NM South•Dr. Susan Faircloth, Pennsylvania State Univ.•Dr. Sandra Covington Smith, Clemson University, NDPC-SD
38

ResourcesBIE schools’ fundamental mission and purpose-- increase the graduation rate of all students.
The NDPC-SD will provide training and technical assistance on development and implementation of strategies to schools (n=10) selected to participate in the 1st cohort. Training and technical assistance will support existing efforts to ensure that students realize outcome of high school graduation.
39
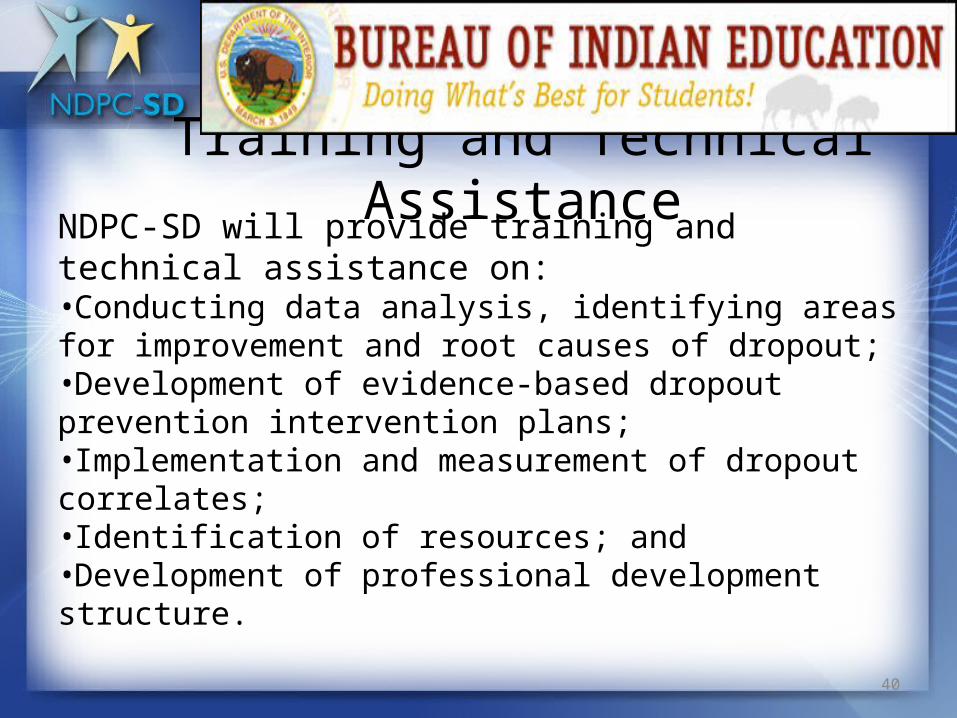
Training and Technical AssistanceNDPC-SD will provide training and technical assistance on:•Conducting data analysis, identifying areas for improvement and root causes of dropout; •Development of evidence-based dropout prevention intervention plans;•Implementation and measurement of dropout correlates; •Identification of resources; and •Development of professional development structure.
40
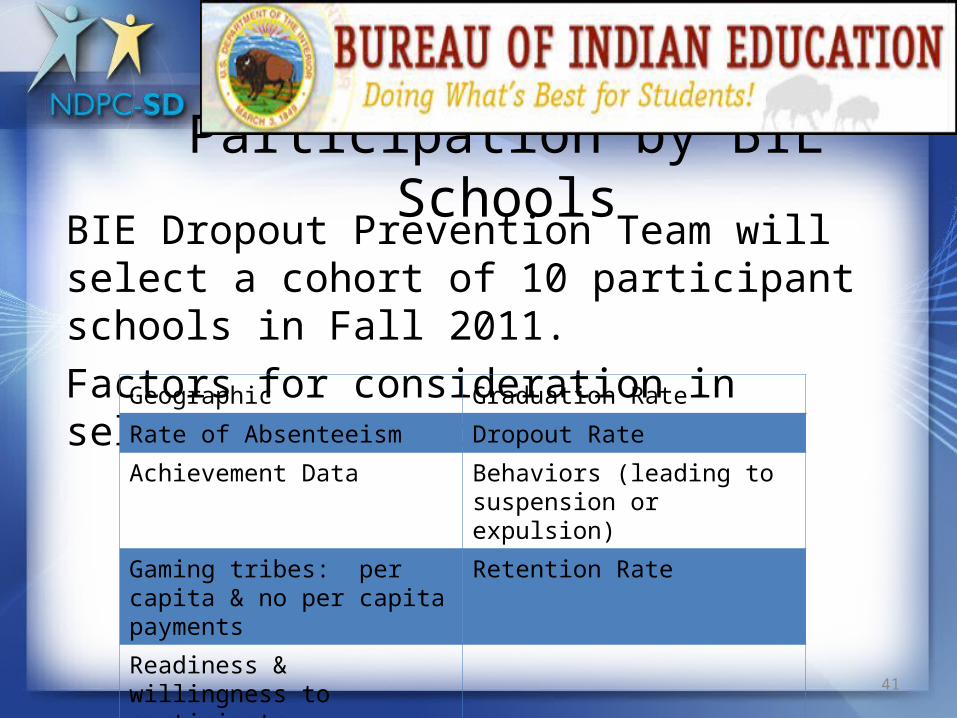
Participation by BIE SchoolsBIE Dropout Prevention Team will select a cohort of 10 participant schools in Fall 2011. Factors for consideration in selection of schools:
41
Geographic Graduation Rate
Rate of Absenteeism Dropout Rate
Achievement Data Behaviors (leading to suspension or expulsion)
Gaming tribes: per capita & no per capita payments
Retention Rate
Readiness & willingness to participate.

Data Collection-Event CodesData on events (behaviors) is collected through the NASIS database. Some schools have established event codes for their use. In order to standardize identification of events, a glossary is being developed for use by the schools.
42

Event Category: AttendanceEvents in the category related to Attendance: •Attendance, Attendance policy violation, Attendance violation, AWOL, AWOL (run away), AWOL over 3 hours, AWOL under 3 hours, Cutting class, skip class, truancy, walking out of class, leaving class without permission, etc.•Total Attendance events SY10-11 = 13,936
43

Schedule of ActivityDate Activity
Sept 2011 Meet w/ prospective schools at Special Education Academy (Tampa, FL).
Oct 2011 Selection of schools for participation
Nov 2011 Begin Training of school staff
44
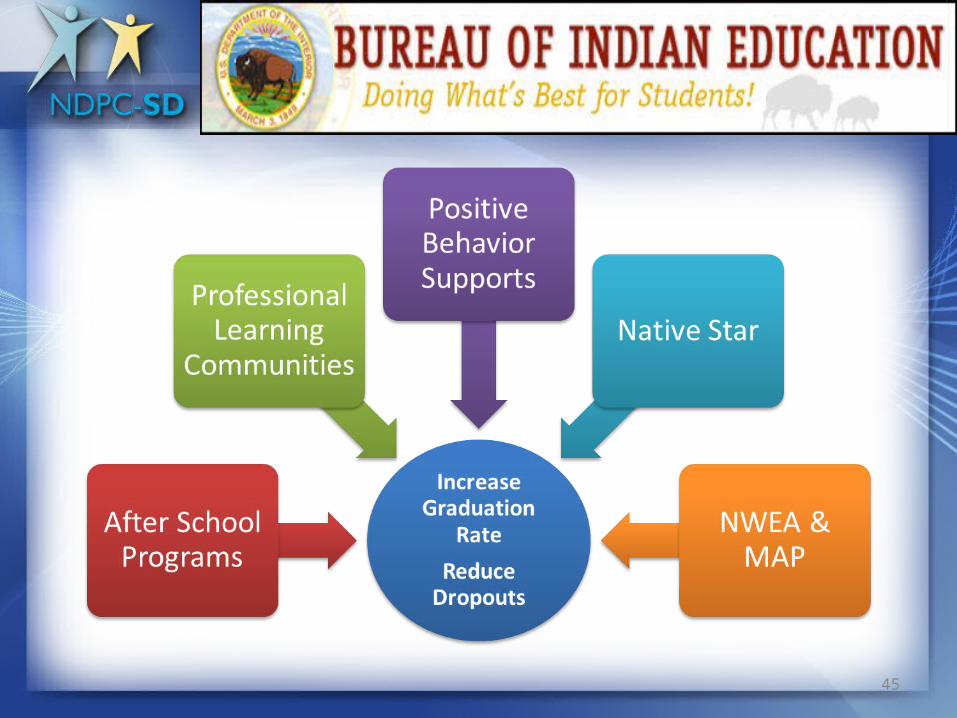
Increase Graduation Rate
45

CONTACT INFORMATION:
Dr. Sandra Covington SmithCoordinator of Technical Assistance and Training
Clemson University209 Martin Street
Clemson, SC 29640864-656-1817
www.ndpc-sd.org
46
© 2011 Clemson University – All rights reserved