Embed Size (px)
Citation preview
INTERNATIONAL ECONOMIC REVIEWVol. 50, No. 2, May 2009
BIDDING TO GIVE: AN EXPERIMENTAL COMPARISONOF AUCTIONS FOR CHARITY∗
BY ARTHUR J.H.C. SCHRAM AND SANDER ONDERSTAL1
University of Amsterdam, The Netherlands
We experimentally compare three mechanisms used to raise money for chari-ties: first-price winner-pay auctions, first-price all-pay auctions, and lotteries. Westay close to the characteristics of most charity auctions by using an environ-ment with incomplete information and independent private values. Our resultssupport theoretical predictions by showing that the all-pay format raises substan-tially higher revenue than the other mechanisms.
1. INTRODUCTION
What do Eric Clapton’s guitar, Margaret Thatcher’s handbag, and BritneySpears’ pregnancy test kit have in common? The answer: All were auctioned forthe benefit of charity. Indeed, auctions are often used as a means to raise moneyfor charities.2 They are not the only method, however. Charities also organizelotteries and voluntary contributions to raise money. This co-existence of variousmechanisms gives rise to the obvious question of their relative performance. Inthis article, we use a laboratory experiment to answer this question.3
When the proceeds of an auction are donated to a charity, bidders may careabout how much money is raised. Compared to the case where auctions or lotteriesare only used as mechanisms to allocate private goods, cases where the proceedsmatter to the bidders will affect the way in which they evaluate the outcome and theway they bid. Moreover, if the revenue constitutes a public good, the criteria usedto evaluate mechanisms may be different from those used in the standard case.Whereas efficiency is a prime concern of a vast majority of the auction literature,
∗ Manuscript received August 2007; revised January 2008.1 The authors thank the editor of this journal, Charles Yuji Horioka, and two anonymous reviewers
for suggestions that significantly improved the manuscript. We would also like to thank Jacob Goereefor substantial contributions at the early stages of this project and participants at the ESA 2006conference in Nottingham for useful suggestions. Financial support from the Dutch National ScienceFoundation (NWO-VICI 453-03-606) is gratefully acknowledged. Please address correspondence to:Arthur Schram, CREED, Amsterdam School of Economics, Roetersstraat 11, 1018 WB Amsterdam,the Netherlands. E-mail: [email protected].
2 Charity auctions are not only used for selling expensive collector’s items like the ones above. eBay,for instance, daily offers thousands of less valuable items for sale of which the revenue is partly orentirely donated to charity.
3 Alternatively, one could study this question in field experiments. As argued by Levitt and List(2006), however, the laboratory is the preferred environment to start investigations on this type ofmechanism selection. We will return to this point in the conclusions.
431C© (2009) by the Economics Department of the University of Pennsylvania and the Osaka UniversityInstitute of Social and Economic Research Association
432 SCHRAM AND ONDERSTAL
mechanisms where the proceeds are dedicated to a charity are typically evaluatedbased on the revenue they generate.4
We consider the case where a single unit of a good is allocated by way of auctionor lottery. The proceeds (revenue) are donated to a charity. Our focus is on the casewhere all participants care about the charity. Ceteris paribus, they attribute higherutility to higher revenue. Moreover, each individual attributes value to the goodbeing offered. In this respect, note a second characteristic that the three collector’sitems mentioned above have in common: the value attributed to them may varysignificantly across individuals. This is typically the case for charity auctions. Inour analysis, we therefore assume that individuals attribute independent privatevalues to the good.
Many theoretical results have been obtained for both private and commonvalue settings where bidders positively value the proceeds. First of all, auctionsand lotteries dominate voluntary contribution mechanisms (Morgan, 2000; Langeet al., 2007; Orzen, 2005). The reason lies in the negative externality that occurswhen a person bids [buys lottery tickets]: This decreases the chances of otherswinning the auction [lottery]. This negative externality mitigates the free-ridingincentive compared to voluntary contributions.
Second, the equilibrium bidding strategies for first-price and second-pricewinner-pay auctions unbalance the traditional revenue equivalence result(Vickrey, 1961; Myerson, 1981), with higher prices expected in the second-priceauction (Goeree et al., 2005, henceforth GMOT; Engelbrecht-Wiggans, 1994;Engers and McManus, 2007; Maasland and Onderstal, 2007).
Third, the first-price all-pay auction dominates the first-price winner-pay auc-tion (Engers and McManus, 2007; GMOT) and the lottery (GMOT; Orzen, 2005;Faravelli, 2007), as well as the second-price winner-pay auction if the number ofbidders is sufficiently large (Engers and McManus, 2007; GMOT). The underly-ing intuition why the all-pay auction performs better than the winner-pay auctionsis based on the opportunity costs of raising one’s bid in the latter: Topping an-other bid implies elimination of the benefit from its contribution to the revenue,in contrast to the all-pay auction. Moreover, a lottery’s inefficiency (the partici-pant with the highest value may not win the object) will lead to less aggressivebidding and lower revenues than in an efficient mechanism (GMOT). A priori,auctions may provide a more efficient allocation and may therefore be expected toraise more money.5 Indeed, this turns out to be the case for the first-price all-payauction. The optimal fundraising mechanism also has an “all-pay” element: It isthe lowest-price all-pay auction with entry fee and reserve price (GMOT). If anentry fee is not possible and sellers are committed to sell, the lowest-price all-payauction is revenue maximizing (GMOT; Orzen, 2005).
4 Cramton et al. (1987) study the efficiency effects of dividing an auction revenue (not necessarilyequally) among bidders. They show that an efficient allocation is usually not possible with unequaldivision.
5 Moreover, in some auctions, losing bidders have an incentive and a possibility to drive up theprice to be paid by the winner (e.g., Cramton et al., 1987; Graham and Marshall, 1987; McAfee andMcMillan, 1992; Singh, 1998; Bulow et al., 1999; Maasland and Onderstal, 2007).
AUCTIONS FOR CHARITY 433
Several experimental and field studies have been undertaken to test these the-ories. Most of these empirical studies focus on situations in which the value of theprize is the same for all bidders, i.e., the common value scenario. In line with thetheory, these studies find that voluntary contributions generate less money thanlotteries and auctions (Morgan and Sefton, 2000, Lange et al., 2007, and Orzen,2005, provide evidence from the laboratory, Landry et al., 2007, use field data),6
and that the lowest-price all-pay auction raises more money than lotteries and thefirst-price all-pay auction (Orzen, 2005). However, the lottery (weakly) dominatesthe first-price all-pay auction in laboratory studies, in contrast to what the theorypredicts (Orzen, 2005; Corazzini et al., 2007).
Fundraising mechanisms with private values have hardly been examined empir-ically. Two notable exceptions are Davis et al. (2006) and Carpenter et al. (2008).7
Davis et al. observe in a laboratory experiment that lotteries raise more moneythan the English auction. In contrast to our setting, they employ a perfect infor-mation environment where each bidder is completely informed about how muchother bidders value the object for sale. This is unlikely to hold true for most char-ity auctions in the field, however. Carpenter et al. conducted a field experimentduring fundraising festivals organized by preschools in Addison County. Theirdata suggest that the first-price auction dominates both the second-price and all-pay auction. As a potential explanation for why their findings deviate from thetheory, the authors argue that bidders were unfamiliar with the rules of the second-price and all-pay auction, so that many were reluctant even to participate in theseauctions.8
All in all, we believe our study to be the first to empirically compare fundrais-ing mechanisms in a controlled environment with private values and imperfectinformation. We think that this environment best describes the situation for mostcharity auctions, including the three mentioned in our opening sentence.
We begin in Section 2 by describing our experimental design and construct-ing hypotheses on the basis of our private values model. Our theoretical resultsclosely resemble the findings from the literature in that the all-pay auction dom-inates both the winner-pay auction and the lottery if bidders positively value theproceeds. Moreover, all mechanisms are predicted to generate more money withthan without the charity. In addition, without a charity, the two auctions are rev-enue equivalent and raise more revenue than the lottery.
We present our experimental findings in Section 3. These findings confirm thepredictions from our theory about the relative performance of mechanisms usedto raise money. Of our other predictions, only two are not supported: (1) Withoutcharity, the first-price winner-pay auction does not dominate the lottery and (2) the
6 There is a vast experimental literature on voluntary contributions to public goods. For surveys,see Ledyard (1995) and Zelmer (2003). The bottom line in this research is that free-riding, though notcomplete, does cause inefficiency in the provision of the good.
7 Another is Isaac and Schnier (2005), who mainly focus on bidding behavior in ‘‘silent auctions,’’jump bidding in particular. They do not compare mechanisms in terms of their revenue generatingproperties.
8 In our experiment, subjects could stay out of the auction by bidding zero. We will show below thatthis occurred much more often in the all-pay auction than in the other formats.
434 SCHRAM AND ONDERSTAL
first-price winner-pay auction and the lottery do not raise more money with thanwithout the charity. One reason for the latter observation is that in all mechanisms,subjects systematically overbid relative to the Nash prediction in the case withoutcharity.
2. EXPERIMENTAL DESIGN AND HYPOTHESES
2.1. Procedures and Parameters. We ran the experiments at the Center forExperimental Economics and Political Decision Making (CREED) of the Univer-sity of Amsterdam in the fall of 2002 and in October 2007. Two hundred and ninetystudents from the undergraduate population of the University were recruited bypublic announcement and participated in 12 original sessions and 6 additionalsessions. On top of a show-up fee of €5, subjects earned on average €24.46 inthe original sessions and €20.20 in the additional sessions. Each session lasted be-tween 60 and 90 minutes. An example of the experimental instructions is given inSection A of the Appendix.
In each of 28 rounds of a session, groups of three subjects are formed.9 Membersof a group compete in an auction or lottery for a private good. Values and earningsare given in experimental ‘‘francs,’’ with an exchange rate of €1 = 300 francs. As iscommon in auction experiments, subjects were given a starting capital (1500 francsin our case). In every round, subject i’s value vi for the good is independently drawnfrom a uniform distribution on [0, 500].10 We reallocate subjects to groups in everyround. Unknown to subjects, we do so within sets of 6 subjects (two groups). These‘‘matching groups’’ constitute statistically independent units of observation.
A positively valued charity is introduced by making the revenue a public goodfor the participants. Each subject is paid a fractionα of the revenue of the auction orlottery she participates in, irrespective of her bid or value. In all original sessions,α = 0.5,11 i.e., every subject earns €0.50 for every €1 her group contributes torevenue.12 We benchmark these ‘‘charity’’ results in a within-subject design byincluding rounds where the revenue does not affect payoffs (α = 0). To do so, we
9 This is where the original experiments differed from the sessions in 2007. Following suggestionsby an anonymous reviewer we added sessions where the number of bidders per group was higher. Inwhat follows we will focus on the original sessions. After discussing the results we will describe theadditional sessions and their results in Section 3.4. At this stage it is important to note that, theoretically,the all-pay auction dominates the winner-pay auction (Engers and McManus, 2007) and the lottery(GMOT), independently of the number of bidders.
10 In theory, subjects could make a loss. They were told that their earnings would be set to zero andthat the computer would take over their decision if this occurred but that they would have to remainseated. Other group members would be informed. This never happened, however: All subjects hadpositive earnings throughout the experiment.
11 As will be explained below, we chose α = 0.3 for the additional sessions.12 Note the resemblance to a linear public good game with a marginal per capita return equal to 0.5
(Isaac et al., 1984). An important difference is the private value that a player can obtain by winningthe auction. There are, of course, other ways to model the fact that the auction revenue mattersto the bidders. We chose this “public good scenario” for two main reasons: (1) It mirrors the setup ofthe theories we are testing and (2) it allows us to capture the “public good” characteristic of charitydonations in a way that has a long tradition in experimental economics.
AUCTIONS FOR CHARITY 435
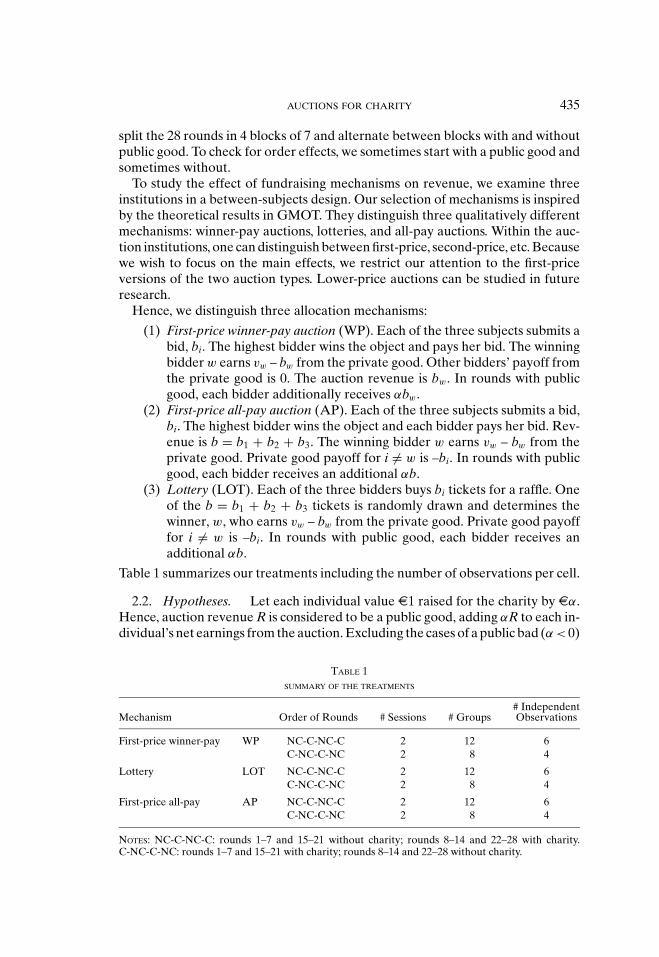
split the 28 rounds in 4 blocks of 7 and alternate between blocks with and withoutpublic good. To check for order effects, we sometimes start with a public good andsometimes without.
To study the effect of fundraising mechanisms on revenue, we examine threeinstitutions in a between-subjects design. Our selection of mechanisms is inspiredby the theoretical results in GMOT. They distinguish three qualitatively differentmechanisms: winner-pay auctions, lotteries, and all-pay auctions. Within the auc-tion institutions, one can distinguish between first-price, second-price, etc. Becausewe wish to focus on the main effects, we restrict our attention to the first-priceversions of the two auction types. Lower-price auctions can be studied in futureresearch.
Hence, we distinguish three allocation mechanisms:
(1) First-price winner-pay auction (WP). Each of the three subjects submits abid, bi. The highest bidder wins the object and pays her bid. The winningbidder w earns vw – bw from the private good. Other bidders’ payoff fromthe private good is 0. The auction revenue is bw. In rounds with publicgood, each bidder additionally receives αbw.
(2) First-price all-pay auction (AP). Each of the three subjects submits a bid,bi. The highest bidder wins the object and each bidder pays her bid. Rev-enue is b = b1 + b2 + b3. The winning bidder w earns vw – bw from theprivate good. Private good payoff for i �= w is –bi. In rounds with publicgood, each bidder receives an additional αb.
(3) Lottery (LOT). Each of the three bidders buys bi tickets for a raffle. Oneof the b = b1 + b2 + b3 tickets is randomly drawn and determines thewinner, w, who earns vw – bw from the private good. Private good payofffor i �= w is –bi. In rounds with public good, each bidder receives anadditional αb.
Table 1 summarizes our treatments including the number of observations per cell.
2.2. Hypotheses. Let each individual value €1 raised for the charity by €α.Hence, auction revenue R is considered to be a public good, adding αR to each in-dividual’s net earnings from the auction. Excluding the cases of a public bad (α < 0)
TABLE 1SUMMARY OF THE TREATMENTS
# IndependentMechanism Order of Rounds # Sessions # Groups Observations
First-price winner-pay WP NC-C-NC-C 2 12 6C-NC-C-NC 2 8 4
Lottery LOT NC-C-NC-C 2 12 6C-NC-C-NC 2 8 4
First-price all-pay AP NC-C-NC-C 2 12 6C-NC-C-NC 2 8 4
NOTES: NC-C-NC-C: rounds 1–7 and 15–21 without charity; rounds 8–14 and 22–28 with charity.C-NC-C-NC: rounds 1–7 and 15–21 with charity; rounds 8–14 and 22–28 without charity.
436 SCHRAM AND ONDERSTAL
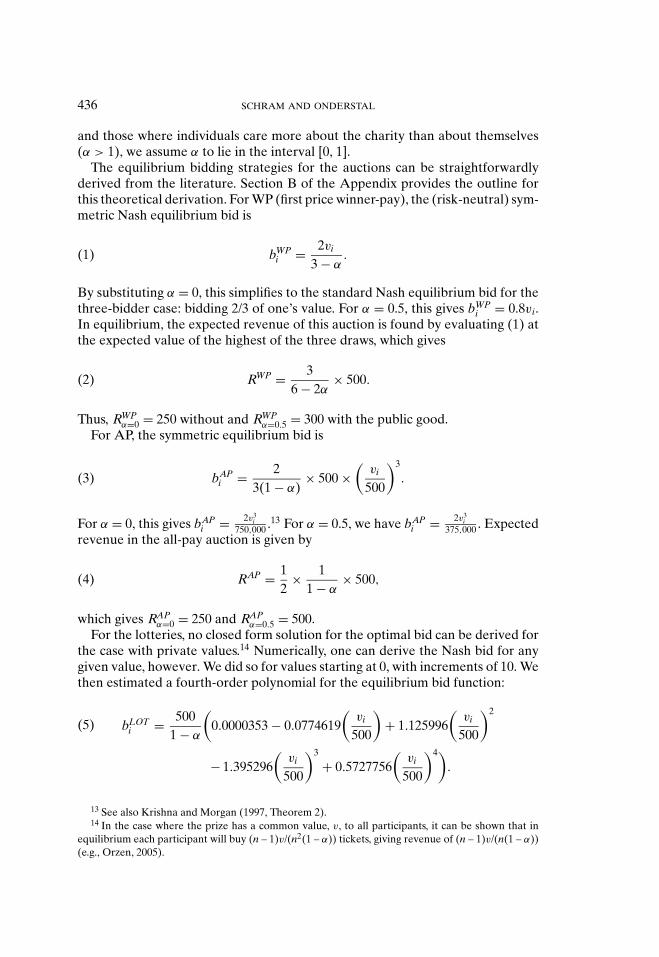
and those where individuals care more about the charity than about themselves(α > 1), we assume α to lie in the interval [0, 1].
The equilibrium bidding strategies for the auctions can be straightforwardlyderived from the literature. Section B of the Appendix provides the outline forthis theoretical derivation. For WP (first price winner-pay), the (risk-neutral) sym-metric Nash equilibrium bid is
bWPi = 2vi
3 − α.(1)
By substituting α = 0, this simplifies to the standard Nash equilibrium bid for thethree-bidder case: bidding 2/3 of one’s value. For α = 0.5, this gives bWP
i = 0.8vi.In equilibrium, the expected revenue of this auction is found by evaluating (1) atthe expected value of the highest of the three draws, which gives
RWP = 36 − 2α
× 500.(2)
Thus, RWPα=0 = 250 without and RWP
α=0.5 = 300 with the public good.For AP, the symmetric equilibrium bid is
bAPi = 2
3(1 − α)× 500 ×
(vi
500
)3
.(3)
For α = 0, this gives bAPi = 2v3
i750,000 .13 For α = 0.5, we have bAP
i = 2v3i
375,000 . Expectedrevenue in the all-pay auction is given by
RAP = 12
× 11 − α
× 500,(4)
which gives RAPα=0 = 250 and RAP
α=0.5 = 500.For the lotteries, no closed form solution for the optimal bid can be derived for
the case with private values.14 Numerically, one can derive the Nash bid for anygiven value, however. We did so for values starting at 0, with increments of 10. Wethen estimated a fourth-order polynomial for the equilibrium bid function:
bLOTi = 500
1 − α
(0.0000353 − 0.0774619
(vi
500
)+ 1.125996
(vi
500
)2
− 1.395296(
vi
500
)3
+ 0.5727756(
vi
500
)4).
(5)
13 See also Krishna and Morgan (1997, Theorem 2).14 In the case where the prize has a common value, v, to all participants, it can be shown that in
equilibrium each participant will buy (n – 1)v/(n2(1 – α)) tickets, giving revenue of (n – 1)v/(n(1 – α))(e.g., Orzen, 2005).
AUCTIONS FOR CHARITY 437
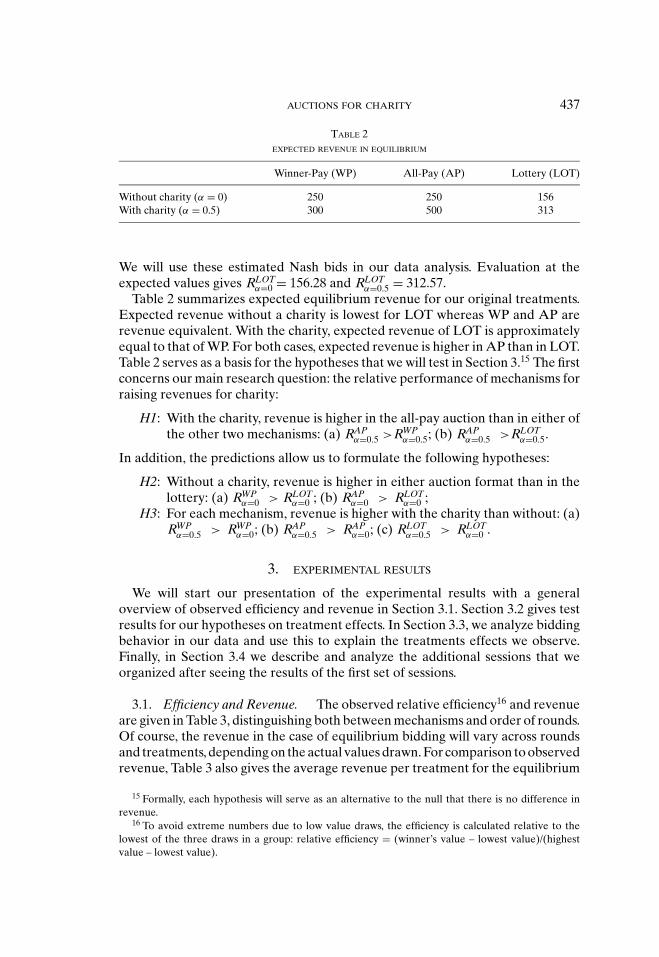
TABLE 2EXPECTED REVENUE IN EQUILIBRIUM
Winner-Pay (WP) All-Pay (AP) Lottery (LOT)
Without charity (α = 0) 250 250 156With charity (α = 0.5) 300 500 313
We will use these estimated Nash bids in our data analysis. Evaluation at theexpected values gives RLOT
α=0 = 156.28 and RLOTα=0.5 = 312.57.
Table 2 summarizes expected equilibrium revenue for our original treatments.Expected revenue without a charity is lowest for LOT whereas WP and AP arerevenue equivalent. With the charity, expected revenue of LOT is approximatelyequal to that of WP. For both cases, expected revenue is higher in AP than in LOT.Table 2 serves as a basis for the hypotheses that we will test in Section 3.15 The firstconcerns our main research question: the relative performance of mechanisms forraising revenues for charity:
H1: With the charity, revenue is higher in the all-pay auction than in either ofthe other two mechanisms: (a) RAP
α=0.5 >RWPα=0.5; (b) RAP
α=0.5 >RLOTα=0.5.
In addition, the predictions allow us to formulate the following hypotheses:
H2: Without a charity, revenue is higher in either auction format than in thelottery: (a) RWP
α=0 > RLOTα=0 ; (b) RAP
α=0 > RLOTα=0 ;
H3: For each mechanism, revenue is higher with the charity than without: (a)RWP
α=0.5 > RWPα=0; (b) RAP
α=0.5 > RAPα=0; (c) RLOT
α=0.5 > RLOTα=0 .
3. EXPERIMENTAL RESULTS
We will start our presentation of the experimental results with a generaloverview of observed efficiency and revenue in Section 3.1. Section 3.2 gives testresults for our hypotheses on treatment effects. In Section 3.3, we analyze biddingbehavior in our data and use this to explain the treatments effects we observe.Finally, in Section 3.4 we describe and analyze the additional sessions that weorganized after seeing the results of the first set of sessions.
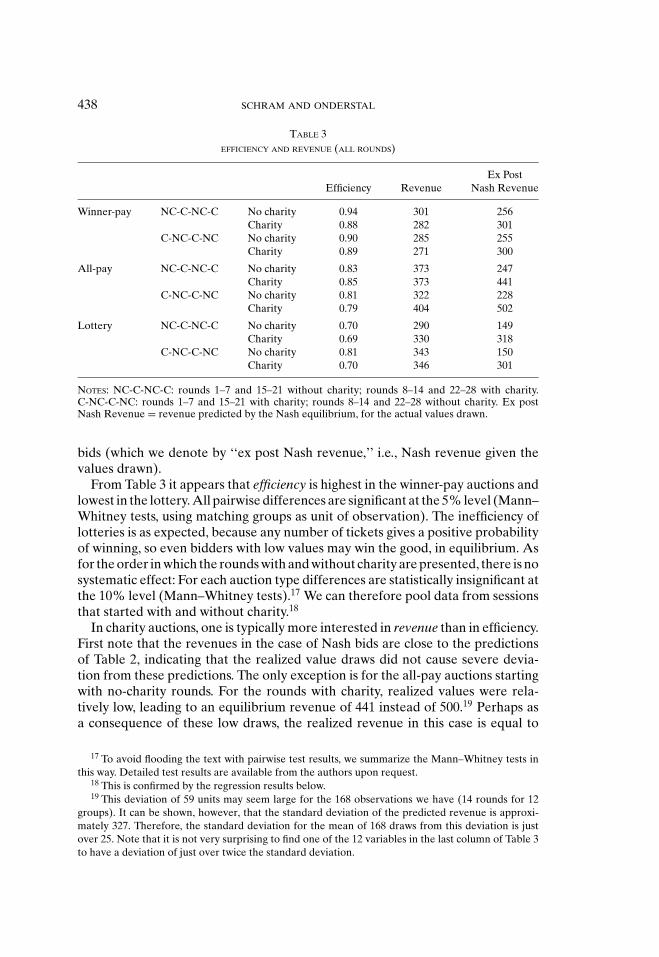
3.1. Efficiency and Revenue. The observed relative efficiency16 and revenueare given in Table 3, distinguishing both between mechanisms and order of rounds.Of course, the revenue in the case of equilibrium bidding will vary across roundsand treatments, depending on the actual values drawn. For comparison to observedrevenue, Table 3 also gives the average revenue per treatment for the equilibrium
15 Formally, each hypothesis will serve as an alternative to the null that there is no difference inrevenue.
16 To avoid extreme numbers due to low value draws, the efficiency is calculated relative to thelowest of the three draws in a group: relative efficiency = (winner’s value – lowest value)/(highestvalue – lowest value).
438 SCHRAM AND ONDERSTAL
TABLE 3EFFICIENCY AND REVENUE (ALL ROUNDS)
Ex PostEfficiency Revenue Nash Revenue
Winner-pay NC-C-NC-C No charity 0.94 301 256Charity 0.88 282 301
C-NC-C-NC No charity 0.90 285 255Charity 0.89 271 300
All-pay NC-C-NC-C No charity 0.83 373 247Charity 0.85 373 441
C-NC-C-NC No charity 0.81 322 228Charity 0.79 404 502
Lottery NC-C-NC-C No charity 0.70 290 149Charity 0.69 330 318
C-NC-C-NC No charity 0.81 343 150Charity 0.70 346 301
NOTES: NC-C-NC-C: rounds 1–7 and 15–21 without charity; rounds 8–14 and 22–28 with charity.C-NC-C-NC: rounds 1–7 and 15–21 with charity; rounds 8–14 and 22–28 without charity. Ex postNash Revenue = revenue predicted by the Nash equilibrium, for the actual values drawn.
bids (which we denote by ‘‘ex post Nash revenue,’’ i.e., Nash revenue given thevalues drawn).
From Table 3 it appears that efficiency is highest in the winner-pay auctions andlowest in the lottery. All pairwise differences are significant at the 5% level (Mann–Whitney tests, using matching groups as unit of observation). The inefficiency oflotteries is as expected, because any number of tickets gives a positive probabilityof winning, so even bidders with low values may win the good, in equilibrium. Asfor the order in which the rounds with and without charity are presented, there is nosystematic effect: For each auction type differences are statistically insignificant atthe 10% level (Mann–Whitney tests).17 We can therefore pool data from sessionsthat started with and without charity.18
In charity auctions, one is typically more interested in revenue than in efficiency.First note that the revenues in the case of Nash bids are close to the predictionsof Table 2, indicating that the realized value draws did not cause severe devia-tion from these predictions. The only exception is for the all-pay auctions startingwith no-charity rounds. For the rounds with charity, realized values were rela-tively low, leading to an equilibrium revenue of 441 instead of 500.19 Perhaps asa consequence of these low draws, the realized revenue in this case is equal to
17 To avoid flooding the text with pairwise test results, we summarize the Mann–Whitney tests inthis way. Detailed test results are available from the authors upon request.
18 This is confirmed by the regression results below.19 This deviation of 59 units may seem large for the 168 observations we have (14 rounds for 12
groups). It can be shown, however, that the standard deviation of the predicted revenue is approxi-mately 327. Therefore, the standard deviation for the mean of 168 draws from this deviation is justover 25. Note that it is not very surprising to find one of the 12 variables in the last column of Table 3to have a deviation of just over twice the standard deviation.
AUCTIONS FOR CHARITY 439
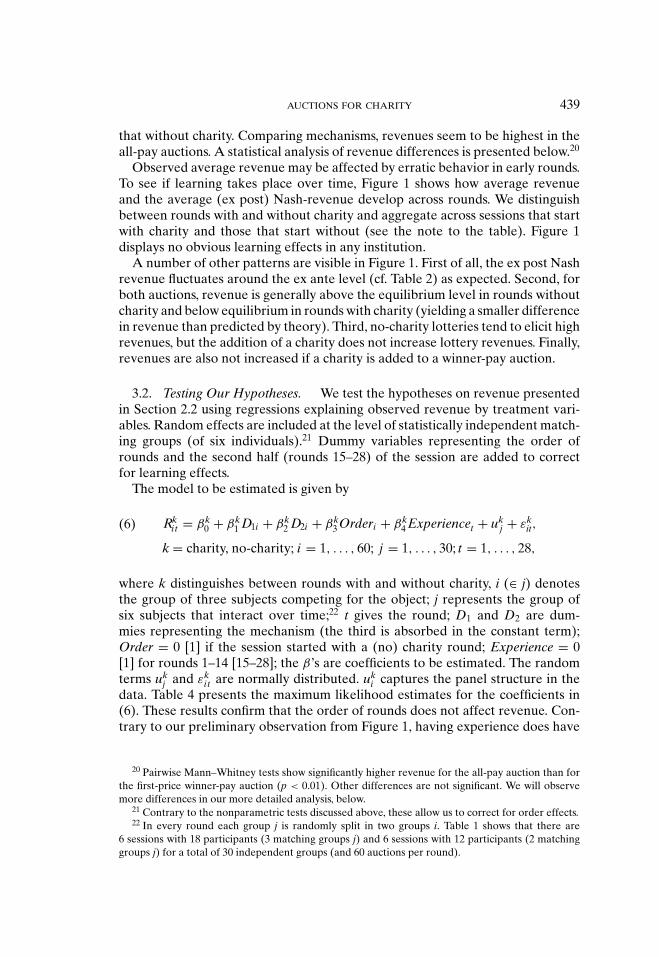
that without charity. Comparing mechanisms, revenues seem to be highest in theall-pay auctions. A statistical analysis of revenue differences is presented below.20
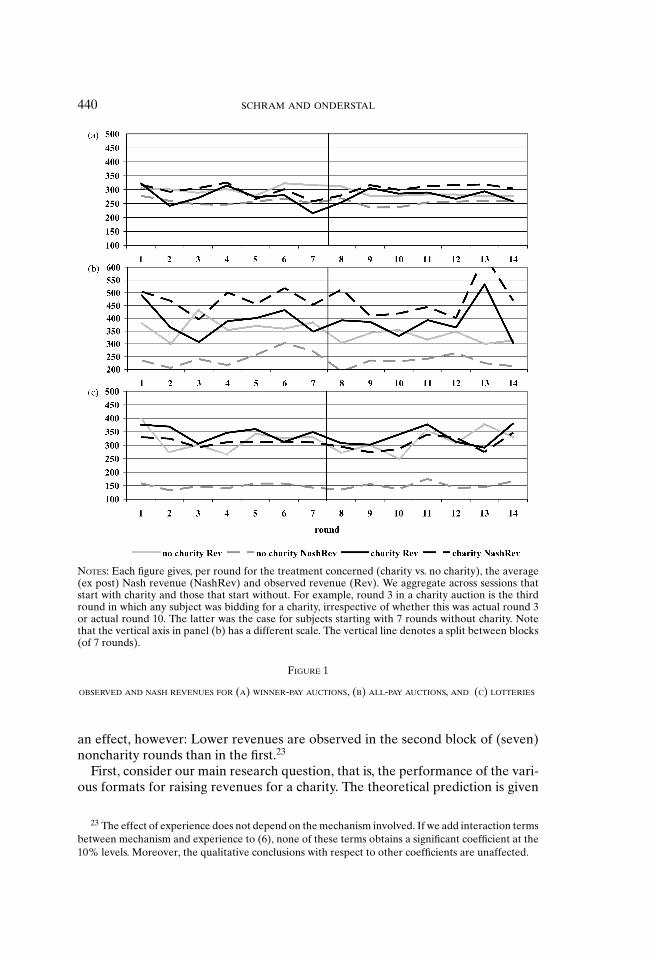
Observed average revenue may be affected by erratic behavior in early rounds.To see if learning takes place over time, Figure 1 shows how average revenueand the average (ex post) Nash-revenue develop across rounds. We distinguishbetween rounds with and without charity and aggregate across sessions that startwith charity and those that start without (see the note to the table). Figure 1displays no obvious learning effects in any institution.
A number of other patterns are visible in Figure 1. First of all, the ex post Nashrevenue fluctuates around the ex ante level (cf. Table 2) as expected. Second, forboth auctions, revenue is generally above the equilibrium level in rounds withoutcharity and below equilibrium in rounds with charity (yielding a smaller differencein revenue than predicted by theory). Third, no-charity lotteries tend to elicit highrevenues, but the addition of a charity does not increase lottery revenues. Finally,revenues are also not increased if a charity is added to a winner-pay auction.
3.2. Testing Our Hypotheses. We test the hypotheses on revenue presentedin Section 2.2 using regressions explaining observed revenue by treatment vari-ables. Random effects are included at the level of statistically independent match-ing groups (of six individuals).21 Dummy variables representing the order ofrounds and the second half (rounds 15–28) of the session are added to correctfor learning effects.
The model to be estimated is given by
Rkit = βk
0 + βk1 D1i + βk
2 D2i + βk3 Orderi + βk
4 Experiencet + ukj + εk
it,
k = charity, no-charity; i = 1, . . . , 60; j = 1, . . . , 30; t = 1, . . . , 28,
(6)
where k distinguishes between rounds with and without charity, i (∈ j) denotesthe group of three subjects competing for the object; j represents the group ofsix subjects that interact over time;22 t gives the round; D1 and D2 are dum-mies representing the mechanism (the third is absorbed in the constant term);Order = 0 [1] if the session started with a (no) charity round; Experience = 0[1] for rounds 1–14 [15–28]; the β’s are coefficients to be estimated. The randomterms uk
j and εkit are normally distributed. uk
i captures the panel structure in thedata. Table 4 presents the maximum likelihood estimates for the coefficients in(6). These results confirm that the order of rounds does not affect revenue. Con-trary to our preliminary observation from Figure 1, having experience does have
20 Pairwise Mann–Whitney tests show significantly higher revenue for the all-pay auction than forthe first-price winner-pay auction (p < 0.01). Other differences are not significant. We will observemore differences in our more detailed analysis, below.
21 Contrary to the nonparametric tests discussed above, these allow us to correct for order effects.22 In every round each group j is randomly split in two groups i. Table 1 shows that there are
6 sessions with 18 participants (3 matching groups j) and 6 sessions with 12 participants (2 matchinggroups j) for a total of 30 independent groups (and 60 auctions per round).
440 SCHRAM AND ONDERSTAL
NOTES: Each figure gives, per round for the treatment concerned (charity vs. no charity), the average(ex post) Nash revenue (NashRev) and observed revenue (Rev). We aggregate across sessions thatstart with charity and those that start without. For example, round 3 in a charity auction is the thirdround in which any subject was bidding for a charity, irrespective of whether this was actual round 3or actual round 10. The latter was the case for subjects starting with 7 rounds without charity. Notethat the vertical axis in panel (b) has a different scale. The vertical line denotes a split between blocks(of 7 rounds).
FIGURE 1
OBSERVED AND NASH REVENUES FOR (A) WINNER-PAY AUCTIONS, (B) ALL-PAY AUCTIONS, AND (C) LOTTERIES
an effect, however: Lower revenues are observed in the second block of (seven)noncharity rounds than in the first.23
First, consider our main research question, that is, the performance of the vari-ous formats for raising revenues for a charity. The theoretical prediction is given
23 The effect of experience does not depend on the mechanism involved. If we add interaction termsbetween mechanism and experience to (6), none of these terms obtains a significant coefficient at the10% levels. Moreover, the qualitative conclusions with respect to other coefficients are unaffected.
AUCTIONS FOR CHARITY 441
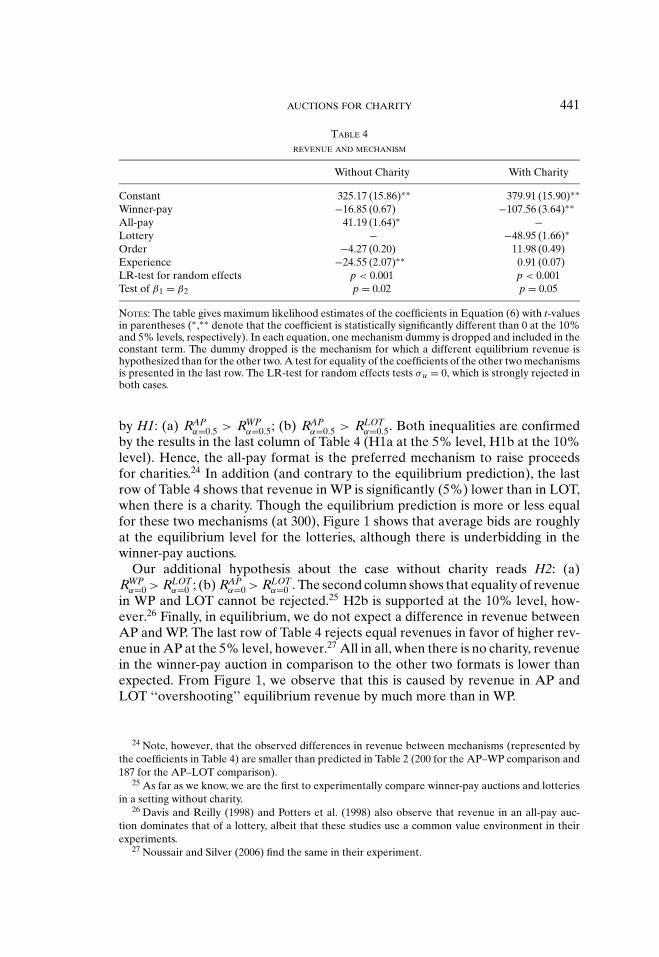
TABLE 4REVENUE AND MECHANISM
Without Charity With Charity
Constant 325.17 (15.86)∗∗ 379.91 (15.90)∗∗Winner-pay −16.85 (0.67) −107.56 (3.64)∗∗All-pay 41.19 (1.64)∗ −Lottery − −48.95 (1.66)∗Order −4.27 (0.20) 11.98 (0.49)Experience −24.55 (2.07)∗∗ 0.91 (0.07)LR-test for random effects p < 0.001 p < 0.001Test of β1 = β2 p = 0.02 p = 0.05
NOTES: The table gives maximum likelihood estimates of the coefficients in Equation (6) with t-valuesin parentheses (∗,∗∗ denote that the coefficient is statistically significantly different than 0 at the 10%and 5% levels, respectively). In each equation, one mechanism dummy is dropped and included in theconstant term. The dummy dropped is the mechanism for which a different equilibrium revenue ishypothesized than for the other two. A test for equality of the coefficients of the other two mechanismsis presented in the last row. The LR-test for random effects tests σ u = 0, which is strongly rejected inboth cases.
by H1: (a) RAPα=0.5 > RWP
α=0.5; (b) RAPα=0.5 > RLOT
α=0.5. Both inequalities are confirmedby the results in the last column of Table 4 (H1a at the 5% level, H1b at the 10%level). Hence, the all-pay format is the preferred mechanism to raise proceedsfor charities.24 In addition (and contrary to the equilibrium prediction), the lastrow of Table 4 shows that revenue in WP is significantly (5%) lower than in LOT,when there is a charity. Though the equilibrium prediction is more or less equalfor these two mechanisms (at 300), Figure 1 shows that average bids are roughlyat the equilibrium level for the lotteries, although there is underbidding in thewinner-pay auctions.
Our additional hypothesis about the case without charity reads H2: (a)RWP
α=0 > RLOTα=0 ; (b) RAP
α=0 > RLOTα=0 . The second column shows that equality of revenue
in WP and LOT cannot be rejected.25 H2b is supported at the 10% level, how-ever.26 Finally, in equilibrium, we do not expect a difference in revenue betweenAP and WP. The last row of Table 4 rejects equal revenues in favor of higher rev-enue in AP at the 5% level, however.27 All in all, when there is no charity, revenuein the winner-pay auction in comparison to the other two formats is lower thanexpected. From Figure 1, we observe that this is caused by revenue in AP andLOT ‘‘overshooting’’ equilibrium revenue by much more than in WP.
24 Note, however, that the observed differences in revenue between mechanisms (represented bythe coefficients in Table 4) are smaller than predicted in Table 2 (200 for the AP–WP comparison and187 for the AP–LOT comparison).
25 As far as we know, we are the first to experimentally compare winner-pay auctions and lotteriesin a setting without charity.
26 Davis and Reilly (1998) and Potters et al. (1998) also observe that revenue in an all-pay auc-tion dominates that of a lottery, albeit that these studies use a common value environment in theirexperiments.
27 Noussair and Silver (2006) find the same in their experiment.
442 SCHRAM AND ONDERSTAL
TABLE 5REVENUE AND CHARITY
WP AP LOT
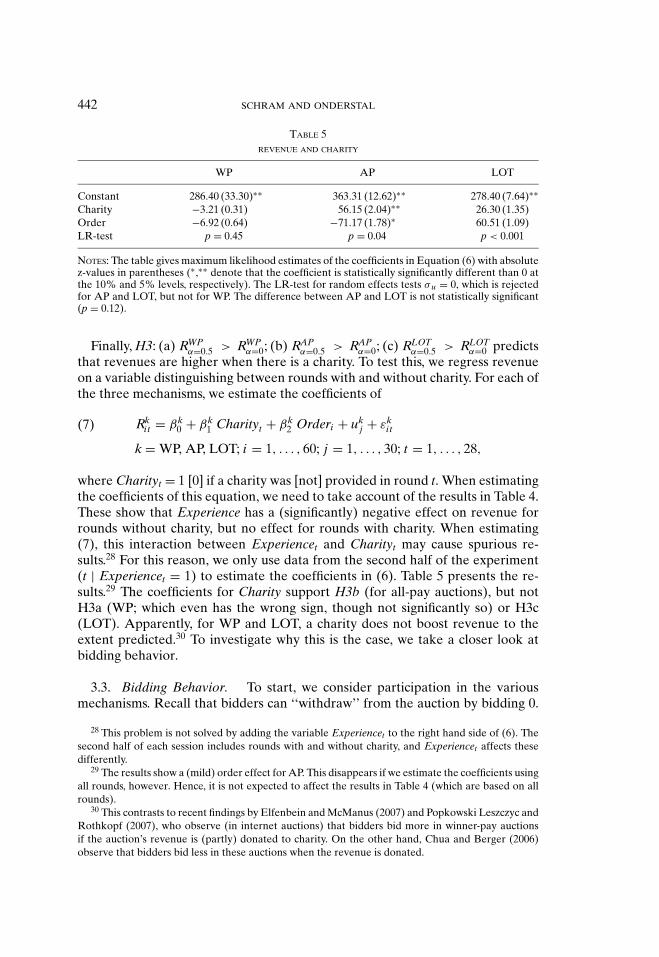
Constant 286.40 (33.30)∗∗ 363.31 (12.62)∗∗ 278.40 (7.64)∗∗Charity −3.21 (0.31) 56.15 (2.04)∗∗ 26.30 (1.35)Order −6.92 (0.64) −71.17 (1.78)∗ 60.51 (1.09)LR-test p = 0.45 p = 0.04 p < 0.001
NOTES: The table gives maximum likelihood estimates of the coefficients in Equation (6) with absolutez-values in parentheses (∗,∗∗ denote that the coefficient is statistically significantly different than 0 atthe 10% and 5% levels, respectively). The LR-test for random effects tests σ u = 0, which is rejectedfor AP and LOT, but not for WP. The difference between AP and LOT is not statistically significant(p = 0.12).
Finally, H3: (a) RWPα=0.5 > RWP
α=0; (b) RAPα=0.5 > RAP
α=0; (c) RLOTα=0.5 > RLOT
α=0 predictsthat revenues are higher when there is a charity. To test this, we regress revenueon a variable distinguishing between rounds with and without charity. For each ofthe three mechanisms, we estimate the coefficients of
Rkit = βk
0 + βk1 Charityt + βk
2 Orderi + ukj + εk
it
k = WP, AP, LOT; i = 1, . . . , 60; j = 1, . . . , 30; t = 1, . . . , 28,
(7)
where Charityt = 1 [0] if a charity was [not] provided in round t. When estimatingthe coefficients of this equation, we need to take account of the results in Table 4.These show that Experience has a (significantly) negative effect on revenue forrounds without charity, but no effect for rounds with charity. When estimating(7), this interaction between Experiencet and Charityt may cause spurious re-sults.28 For this reason, we only use data from the second half of the experiment(t | Experiencet = 1) to estimate the coefficients in (6). Table 5 presents the re-sults.29 The coefficients for Charity support H3b (for all-pay auctions), but notH3a (WP; which even has the wrong sign, though not significantly so) or H3c(LOT). Apparently, for WP and LOT, a charity does not boost revenue to theextent predicted.30 To investigate why this is the case, we take a closer look atbidding behavior.
3.3. Bidding Behavior. To start, we consider participation in the variousmechanisms. Recall that bidders can ‘‘withdraw’’ from the auction by bidding 0.
28 This problem is not solved by adding the variable Experiencet to the right hand side of (6). Thesecond half of each session includes rounds with and without charity, and Experiencet affects thesedifferently.
29 The results show a (mild) order effect for AP. This disappears if we estimate the coefficients usingall rounds, however. Hence, it is not expected to affect the results in Table 4 (which are based on allrounds).
30 This contrasts to recent findings by Elfenbein and McManus (2007) and Popkowski Leszczyc andRothkopf (2007), who observe (in internet auctions) that bidders bid more in winner-pay auctionsif the auction’s revenue is (partly) donated to charity. On the other hand, Chua and Berger (2006)observe that bidders bid less in these auctions when the revenue is donated.
AUCTIONS FOR CHARITY 443
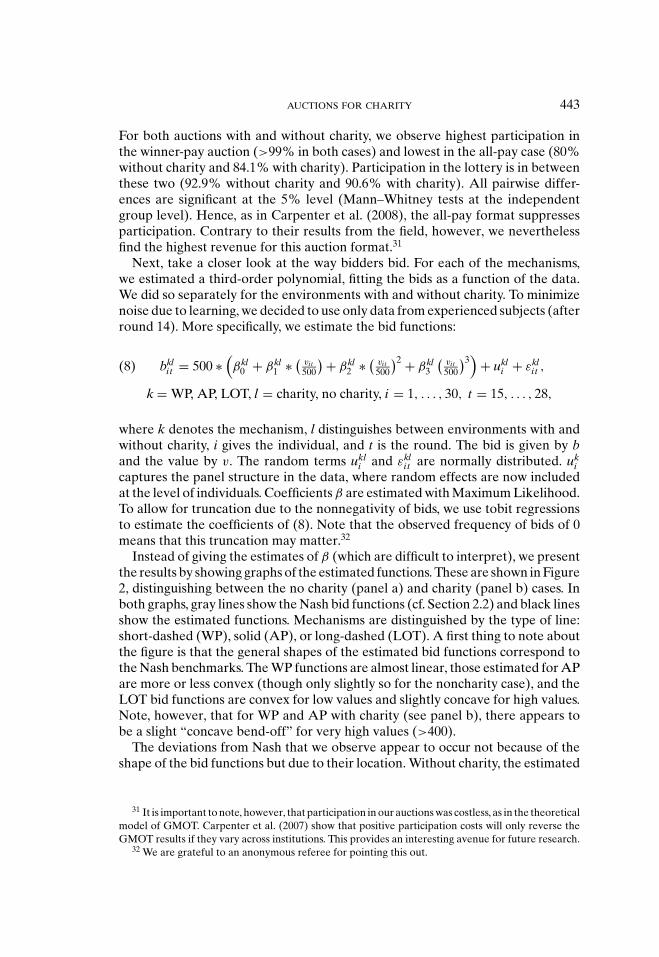
For both auctions with and without charity, we observe highest participation inthe winner-pay auction (>99% in both cases) and lowest in the all-pay case (80%without charity and 84.1% with charity). Participation in the lottery is in betweenthese two (92.9% without charity and 90.6% with charity). All pairwise differ-ences are significant at the 5% level (Mann–Whitney tests at the independentgroup level). Hence, as in Carpenter et al. (2008), the all-pay format suppressesparticipation. Contrary to their results from the field, however, we neverthelessfind the highest revenue for this auction format.31
Next, take a closer look at the way bidders bid. For each of the mechanisms,we estimated a third-order polynomial, fitting the bids as a function of the data.We did so separately for the environments with and without charity. To minimizenoise due to learning, we decided to use only data from experienced subjects (afterround 14). More specifically, we estimate the bid functions:
bklit = 500 ∗
(βkl
0 + βkl1 ∗ (
vi t500
) + βkl2 ∗ (
vi t500
)2 + βkl3
(vi t500
)3)
+ ukli + εkl
i t ,
k = WP, AP, LOT, l = charity, no charity, i = 1, . . . , 30, t = 15, . . . , 28,
(8)
where k denotes the mechanism, l distinguishes between environments with andwithout charity, i gives the individual, and t is the round. The bid is given by band the value by v. The random terms ukl
i and εkli t are normally distributed. uk
icaptures the panel structure in the data, where random effects are now includedat the level of individuals. Coefficients β are estimated with Maximum Likelihood.To allow for truncation due to the nonnegativity of bids, we use tobit regressionsto estimate the coefficients of (8). Note that the observed frequency of bids of 0means that this truncation may matter.32
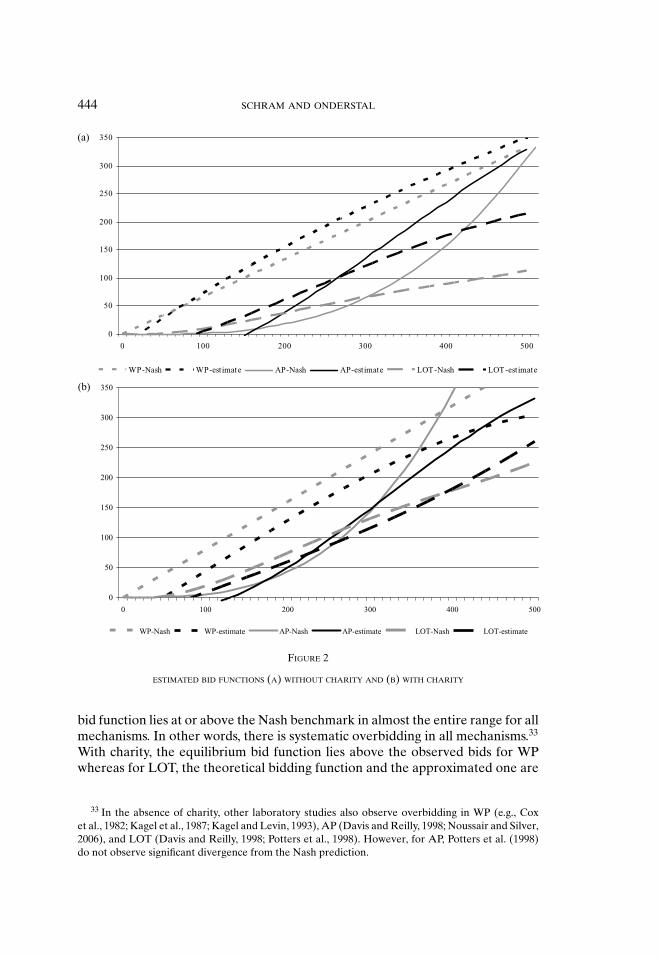
Instead of giving the estimates of β (which are difficult to interpret), we presentthe results by showing graphs of the estimated functions. These are shown in Figure2, distinguishing between the no charity (panel a) and charity (panel b) cases. Inboth graphs, gray lines show the Nash bid functions (cf. Section 2.2) and black linesshow the estimated functions. Mechanisms are distinguished by the type of line:short-dashed (WP), solid (AP), or long-dashed (LOT). A first thing to note aboutthe figure is that the general shapes of the estimated bid functions correspond tothe Nash benchmarks. The WP functions are almost linear, those estimated for APare more or less convex (though only slightly so for the noncharity case), and theLOT bid functions are convex for low values and slightly concave for high values.Note, however, that for WP and AP with charity (see panel b), there appears tobe a slight “concave bend-off” for very high values (>400).
The deviations from Nash that we observe appear to occur not because of theshape of the bid functions but due to their location. Without charity, the estimated
31 It is important to note, however, that participation in our auctions was costless, as in the theoreticalmodel of GMOT. Carpenter et al. (2007) show that positive participation costs will only reverse theGMOT results if they vary across institutions. This provides an interesting avenue for future research.
32 We are grateful to an anonymous referee for pointing this out.
444 SCHRAM AND ONDERSTAL
0
50
100
150
200
250
(a)
300
350
0 100 200 300 400 500
WP-Nash WP-estimate AP-Nash AP-estimate LOT-Nash LOT-estimate
0
50
100
150
200
250
300
350(b)
0 100 200 300 400 500
WP-Nash WP-estimate AP-Nash AP-estimate LOT-Nash LOT-estimate
FIGURE 2
ESTIMATED BID FUNCTIONS (A) WITHOUT CHARITY AND (B) WITH CHARITY
bid function lies at or above the Nash benchmark in almost the entire range for allmechanisms. In other words, there is systematic overbidding in all mechanisms.33
With charity, the equilibrium bid function lies above the observed bids for WPwhereas for LOT, the theoretical bidding function and the approximated one are
33 In the absence of charity, other laboratory studies also observe overbidding in WP (e.g., Coxet al., 1982; Kagel et al., 1987; Kagel and Levin, 1993), AP (Davis and Reilly, 1998; Noussair and Silver,2006), and LOT (Davis and Reilly, 1998; Potters et al., 1998). However, for AP, Potters et al. (1998)do not observe significant divergence from the Nash prediction.
AUCTIONS FOR CHARITY 445
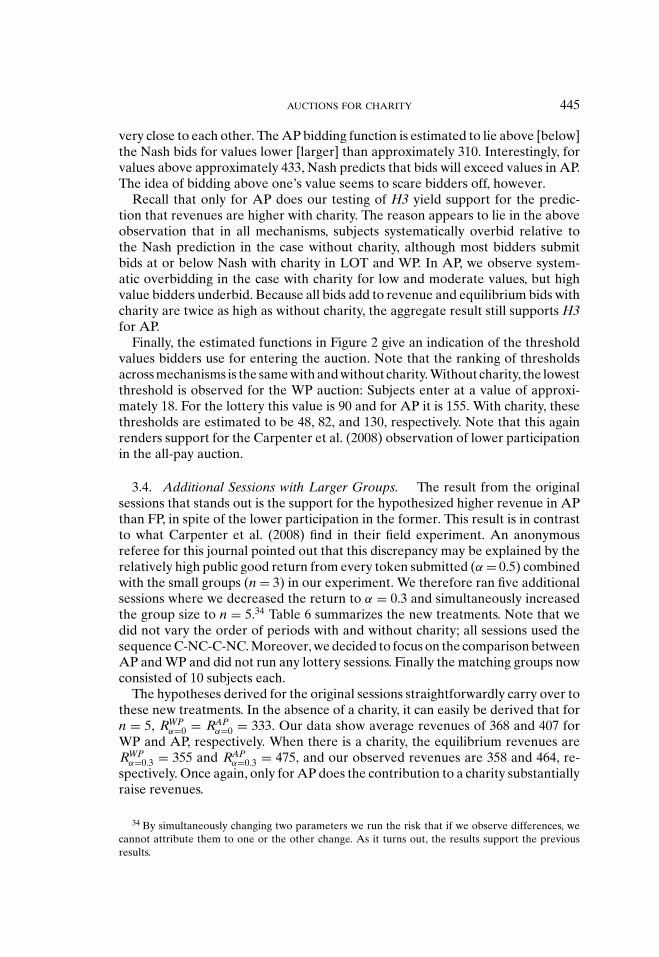
very close to each other. The AP bidding function is estimated to lie above [below]the Nash bids for values lower [larger] than approximately 310. Interestingly, forvalues above approximately 433, Nash predicts that bids will exceed values in AP.The idea of bidding above one’s value seems to scare bidders off, however.
Recall that only for AP does our testing of H3 yield support for the predic-tion that revenues are higher with charity. The reason appears to lie in the aboveobservation that in all mechanisms, subjects systematically overbid relative tothe Nash prediction in the case without charity, although most bidders submitbids at or below Nash with charity in LOT and WP. In AP, we observe system-atic overbidding in the case with charity for low and moderate values, but highvalue bidders underbid. Because all bids add to revenue and equilibrium bids withcharity are twice as high as without charity, the aggregate result still supports H3for AP.
Finally, the estimated functions in Figure 2 give an indication of the thresholdvalues bidders use for entering the auction. Note that the ranking of thresholdsacross mechanisms is the same with and without charity. Without charity, the lowestthreshold is observed for the WP auction: Subjects enter at a value of approxi-mately 18. For the lottery this value is 90 and for AP it is 155. With charity, thesethresholds are estimated to be 48, 82, and 130, respectively. Note that this againrenders support for the Carpenter et al. (2008) observation of lower participationin the all-pay auction.
3.4. Additional Sessions with Larger Groups. The result from the originalsessions that stands out is the support for the hypothesized higher revenue in APthan FP, in spite of the lower participation in the former. This result is in contrastto what Carpenter et al. (2008) find in their field experiment. An anonymousreferee for this journal pointed out that this discrepancy may be explained by therelatively high public good return from every token submitted (α = 0.5) combinedwith the small groups (n = 3) in our experiment. We therefore ran five additionalsessions where we decreased the return to α = 0.3 and simultaneously increasedthe group size to n = 5.34 Table 6 summarizes the new treatments. Note that wedid not vary the order of periods with and without charity; all sessions used thesequence C-NC-C-NC. Moreover, we decided to focus on the comparison betweenAP and WP and did not run any lottery sessions. Finally the matching groups nowconsisted of 10 subjects each.
The hypotheses derived for the original sessions straightforwardly carry over tothese new treatments. In the absence of a charity, it can easily be derived that forn = 5, RWP
α=0 = RAPα=0 = 333. Our data show average revenues of 368 and 407 for
WP and AP, respectively. When there is a charity, the equilibrium revenues areRWP
α=0.3 = 355 and RAPα=0.3 = 475, and our observed revenues are 358 and 464, re-
spectively. Once again, only for AP does the contribution to a charity substantiallyraise revenues.
34 By simultaneously changing two parameters we run the risk that if we observe differences, wecannot attribute them to one or the other change. As it turns out, the results support the previousresults.
446 SCHRAM AND ONDERSTAL
TABLE 6SUMMARY OF THE ADDITIONAL TREATMENTS
# IndependentMechanism # Sessions # Groups Observations
First-price winner-pay WP 2 8 4First-price all-pay AP 3 10 5
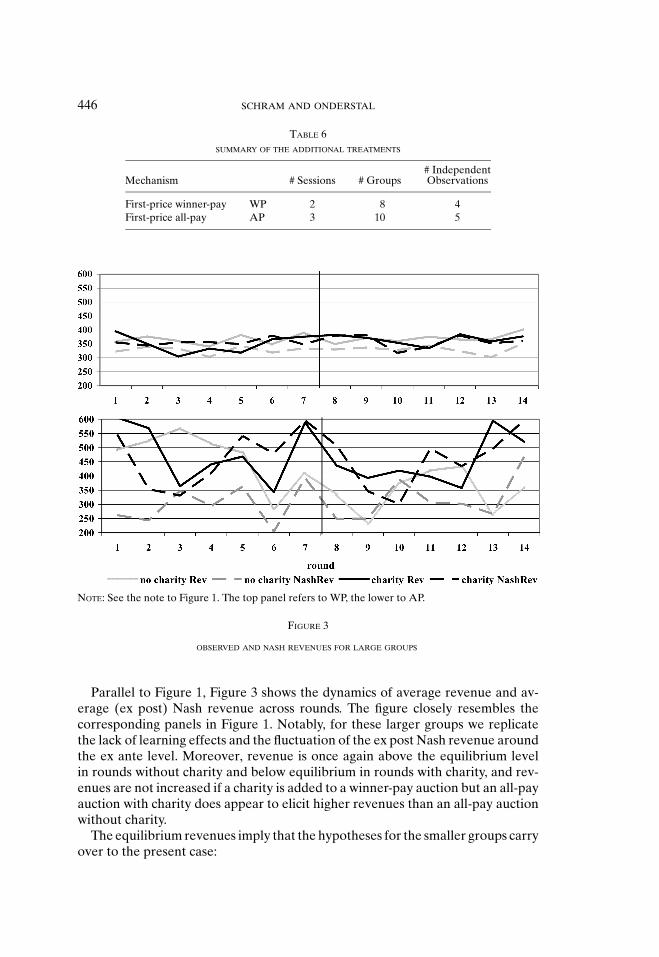
NOTE: See the note to Figure 1. The top panel refers to WP, the lower to AP.
FIGURE 3
OBSERVED AND NASH REVENUES FOR LARGE GROUPS
Parallel to Figure 1, Figure 3 shows the dynamics of average revenue and av-erage (ex post) Nash revenue across rounds. The figure closely resembles thecorresponding panels in Figure 1. Notably, for these larger groups we replicatethe lack of learning effects and the fluctuation of the ex post Nash revenue aroundthe ex ante level. Moreover, revenue is once again above the equilibrium levelin rounds without charity and below equilibrium in rounds with charity, and rev-enues are not increased if a charity is added to a winner-pay auction but an all-payauction with charity does appear to elicit higher revenues than an all-pay auctionwithout charity.
The equilibrium revenues imply that the hypotheses for the smaller groups carryover to the present case:
AUCTIONS FOR CHARITY 447
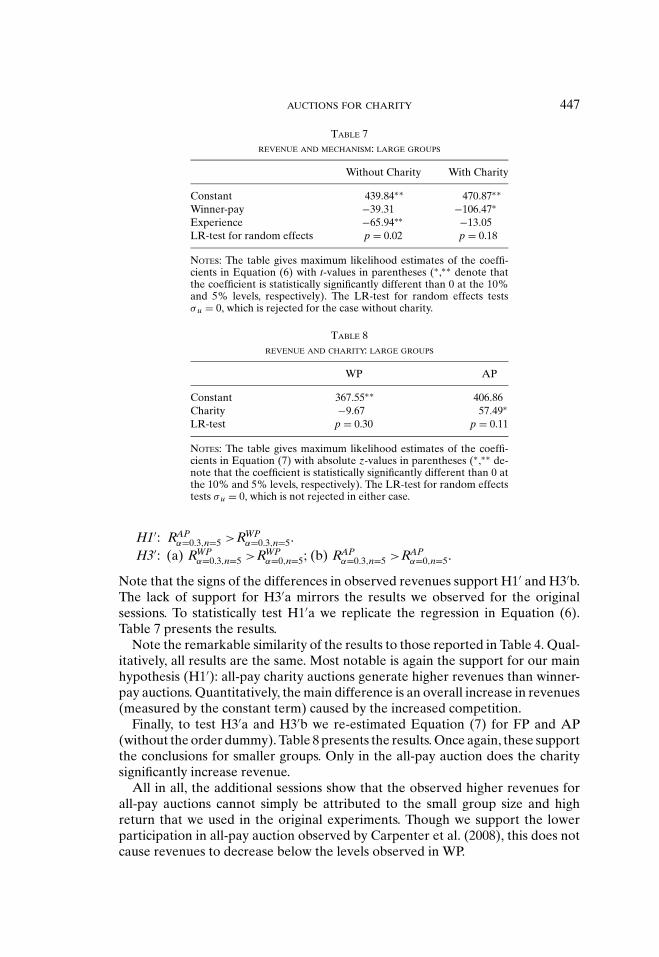
TABLE 7REVENUE AND MECHANISM: LARGE GROUPS
Without Charity With Charity
Constant 439.84∗∗ 470.87∗∗Winner-pay −39.31 −106.47∗Experience −65.94∗∗ −13.05LR-test for random effects p = 0.02 p = 0.18
NOTEs: The table gives maximum likelihood estimates of the coeffi-cients in Equation (6) with t-values in parentheses (∗,∗∗ denote thatthe coefficient is statistically significantly different than 0 at the 10%and 5% levels, respectively). The LR-test for random effects testsσ u = 0, which is rejected for the case without charity.
TABLE 8REVENUE AND CHARITY: LARGE GROUPS
WP AP
Constant 367.55∗∗ 406.86Charity −9.67 57.49∗LR-test p = 0.30 p = 0.11
NOTES: The table gives maximum likelihood estimates of the coeffi-cients in Equation (7) with absolute z-values in parentheses (∗,∗∗ de-note that the coefficient is statistically significantly different than 0 atthe 10% and 5% levels, respectively). The LR-test for random effectstests σ u = 0, which is not rejected in either case.
H1′: RAPα=0.3,n=5 >RWP
α=0.3,n=5.H3′: (a) RWP
α=0.3,n=5 >RWPα=0,n=5; (b) RAP
α=0.3,n=5 >RAPα=0,n=5.
Note that the signs of the differences in observed revenues support H1′ and H3′b.The lack of support for H3′a mirrors the results we observed for the originalsessions. To statistically test H1′a we replicate the regression in Equation (6).Table 7 presents the results.
Note the remarkable similarity of the results to those reported in Table 4. Qual-itatively, all results are the same. Most notable is again the support for our mainhypothesis (H1′): all-pay charity auctions generate higher revenues than winner-pay auctions. Quantitatively, the main difference is an overall increase in revenues(measured by the constant term) caused by the increased competition.
Finally, to test H3′a and H3′b we re-estimated Equation (7) for FP and AP(without the order dummy). Table 8 presents the results. Once again, these supportthe conclusions for smaller groups. Only in the all-pay auction does the charitysignificantly increase revenue.
All in all, the additional sessions show that the observed higher revenues forall-pay auctions cannot simply be attributed to the small group size and highreturn that we used in the original experiments. Though we support the lowerparticipation in all-pay auction observed by Carpenter et al. (2008), this does notcause revenues to decrease below the levels observed in WP.
448 SCHRAM AND ONDERSTAL
4. CONCLUSIONS
Charities often organize raffles or auctions to raise money. Staggering amountsare involved (reported estimates are that over $240 billion was raised by charitiesin the United States in 2003; see Isaac and Schnier, 2005).35 There has recentlybeen considerable interest in studying the performance of various mechanismsused. Yet, this is the first experimental investigation for the arguably most re-alistic case where the prize to be won is characterized by independent privatevalues and where there is incomplete information about others’ values. Our studycompares winner-pay (first-price) auctions, lotteries and all-pay (first-price) auc-tions in this environment. The theoretical analysis derived from GMOT providestestable hypotheses for this scenario. Note that we have not attempted to findthe optimal method. Given the theoretical results in GMOT, this would involveadding second-price elements (or lower) to the all-pay auction. However, for manybidders, first-price auctions are much easier to understand. The formats we havecompared are easy to implement and are easily understood by the bidders.36
Our main result provides support for the theoretical predictions: All-pay auc-tions are the preferred mechanism to raise money for charities. With three biddersand independent private values in the range [0, 500] our results show that com-pared to all-pay auctions winner-pay auctions are expected to reduce revenues bymore than 100 and lotteries by almost 50. The first result was replicated in addi-tional sessions with five bidders and a lower public good return from the charity’srevenue.
Extrapolating this to auctions in the field gives an indication of the potentialgains to be made. For example, on June 24, 1999, Eric Clapton’s legendary 1956Fender Stratocaster “Brownie” raised $497,500 for the ‘‘Crossroads Centre’’ in awinner-pay auction.37 Though a caveat is required because of the many differencesbetween our laboratory environment and this case in the field, it may be infor-mative to speculate on the consequences of our laboratory results. Our estimatesindicate that the proceeds of this one guitar could have been at least $100,000higher had an all-pay format been used.
An important next question concerns the extent to which theoretical resultsand observations in the lab can be extrapolated to the field in this way. At leastCarpenter et al.’s (2008) field experiment shows that the all-pay auction maynot always dominate the winner-pay auction. New experiments, both in the laband in the field, may reveal under which circumstances the all-pay auction is thepreferred fundraising mechanism. We believe that our study provides a suitablestarting point for such endeavors. As argued by Levitt and List (2006), laboratoryexperimentation is a useful tool for providing qualitative evidence and is oftenthe preferred first step when ranking mechanisms: “The lab can be used to rank
35 Of course, a large proportion of this was not raised by way of lotteries or auctions. Still, Morganand Sefton (2000) report that in the United States in 1992, at least $6 billion was raised by lotteries. Wehave not been able to find numbers for auctions, but a Google search with the terms “charity auction”and “charity auctions” gives about 2 million hits.
36 For example, the all-pay auction can be implemented as follows. People are invited to donatemoney to charity. It is announced that the person who donates the most, wins the prize.
37 http://www.collectors.com/articles/article view.chtml?artid=980&universeid=273&type=1.
AUCTIONS FOR CHARITY 449
mechanisms within broad areas, such as charitable fundraising” (Levitt and List,2006, p. 41). This is precisely what we have done in this article.
There are at least three other potentially interesting avenues for further re-search. First, we modeled charity in the experiment by having each subject receive€0.50 (or €0.30) for every €1 of revenue. It would be interesting to know to whatextent our results carry over to a situation where the proceeds of the auction orlottery are transferred to a charitable organization such as Greenpeace. Second,we have restricted the analysis to the case where everyone values the proceedsequally. People who are not interested in the charity know a priori that in anauction, someone with the same value for the good who does care about the char-ity would outbid them. In some auction formats this would lead them to abstainfrom participation; in others they may still participate. It may be interesting tostudy whether this type of asymmetry would change our revenue ranking. Third,the lottery mechanism deserves further field research. The relative performanceof this mechanism may be different when very large numbers of bidders are con-cerned. An overestimation of very small probabilities of winning may cause severeoverbidding in very thin lotteries, which could increase the expected revenue fromthis mechanism in the field.38
APPENDIX
A. Instructions. The instructions are computerized. Subjects could readthrough the html-pages at their own pace. Below is a translation of the Dutchinstructions for the treatment with a first-price winner-pay auction, starting with-out a charity. Horizontal lines denote page breaks.
WELCOME
You are about to participate in an economic experiment. The instructions aresimple. If you follow them carefully, you may make a substantial amount of money.Your earnings will be paid to you in euros at the end of the experiment. This willbe done confidentially, one participant at a time.
Earnings in the experiment will be denoted by “experimental francs.” At theend of the experiment, francs will be exchanged for euros. The exchange rate willbe 0.5 eurocent per franc, or 1 euro for each 200 francs.
These instructions consist of 11 pages like this. You may page back and forthby using your mouse to click on ‘‘previous page’’ or ‘‘next page’’ at the bottomof your screen. In some cases a page is larger than your screen. If so, you can usethe scroll bar to scroll up and down. At the bottom of your screen, you will seethe button ‘‘ready,’’ You can click this when you have completely finished with allpages of the instructions.
ROUNDS
Today’s experiment consists of 28 rounds, preceded by 3 practice rounds.The 28 rounds are split in 4 blocks of 7. In rounds 1–7 and 15–21 you can only
earn money for yourself. In rounds 8–14 and 22–28 you may also make money for
38 We are grateful to an anonymous referee for pointing this out.
450 SCHRAM AND ONDERSTAL
yourself but you can also earn money for other participants. Other participants canalso make money for you in these rounds. How this works will be explained below.
In every round, you will be member of a group. This group consists of youand two other people. The group composition is unknown to you and to otherparticipants. You will not know who is in your group. Others will not know whetheryou are in their group. In addition, we will make new groups in every round. Thus,the members of your group will change from round to round. In the rounds whereyou can make money for other participants, this money will only be given to theother members of your group in the round.
In the practice rounds, you will not be in a group. The computer will randomlysimulate the choices by other group members. Therefore, these rounds will revealnothing about others’ choices. The practice rounds are only meant to help youlearn about the problem at hand and about the computer program. Any earningsin the practice rounds will not be paid.
AUCTION
In this experiment you will participate in auctions. In these auctions you may tryto obtain a fictitious good. In the remainder of these instructions we will explainthe way in which the auction is organized and the rules you must abide by.
YOUR VALUE
Before you participate in the auction in any round, you will be given a value forthe fictitious good.
This value can be any number (randomly determined by the computer) between0 and 500 francs (which is between 0 and 2.5 euro).
Note the following about the values:
1. Your value is determined independently of the values of other partici-pants;
2. Any value between 0 and 500 is equally likely;3. The only thing you will know about anyone else’s value is that every
number between 0 and 500 is equally likely;4. Similarly, no one else will know anything about your value except that
every number between 0 and 500 is equally likely.
YOUR EARNINGS
If you obtain the good in a round, than your value for that round is your revenue.If you do not obtain the good, your revenue for that round is equal to 0 francs.
To determine your earnings for a round, you need to subtract your costs fromthe revenue, hence:
Earnings in round = revenue in round minus costs in round
In addition to your earnings from the auctions, we will give you 1500 francs asa starting capital.
AUCTIONS FOR CHARITY 451
Therefore, your total earnings in the experiment are (in addition to the 5 euroshow-up fee you received when you arrived):
1500 francs + your earnings in rounds 1–28.
At the end of today’s experiment your earnings in francs will be exchanged foreuros (200 francs are equivalent to 1 euro).
YOUR EARNINGS
Though unlikely, it may happen that your earnings in the experiment becomenegative.
If your earnings do become negative, the following will happen:
1. You must remain seated until the end of the experiment and may tell noone that your earnings are negative.
2. Your earnings from the experiment are zero. You may only keep your5 euro show-up fee.
3. The computer will make all decisions for you.4. You will need to confirm the computer’s decision in every round (but you
cannot change this decision).
Whether your earnings become negative is in your own hands, however.If someone’s earnings become negative, we will make this known to everyone
who is in a group with this individual in the remainder of the experiment. We willdo so by walking by your table with a note. If we show the note to you, you willknow that someone in your group has negative earnings (and his or her decisionshave been taken over by the computer).
THE AUCTION
In the auction, you submit a bid for the good. The other members of your groupalso submit bids. The group member with the highest bid gets the good and paysher or his bid. If two participants submit the same (highest) bid, the computer willrandomly determine which one obtains the good.
Your earnings are therefore:If you submit the highest bid or win the random draw: your earnings = your
value minus your bid
If you do not submit the highest bid: your earnings = 0.
MAKING MONEY FOR YOUR GROUP
In some rounds (rounds 8–14 and 21–28) you may earn money for the othermembers of your group. Other group members may also earn money for you.
To be more precise, in each of these rounds, 150% of the auction revenue will besplit equally across the group members. For example, if the revenue is 100 francs,a total of 150 francs will be earned. You will receive 50 francs out of this. Thedivision across group members does not depend on individual values or bids.
452 SCHRAM AND ONDERSTAL
These earnings will not affect your own earnings. You may make money foryourself in exactly the same way as in rounds 8–14 and 22–28. The organizers ofthe experiment will pay for the additional earnings in your group.
At the top left corner of your screen, you will be shown how much moneyyou earned from the group in the previous round. Remember that the groupcomposition changes from round to round, however.
YOUR SCREEN
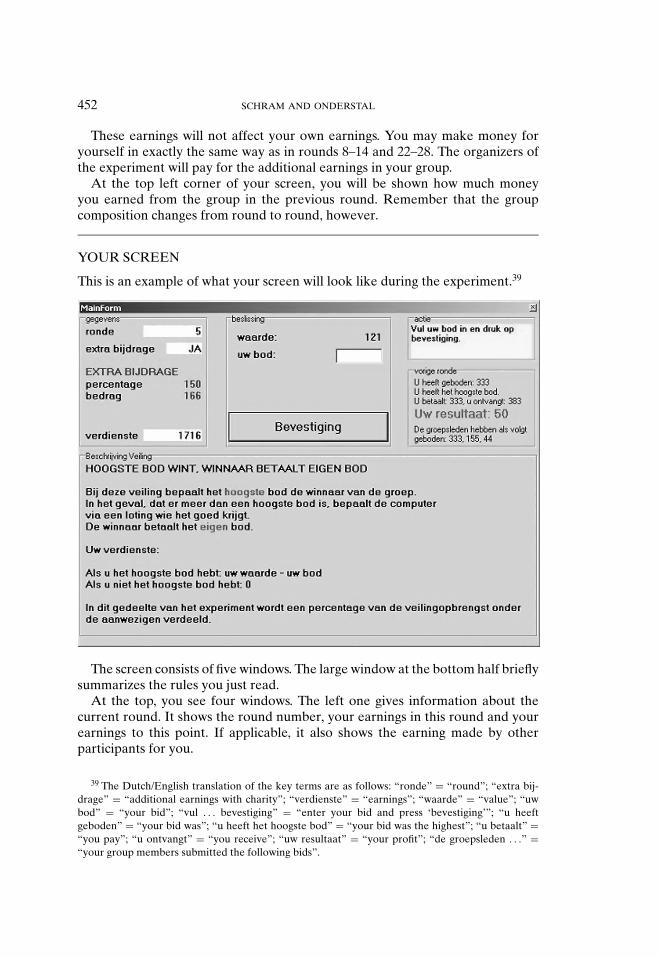
This is an example of what your screen will look like during the experiment.39
The screen consists of five windows. The large window at the bottom half brieflysummarizes the rules you just read.
At the top, you see four windows. The left one gives information about thecurrent round. It shows the round number, your earnings in this round and yourearnings to this point. If applicable, it also shows the earning made by otherparticipants for you.
39 The Dutch/English translation of the key terms are as follows: “ronde” = “round”; “extra bij-drage” = “additional earnings with charity”; “verdienste” = “earnings”; “waarde” = “value”; “uwbod” = “your bid”; “vul . . . bevestiging” = “enter your bid and press ‘bevestiging’”; “u heeftgeboden” = “your bid was”; “u heeft het hoogste bod” = “your bid was the highest”; “u betaalt” =“you pay”; “u ontvangt” = “you receive”; “uw resultaat” = “your profit”; “de groepsleden . . .” =“your group members submitted the following bids”.
AUCTIONS FOR CHARITY 453
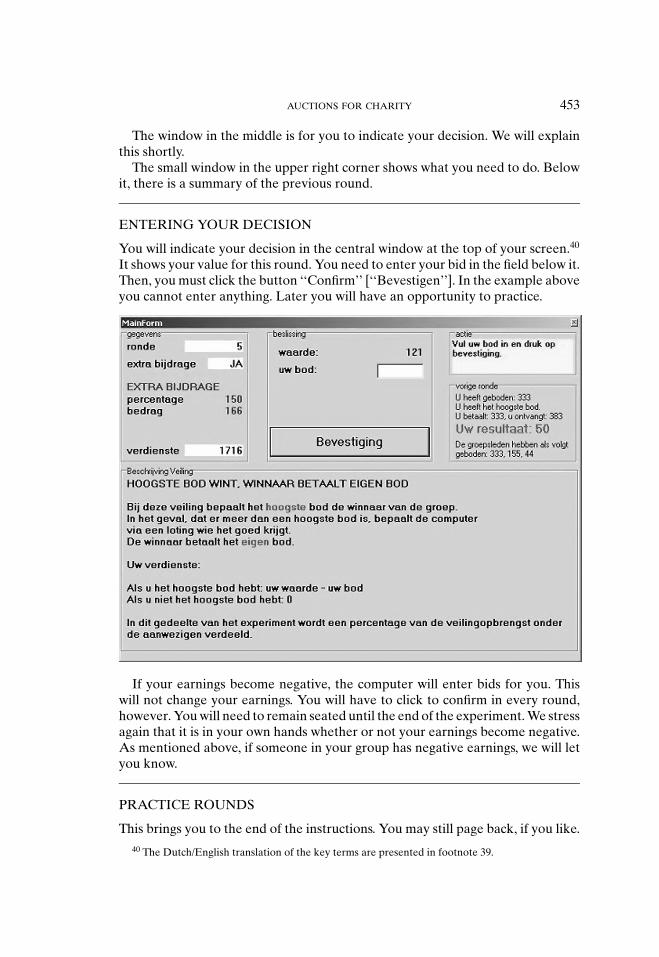
The window in the middle is for you to indicate your decision. We will explainthis shortly.
The small window in the upper right corner shows what you need to do. Belowit, there is a summary of the previous round.
ENTERING YOUR DECISION
You will indicate your decision in the central window at the top of your screen.40
It shows your value for this round. You need to enter your bid in the field below it.Then, you must click the button ‘‘Confirm’’ [‘‘Bevestigen’’]. In the example aboveyou cannot enter anything. Later you will have an opportunity to practice.
If your earnings become negative, the computer will enter bids for you. Thiswill not change your earnings. You will have to click to confirm in every round,however. You will need to remain seated until the end of the experiment. We stressagain that it is in your own hands whether or not your earnings become negative.As mentioned above, if someone in your group has negative earnings, we will letyou know.
PRACTICE ROUNDS
This brings you to the end of the instructions. You may still page back, if you like.40 The Dutch/English translation of the key terms are presented in footnote 39.
454 SCHRAM AND ONDERSTAL
After you have finished, please click the button ‘‘ready,’’ below. When everyonehas finished, we will start the practice rounds. As mentioned, you will not be ingroups in the practice rounds (the computer will simulate others’ decisions) andthere will be no earnings in these rounds.
Please, remain quietly seated until everyone is ready.
B. Theoretical Results. This appendix summarizes theoretical results on equi-librium bidding for WP, AP, and LOT, and shows how they have been applied toour parameters. For WP and AP the equilibrium bids in our experiments fol-low directly from the literature (see Propositions 1 and 2, below). A new resultrelative to the existing literature is our equilibrium characterization of LOT inProposition 3.
The theory is based on the following assumptions. Suppose that n ≥ 2 risk neutralbidders (numbered i = 1, . . . , n) bid for an indivisible object in an auction. Eachbidder independently draws a value for the object from the same differentiableprobability distribution F on the interval [v, v], 0 ≤ v < v. Bidder i’s value vi isprivate information. If bidder i pays bi and the auction’s revenue equals R, thenher utility equals ui = viIi – bi + αR, where Ii = 1 [Ii = 0] if she wins [does notwin] the object.
PROPOSITION 1 (Engers & McManus, 2007). For WP, the symmetric equilibriumbidding function is characterized by
bWP(v) = v −∫ v
v
(F(x)F(v)
) n−11−α
dx, v ∈ [v, v] .
Straightforward calculations show that the assumed uniform distribution of valuesU[0, 500] yields bWP(v) = n−1
n−αv, which reduces to Equation (1) in the main text for
n = 3.
PROPOSITION 2 (GMOT). The symmetric equilibrium bidding function of AP isgiven by
bAP(v) = 11 − α
(vF(v)n−1 −
∫ v
v
F(x)n−1dx)
, v ∈ [v, v] .
For our parameters this reduces to bAP(v) = vn(n−1)500n−1n(1−α) , which gives Equation (3)
when n = 3.
PROPOSITION 3. The symmetric equilibrium bidding function bLOT of LOT followsfrom the following integral equation:
AUCTIONS FOR CHARITY 455
∫ v
v
∫ v
v
. . .
∫ v
v
n−1∑i=1
bLOT(vi )
(n∑
i=1
bLOT(vi )
)−2
dF(v1)dF(v2) . . . dF(vn−1)
= 1 − α
vn, vn ∈ [v, v] .
(B.1)
PROOF. Suppose that bidders i = 1, . . . , n − 1 bid according to bLOT . Then biddern maximizes
U(bn) ≡∫ v
v
∫ v
v
. . .
∫ v
v
vnbn
(n−1∑i=1
bLOT(vi ) + bn
)−1
+ α
(n−1∑i=1
bLOT(vi ) + bn
)dF(v1)dF(v2) . . . dF(vn−1) − bn
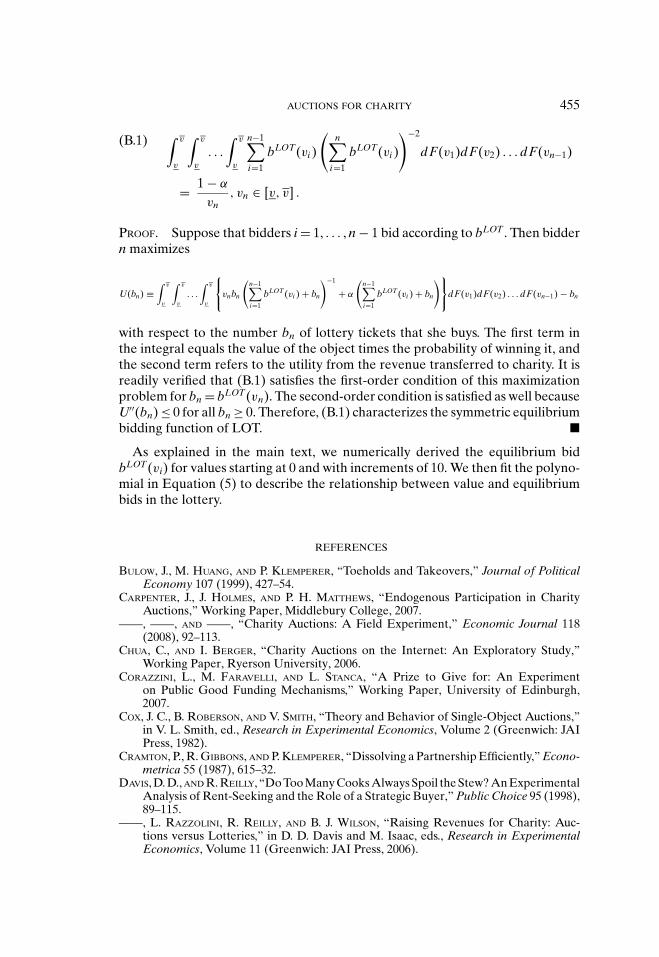
with respect to the number bn of lottery tickets that she buys. The first term inthe integral equals the value of the object times the probability of winning it, andthe second term refers to the utility from the revenue transferred to charity. It isreadily verified that (B.1) satisfies the first-order condition of this maximizationproblem for bn = bLOT(vn). The second-order condition is satisfied as well becauseU′′(bn) ≤ 0 for all bn ≥ 0. Therefore, (B.1) characterizes the symmetric equilibriumbidding function of LOT. �
As explained in the main text, we numerically derived the equilibrium bidbLOT(vi) for values starting at 0 and with increments of 10. We then fit the polyno-mial in Equation (5) to describe the relationship between value and equilibriumbids in the lottery.
REFERENCES
BULOW, J., M. HUANG, AND P. KLEMPERER, “Toeholds and Takeovers,” Journal of PoliticalEconomy 107 (1999), 427–54.
CARPENTER, J., J. HOLMES, AND P. H. MATTHEWS, “Endogenous Participation in CharityAuctions,” Working Paper, Middlebury College, 2007.
——, ——, AND ——, “Charity Auctions: A Field Experiment,” Economic Journal 118(2008), 92–113.
CHUA, C., AND I. BERGER, “Charity Auctions on the Internet: An Exploratory Study,”Working Paper, Ryerson University, 2006.
CORAZZINI, L., M. FARAVELLI, AND L. STANCA, “A Prize to Give for: An Experimenton Public Good Funding Mechanisms,” Working Paper, University of Edinburgh,2007.
COX, J. C., B. ROBERSON, AND V. SMITH, “Theory and Behavior of Single-Object Auctions,”in V. L. Smith, ed., Research in Experimental Economics, Volume 2 (Greenwich: JAIPress, 1982).
CRAMTON, P., R. GIBBONS, AND P. KLEMPERER, “Dissolving a Partnership Efficiently,” Econo-metrica 55 (1987), 615–32.
DAVIS, D. D., AND R. REILLY, “Do Too Many Cooks Always Spoil the Stew? An ExperimentalAnalysis of Rent-Seeking and the Role of a Strategic Buyer,” Public Choice 95 (1998),89–115.
——, L. RAZZOLINI, R. REILLY, AND B. J. WILSON, “Raising Revenues for Charity: Auc-tions versus Lotteries,” in D. D. Davis and M. Isaac, eds., Research in ExperimentalEconomics, Volume 11 (Greenwich: JAI Press, 2006).
456 SCHRAM AND ONDERSTAL
ELFENBEIN, D. W., AND B. MCMANUS, “A Greater Price for a Greater Good? The CharityPremium in Online Auctions,” Working Paper, John M. Olin School of Business,2007.
ENGELBRECHT-WIGGANS, R., “Auctions with Price-Proportional Benefits to Bidders,” Gamesand Economic Behavior 6 (1994), 339–46.
ENGERS, M., AND B. MCMANUS, “Charity Auctions,” International Economic Review 48(2007), 953–94.
FARAVELLI, M., “The Important Thing Is Not (Always) Winning but Taking Part: FundingPublic Goods with Contests,” Working Paper, University of Edinburgh, 2007.
GOEREE, J. K., E. MAASLAND, S. ONDERSTAL, AND J. L. TURNER, “How (Not) to Raise Money,”Journal of Political Economy 113 (2005), 897–918.
GRAHAM, D. A., AND R. C. MARSHALL, “Collusive Bidder Behavior at Single-Object Second-Price and English Auctions,” Journal of Political Economy 95 (1987), 1217–39.
ISAAC, R. M., AND K. SCHNIER, “Silent Auctions in the Field and in the Laboratory,” Eco-nomic Inquiry 43 (2005), 715–33.
——, J. M. WALKER, AND S. H. THOMAS, “Divergent Evidence on Free Riding: An Experi-mental Examination of Possible Explanations,” Public Choice 43 (1984), 113–49.
KAGEL, J. H., AND D. LEVIN, “Independent Private Value Auctions: Bidder Behavior inFirst, Second and Third Price Auctions with Varying Numbers of Bidders,” EconomicJournal 103 (1993), 868–79.
——, R. M. HARSTAD, AND D. LEVIN, “Information Impact and Allocation Rules in Auctionswith Affiliated Private Values: A Laboratory Study,” Econometrica 55 (1987), 1275–304.
KRISHNA, V., AND J. MORGAN, “An Analysis of the War of Attrition and the All-Pay Auction,”Journal of Economic Theory 72 (1997), 343–62.
LANDRY, C., A. LANGE, J. A. LIST, M. K. PRICE, AND N. G. RUPP, “Towards an Understandingof the Economics of Charity: Evidence from a Field Experiment,” Quarterly Journalof Economics 121 (2007), 747–82.
LANGE, A., J. A. LIST, AND M. K. PRICE, “Using Lotteries to Finance Public Goods: Theoryand Experimental Evidence, ”International Economic Review 48 (2007), 901–27.
LEDYARD, J. O., “Public Goods: A Survey of Experimental Research,” in J. H. Kagel andA. E. Roth, eds., The Handbook of Experimental Economics (Princeton: PrincetonUniversity Press, 1995).
LEVITT, S. D., AND J. A. LIST, “What Do Laboratory Experiments Tell Us about the RealWorld?” Working Paper, University of Chicago, 2006.
MAASLAND, E., AND S. ONDERSTAL, “Auctions with Financial Externalities,” Economic The-ory 32 (2007), 551–74.
MCAFEE, R. P., AND J. MCMILLAN, “Bidding Rings,” American Economic Review 82 (1992),579–99.
MORGAN, J., “Financing Public Goods by Means of Lotteries,” Review of Economic Studies67 (2000), 761–84.
——, AND M. SEFTON, “Funding Public Goods with Lotteries: Experimental Evidence,”Review of Economic Studies 67 (2000), 785–810.
MYERSON, R. B., “Optimal Auction Design,” Mathematics of Operations Research 6 (1981),58–73.
NOUSSAIR, C., AND J. SILVER, “Behavior in All-Pay Auctions with Incomplete Information,”Games and Economic Behavior 55 (2006), 189–206.
ORZEN, H., “Fundraising through Competition: Evidence from the Lab,” CeDEx WorkingPaper 2005–04, 2005.
POPKOWSKI LESZCZYC, P. T. L., AND M. H. ROTHKOPF, “Charitable Intent and Bidding inCharity Auctions,” Working Paper, University of Alberta, 2007.
POTTERS, J., C. G. DE VRIES, AND F. VAN WINDEN, “An Experimental Examination ofRational Rent-Seeking,” European Journal of Political Economy 14 (1998), 783–800.

AUCTIONS FOR CHARITY 457
SINGH, R., “Takeover Bidding with Toeholds: The Case of the Owner’s Curse,” Review ofFinancial Studies 11 (1998), 679–704.
VICKREY, W., “Counterspeculation, Auctions, and Competitive Sealed Tenders,” Journal ofFinance 16 (1961), 8–37.
ZELMER, J., “Linear Public Goods Experiments: A Meta-Analysis,” Experimental Eco-nomics 6 (2003), 299–310.