Embed Size (px)
Citation preview
Bid
Cor
pora
tion
Lim
ited
Inve
stor
Pre
sent
atio
n fo
r th
e ye
ar e
nded
Jun
e 30
201
8
Bid Corporation Limited Investor Presentationfor the year ended June 30 2018

1 Bid Corporation Limited Results for the year ended June 30 2018
Notes
Audited Financial Resultsfor the year ended June 30 2018
2Bid Corporation Limited Results for the year ended June 30 2018
Notes
Audited Financial Results for the year ended June 30 2018
Bernard Berson, CEO 2018 in perspective
Bernard Berson, CEO Trading analysis
David Cleasby, CFO Financial analysis
Q&A
Supplementary information
2
Agenda
3 Bid Corporation Limited Results for the year ended June 30 2018
Notes
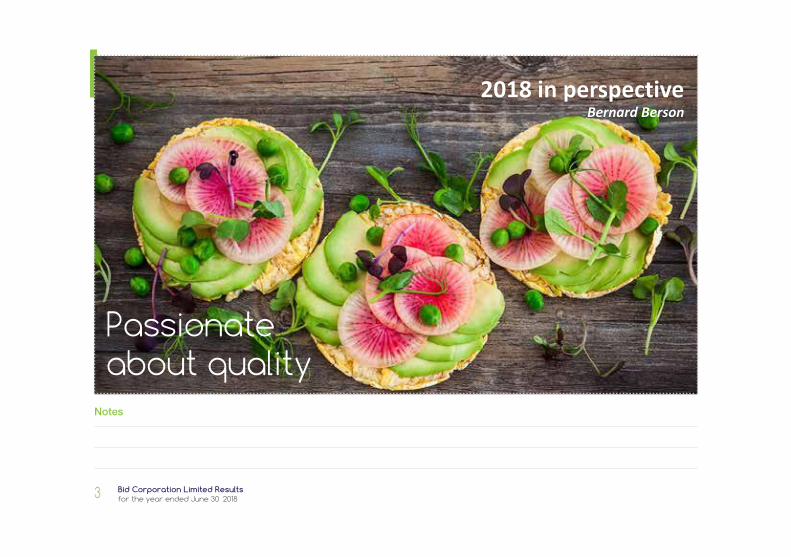
2018 in perspectiveBernard Berson
4Bid Corporation Limited Results for the year ended June 30 2018
Notes
Audited Financial Results for the year ended June 30 2018
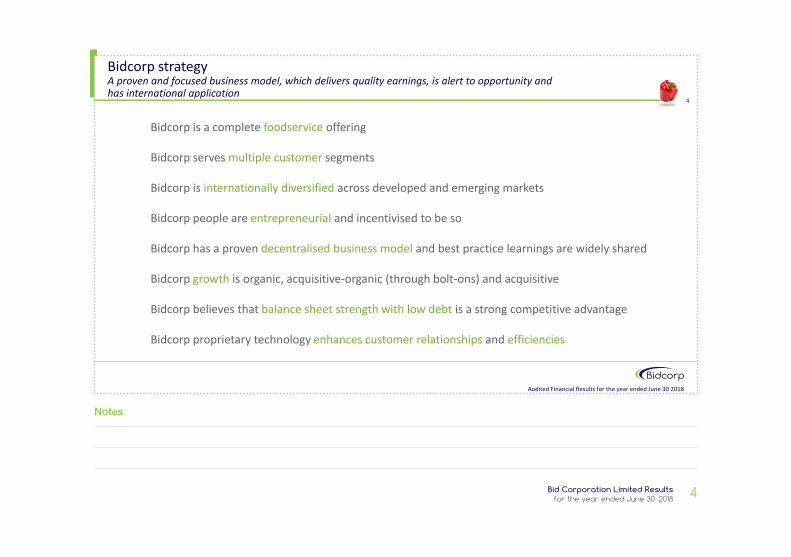
Bidcorp is a complete foodservice offering
Bidcorp serves multiple customer segments
Bidcorp is internationally diversified across developed and emerging markets
Bidcorp people are entrepreneurial and incentivised to be so
Bidcorp has a proven decentralised business model and best practice learnings are widely shared
Bidcorp growth is organic, acquisitive-organic (through bolt-ons) and acquisitive
Bidcorp believes that balance sheet strength with low debt is a strong competitive advantage
Bidcorp proprietary technology enhances customer relationships and efficiencies
4
Bidcorp strategyA proven and focused business model, which delivers quality earnings, is alert to opportunity and has international application
5 Bid Corporation Limited Results for the year ended June 30 2018
Notes
Audited Financial Results for the year ended June 30 2018
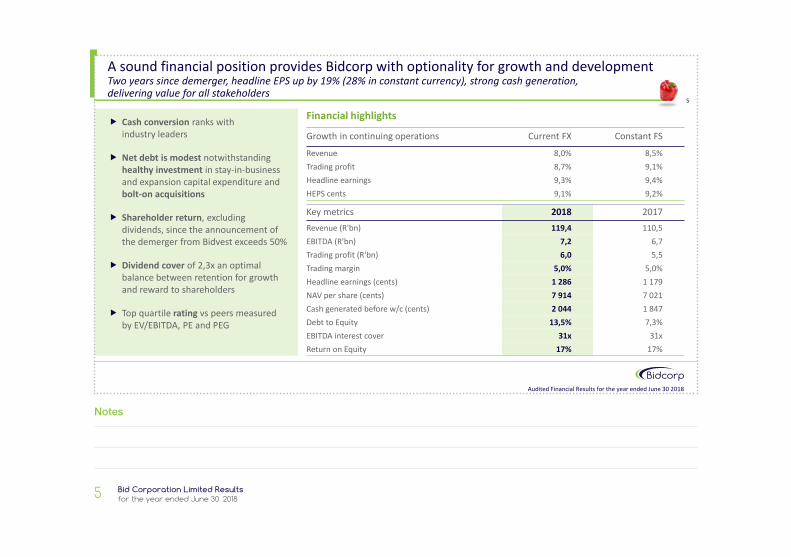
Growth in continuing operations Current FX Constant FSRevenue 8,0% 8,5%Trading profit 8,7% 9,1%Headline earnings 9,3% 9,4%HEPS cents 9,1% 9,2%
A sound financial position provides Bidcorp with optionality for growth and development Two years since demerger, headline EPS up by 19% (28% in constant currency), strong cash generation,delivering value for all stakeholders
5
Financial highlights Cash conversion ranks with
industry leaders
Net debt is modest notwithstanding healthy investment in stay-in-business and expansion capital expenditure and bolt-on acquisitions
Shareholder return, excluding dividends, since the announcement of the demerger from Bidvest exceeds 50%
Dividend cover of 2,3x an optimal balance between retention for growth and reward to shareholders
Top quartile rating vs peers measuredby EV/EBITDA, PE and PEG
Key metrics 2018 2017Revenue (R'bn) 119,4 110,5EBITDA (R'bn) 7,2 6,7Trading profit (R'bn) 6,0 5,5Trading margin 5,0% 5,0%Headline earnings (cents) 1 286 1 179NAV per share (cents) 7 914 7 021Cash generated before w/c (cents) 2 044 1 847Debt to Equity 13,5% 7,3%EBITDA interest cover 31x 31xReturn on Equity 17% 17%
6Bid Corporation Limited Results for the year ended June 30 2018
Notes
Audited Financial Results for the year ended June 30 2018
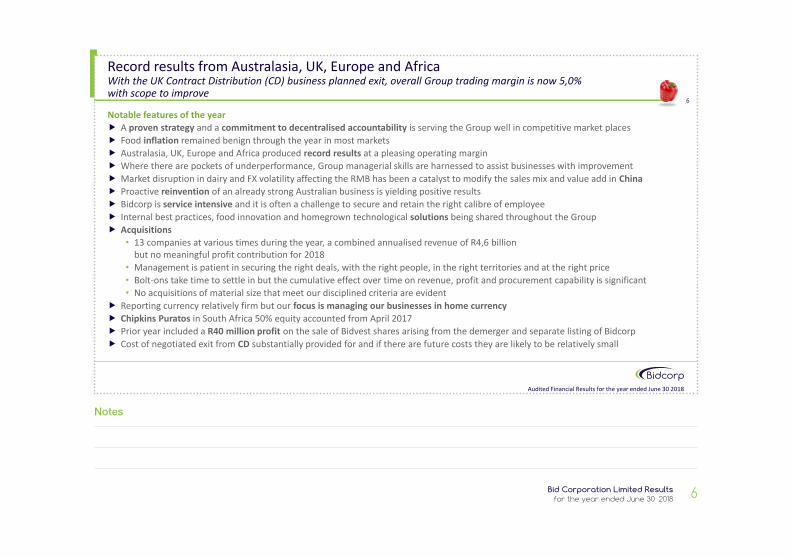
Notable features of the year A proven strategy and a commitment to decentralised accountability is serving the Group well in competitive market places Food inflation remained benign through the year in most markets Australasia, UK, Europe and Africa produced record results at a pleasing operating margin Where there are pockets of underperformance, Group managerial skills are harnessed to assist businesses with improvement Market disruption in dairy and FX volatility affecting the RMB has been a catalyst to modify the sales mix and value add in China Proactive reinvention of an already strong Australian business is yielding positive results Bidcorp is service intensive and it is often a challenge to secure and retain the right calibre of employee Internal best practices, food innovation and homegrown technological solutions being shared throughout the Group Acquisitions
• 13 companies at various times during the year, a combined annualised revenue of R4,6 billionbut no meaningful profit contribution for 2018
• Management is patient in securing the right deals, with the right people, in the right territories and at the right price • Bolt-ons take time to settle in but the cumulative effect over time on revenue, profit and procurement capability is significant• No acquisitions of material size that meet our disciplined criteria are evident
Reporting currency relatively firm but our focus is managing our businesses in home currency Chipkins Puratos in South Africa 50% equity accounted from April 2017 Prior year included a R40 million profit on the sale of Bidvest shares arising from the demerger and separate listing of Bidcorp Cost of negotiated exit from CD substantially provided for and if there are future costs they are likely to be relatively small
6
Record results from Australasia, UK, Europe and Africa With the UK Contract Distribution (CD) business planned exit, overall Group trading margin is now 5,0% with scope to improve

7 Bid Corporation Limited Results for the year ended June 30 2018
Notes
Trading analysisBernard Berson
8Bid Corporation Limited Results for the year ended June 30 2018
Notes
Audited Financial Results for the year ended June 30 2018
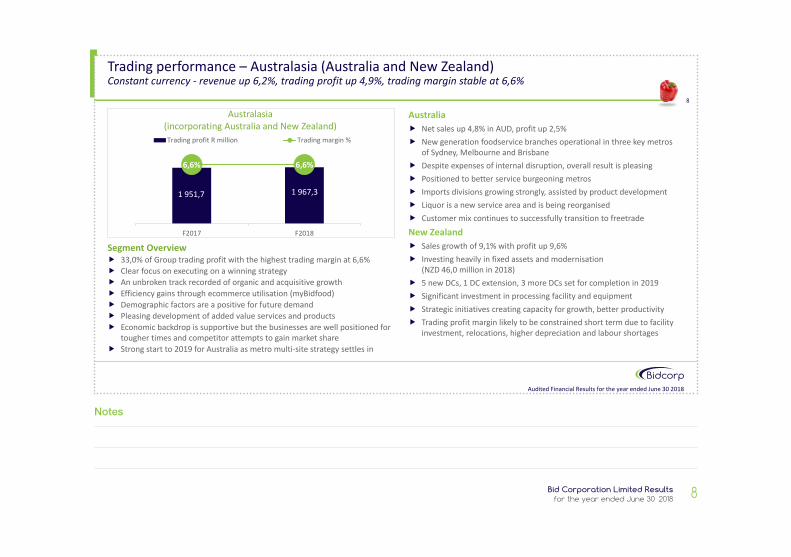
Segment Overview 33,0% of Group trading profit with the highest trading margin at 6,6% Clear focus on executing on a winning strategy An unbroken track recorded of organic and acquisitive growth Efficiency gains through ecommerce utilisation (myBidfood) Demographic factors are a positive for future demand Pleasing development of added value services and products Economic backdrop is supportive but the businesses are well positioned for
tougher times and competitor attempts to gain market share Strong start to 2019 for Australia as metro multi-site strategy settles in
Australia Net sales up 4,8% in AUD, profit up 2,5% New generation foodservice branches operational in three key metros
of Sydney, Melbourne and Brisbane Despite expenses of internal disruption, overall result is pleasing Positioned to better service burgeoning metros Imports divisions growing strongly, assisted by product development Liquor is a new service area and is being reorganised Customer mix continues to successfully transition to freetradeNew Zealand Sales growth of 9,1% with profit up 9,6% Investing heavily in fixed assets and modernisation
(NZD 46,0 million in 2018) 5 new DCs, 1 DC extension, 3 more DCs set for completion in 2019 Significant investment in processing facility and equipment Strategic initiatives creating capacity for growth, better productivity Trading profit margin likely to be constrained short term due to facility
investment, relocations, higher depreciation and labour shortages
8
Australasia(incorporating Australia and New Zealand)
Trading performance – Australasia (Australia and New Zealand)Constant currency - revenue up 6,2%, trading profit up 4,9%, trading margin stable at 6,6%
6,6% 6,6%
0,0%
2,0%
4,0%
6,0%
8,0%
0
500
1000
1500
2000
2500
F2017 F2018
Trading profit R million Trading margin %
1 951,7 1 967,3
9 Bid Corporation Limited Results for the year ended June 30 2018
Notes
Audited Financial Results for the year ended June 30 2018
Segment Overview A strong Foodservice result with 5 years of dedicated focus on the strategy
paying off, UK segment contributed 23,9% to Group profit (F2017: 23,9%) Relative weakness in GBP not fully recovered in percentage terms IT being successfully deployed for improved customer engagement Food inflation subsided sharply as the year progressed Fresh had some challenges but ended the period better positioned Working time directive and revised pensions requirements being
implemented Brexit and politics is a factor beyond our control
Foodservice Sales up 8,1% and trading profit up 15,0% with margin at 4,8% Despite cost of sales pressure, overheads were well controlled and staff
sales productivity improved, boosting trading margin Non-inventory procurement initiatives yielding major savings Channel Islands remained a drag on profits (breakeven raises overall
margin to 5%) but 2019 is promising with the right team Freetrade volume share increased to 37% from 36% National accounts secured high profile wins and retentions Own brand grew 11% to 23% of sales, a priority area Tender conversion rate was satisfactory at 55% Stresses in the UK restaurant sector have not had a material impact Capex of £33,0 million is 45% higher as we continually modernise Fresh Whilst profits overall fell by 30% it was a mixed result, not helped by the
disruption of new facilities in London and Birmingham Seafood and Campbells are performing to expectation Fresh likely to remain a variable profit contributor given frequency of
pricing adjustments but remains a key part of the total offering
9
United Kingdom
Trading performance – United KingdomConstant currency - revenue up 6,5%, trading profit up 8,7%, trading margin 4,5% vs 4,4%
1 311,4 1 424,6
4,4% 4,5%
0,0%
2,0%
4,0%
6,0%
0
500
1000
1500
F2017 F2018
Trading profit R million Trading margin %
10Bid Corporation Limited Results for the year ended June 30 2018
Notes
Audited Financial Results for the year ended June 30 2018
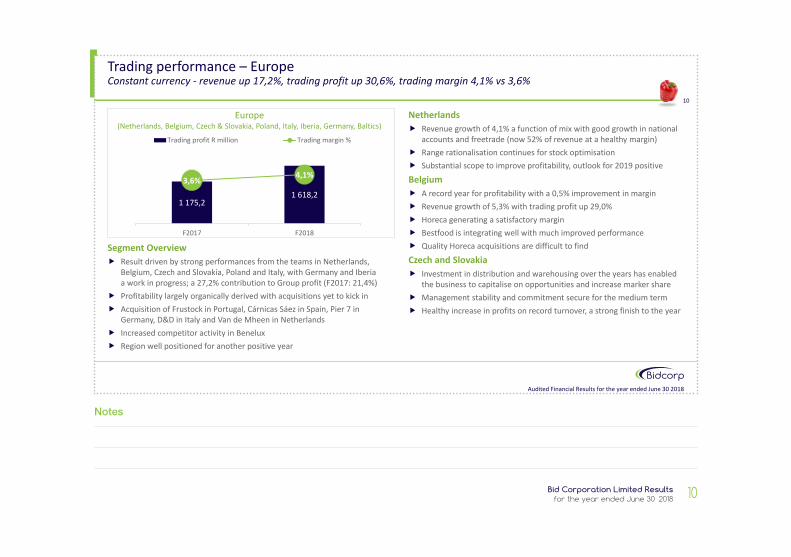
Segment Overview Result driven by strong performances from the teams in Netherlands,
Belgium, Czech and Slovakia, Poland and Italy, with Germany and Iberiaa work in progress; a 27,2% contribution to Group profit (F2017: 21,4%)
Profitability largely organically derived with acquisitions yet to kick in Acquisition of Frustock in Portugal, Cárnicas Sáez in Spain, Pier 7 in
Germany, D&D in Italy and Van de Mheen in Netherlands Increased competitor activity in Benelux Region well positioned for another positive year
Netherlands Revenue growth of 4,1% a function of mix with good growth in national
accounts and freetrade (now 52% of revenue at a healthy margin) Range rationalisation continues for stock optimisation Substantial scope to improve profitability, outlook for 2019 positiveBelgium A record year for profitability with a 0,5% improvement in margin Revenue growth of 5,3% with trading profit up 29,0% Horeca generating a satisfactory margin Bestfood is integrating well with much improved performance Quality Horeca acquisitions are difficult to find Czech and Slovakia Investment in distribution and warehousing over the years has enabled
the business to capitalise on opportunities and increase marker share Management stability and commitment secure for the medium term Healthy increase in profits on record turnover, a strong finish to the year
10
Europe(Netherlands, Belgium, Czech & Slovakia, Poland, Italy, Iberia, Germany, Baltics)
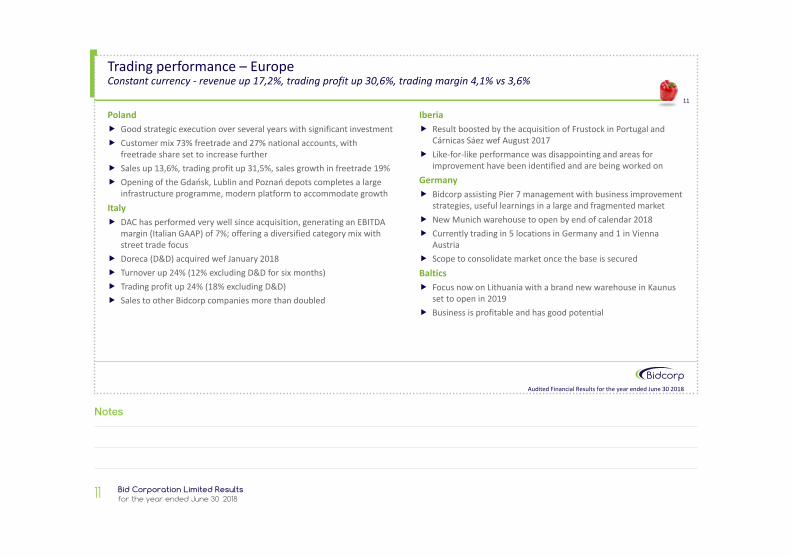
Trading performance – Europe Constant currency - revenue up 17,2%, trading profit up 30,6%, trading margin 4,1% vs 3,6%
1 175,21 618,2
3,6% 4,1%
0,0%
2,0%
4,0%
6,0%
0
500
1000
1500
2000
F2017 F2018
Trading profit R million Trading margin %
11 Bid Corporation Limited Results for the year ended June 30 2018
Notes
Audited Financial Results for the year ended June 30 2018
Trading performance – Europe Constant currency - revenue up 17,2%, trading profit up 30,6%, trading margin 4,1% vs 3,6%
Poland Good strategic execution over several years with significant investment Customer mix 73% freetrade and 27% national accounts, with
freetrade share set to increase further Sales up 13,6%, trading profit up 31,5%, sales growth in freetrade 19% Opening of the Gdańsk, Lublin and Poznań depots completes a large
infrastructure programme, modern platform to accommodate growth Italy DAC has performed very well since acquisition, generating an EBITDA
margin (Italian GAAP) of 7%; offering a diversified category mix with street trade focus
Doreca (D&D) acquired wef January 2018 Turnover up 24% (12% excluding D&D for six months) Trading profit up 24% (18% excluding D&D) Sales to other Bidcorp companies more than doubled
Iberia Result boosted by the acquisition of Frustock in Portugal and
Cárnicas Sáez wef August 2017 Like-for-like performance was disappointing and areas for
improvement have been identified and are being worked onGermany Bidcorp assisting Pier 7 management with business improvement
strategies, useful learnings in a large and fragmented market New Munich warehouse to open by end of calendar 2018 Currently trading in 5 locations in Germany and 1 in Vienna
Austria Scope to consolidate market once the base is secured Baltics Focus now on Lithuania with a brand new warehouse in Kaunus
set to open in 2019 Business is profitable and has good potential
11
12Bid Corporation Limited Results for the year ended June 30 2018
Notes
Audited Financial Results for the year ended June 30 2018
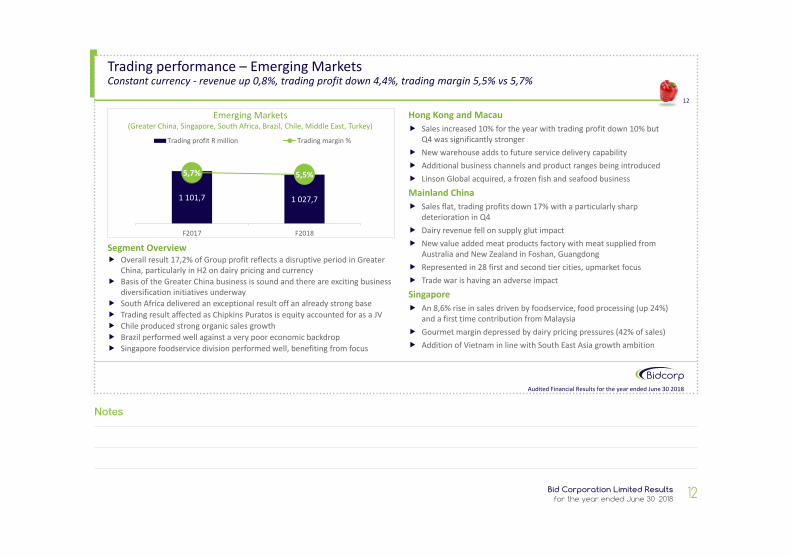
Segment Overview Overall result 17,2% of Group profit reflects a disruptive period in Greater
China, particularly in H2 on dairy pricing and currency Basis of the Greater China business is sound and there are exciting business
diversification initiatives underway South Africa delivered an exceptional result off an already strong base Trading result affected as Chipkins Puratos is equity accounted for as a JV Chile produced strong organic sales growth Brazil performed well against a very poor economic backdrop Singapore foodservice division performed well, benefiting from focus
Hong Kong and Macau Sales increased 10% for the year with trading profit down 10% but
Q4 was significantly stronger New warehouse adds to future service delivery capability Additional business channels and product ranges being introduced Linson Global acquired, a frozen fish and seafood businessMainland China Sales flat, trading profits down 17% with a particularly sharp
deterioration in Q4 Dairy revenue fell on supply glut impact New value added meat products factory with meat supplied from
Australia and New Zealand in Foshan, Guangdong Represented in 28 first and second tier cities, upmarket focus Trade war is having an adverse impact Singapore An 8,6% rise in sales driven by foodservice, food processing (up 24%)
and a first time contribution from Malaysia Gourmet margin depressed by dairy pricing pressures (42% of sales) Addition of Vietnam in line with South East Asia growth ambition
12
Emerging Markets(Greater China, Singapore, South Africa, Brazil, Chile, Middle East, Turkey)
Trading performance – Emerging Markets Constant currency - revenue up 0,8%, trading profit down 4,4%, trading margin 5,5% vs 5,7%
1 101,7 1 027,7
5,7% 5,5%
0,0%
2,0%
4,0%
6,0%
8,0%
0
500
1000
1500
F2017 F2018
Trading profit R million Trading margin %
13 Bid Corporation Limited Results for the year ended June 30 2018
Notes
Audited Financial Results for the year ended June 30 2018
Trading performance – Emerging Markets Constant currency - revenue up 0,8%, trading profit down 4,4%, trading margin 5,5% vs 5,7%
South Africa Sales grew 3% on like-for-like basis of Chipkins Puratos being fully
consolidated; trading profits on the same basis grew 13,4% Foodservice, food ingredients and bakery all achieved higher profits
with tight expense control and good margin management a feature Market is highly competitive whilst retailers are increasingly
encroaching in foodservice Crown was impacted later in the period by the listeriosis outbreak Famous Fresh, a fruit and vegetable distributor, acquired wef Feb 2018 Chipkins Puratos JV performed strongly, benefitting from new product
ranges and the upskilling of staff Griffith JV with Crown in QSR ingredients wef Oct 2017 Chile Total sale grew 27% and the business is building scale and reach with
the product mix also changing Santiago, Puerto Montt and Concepción branches had strong sales
growth and the new Viña del Mar branch contributed for the first time
Brazil Sales growth of 15% in a very challenging market, including a
trucking strike, whilst profits remained constant at a still respectable margin
Business improvement initiatives continue Middle East UAE is better positioned having exited retail and re-shaping the
brand profile Saudi Arabia traded relatively well with growth in sales and
profits New operations in Oman and Bahrain are already profitable,
whilst Jordan is budgeting to be breakeven in 2019Turkey Strategy to build a domestic foodservice business emphasising
local brands and produce, assisted by the recent acquisition of a foodservice wholesaler
Budgeting to be profitable in 2019
13
14Bid Corporation Limited Results for the year ended June 30 2018
Notes
Audited Financial Results for the year ended June 30 2018
Outlook2019 marks 30 years of growth and development
14
Australasia
Bidcorp
Major metros strategy in Australia is already yielding encouraging results New Zealand is investing heavily to strengthen market position
The balance sheet and management capacity to capitalise on opportunities A mix of defensive and growth characteristics Growth is organic, acquisitive-organic (through bolt-ons) and acquisitive
United Kingdom A focused foodservice and fresh business, investing in network An uncertain political and trading environment but this presents opportunity Budgeting for an improved result
Emerging Markets Recent disruptive trends in Greater China may continue All businesses have risen to the challenge of forces beyond management control Budgeting for a year of improved performance
Europe Patience and sticking to the Bidcorp way of business is paying off Budgeting for an improved result but unlikely to emulate 2018 Acquisitions will be considered within existing and adjacent territories
Since 1989, Bidcorp has evolved from a
relatively small South African business to a
Group that spans over 30 countries in
five continents
Real growth is budgeted for in 2019 in home currencies

15 Bid Corporation Limited Results for the year ended June 30 2018
Notes
FinancialDavid Cleasby
16Bid Corporation Limited Results for the year ended June 30 2018
Notes
Audited Financial Results for the year ended June 30 2018
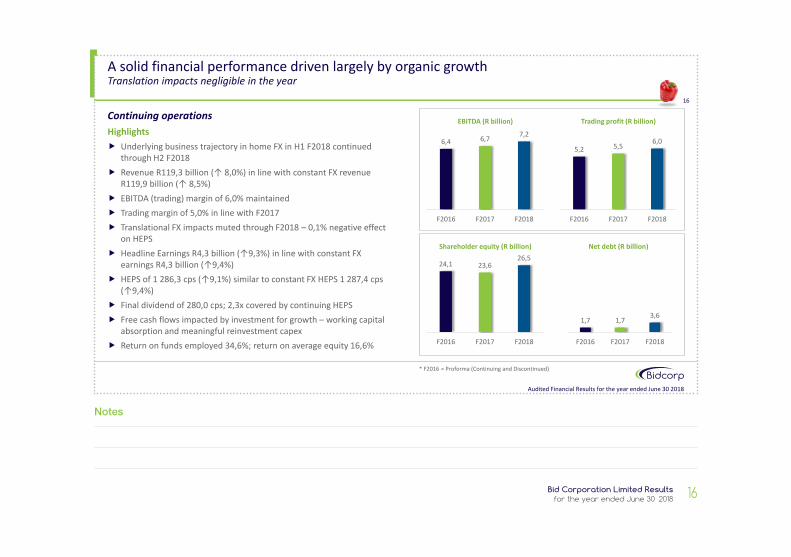
Continuing operationsHighlights Underlying business trajectory in home FX in H1 F2018 continued
through H2 F2018 Revenue R119,3 billion (↑ 8,0%) in line with constant FX revenue
R119,9 billion (↑ 8,5%) EBITDA (trading) margin of 6,0% maintained Trading margin of 5,0% in line with F2017 Translational FX impacts muted through F2018 – 0,1% negative effect
on HEPS Headline Earnings R4,3 billion (↑9,3%) in line with constant FX
earnings R4,3 billion (↑9,4%) HEPS of 1 286,3 cps (↑9,1%) similar to constant FX HEPS 1 287,4 cps
(↑9,4%) Final dividend of 280,0 cps; 2,3x covered by continuing HEPS Free cash flows impacted by investment for growth – working capital
absorption and meaningful reinvestment capex Return on funds employed 34,6%; return on average equity 16,6%
16
A solid financial performance driven largely by organic growth Translation impacts negligible in the year
6,4 6,7 7,2
F2016 F2017 F2018
EBITDA (R billion)
5,2 5,5 6,0
F2016 F2017 F2018
Trading profit (R billion)
24,1 23,626,5
F2016 F2017 F2018
Shareholder equity (R billion)
1,7 1,7 3,6
F2016 F2017 F2018
Net debt (R billion)
* F2016 = Proforma (Continuing and Discontinued)
17 Bid Corporation Limited Results for the year ended June 30 2018
Notes
Audited Financial Results for the year ended June 30 2018
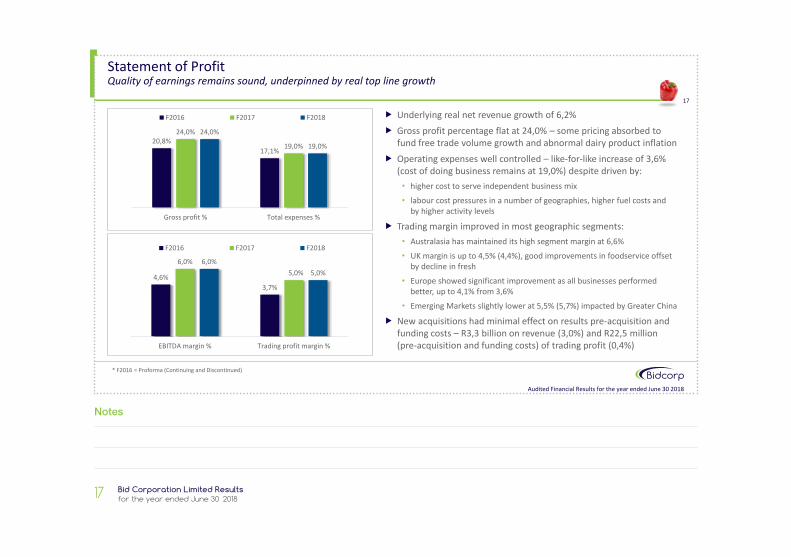
Underlying real net revenue growth of 6,2% Gross profit percentage flat at 24,0% – some pricing absorbed to
fund free trade volume growth and abnormal dairy product inflation Operating expenses well controlled – like-for-like increase of 3,6%
(cost of doing business remains at 19,0%) despite driven by:• higher cost to serve independent business mix• labour cost pressures in a number of geographies, higher fuel costs and
by higher activity levels
Trading margin improved in most geographic segments:• Australasia has maintained its high segment margin at 6,6% • UK margin is up to 4,5% (4,4%), good improvements in foodservice offset
by decline in fresh• Europe showed significant improvement as all businesses performed
better, up to 4,1% from 3,6% • Emerging Markets slightly lower at 5,5% (5,7%) impacted by Greater China
New acquisitions had minimal effect on results pre-acquisition and funding costs – R3,3 billion on revenue (3,0%) and R22,5 million (pre-acquisition and funding costs) of trading profit (0,4%)
17
Statement of Profit Quality of earnings remains sound, underpinned by real top line growth
20,8%17,1%
24,0%
19,0%
24,0%
19,0%
-4%
1%
6%
11%
16%
21%
26%
Gross profit % Total expenses %
F2016 F2017 F2018
4,6%3,7%
6,0%5,0%
6,0%5,0%
0%1%2%3%4%5%6%7%
EBITDA margin % Trading profit margin %
F2016 F2017 F2018
* F2016 = Proforma (Continuing and Discontinued)
18Bid Corporation Limited Results for the year ended June 30 2018
Notes
Audited Financial Results for the year ended June 30 2018
Net finance charges increased by 7,1% to R231,2 million
• Asset management is generally good with a few small exceptions
• Structural supply chain changes in Greater China, excess stocking in South Africa following the listeriosis outbreak
• Full year effects of term debt for Guzman (Spain, April 2017) & F2018 acquisitions (Germany, D&D (Italy), Portugal and other bolt-ons)
Effective tax rate (excluding associate income and capital items) is 23,7% (F2017: 24,7%) guiding to approximately 25% on average for the year (mix dependent)
Associates and Jointly Controlled entities share of profit is R52,4 million (Netherlands’ specialist businesses and 50% of Chipkins Puratos) and will remain small
Minority interests of R22,2 million are small and will remain a feature due to owner-managers often retaining a stake on acquisition
Capital items
• Net profit on disposal of end-of-life properties (Australia), impairment of intangibles (PCL and Brazil) and other individually insignificant items
Discontinued operation
• Poor trading results (contract rates and expenses, poor weather and lower consumer confidence in chain segment) combined with considerable restructuring(KFC exit & KFC onboarding; properties exits; fleet reductions and some legacy commercial contracts)
• Costs of exit largely accounted for, future costs likely to be small
18
Statement of Profit cont’dFinance charges, taxation, associates, minority interests, capital items and discontinued operation
19 Bid Corporation Limited Results for the year ended June 30 2018
Notes
Audited Financial Results for the year ended June 30 2018
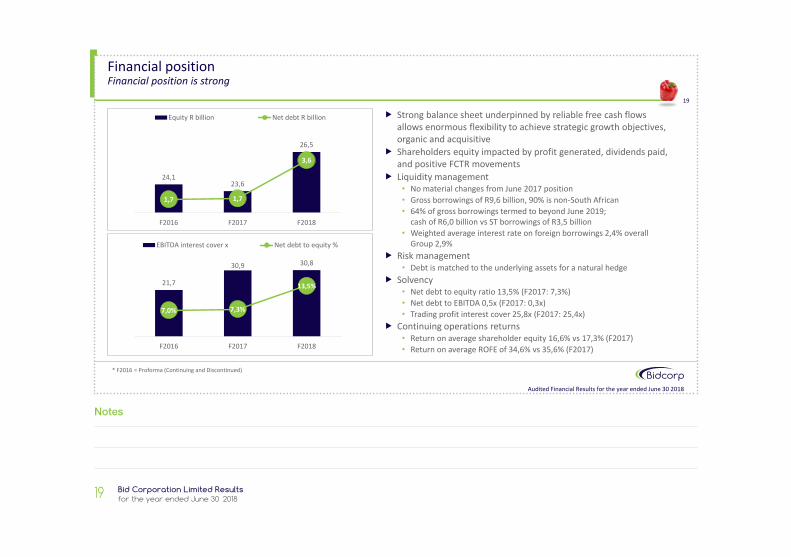
Strong balance sheet underpinned by reliable free cash flows allows enormous flexibility to achieve strategic growth objectives, organic and acquisitive
Shareholders equity impacted by profit generated, dividends paid, and positive FCTR movements
Liquidity management• No material changes from June 2017 position• Gross borrowings of R9,6 billion, 90% is non-South African• 64% of gross borrowings termed to beyond June 2019;
cash of R6,0 billion vs ST borrowings of R3,5 billion• Weighted average interest rate on foreign borrowings 2,4% overall
Group 2,9% Risk management
• Debt is matched to the underlying assets for a natural hedge Solvency
• Net debt to equity ratio 13,5% (F2017: 7,3%)• Net debt to EBITDA 0,5x (F2017: 0,3x)• Trading profit interest cover 25,8x (F2017: 25,4x)
Continuing operations returns• Return on average shareholder equity 16,6% vs 17,3% (F2017) • Return on average ROFE of 34,6% vs 35,6% (F2017)
19
Financial position Financial position is strong
24,123,6
26,5
1,7 1,7
3,6
1,01,52,02,53,03,54,04,55,0
22,0
23,0
24,0
25,0
26,0
27,0
28,0
F2016 F2017 F2018
Equity R billion Net debt R billion
21,7
30,9 30,8
7,0% 7,3%
13,5%
0%
5%
10%
15%
20%
0,05,0
10,015,020,025,030,035,0
F2016 F2017 F2018
EBITDA interest cover x Net debt to equity %
* F2016 = Proforma (Continuing and Discontinued)
20Bid Corporation Limited Results for the year ended June 30 2018
Notes
Audited Financial Results for the year ended June 30 2018
Cash generated from operations before working capital – R6,9 billion (F2017: R6,2 billion)• 96% of EBITDA (F2017: 93%) and 115% of trading profit (F2017: 113%)• Non cash items mainly comprise share based payments, profit on sale of properties and goodwill impairments
Working capital• Typical working capital cycle is for absorption in H1 (R1,9 billion absorbed) vs generation in H2 (R0,8 billion generated)• Generally well managed but some impacts in F2018:
• Structural – shifting business mix in GC; changed dairy supplier for China and longer supply chain on imported products• Activity levels – 8,0% revenue growth across Group• Some excess stocking in SA due to listeriosis outbreak• Acquisitions – D&D Italy (not in F2017 base), Germany and other bolt-ons
• Net average working capital cycle 11 days (F2017: 10 days) Cash effects of investing activities of R3,1 billion (F2017: R2,2 billion includes cash from sale of BVT shares and sale of 50% of Bakery)
• Stay-in-business (maintenance) capital expenditure of R1,5 billion compares with depreciation & amortisation of R1,2 billion (125% of D&A)• Expansion capital expenditure of R805,2 million (F2017: R980,0 million)• Acquisitions consumed R966 million, none of which are a singularly material business (F2017: R1,3 billion of which Guzman was the largest) • Proceeds on disposals relate to end of life properties in Australia
FCF from continuing operations (ex dividends) impacted by investment for growth – R1,0 billion or 0,9% of revenue (F2017: 1,8%) Cash and cash equivalents of R6,0 billion
20
Cash flows Cash flow remains consistent and investment in fixed assets and working capital continues to create necessary capacity for growth
21 Bid Corporation Limited Results for the year ended June 30 2018
Notes
Audited Financial Results for the year ended June 30 2018
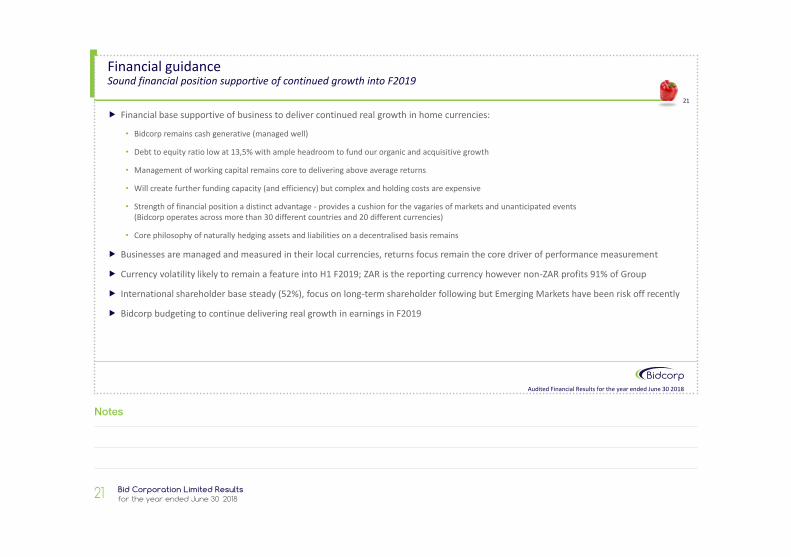
Financial base supportive of business to deliver continued real growth in home currencies:
• Bidcorp remains cash generative (managed well)
• Debt to equity ratio low at 13,5% with ample headroom to fund our organic and acquisitive growth
• Management of working capital remains core to delivering above average returns
• Will create further funding capacity (and efficiency) but complex and holding costs are expensive
• Strength of financial position a distinct advantage - provides a cushion for the vagaries of markets and unanticipated events (Bidcorp operates across more than 30 different countries and 20 different currencies)
• Core philosophy of naturally hedging assets and liabilities on a decentralised basis remains
Businesses are managed and measured in their local currencies, returns focus remain the core driver of performance measurement
Currency volatility likely to remain a feature into H1 F2019; ZAR is the reporting currency however non-ZAR profits 91% of Group
International shareholder base steady (52%), focus on long-term shareholder following but Emerging Markets have been risk off recently
Bidcorp budgeting to continue delivering real growth in earnings in F2019
21
Financial guidanceSound financial position supportive of continued growth into F2019

22Bid Corporation Limited Results for the year ended June 30 2018
Notes
Q&A

23 Bid Corporation Limited Results for the year ended June 30 2018
Notes
Supplementary informationOperations
24Bid Corporation Limited Results for the year ended June 30 2018
Notes
Audited Financial Results for the year ended June 30 2018
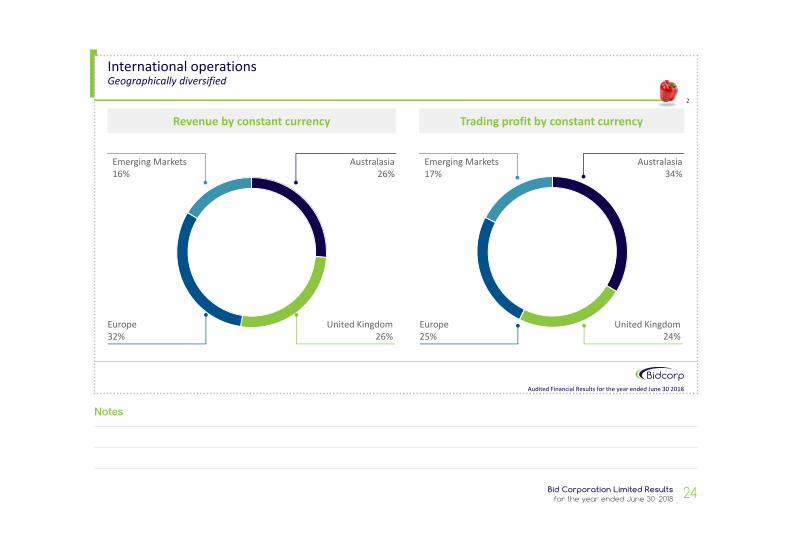
Trading profit by constant currency Revenue by constant currency
2
International operations Geographically diversified
Emerging Markets16%
Australasia26%
Europe32%
United Kingdom26%
Emerging Markets17%
Australasia34%
Europe25%
United Kingdom24%
25 Bid Corporation Limited Results for the year ended June 30 2018
Notes
Audited Financial Results for the year ended June 30 2018
Group overview Following a pleasing 2018 Bidcorp is budgeting for further growth in its 30th year
A pleasing year overall with record results from Australasia, UK, Europe and Africa Constant currency trading profit growth from continuing operations of 8,7% constitutes a good real improvement and was largely organic The ZAR/EUR was 3,0% weaker, the ZAR/AUD was 3,2% stronger and the ZAR/GBP was marginally stronger at 0,1% Whilst we report in South African rand as a Johannesburg Stock Exchange listed Group, all businesses are managed and measured in their
home currencies Acquisitions contributed R3,3 billion to Group revenue (3,0%) and R22,5 million (0,4%) to trading profit The annualised contribution of the acquisitions, assuming they had been in effect on July 1 2017, would be revenue of R4,6 billion and
trading profit of R56,9 million Trading margin continues to benefit from the clear strategic focus on foodservice and added value products We have a unequivocal commitment to decentralisation but shared learning is encouraged and a competitive advantage Outlook for 2019 Trading post year end has been encouraging although we continue to experience some headwinds in Asia As we embark on our thirtieth year in foodservice, we look back with satisfaction at what we have achieved and look forward to a
promising future
3
R’000sYear ended
June 30 2018Year ended
June 30 2017 ChangeRevenue (as reported in actual FX) 119 359 635 110 468 151 8,0%Trading profit (as reported in actual FX) 5 959 875 5 484 929 8,7%Trading margin 5,0% 5,0% 0,4%
26Bid Corporation Limited Results for the year ended June 30 2018
Notes
Audited Financial Results for the year ended June 30 2018
Operational features for Australia Foodservice 80% of total sales, complemented by imports (Supply Solutions), Fresh (produce), Meat and Liquor Foodservice now has 40 branches, all profitable; trading profit in line with the previous year, a very good achievement given the costs
and temporary disruption of the multi-site expansion strategy in Sydney, Melbourne and Brisbane Goldline, a wholesaler and distributor in Western Australia, has settled in well and adds to the regional presence Rapidly growing the range of high-quality imported products defined by place of origin that are directly sourced Fresh improved during H2; there are six stand-alone branches and whilst there are no plans for significant investment Fresh, along
with Meat, is an important service offering Outlook for 2019 Melbourne was the first city to invest in smaller, more service intensive branches with quicker order turnarounds and the results
at an early stage are excellent Supply Solutions is showing strong top-line growth and is also investigating additional manufacturing opportunities Bolt-ons will be assessed for suitability to fill geographic niches The team is not short on ideas for segments to exploit Bidcorp is strongly positioned in the three largest metropolitan areas of Australia and has a national footprint
4
AustralasiaWell-executed strategic initiatives enhance competitive advantage
27 Bid Corporation Limited Results for the year ended June 30 2018
Notes
Audited Financial Results for the year ended June 30 2018
Operational features for New Zealand Foodservice continued to perform well and maintained margins notwithstanding temporary additional costs as a result of DC expansions New DCs now occupied in Hamilton, Nelson, Greymouth, Timaru and Invercargill, whilst the Fresh site in Christchurch has been expanded New Plymouth, Christchurch and North Auckland are planned to come on stream by mid-2019 and further new sites have been
identified for development Fresh, Logistics and Processing have grown to 26% of total profit and the range of imported products continues to expand IT is playing a significant roll in the business and a key competitive advantage Substantial investment in processing in Auckland creates capacity to boost sales in this important market The business now supplies 18,000 SKUs to a similar number of customers from 30 facilities staffed by over 2,000 employees Outlook for 2019 In 18 years sales have grown to NZD 1,1 billion and have doubled in the last seven years Whilst Bidcorp retains ambitious targets we are not complacent in a competitive landscape The good base of profitability and cash flow provides the wherewithal to invest vigorously in a modern infrastructure Labour remains a challenge as there is a high level of employment, solid economic growth, competition for staff and thus wage pressure
5
AustralasiaInvesting for sustainability in New Zealand
28Bid Corporation Limited Results for the year ended June 30 2018
Notes
Audited Financial Results for the year ended June 30 2018
Operational features for United Kingdom Sales and trading profit exceeded budget in a tough environment, including ‘chain’ restaurant failures, assisted by a heathy mix
of trade sectors F2018 was a year of sizeable capex and improving infrastructure is a key focus with at least seven projects on the drawing board Ecommerce sales are increasing sharply in freetrade and national accounts Drive to own brand has seen sales rise to an annual £325 million, up 20% in only two years and accounting for 30% of volume The Fresh business, with £250 million in sales, can be challenging but it is a key offering; customers seek high quality with good
provenance and the growing average spend per customer Outlook for 2019 2018 was a good year for Foodservice, profits have doubled in four years Fresh has set a good platform for renewed growth Remaining cautious about risks associated with Brexit With the UK Contract Distribution (CD) business exit, there is now total focus on Foodservice and Fresh
6
United Kingdom Outperforming in a tough and currently uncertain environment
29 Bid Corporation Limited Results for the year ended June 30 2018
Notes
Audited Financial Results for the year ended June 30 2018
Operational features for Europe Netherlands is beginning to reap the benefits of the slow but methodical switch in the sales mix; HORECA and national accounts showing
strong real growth with Q4 particularly buoyant; further investment in associates Farm Fresh and Vanilla Venture Belgium achieved a record profit and is focused on growing HORECA trade Italy is now a €500 million sales territory and has significant potential as the multi-site strategy unfolds The Guzmán business in Spain has grappled with some operational issues but Bidcorp sees the Spanish market as promising In Czech HORECA sales increased by 8% whilst in Slovakia the increase was 9,7%; the Opava and Kralupy factories are operating to full
capacity, retail demand is buoyant, whilst positive demographic and economic factors are supportive of HORECA In Poland freetrade is now 73% of total sales, wage pressures in a tight labour market Restructuring of the Baltics business is going well with foodservice sales growing strongly; ‘myBidfood’ launched; new facilities in F2019 Outlook for 2019 Eastern Europe performing to a high level assisted by good management, modern facilities, value added processing and economic factors Netherlands and Belgium are expected to make further progress, benefitting from improved execution on the long-term strategy Italy is well poised for a good growth over the next few years through expansion of the geographic footprint and bolt-on acquisitions Acquisitions are on the radar but nothing significant; in Germany, the strategy will be to settle down Pier 7, learn and then grow in
Europe’s largest market
7
EuropeItaly performing very well, Czech/Slovakia and Poland continue to excel, Belgium achieves a milestone result
30Bid Corporation Limited Results for the year ended June 30 2018
Notes
Audited Financial Results for the year ended June 30 2018
Operational features for Emerging Markets South Africa is operating at world-class levels in foodservice; own brand now 33% of the mix; over 60% of orders from on-line sales
(‘myBidfood’) supported by electronic payment; technology harnessed to track vehicle deliveries boosting efficiency and customer satisfaction. Chipkins Puratos JV performing well. Crown managed growth despite being impacted by the listeriosis outbreak, impacting working capital
FX volatility currently a challenge in China as the business is funded out of Hong Kong; the product mix continues to grow and will be better balanced in future, with value-add a growing component; a substantial logistics, branch infrastructure, technical and distribution capability is being developed as on-the-ground presence spreads outside the major cities of Shenzhen, Beijing, Guangzhou and Shanghai
Hong Kong is a sophisticated and solid business and the springboard into China Malaysia and the entry into Vietnam (through partnership) is in line with the cautious regional expansion strategy Latin America is a small market for Bidcorp currently (big potential) with Chile and Brazil providing good learnings Outlook for 2019 The South African team is operating well in a difficult and slow economy but focused on delivering;
the Chipkins Puratos JV is making good progress Despite challenges, both internal and external, this segment offers good organic and acquisitive potential
8
Emerging MarketsGood organic and acquisitive potential
31 Bid Corporation Limited Results for the year ended June 30 2018
Notes
Audited Financial Results for the year ended June 30 2018
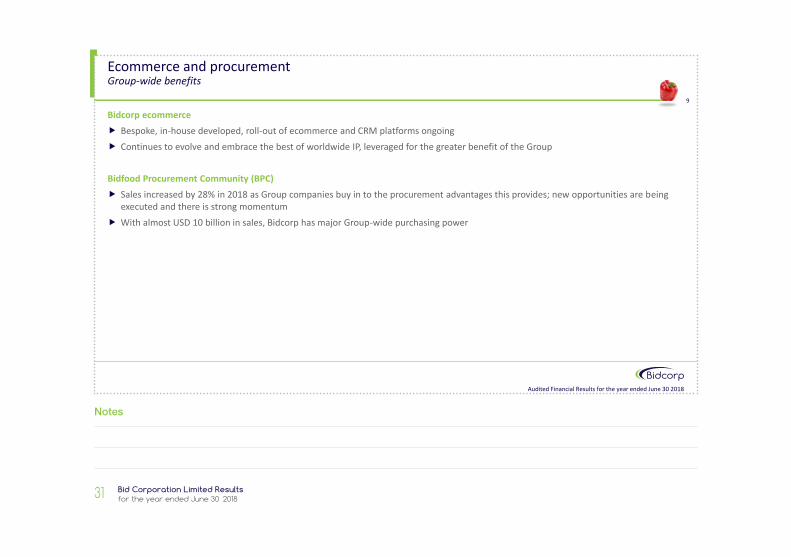
Bidcorp ecommerce Bespoke, in-house developed, roll-out of ecommerce and CRM platforms ongoing Continues to evolve and embrace the best of worldwide IP, leveraged for the greater benefit of the Group
Bidfood Procurement Community (BPC) Sales increased by 28% in 2018 as Group companies buy in to the procurement advantages this provides; new opportunities are being
executed and there is strong momentum With almost USD 10 billion in sales, Bidcorp has major Group-wide purchasing power
9
Ecommerce and procurementGroup-wide benefits

32Bid Corporation Limited Results for the year ended June 30 2018
Notes
Supplementary informationBidcorp segment profits detail
33 Bid Corporation Limited Results for the year ended June 30 2018
Notes
Audited Financial Results for the year ended June 30 2018
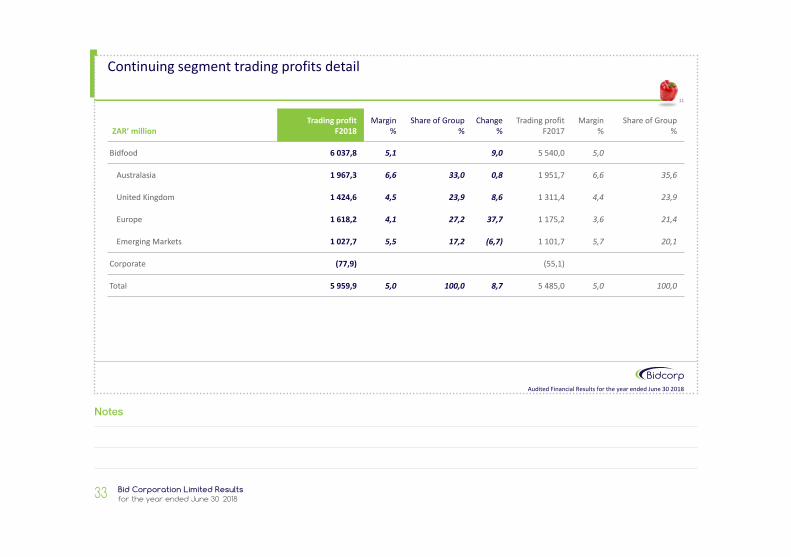
ZAR’ millionTrading profit
F2018Margin
%Share of Group
%Change
%Trading profit
F2017Margin
%Share of Group
%
Bidfood 6 037,8 5,1 9,0 5 540,0 5,0
Australasia 1 967,3 6,6 33,0 0,8 1 951,7 6,6 35,6
United Kingdom 1 424,6 4,5 23,9 8,6 1 311,4 4,4 23,9
Europe 1 618,2 4,1 27,2 37,7 1 175,2 3,6 21,4
Emerging Markets 1 027,7 5,5 17,2 (6,7) 1 101,7 5,7 20,1
Corporate (77,9) (55,1)
Total 5 959,9 5,0 100,0 8,7 5 485,0 5,0 100,0
11
Continuing segment trading profits detail
34Bid Corporation Limited Results for the year ended June 30 2018
Notes
Audited Financial Results for the year ended June 30 2018
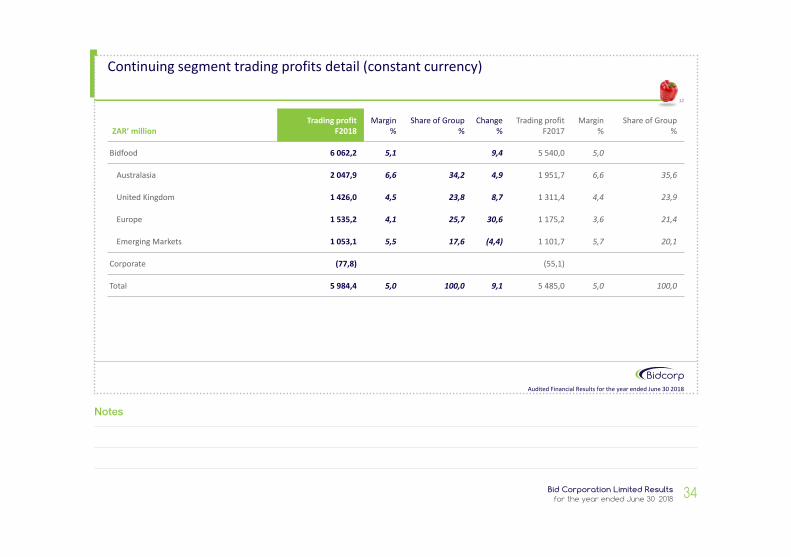
Continuing segment trading profits detail (constant currency)
ZAR’ millionTrading profit
F2018Margin
%Share of Group
%Change
%Trading profit
F2017Margin
%Share of Group
%
Bidfood 6 062,2 5,1 9,4 5 540,0 5,0
Australasia 2 047,9 6,6 34,2 4,9 1 951,7 6,6 35,6
United Kingdom 1 426,0 4,5 23,8 8,7 1 311,4 4,4 23,9
Europe 1 535,2 4,1 25,7 30,6 1 175,2 3,6 21,4
Emerging Markets 1 053,1 5,5 17,6 (4,4) 1 101,7 5,7 20,1
Corporate (77,8) (55,1)
Total 5 984,4 5,0 100,0 9,1 5 485,0 5,0 100,0
12

35 Bid Corporation Limited Results for the year ended June 30 2018
Notes
Supplementary informationFinancial analysis
36Bid Corporation Limited Results for the year ended June 30 2018
Notes
Audited Financial Results for the year ended June 30 2018
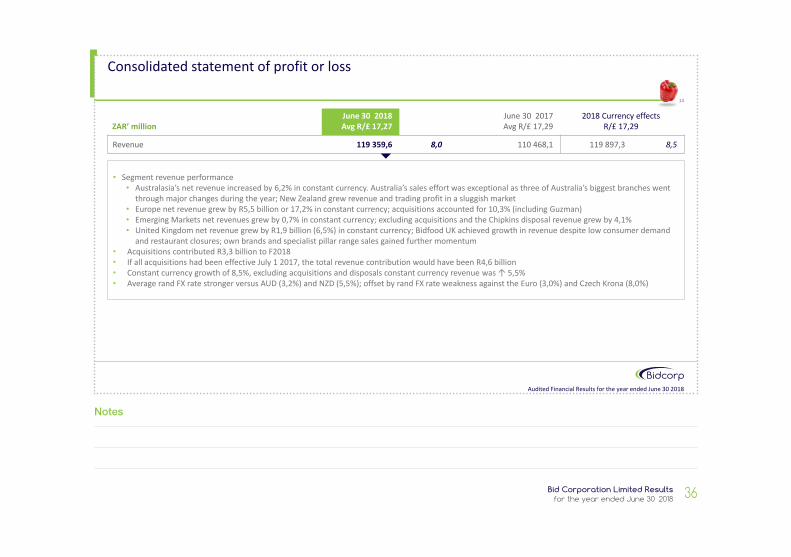
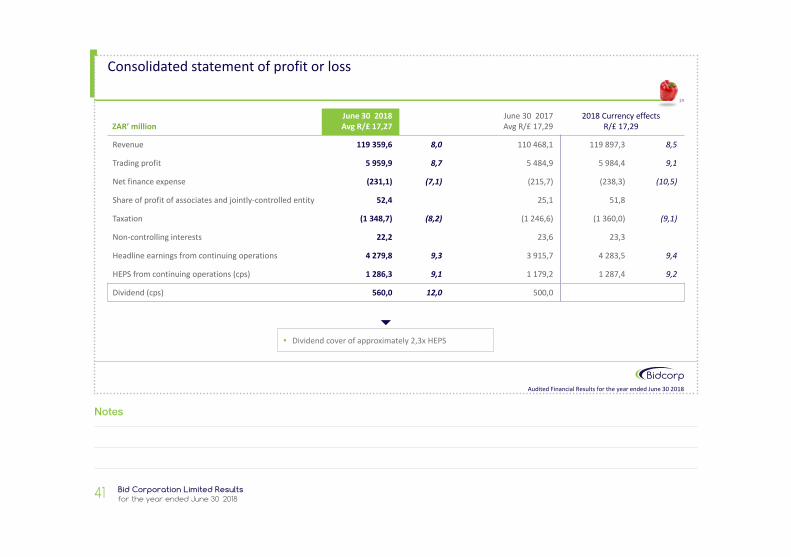
ZAR’ millionJune 30 2018Avg R/£ 17,27
June 30 2017Avg R/£ 17,29
2018 Currency effectsR/£ 17,29
Revenue 119 359,6 8,0 110 468,1 119 897,3 8,5
14
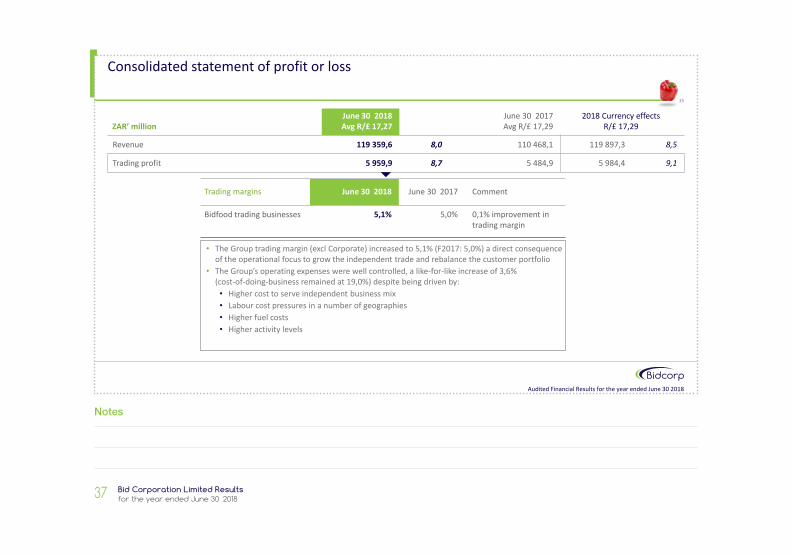
Consolidated statement of profit or loss
• Segment revenue performance• Australasia’s net revenue increased by 6,2% in constant currency. Australia’s sales effort was exceptional as three of Australia’s biggest branches went
through major changes during the year; New Zealand grew revenue and trading profit in a sluggish market• Europe net revenue grew by R5,5 billion or 17,2% in constant currency; acquisitions accounted for 10,3% (including Guzman)• Emerging Markets net revenues grew by 0,7% in constant currency; excluding acquisitions and the Chipkins disposal revenue grew by 4,1%• United Kingdom net revenue grew by R1,9 billion (6,5%) in constant currency; Bidfood UK achieved growth in revenue despite low consumer demand
and restaurant closures; own brands and specialist pillar range sales gained further momentum• Acquisitions contributed R3,3 billion to F2018• If all acquisitions had been effective July 1 2017, the total revenue contribution would have been R4,6 billion• Constant currency growth of 8,5%, excluding acquisitions and disposals constant currency revenue was ↑ 5,5%• Average rand FX rate stronger versus AUD (3,2%) and NZD (5,5%); offset by rand FX rate weakness against the Euro (3,0%) and Czech Krona (8,0%)
37 Bid Corporation Limited Results for the year ended June 30 2018
Notes
Audited Financial Results for the year ended June 30 2018
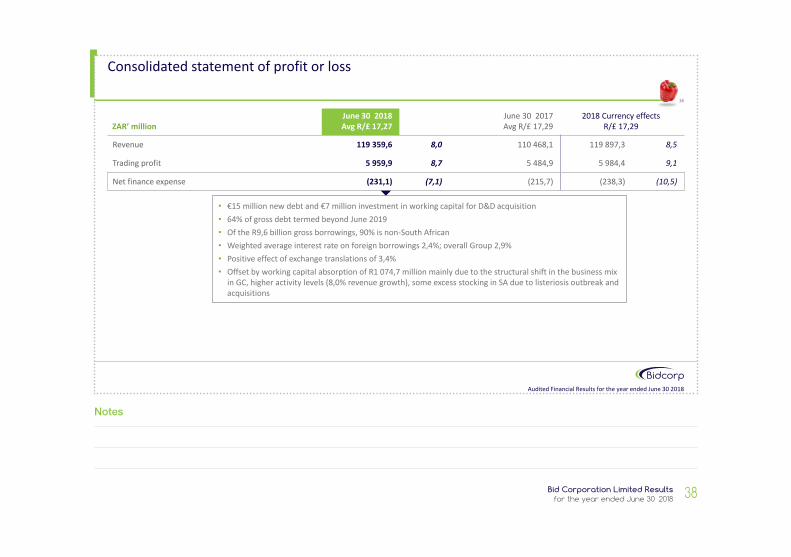
Consolidated statement of profit or loss
ZAR’ millionJune 30 2018Avg R/£ 17,27
June 30 2017Avg R/£ 17,29
2018 Currency effectsR/£ 17,29
Revenue 119 359,6 8,0 110 468,1 119 897,3 8,5
Trading profit 5 959,9 8,7 5 484,9 5 984,4 9,1
15
• The Group trading margin (excl Corporate) increased to 5,1% (F2017: 5,0%) a direct consequence of the operational focus to grow the independent trade and rebalance the customer portfolio
• The Group’s operating expenses were well controlled, a like-for-like increase of 3,6% (cost-of-doing-business remained at 19,0%) despite being driven by: • Higher cost to serve independent business mix• Labour cost pressures in a number of geographies• Higher fuel costs• Higher activity levels
Trading margins June 30 2018 June 30 2017 Comment
Bidfood trading businesses 5,1% 5,0% 0,1% improvement in trading margin
38Bid Corporation Limited Results for the year ended June 30 2018
Notes
Audited Financial Results for the year ended June 30 2018
Consolidated statement of profit or loss
ZAR’ millionJune 30 2018Avg R/£ 17,27
June 30 2017Avg R/£ 17,29
2018 Currency effectsR/£ 17,29
Revenue 119 359,6 8,0 110 468,1 119 897,3 8,5
Trading profit 5 959,9 8,7 5 484,9 5 984,4 9,1
Net finance expense (231,1) (7,1) (215,7) (238,3) (10,5)
16
• €15 million new debt and €7 million investment in working capital for D&D acquisition • 64% of gross debt termed beyond June 2019• Of the R9,6 billion gross borrowings, 90% is non-South African• Weighted average interest rate on foreign borrowings 2,4%; overall Group 2,9%• Positive effect of exchange translations of 3,4%• Offset by working capital absorption of R1 074,7 million mainly due to the structural shift in the business mix
in GC, higher activity levels (8,0% revenue growth), some excess stocking in SA due to listeriosis outbreak and acquisitions
39 Bid Corporation Limited Results for the year ended June 30 2018
Notes
Audited Financial Results for the year ended June 30 2018
Consolidated statement of profit or loss
ZAR’ millionJune 30 2018Avg R/£ 17,27
June 30 2017Avg R/£ 17,29
2018 Currency effectsR/£ 17,29
Revenue 119 359,6 8,0 110 468,1 119 897,3 8,5
Trading profit 5 959,9 8,7 5 484,9 5 984,4 9,1
Net finance expense (231,1) (7,1) (215,7) (238,3) (10,5)
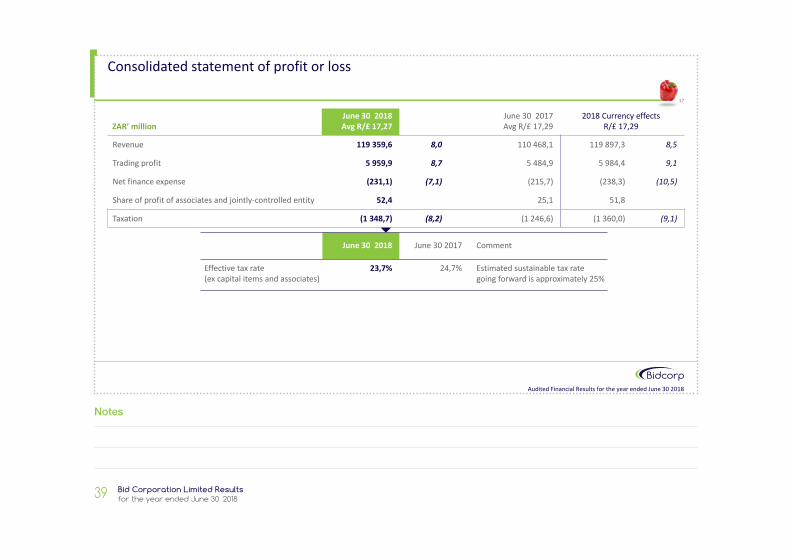
Share of profit of associates and jointly-controlled entity 52,4 25,1 51,8
Taxation (1 348,7) (8,2) (1 246,6) (1 360,0) (9,1)
17
June 30 2018 June 30 2017 Comment
Effective tax rate(ex capital items and associates)
23,7% 24,7% Estimated sustainable tax rate going forward is approximately 25%
40Bid Corporation Limited Results for the year ended June 30 2018
Notes
Audited Financial Results for the year ended June 30 2018
Consolidated statement of profit or loss
ZAR’ millionJune 30 2018Avg R/£ 17,27
June 30 2017Avg R/£ 17,29
2018 Currency effectsR/£ 17,29
Revenue 119 359,6 8,0 110 468,1 119 897,3 8,5
Trading profit 5 959,9 8,7 5 484,9 5 984,4 9,1
Net finance expense (231,1) (7,1) (215,7) (238,3) (10,5)
Share of profit of associates and jointly-controlled entity 52,4 25,1 51,8
Taxation (1 348,7) (8,2) (1 246,6) (1 360,0) (9,1)
Non-controlling interests 22,2 23,6 23,3
Headline earnings from continuing operations 4 279,8 9,3 3 915,7 4 283,5 9,4
HEPS from continuing operations (cps) 1 286,3 9,1 1 179,2 1 287,4 9,2
18
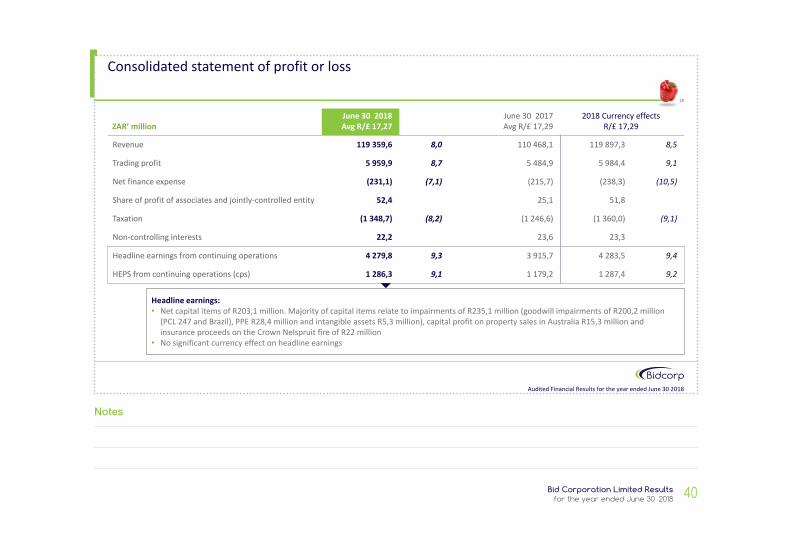
Headline earnings:• Net capital items of R203,1 million. Majority of capital items relate to impairments of R235,1 million (goodwill impairments of R200,2 million
(PCL 247 and Brazil), PPE R28,4 million and intangible assets R5,3 million), capital profit on property sales in Australia R15,3 million and insurance proceeds on the Crown Nelspruit fire of R22 million
• No significant currency effect on headline earnings
41 Bid Corporation Limited Results for the year ended June 30 2018
Notes
Audited Financial Results for the year ended June 30 2018
Consolidated statement of profit or loss
ZAR’ millionJune 30 2018Avg R/£ 17,27
June 30 2017Avg R/£ 17,29
2018 Currency effectsR/£ 17,29
Revenue 119 359,6 8,0 110 468,1 119 897,3 8,5
Trading profit 5 959,9 8,7 5 484,9 5 984,4 9,1
Net finance expense (231,1) (7,1) (215,7) (238,3) (10,5)
Share of profit of associates and jointly-controlled entity 52,4 25,1 51,8
Taxation (1 348,7) (8,2) (1 246,6) (1 360,0) (9,1)
Non-controlling interests 22,2 23,6 23,3
Headline earnings from continuing operations 4 279,8 9,3 3 915,7 4 283,5 9,4
HEPS from continuing operations (cps) 1 286,3 9,1 1 179,2 1 287,4 9,2
Dividend (cps) 560,0 12,0 500,0
19
• Dividend cover of approximately 2,3x HEPS
42Bid Corporation Limited Results for the year ended June 30 2018
Notes
Audited Financial Results for the year ended June 30 2018
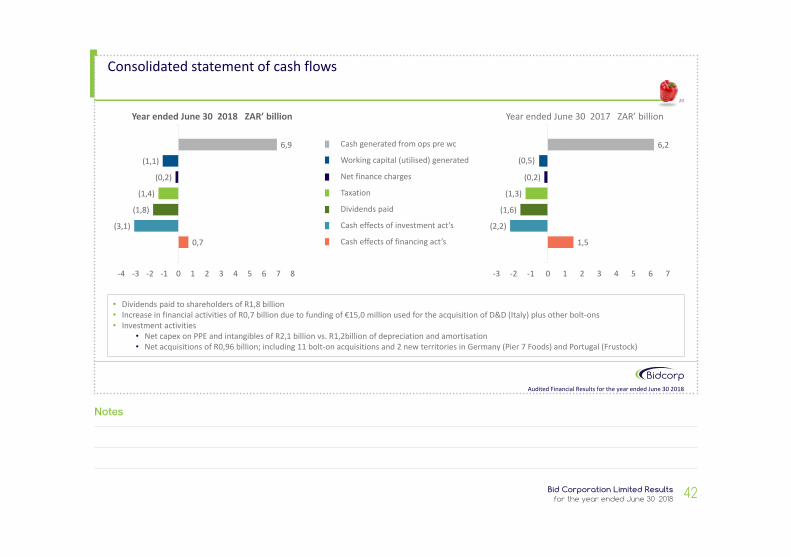
1,5
(2,2)
(1,6)
(1,3)
(0,2)
(0,5)
6,2
-3 -2 -1 0 1 2 3 4 5 6 7
Consolidated statement of cash flows
20
0,7
(3,1)
(1,8)
(1,4)
(0,2)
(1,1)
6,9
-4 -3 -2 -1 0 1 2 3 4 5 6 7 8
Year ended June 30 2018 ZAR’ billion
Cash generated from ops pre wc
Working capital (utilised) generated
Net finance charges
Taxation
Dividends paid
Cash effects of investment act’s
Cash effects of financing act’s
Year ended June 30 2017 ZAR’ billion
• Dividends paid to shareholders of R1,8 billion• Increase in financial activities of R0,7 billion due to funding of €15,0 million used for the acquisition of D&D (Italy) plus other bolt-ons• Investment activities
• Net capex on PPE and intangibles of R2,1 billion vs. R1,2billion of depreciation and amortisation• Net acquisitions of R0,96 billion; including 11 bolt-on acquisitions and 2 new territories in Germany (Pier 7 Foods) and Portugal (Frustock)
43 Bid Corporation Limited Results for the year ended June 30 2018
Notes
Audited Financial Results for the year ended June 30 2018
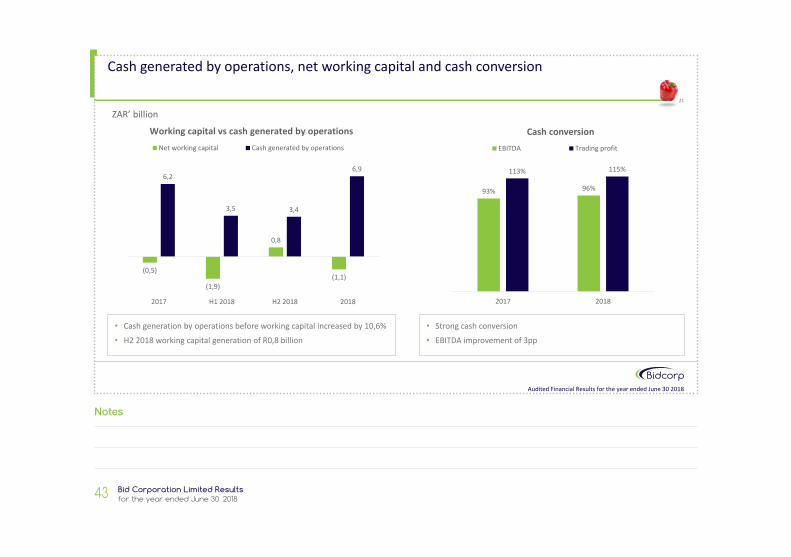
(0,5)
(1,9)
0,8
(1,1)
6,2
3,5 3,4
6,9
2017 H1 2018 H2 2018 2018
Net working capital Cash generated by operations
Working capital vs cash generated by operations
93% 96%
113% 115%
2017 2018
Cash conversionEBITDA Trading profit
Cash generated by operations, net working capital and cash conversion
21
• Strong cash conversion• EBITDA improvement of 3pp
ZAR’ billion
• Cash generation by operations before working capital increased by 10,6% • H2 2018 working capital generation of R0,8 billion
44Bid Corporation Limited Results for the year ended June 30 2018
Notes
Audited Financial Results for the year ended June 30 2018
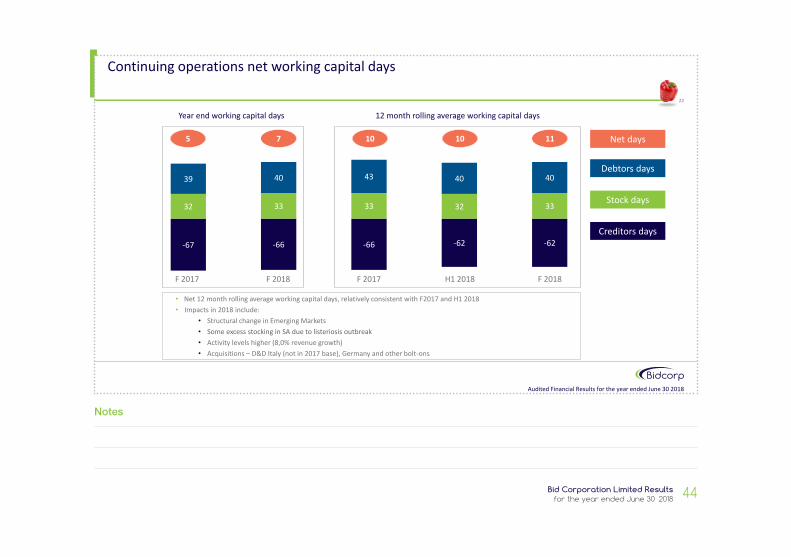
-67 -66 -66 -62 -62
32 33 33 32 33
39 40 43 40 40
Continuing operations net working capital days
22
10 10 11
Debtors days
Stock days
Creditors days
Net days
• Net 12 month rolling average working capital days, relatively consistent with F2017 and H1 2018• Impacts in 2018 include:
• Structural change in Emerging Markets• Some excess stocking in SA due to listeriosis outbreak• Activity levels higher (8,0% revenue growth)• Acquisitions – D&D Italy (not in 2017 base), Germany and other bolt-ons
5 7
Year end working capital days 12 month rolling average working capital days
F 2017 F 2018 F 2017 H1 2018 F 2018
45 Bid Corporation Limited Results for the year ended June 30 2018
Notes
Audited Financial Results for the year ended June 30 2018
Target interest cover range 5x – 6x
1,7 3,4 3,6
25,4
22,1
25,8
10,0
12,0
14,0
16,0
18,0
20,0
22,0
24,0
26,0
28,0
F 2017 H1 2018 20180,00,51,01,52,02,53,03,54,04,55,0
Net interest-bearing debt (ZAR' bn) Interest cover (x)
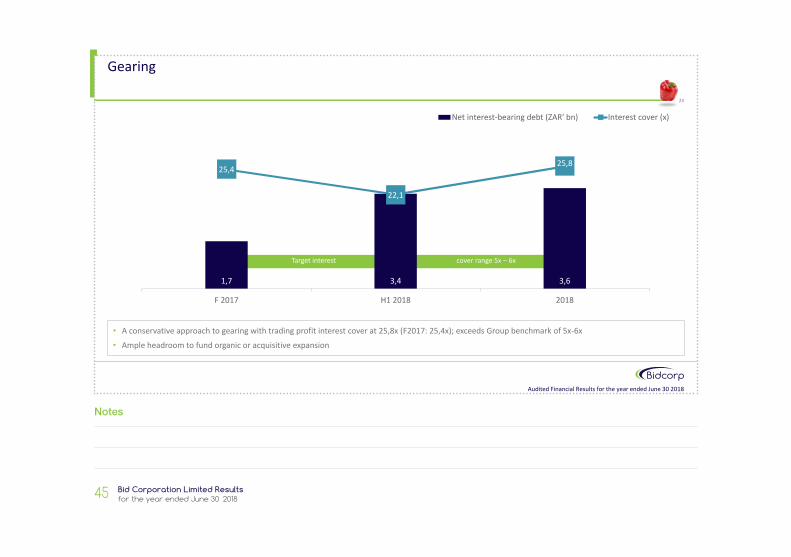
Gearing
23
• A conservative approach to gearing with trading profit interest cover at 25,8x (F2017: 25,4x); exceeds Group benchmark of 5x-6x• Ample headroom to fund organic or acquisitive expansion
46Bid Corporation Limited Results for the year ended June 30 2018
Notes
Supplementary informationBidcorp historical results
47 Bid Corporation Limited Results for the year ended June 30 2018
Notes
Audited Financial Results for the year ended June 30 2018
25
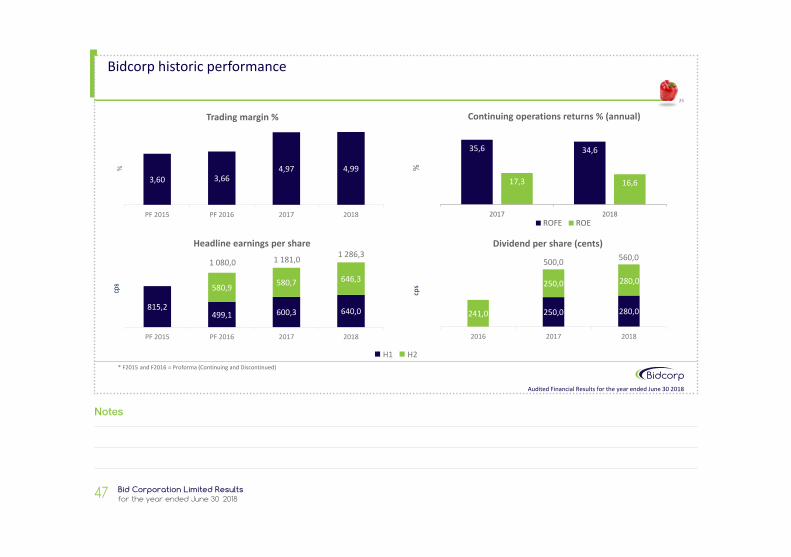
Bidcorp historic performance
35,6 34,6
17,3 16,6
2017 2018
%
Continuing operations returns % (annual)
ROFE ROE
3,60 3,664,97 4,99
PF 2015 PF 2016 2017 2018
%Trading margin %
241,0 250,0 280,0
250,0
2016 2017 2018
cps
Dividend per share (cents)
500,0 560,0
280,0
499,1 600,3 640,0815,2
580,9 580,7 646,3
PF 2015 PF 2016 2017 2018
cps
Headline earnings per share1 286,31 181,01 080,0
H1 H2* F2015 and F2016 = Proforma (Continuing and Discontinued)


www.bidcorpgroup.com