Embed Size (px)
DESCRIPTION
Bicycle Fatalities
Citation preview
F1 Bicyclist Fatalities and Serious Injuries in New York City
Bicyclist Fatalities and
Serious Injuries in New York City
1996-2005
A Joint Report from the
New York City Departments of Health and Mental Hygiene,
Parks and Recreation, Transportation, and the New York City Police Department
Table of Contents
Letter from the Commissioners . . . . . . . . . . . . . . . . . . . . . . . . . . . . . . . . . . . . . . . .1
Key Findings . . . . . . . . . . . . . . . . . . . . . . . . . . . . . . . . . . . . . . . . . . . . . . . . . . . . . . .2
Introduction . . . . . . . . . . . . . . . . . . . . . . . . . . . . . . . . . . . . . . . . . . . . . . . . . . . . . . . .3
Methods . . . . . . . . . . . . . . . . . . . . . . . . . . . . . . . . . . . . . . . . . . . . . . . . . . . . . . . . .4
Bicycling in New York City . . . . . . . . . . . . . . . . . . . . . . . . . . . . . . . . . . . . . . . . . . . .4
Bicycling Infrastructure, Promotion and
Safety Initiatives in New York City . . . . . . . . . . . . . . . . . . . . . . . . . . . . . . . . . . . . . .6
Results
Bicyclist Fatalities . . . . . . . . . . . . . . . . . . . . . . . . . . . . . . . . . . . . . . . . . . . . . . . . . . . .8
Overview . . . . . . . . . . . . . . . . . . . . . . . . . . . . . . . . . . . . . . . . . . . . . . . . . . . . . .8
Non-traffic Deaths . . . . . . . . . . . . . . . . . . . . . . . . . . . . . . . . . . . . . . . . . . . . . .10
Traffic Deaths . . . . . . . . . . . . . . . . . . . . . . . . . . . . . . . . . . . . . . . . . . . . . . . . .10
Location of Fatal Crashes . . . . . . . . . . . . . . . . . . . . . . . . . . . . . . . . . . . .10
Time of Fatal Crashes . . . . . . . . . . . . . . . . . . . . . . . . . . . . . . . . . . . . . . .14
Characteristics of Fatal Crashes . . . . . . . . . . . . . . . . . . . . . . . . . . . . . . .15
Non-fatal Bicyclist Injuries . . . . . . . . . . . . . . . . . . . . . . . . . . . . . . . . . . . . . . . . . . . . .22
Overview . . . . . . . . . . . . . . . . . . . . . . . . . . . . . . . . . . . . . . . . . . . . . . . . . . . . .22
Location of Crashes . . . . . . . . . . . . . . . . . . . . . . . . . . . . . . . . . . . . . . . . . . . . .23
Time of Crashes . . . . . . . . . . . . . . . . . . . . . . . . . . . . . . . . . . . . . . . . . . . . . . . .26
Characteristics of Crashes . . . . . . . . . . . . . . . . . . . . . . . . . . . . . . . . . . . . . . . .27
Discussion
Summary . . . . . . . . . . . . . . . . . . . . . . . . . . . . . . . . . . . . . . . . . . . . . . . . . . . . . . . . . .30
Limitations . . . . . . . . . . . . . . . . . . . . . . . . . . . . . . . . . . . . . . . . . . . . . . . . . . . . . . . . .30
Recommendations . . . . . . . . . . . . . . . . . . . . . . . . . . . . . . . . . . . . . . . . . . . . . . . . . .31
Action Steps . . . . . . . . . . . . . . . . . . . . . . . . . . . . . . . . . . . . . . . . . . . . . . . . . . . . . . .32
Technical Appendix . . . . . . . . . . . . . . . . . . . . . . . . . . . . . . . . . . . . . . . . . . . . . . . . .35
Resources . . . . . . . . . . . . . . . . . . . . . . . . . . . . . . . . . . . . . . . . . . . . . . . . . . . . . . . .36
1Bicyclist Fatalities and Serious Injuries in New York City
Letter from the Commissioners
Dear Fellow New Yorker:
Bicycling is good for New York City! It offers many benefits to many New Yorkers:
• Recreation and sport
• Regular physical activity to improve fitness and health
• An easy and relatively inexpensive way to get to work or school
• A mode of transportation that reduces road congestion and cuts down on pollution
• For messengers and delivery people, a means of employment itself
The City of New York is committed to improving bicycle and traffic safety for all New Yorkers. Bicyclist Fatalities and
Serious Injuries in New York City: 1996–2005 is a collaborative project by the City’s health, parks and recreation,
transportation, and police departments to better understand, and ultimately improve, bicycle safety for the thousands
of New Yorkers who ride on our streets every day.
This report identifies specific safety challenges for bicycling in New York City and offers recommendations for motor
vehicle drivers, bicyclists, health care providers, and others. It also outlines action steps the City will take to increase
bicycling and improve safety. Working together with motorists, bicyclists, bicycle advocacy groups, community groups,
health care providers, and other partners, New York City can become an even better place to ride.
Adrian Benepe Thomas R. Frieden, MD, MPH
Commissioner, Commissioner,
NYC Department of Parks NYC Department of Health & Recreation and Mental Hygiene
Raymond W. Kelly
Commissioner,
NYC Police Department
Iris Weinshall
Commissioner,
NYC Department of Transportation
2 Bicyclist Fatalities and Serious Injuries in New York City
Key Findings
1. While bicyclist injuries declined between 1996 and 2003, fatalities remained steady.
• Between 1996 and 2003, a total of 3,462 NYC bicyclists were seriously injured in crashes with motor vehicles.
The annual number of serious bicyclist injuries decreased by 46% during the 8-year period.
• Between 1996 and 2005, 225 bicyclists died in crashes. Bicyclist deaths remained steady during the 10-year period.
2. Bicyclist fatality rates in New York City are similar to national rates, though NYC has higher rates of cycling for transportation.
• The bicyclist fatality rate for NYC is similar to the national rate – 2.8 compared to 2.7 per one million residents.
• Census data show that many more NYC adults (11% vs. 3%) walk or bicycle to work compared to the national average.
3. Nearly all bicyclist fatalities (92%) occurred as a result of crashes with motor vehicles.
• Most crashes (89%) occurred at or near intersections.
• Although they make up only 5–17% of vehicles on NYC roadways, large vehicles (trucks, buses) accounted
for almost one third (32%) of fatalities.
• Nearly all (94%) fatalities involved poor driving or bicycle riding practices, particularly driver inattention and
disregarding traffic signals and signs.
• Although there are many more miles of local roads, more than half of fatal crashes occurred on arterial (large,
four lane) roads (53%).
• 7% of fatal crashes occurred on limited access highways, where bicycling is prohibited.
4. Bicycle lanes and properly used bicycle equipment may reduce the risk of fatalities.
• Only one fatal crash with a motor vehicle occurred when a bicyclist was in a marked bicycle lane.
• Nearly all bicyclists who died (97%) were not wearing a helmet.
• Most fatal crashes (74%) involved a head injury.
5. Nine possible fatality clusters were identified.
• Three locations where fatalities occurred in closest proximity were found in the east side of Manhattan north of
midtown, Park Slope in Brooklyn, and Hunts Point in the Bronx.
• Locations where injuries occurred in close proximity were found in Midtown Manhattan, the northern sides of
Central Park, and Central Bronx.
6. Men and children face particular challenges.
• Most bicyclists who died were male (91%), and men aged 45–54 had the highest death rate (8.3 per million) per
age group.
• Among children aged 5–14, the death rate for boys was more than five times higher than for girls; Queens had the
highest child bicyclist death rate of the five boroughs (3.2 child deaths per million, compared to 2.1 child deaths
per million citywide).
3Bicyclist Fatalities and Serious Injuries in New York City
IntroductionNew York City (NYC) is a unique urban environment. Population density, limited parking, and a sophisticated public
transportation system all discourage car use. As a result, compared to the rest of the nation, New Yorkers are more
likely to take buses and trains, walk and ride bicycles. Of major U.S. cities, NYC has one of the highest proportions of
residents who walk or bicycle for basic transportation purposes.
Many New Yorkers ride bicycles to work—bicycling as a means of transportation reduces road congestion and motor-
vehicle related pollution. Other New Yorkers ride for recreation and to improve health and fitness. Regular bicycling
helps maintain healthy weight and reduces the risk of cardiovascular disease and many other diseases. Increasing
bicycling in New York City has many potential health and environmental benefits. Whether for transportation, exercise,
or recreation, bicycling is good for New Yorkers. As part of the City’s commitment to promote bicycle use and ensure
a safe environment for bicyclists, the New York City Departments of Health and Mental Hygiene (DOHMH), Parks and
Recreation (DPR), Transportation (DOT), and the Police Department (NYPD) have analyzed fatal bicycle crashes from
1996 through 2005, along with data on traffic-related bicycle crashes resulting in serious injury between 1996 and
2003 (the most recent year for which injury data are available).
This report reviews bicyclist, motorist, and vehicle characteristics, crash locations, and types of injuries. A comprehensive
review of available data is an important step towards improving bicycle safety and ultimately increasing bicycling.
However, conclusions must be drawn with an understanding of the strengths and limitations of the data sources.
Without comprehensive information on crash circumstances and accurate data on the number of bicyclists, it is difficult
to know the true risk associated with particular bicycling or motorist practices. Nevertheless, this report summarizes
important information on factors that played a role in the deaths of more than 200 bicyclists over the past 10 years and
more than 3,000 serious injuries over an eight year period, providing a strong base for recommendations to support a
safer environment for bicyclists.
4 Bicyclist Fatalities and Serious Injuries in New York City
Methods Fatalities
To describe bicyclist fatalities in New York City for the period 1996–2005, several data sources were analyzed. All known
bicyclist deaths were included. The primary data source was the NYC DOT Fatality Database. This database is routinely
cross-referenced and reconciled with the NYPD Accident and Investigation Squad (AIS) Database. For this study, recon-
ciled deaths from 1996-2005 were then cross-referenced with death certificates maintained by DOHMH to confirm the
cause of death and to identify any additional bicyclist fatalities. All fatalities with an underlying cause of death indicating
the person to be a bicyclist were included, based on International Classification of Disease (ICD) codes (for a listing of
these codes, please see the Technical Appendix).
Through a match with NYC death certificates, an additional 46 possible bicyclist deaths were identified. Records at the
Office of the Chief Medical Examiner (OCME) for each of these possible additional deaths were reviewed by a team of
three DOHMH investigators. Thirteen of the 46 possible deaths were deemed to be bicyclist fatalities occurring in NYC and
were added to the NYC DOT Fatality and NYPD AIS databases (for additional details, please see the Technical Appendix).
Serious Injuries
Information on serious bicycle crashes was obtained from the New York State (NYS) DOT Safety Information Management
System (SIMS), which compiles data from Accident Information System (AIS) reports submitted to the NYS Department of
Motor vehicles by NYPD. For this report, we analyzed serious bicyclist injuries from 1996 through 2003, the last year for
which data are available. Serious (but non-fatal) bicyclist injuries are defined by the NYS Department of Motor Vehicles as
injuries that require the bicyclist to be taken to the hospital. Serious injuries include amputation, concussion, internal
bleeding, severe burns, fracture, and dislocation. NYS Department of Motor Vehicles only collects information on serious
bicyclist injuries that are associated with a motor vehicle crash.
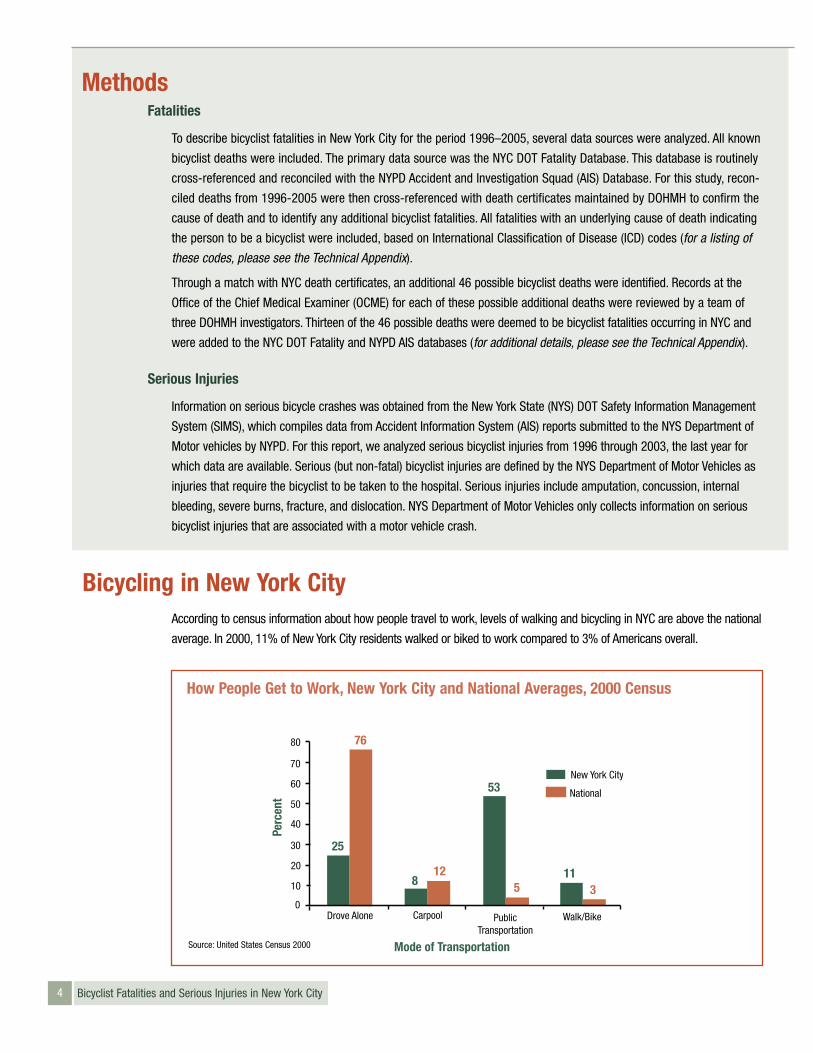
Bicycling in New York CityAccording to census information about how people travel to work, levels of walking and bicycling in NYC are above the national
average. In 2000, 11% of New York City residents walked or biked to work compared to 3% of Americans overall.
Perc
ent
80
70
60
50
40
30
20
10
0Drove Alone Carpool Public
TransportationWalk/Bike
New York City
National
25
812
53
511
Mode of Transportation
3
76
Source: United States Census 2000
How People Get to Work, New York City and National Averages, 2000 Census
5Bicyclist Fatalities and Serious Injuries in New York City
While these data suggest that bicycling in NYC is a popular mode of transportation, it’s difficult to estimate how many
New Yorkers bicycle each year. One source of information is an annual count of bicyclists conducted each year by the
City’s Department of Transportation. This count, known as the “screen-line” count, uses a common method of counting
road users to estimate the number of people or vehicles on streets at a given location. The annual screen-line count
records the number of bicyclists entering or leaving the Manhattan Midtown business district and specific locations in
lower Manhattan between 7 a.m. and 7 p.m. on a single day, usually during the late summer or early fall. Because the
count is concentrated in central Manhattan, it does not provide information about the total number of bicyclists in the
city. Even so, the data are routinely collected the same way at roughly the same time each year, providing some useful
information on bicycling trends over time.
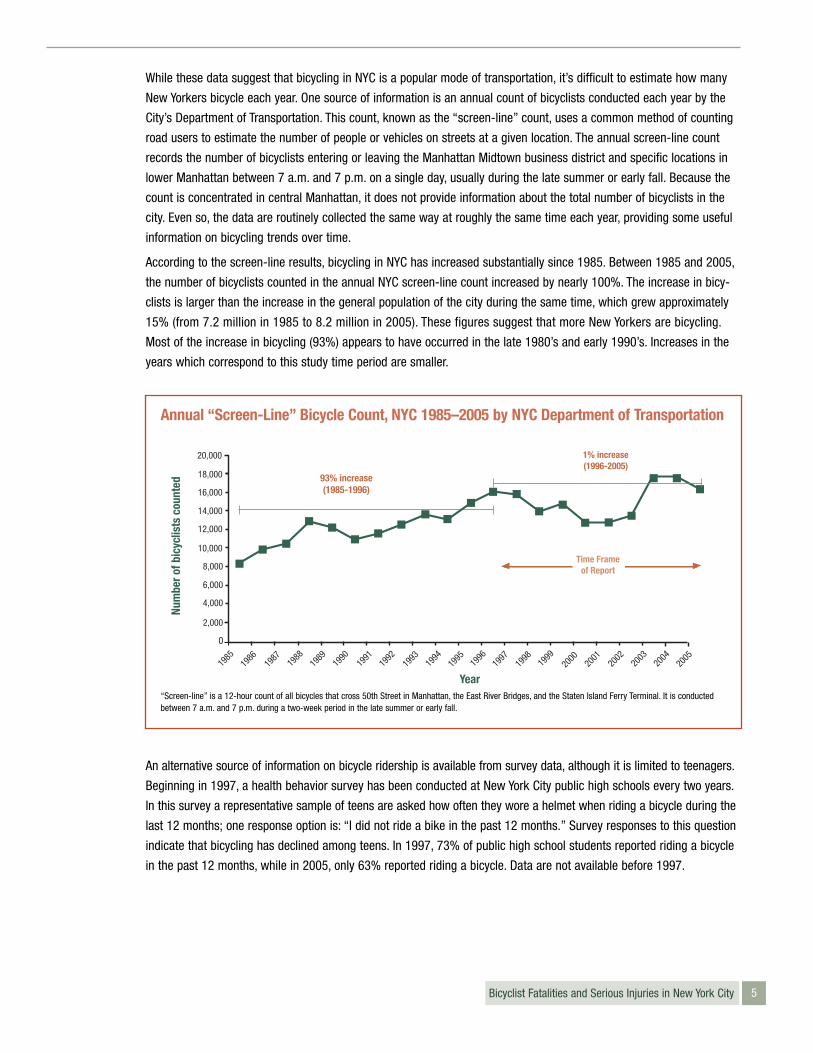
According to the screen-line results, bicycling in NYC has increased substantially since 1985. Between 1985 and 2005,
the number of bicyclists counted in the annual NYC screen-line count increased by nearly 100%. The increase in bicy-
clists is larger than the increase in the general population of the city during the same time, which grew approximately
15% (from 7.2 million in 1985 to 8.2 million in 2005). These figures suggest that more New Yorkers are bicycling.
Most of the increase in bicycling (93%) appears to have occurred in the late 1980’s and early 1990’s. Increases in the
years which correspond to this study time period are smaller.
An alternative source of information on bicycle ridership is available from survey data, although it is limited to teenagers.
Beginning in 1997, a health behavior survey has been conducted at New York City public high schools every two years.
In this survey a representative sample of teens are asked how often they wore a helmet when riding a bicycle during the
last 12 months; one response option is: “I did not ride a bike in the past 12 months.” Survey responses to this question
indicate that bicycling has declined among teens. In 1997, 73% of public high school students reported riding a bicycle
in the past 12 months, while in 2005, only 63% reported riding a bicycle. Data are not available before 1997.
20,000
18,000
16,000
14,000
12,000
10,000
8,000
6,000
4,000
2,000
0
1985
1986
1987
1988
1989
1990
1991
1992
1993
1994
1995
1997
1998
1999
2000
2001
2002
2003
2004
2005
1996
93% increase(1985-1996)
1% increase(1996-2005)
Time Frameof Report
Num
bero
fbic
yclis
tsco
unte
d
Year“Screen-line” is a 12-hour count of all bicycles that cross 50th Street in Manhattan, the East River Bridges, and the Staten Island Ferry Terminal. It is conductedbetween 7 a.m. and 7 p.m. during a two-week period in the late summer or early fall.
Annual “Screen-Line” Bicycle Count, NYC 1985–2005 by NYC Department of Transportation
6 Bicyclist Fatalities and Serious Injuries in New York City
Bicycling Infrastructure, Promotion and Safety Initiatives in New York City
To support bicycling and promote a more bicycle-friendly environment, New York City works routinely with
partners to provide four important services:
(1) Provision of bicycle paths, striped lanes and signed routes.
(2) Installation of bicycle parking racks.
(3) Annual publication and distribution of free maps showing bicycle routes in New York City.
(4) Traffic safety programs for children and adults.
Each of these initiatives is tracked and coordinated through the Bicycle Program at the Department of
Transportation, with the help of other agencies, including the Department of Parks and Recreation, the
Department of City Planning, the New York City Economic Development Corporation and the New York State
Department of Transportation. The four initiatives are described in more detail below.
(1) Bicycle Paths, Striped Lanes, and Signed Routes
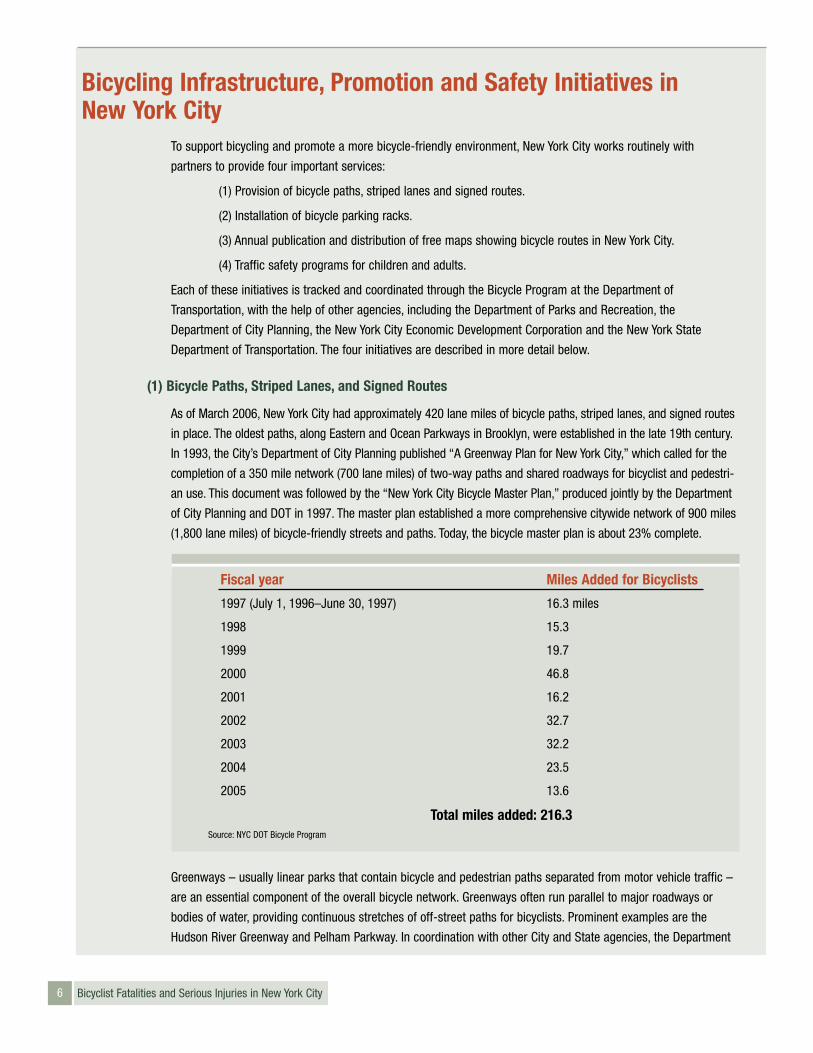
As of March 2006, New York City had approximately 420 lane miles of bicycle paths, striped lanes, and signed routes
in place. The oldest paths, along Eastern and Ocean Parkways in Brooklyn, were established in the late 19th century.
In 1993, the City’s Department of City Planning published “A Greenway Plan for New York City,” which called for the
completion of a 350 mile network (700 lane miles) of two-way paths and shared roadways for bicyclist and pedestri-
an use. This document was followed by the “New York City Bicycle Master Plan,” produced jointly by the Department
of City Planning and DOT in 1997. The master plan established a more comprehensive citywide network of 900 miles
(1,800 lane miles) of bicycle-friendly streets and paths. Today, the bicycle master plan is about 23% complete.
Greenways – usually linear parks that contain bicycle and pedestrian paths separated from motor vehicle traffic –
are an essential component of the overall bicycle network. Greenways often run parallel to major roadways or
bodies of water, providing continuous stretches of off-street paths for bicyclists. Prominent examples are the
Hudson River Greenway and Pelham Parkway. In coordination with other City and State agencies, the Department
Fiscal year Miles Added for Bicyclists
1997 (July 1, 1996–June 30, 1997) 16.3 miles
1998 15.3
1999 19.7
2000 46.8
2001 16.2
2002 32.7
2003 32.2
2004 23.5
2005 13.6
Total miles added: 216.3Source: NYC DOT Bicycle Program
7Bicyclist Fatalities and Serious Injuries in New York City
of Parks and Recreation (DPR) works to increase the amount of greenway miles available to New Yorkers as laid out
in the NYC Bicycle Master Plan and the Greenway Plan.
Often bicycle routes are a combination of greenways and striped lanes or signed routes. DPR focuses efforts on
increasing the proportion of dedicated greenway space on many combination routes. Current projects include:
• The Bronx River Greenway: 8 miles of combined greenways, striped lanes and signed routes
• The Queens East River & North Shore Greenway: a 10.6 mile combined route with several dedicated greenway portions
• The Greenbelt Greenway: a 3.25 mile greenway providing safe east-west access for bicyclists in the center of
Staten Island
(2) Bicycle Parking
In the last ten years, the City has increased the number of bicycle parking racks by more than 500%. There are currently
4,000 bicycle racks citywide, compared to approximately 600 in 1996.
(3) Bicycle Maps
The City has produced and distributed free bicycling maps since 1997. By the end of 2006, the City will have distrib-
uted close to 1 million maps. The map was initially produced in five versions, one per borough. In order to encourage
people to bicycle across the city, a single citywide map has been produced and distributed since 2002. Maps show
on-street routes, bicycle lanes, existing and planned off-street routes, bicycle shops, parks, schools, landmarks,
museums, and other sites of interest. The maps also contain information on proper safety equipment, a list of cycling
organizations, and guidelines for taking bicycles on the subway and other forms of mass transit. The citywide bicycle
map is updated annually by Department of City Planning, Department of Transportation and Department of Parks and
Recreation in order to reflect bikeway segment upgrades and improvements.
(4) Safety Programs
In 1989, NYC’s DOT established a program known as Safety City. The program operates six facilities that provide traffic
safety instruction to third grade students. Safety City uses both interactive classroom lessons and hands-on practice at a
simulated city street intersection. Instructors stress the importance of bicycle helmet use and each site includes a helmet
fitting station. In 2005, Safety City staff provided nearly 51,000 training sessions to children and adults.
The Safety City “On the Road” program and the Apple Corps Theater also present theatrical productions that include
bicycle safety information to schools in neighborhoods with high rates of child injuries. In 2005, 37,459 students
attended performances. Overall, students made 134,207 visits to DOT’s various safety education programs during 2005,
representing a 17% increase since 2000. Additional bicycle safety information is shared at community health fairs.
The City’s Department of Parks and Recreation (DPR) also has a bicycle safety program – the Bicycle Safety Education
Campaign. DPR distributes bicycle maps and promotional safety brochures to bicyclists in park areas with high rates of
bicycle traffic, such as Central, Riverside, Carl Schurz, and Hudson River parks, as well as at 28 recreation centers
across the city. The brochure was developed by the Central Park Conservancy and has been endorsed by many of the
City’s bicycle advocacy groups. DPR officers also set up seasonal checkpoints inside selected major parks at peak
riding times and locations. At these checkpoints, bicyclists are stopped and provided with bicycle route maps and
wallet-size cards explaining the laws and regulations governing bicycle riding in New York City, as well as park maps
that show points of interest and service features (water fountains, restrooms). The seasonal program is carried out in
two phases – education only is provided for one month, followed by education combined with enforcement.
8 Bicyclist Fatalities and Serious Injuries in New York City
Results The findings in this report are divided into two sections. The first section presents findings on bicyclist deaths and is
comprehensive in scope, using information compiled from crash investigator reports, AIS police reports, and in some
instances, medical examiner files. The second section describes serious bicyclist injuries. Data on these injuries
are less complete, but they provide an important additional perspective on non-fatal crashes.
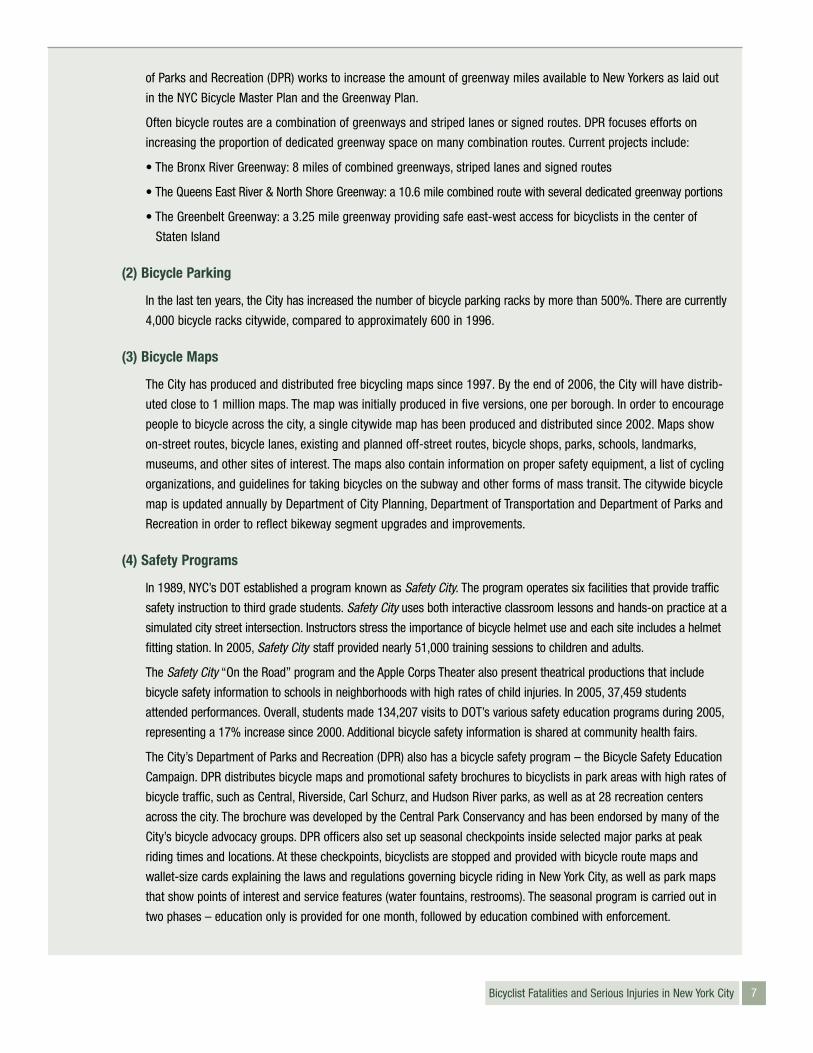
Bicyclist FatalitiesAccording to the NYC DOT Fatality Database, there were 3,964 transportation-related deaths in New York City from
1996 through 2005. Almost half of these deaths (49%) were pedestrians (n=1,944). Slightly more than one-third (38%)
were drivers or passengers (occupants) in motor vehicles (n=1,510). A total of 225 deaths (6%) were bicyclists.
Overview
Between 1996 and 2005, there were 225 bicyclist deaths in New York City. An average of 23 bicyclists died per year, at
an average annual rate of 2.8 deaths per 1 million New Yorkers. While the number of bicyclist deaths varied from year
to year, the changes did not suggest an upward or downward trend in deaths during the report period; bicyclist deaths
appeared to remain stable. However, in one year, 1999, the number of bicyclist deaths was significantly higher than
other years. The annual number of deaths ranged from a low of 13 in 2001 to a high of 40 in 1999.
Source: NYC DOT Fatality Database
Pedestrian 49%
Motorcyclist 5%
Bicyclist 6%
Other 2%
Vehicle Occupant 38%
Transportation Deaths, New York City, 1996–2005
Num
bero
fDea
ths
0
5
10
15
20
25
30
35
40
45
1996 1997 1998 1999 2000 2001 2002 2003 2004 2005Year
19
28
22
40
20
13
2318 18
24
Source: NYC DOT Fatality Database
Bicyclist Deaths, New York City, 1996–2005
9Bicyclist Fatalities and Serious Injuries in New York City
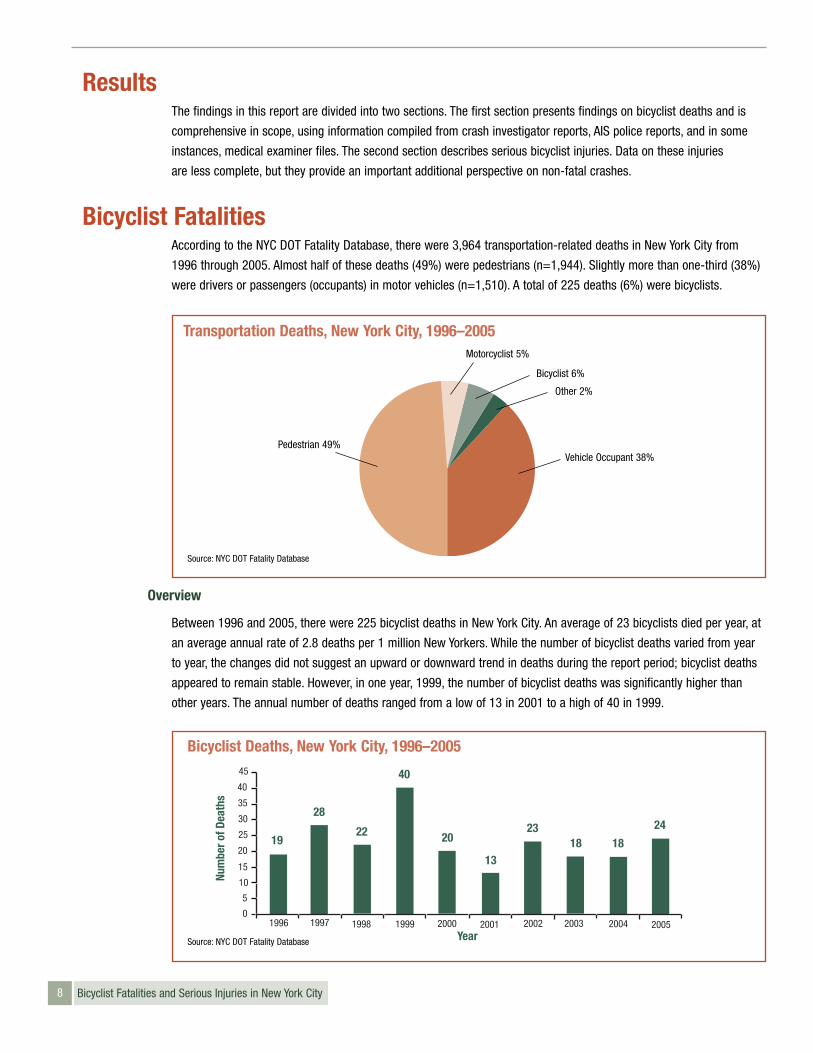
A comparison of bicyclist death rates between the nation, New York State, and New York City for the 1999-2003 period
shows similar levels of bicyclist deaths. All rates were between 2 and 3 bicyclist deaths per million population.
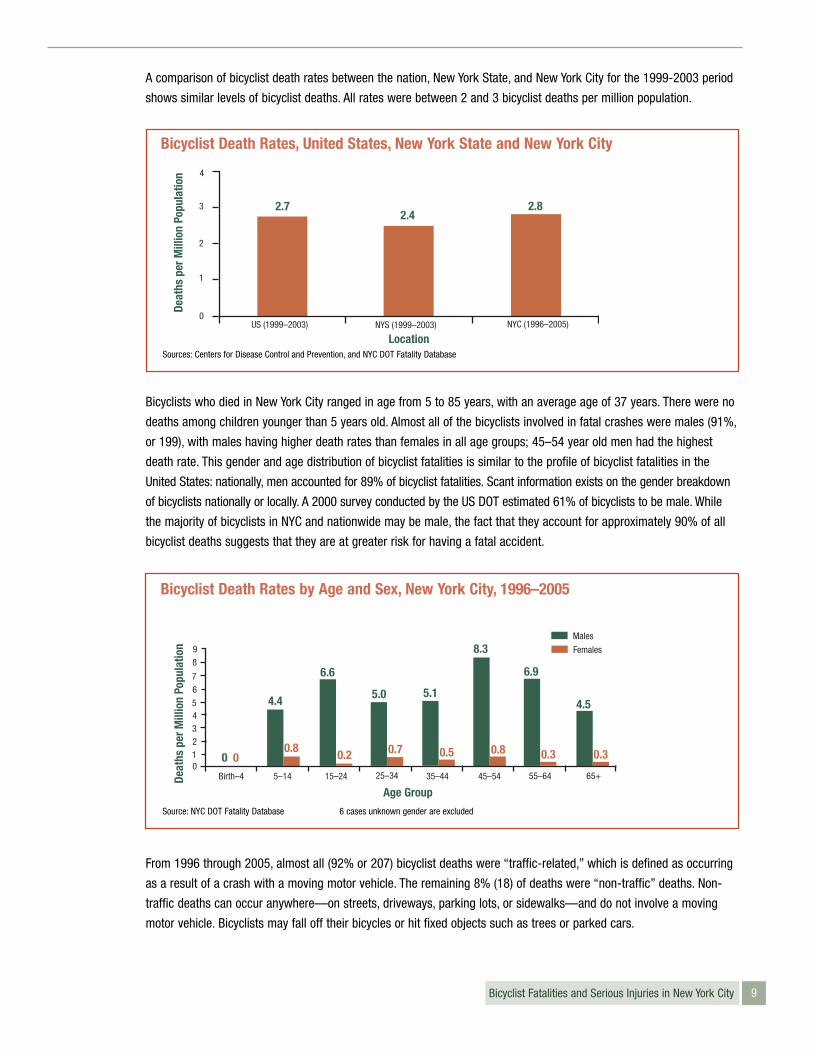
Bicyclists who died in New York City ranged in age from 5 to 85 years, with an average age of 37 years. There were no
deaths among children younger than 5 years old. Almost all of the bicyclists involved in fatal crashes were males (91%,
or 199), with males having higher death rates than females in all age groups; 45–54 year old men had the highest
death rate. This gender and age distribution of bicyclist fatalities is similar to the profile of bicyclist fatalities in the
United States: nationally, men accounted for 89% of bicyclist fatalities. Scant information exists on the gender breakdown
of bicyclists nationally or locally. A 2000 survey conducted by the US DOT estimated 61% of bicyclists to be male. While
the majority of bicyclists in NYC and nationwide may be male, the fact that they account for approximately 90% of all
bicyclist deaths suggests that they are at greater risk for having a fatal accident.
From 1996 through 2005, almost all (92% or 207) bicyclist deaths were “traffic-related,” which is defined as occurring
as a result of a crash with a moving motor vehicle. The remaining 8% (18) of deaths were “non-traffic” deaths. Non-
traffic deaths can occur anywhere—on streets, driveways, parking lots, or sidewalks—and do not involve a moving
motor vehicle. Bicyclists may fall off their bicycles or hit fixed objects such as trees or parked cars.
Age Group
Deat
hspe
rMill
ion
Popu
latio
n
89
76
543210
Birth–4 5–14 15–24 25–34 35–44 45–54 55–64 65+
Males
Females
0 0
4.4
0.8
6.6
5.0 5.1
8.3
6.9
4.5
0.2 0.7 0.5 0.8 0.3 0.3
Source: NYC DOT Fatality Database 6 cases unknown gender are excluded
Bicyclist Death Rates by Age and Sex, New York City, 1996–2005
4
2
1
3
0NYC (1996–2005)NYS (1999–2003)US (1999–2003)
Deat
hspe
rMill
ion
Popu
latio
n
2.72.4
Location
2.8
Sources: Centers for Disease Control and Prevention, and NYC DOT Fatality Database
Bicyclist Death Rates, United States, New York State and New York City
10 Bicyclist Fatalities and Serious Injuries in New York City
Non-Traffic Deaths
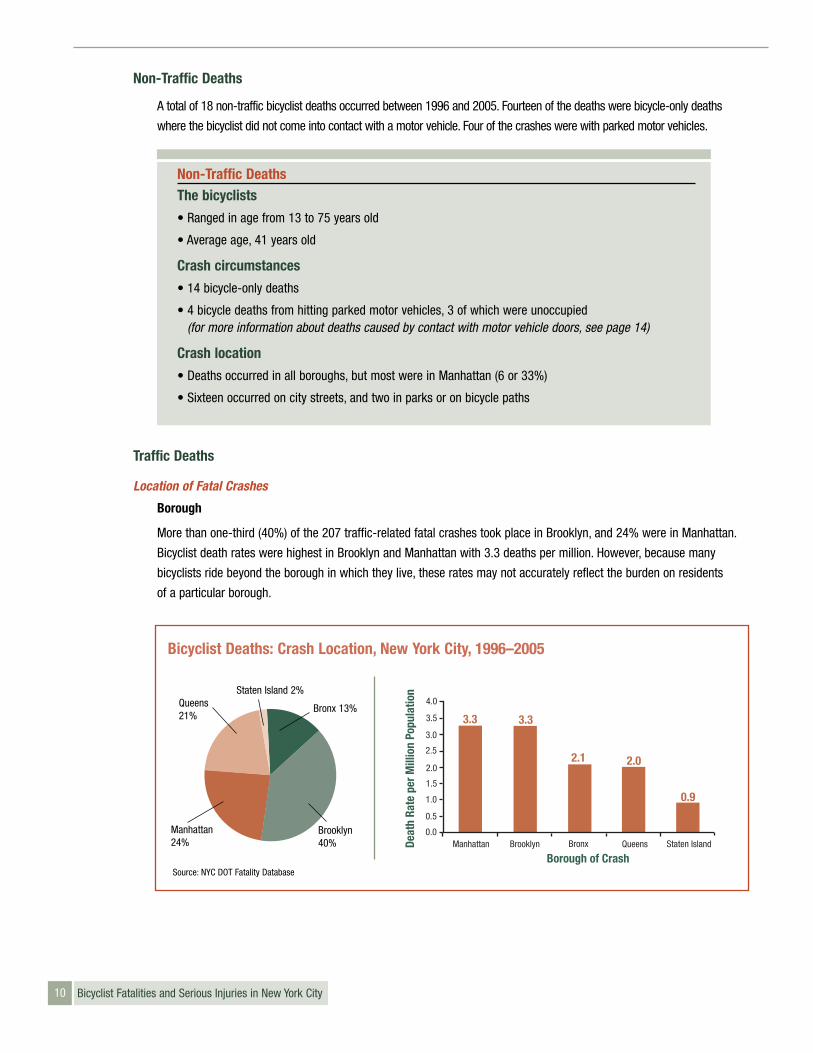
A total of 18 non-traffic bicyclist deaths occurred between 1996 and 2005. Fourteen of the deaths were bicycle-only deaths
where the bicyclist did not come into contact with a motor vehicle. Four of the crashes were with parked motor vehicles.
Traffic Deaths
Location of Fatal Crashes
Borough
More than one-third (40%) of the 207 traffic-related fatal crashes took place in Brooklyn, and 24% were in Manhattan.
Bicyclist death rates were highest in Brooklyn and Manhattan with 3.3 deaths per million. However, because many
bicyclists ride beyond the borough in which they live, these rates may not accurately reflect the burden on residents
of a particular borough.
Non-Traffic DeathsThe bicyclists
• Ranged in age from 13 to 75 years old
• Average age, 41 years old
Crash circumstances
• 14 bicycle-only deaths
• 4 bicycle deaths from hitting parked motor vehicles, 3 of which were unoccupied (for more information about deaths caused by contact with motor vehicle doors, see page 14)
Crash location
• Deaths occurred in all boroughs, but most were in Manhattan (6 or 33%)
• Sixteen occurred on city streets, and two in parks or on bicycle paths
3.3
BrooklynDeat
hRa
tepe
rMill
ion
Popu
latio
n
3.3
2.0
0.9
Staten Island
Borough of CrashQueens
2.1
BronxManhattan
4.0
3.5
3.0
2.5
2.0
1.5
1.0
0.5
0.0
Bicyclist Deaths: Crash Location, New York City, 1996–2005
Manhattan24%
Queens21%
Staten Island 2%
Bronx 13%
Brooklyn40%
Source: NYC DOT Fatality Database
FAILEMANIDA
156TH
BARRY
TIFFANY
COSTER
FOX
BRYANT
OAK POINT
LAFAYETTE
GARRISONBRUCKNER
BARRETTO
LEGGETT
CASANOVATR
UXTON
BURNETT
3RD
2ND
1ST
60TH59TH57TH
56TH
61ST
63RD
55TH
64TH
54TH
58TH
62ND
65TH
53RD
66TH
52ND
FDR
YORK
PARK
51ST
E 60TH ST
E 61ST ST
3RDAVE
2NDAVE
1STAVE
E 57TH ST
E 59TH ST
4TH
3RD
DEAN
5TH
6TH
BERGEN
PARK
FLATBUSH
ATLANTIC
BUTLER
NEVINS
UNION
PACIFIC
DE GRAWSTERLING
SACKETT
PROSPECT
DOUGLASS
WARREN
SAINT MARKS
CARLTON
SAINT JOHNS
PACIFIC
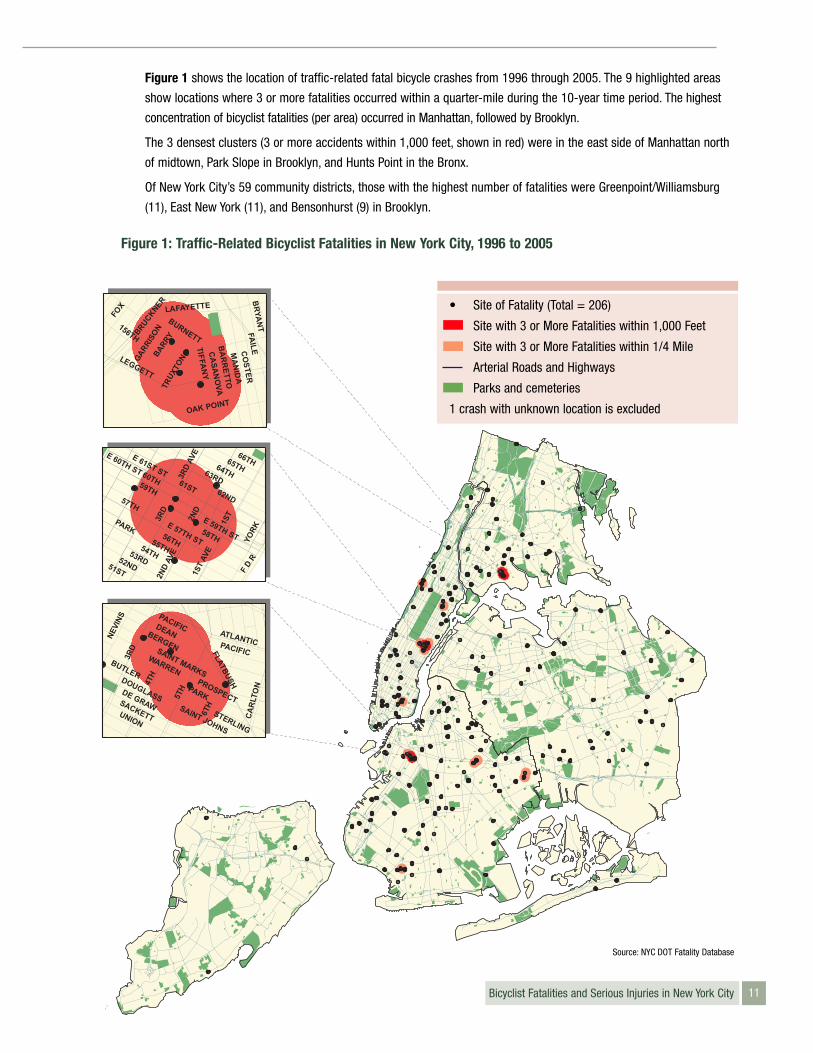
Figure 1 shows the location of traffic-related fatal bicycle crashes from 1996 through 2005. The 9 highlighted areas
show locations where 3 or more fatalities occurred within a quarter-mile during the 10-year time period. The highest
concentration of bicyclist fatalities (per area) occurred in Manhattan, followed by Brooklyn.
The 3 densest clusters (3 or more accidents within 1,000 feet, shown in red) were in the east side of Manhattan north
of midtown, Park Slope in Brooklyn, and Hunts Point in the Bronx.
Of New York City’s 59 community districts, those with the highest number of fatalities were Greenpoint/Williamsburg
(11), East New York (11), and Bensonhurst (9) in Brooklyn.
Figure 1: Traffic-Related Bicyclist Fatalities in New York City, 1996 to 2005
11Bicyclist Fatalities and Serious Injuries in New York City
• Site of Fatality (Total = 206)
Site with 3 or More Fatalities within 1,000 Feet
Site with 3 or More Fatalities within 1/4 Mile
Arterial Roads and Highways
Parks and cemeteries
1 crash with unknown location is excluded
Source: NYC DOT Fatality Database
12 Bicyclist Fatalities and Serious Injuries in New York City
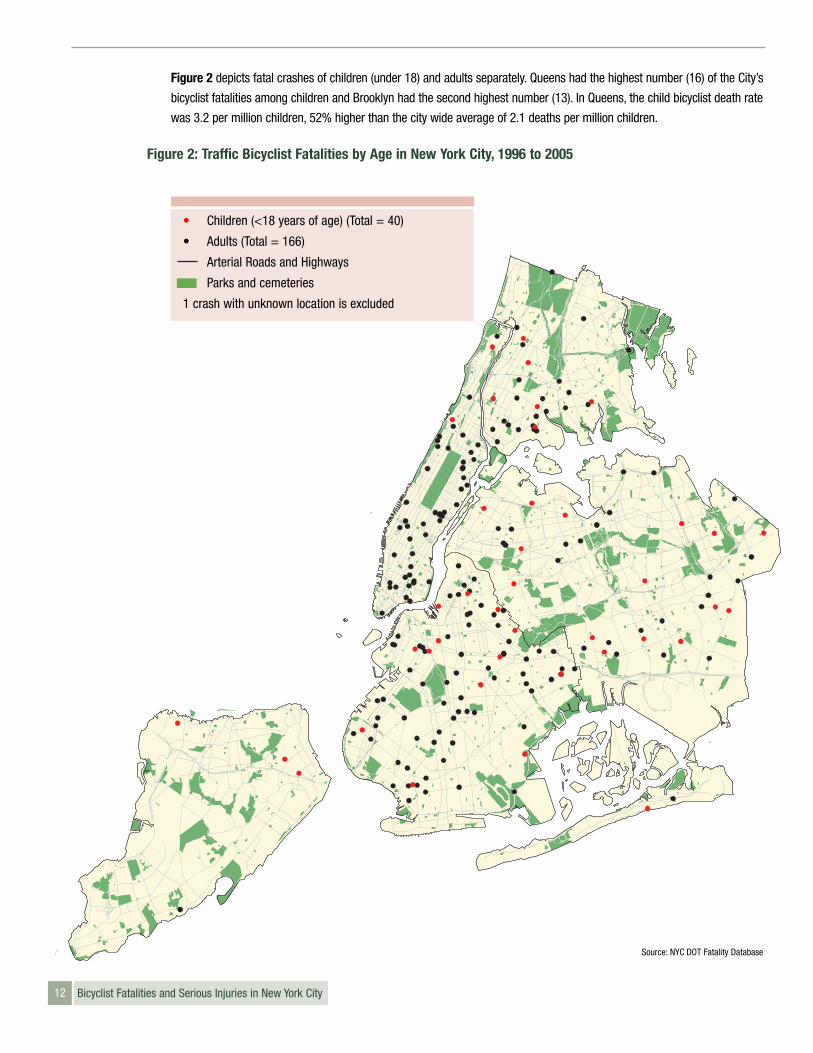
Figure 2 depicts fatal crashes of children (under 18) and adults separately. Queens had the highest number (16) of the City’s
bicyclist fatalities among children and Brooklyn had the second highest number (13). In Queens, the child bicyclist death rate
was 3.2 per million children, 52% higher than the city wide average of 2.1 deaths per million children.
Figure 2: Traffic Bicyclist Fatalities by Age in New York City, 1996 to 2005
• Children (<18 years of age) (Total = 40)
• Adults (Total = 166)
Arterial Roads and Highways
Parks and cemeteries
1 crash with unknown location is excluded
Source: NYC DOT Fatality Database
13Bicyclist Fatalities and Serious Injuries in New York City
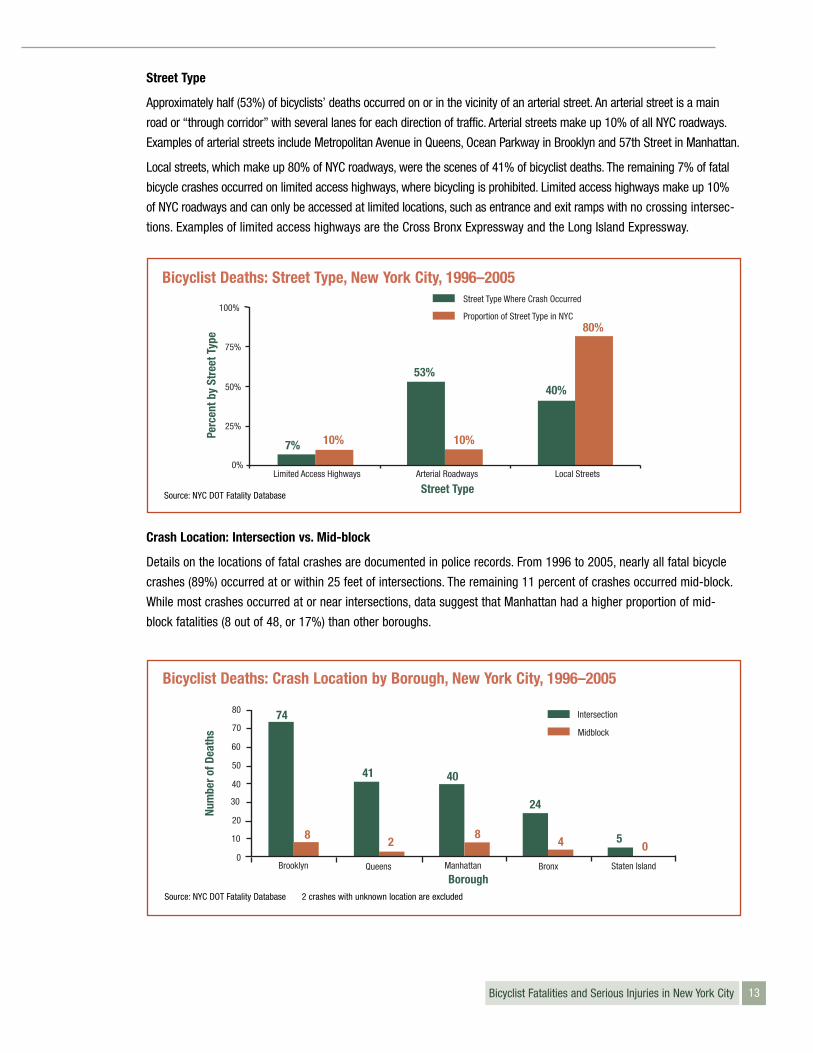
Street Type
Approximately half (53%) of bicyclists’ deaths occurred on or in the vicinity of an arterial street. An arterial street is a main
road or “through corridor” with several lanes for each direction of traffic. Arterial streets make up 10% of all NYC roadways.
Examples of arterial streets include Metropolitan Avenue in Queens, Ocean Parkway in Brooklyn and 57th Street in Manhattan.
Local streets, which make up 80% of NYC roadways, were the scenes of 41% of bicyclist deaths. The remaining 7% of fatal
bicycle crashes occurred on limited access highways, where bicycling is prohibited. Limited access highways make up 10%
of NYC roadways and can only be accessed at limited locations, such as entrance and exit ramps with no crossing intersec-
tions. Examples of limited access highways are the Cross Bronx Expressway and the Long Island Expressway.
Crash Location: Intersection vs. Mid-block
Details on the locations of fatal crashes are documented in police records. From 1996 to 2005, nearly all fatal bicycle
crashes (89%) occurred at or within 25 feet of intersections. The remaining 11 percent of crashes occurred mid-block.
While most crashes occurred at or near intersections, data suggest that Manhattan had a higher proportion of mid-
block fatalities (8 out of 48, or 17%) than other boroughs.
40%
80%
10%
53%
10%7%
0%
25%
50%
75%
100%
Local Streets
Street Type Where Crash Occurred
Proportion of Street Type in NYC
Arterial RoadwaysLimited Access Highways
Street Type
Perc
entb
ySt
reet
Type
Source: NYC DOT Fatality Database
Bicyclist Deaths: Street Type, New York City, 1996–2005
5
Num
bero
fDea
ths
80
60
70
40
50
20
30
0
10
Bronx
24
4
40
8
41
2 0
74
8
Brooklyn ManhattanQueens Staten Island
Intersection
Midblock
BoroughSource: NYC DOT Fatality Database 2 crashes with unknown location are excluded
Bicyclist Deaths: Crash Location by Borough, New York City, 1996–2005
14 Bicyclist Fatalities and Serious Injuries in New York City
Marked Bicycle Lanes
Marked bicycle lanes are areas on roadways that are clearly delineated for use by bicyclists. Bicycle lanes are located on
city streets, and in parks where the lanes are shared with pedestrians. Using the NYC DOT’s database of bicycle lanes,
fatal crashes were examined for their proximity to marked bicycle lanes.
Only one fatal crash with a motor vehicle occurred in a marked bicycle lane. This fatality occurred in Prospect Park,
as a result of a motor vehicle colliding with a bicyclist. A total of 10 other fatal crashes occurred in or near a marked
bicycle lane. Six fatal bicycle crashes with motor vehicles occurred in close proximity to, but not inside of, a marked
bicycle lane. One fatality occurred on a city street near a bicycle lane, but did not involve a motor vehicle. The last three
fatalities occurred inside a marked bicycle lane located within a park, but did not involve a motor vehicle.
Deaths involving motor vehicle doors (dooring)
A total of 7 fatal crashes occurred as a result of a bicyclist hitting a motor vehicle door or trying to avoid one. Four
occurred in Manhattan and 3 in Brooklyn. In one case, a bicyclist hit the open door of a motor vehicle that was parked
(one of the 18 deaths described on page 10). Four of the 7 deaths occurred when a bicyclist swerved to avoid an open
vehicle door and was then struck by another moving vehicle. In the remaining two cases, the bicyclist fell after colliding
with an open door and was then struck by a different moving vehicle.
Time of Fatal Crashes
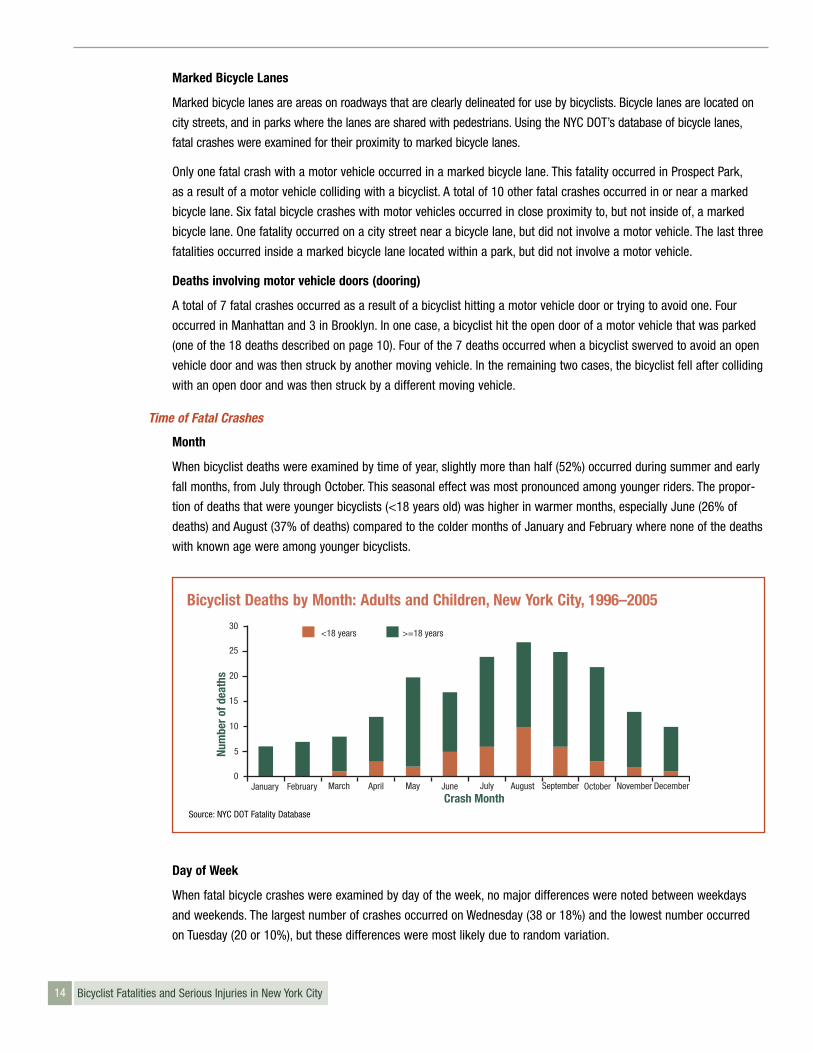
Month
When bicyclist deaths were examined by time of year, slightly more than half (52%) occurred during summer and early
fall months, from July through October. This seasonal effect was most pronounced among younger riders. The propor-
tion of deaths that were younger bicyclists (<18 years old) was higher in warmer months, especially June (26% of
deaths) and August (37% of deaths) compared to the colder months of January and February where none of the deaths
with known age were among younger bicyclists.
Day of Week
When fatal bicycle crashes were examined by day of the week, no major differences were noted between weekdays
and weekends. The largest number of crashes occurred on Wednesday (38 or 18%) and the lowest number occurred
on Tuesday (20 or 10%), but these differences were most likely due to random variation.
30
25
20
15
10
5
0January February March April
<18 years
May June July August
Crash MonthSeptember October November December
>=18 years
Num
bero
fdea
ths
Source: NYC DOT Fatality Database
Bicyclist Deaths by Month: Adults and Children, New York City, 1996–2005
15Bicyclist Fatalities and Serious Injuries in New York City
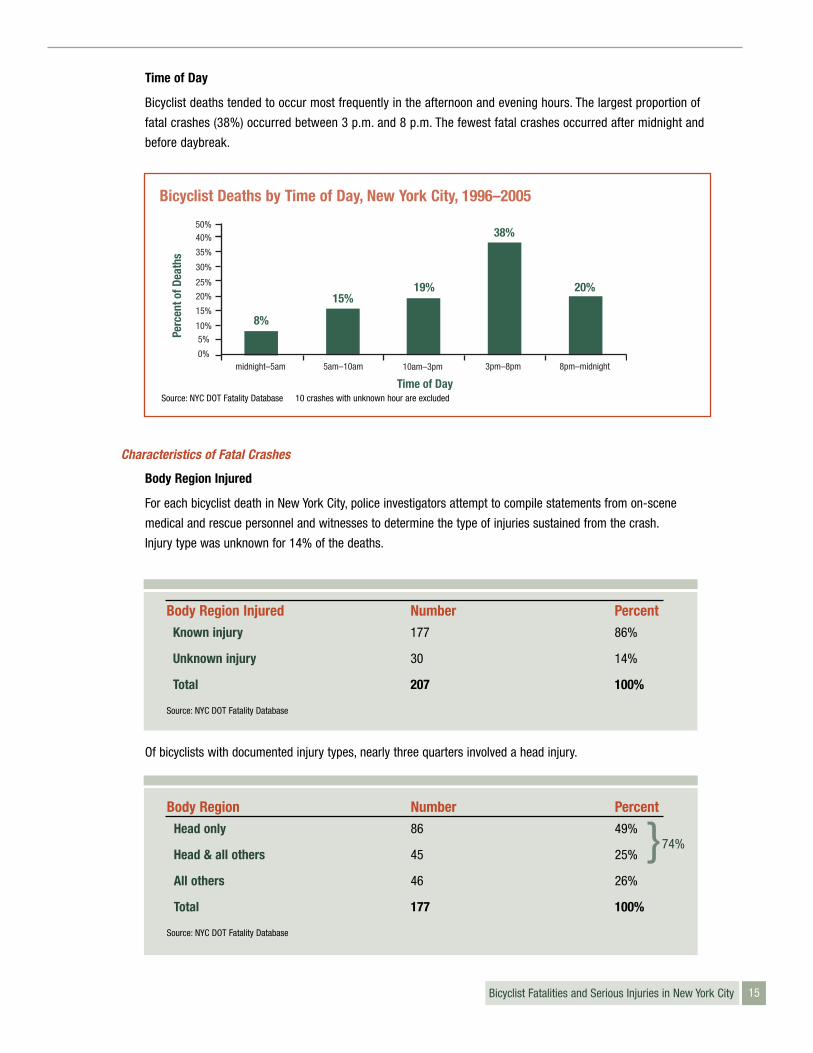
Time of Day
Bicyclist deaths tended to occur most frequently in the afternoon and evening hours. The largest proportion of
fatal crashes (38%) occurred between 3 p.m. and 8 p.m. The fewest fatal crashes occurred after midnight and
before daybreak.
Characteristics of Fatal Crashes
Body Region Injured
For each bicyclist death in New York City, police investigators attempt to compile statements from on-scene
medical and rescue personnel and witnesses to determine the type of injuries sustained from the crash.
Injury type was unknown for 14% of the deaths.
Of bicyclists with documented injury types, nearly three quarters involved a head injury.
Perc
ento
fDea
ths
Time of Day
8%
15%19%
38%
20%
40%
35%
30%
50%
25%
20%
15%
10%
5%
0%midnight–5am 5am–10am 10am–3pm 3pm–8pm 8pm–midnight
Source: NYC DOT Fatality Database 10 crashes with unknown hour are excluded
Bicyclist Deaths by Time of Day, New York City, 1996–2005
Body Region Injured Number PercentKnown injury 177 86%
Unknown injury 30 14%
Total 207 100%
Source: NYC DOT Fatality Database
Body Region Number PercentHead only 86 49%
Head & all others 45 25%
All others 46 26%
Total 177 100%
Source: NYC DOT Fatality Database
} 74%
16 Bicyclist Fatalities and Serious Injuries in New York City
Helmet Use
Information on helmet use was missing in some of the police records, particularly in the earlier years of this study’s
timeframe. Overall, information on helmet use was obtained for 59% of deaths.
Among the fatalities with documented helmet use, 97% of the bicyclists were not wearing a helmet at the time
of the crash. Only 4 bicyclists who died (3%) were wearing a helmet. All child or teen bicyclists who died were
not wearing helmets. Helmet usage is required by law for all children under 14 in New York.
For bicyclist deaths occurring in 2004 and 2005 (n=38), documentation of helmet use was more complete (87% or 33). Analysis of helmet use in this subgroup revealed findings similar to the full group: 97% of bicyclists who died were not wearing a helmet. Of the 38 deaths during this time period 29 (or 76%) had head injuries.
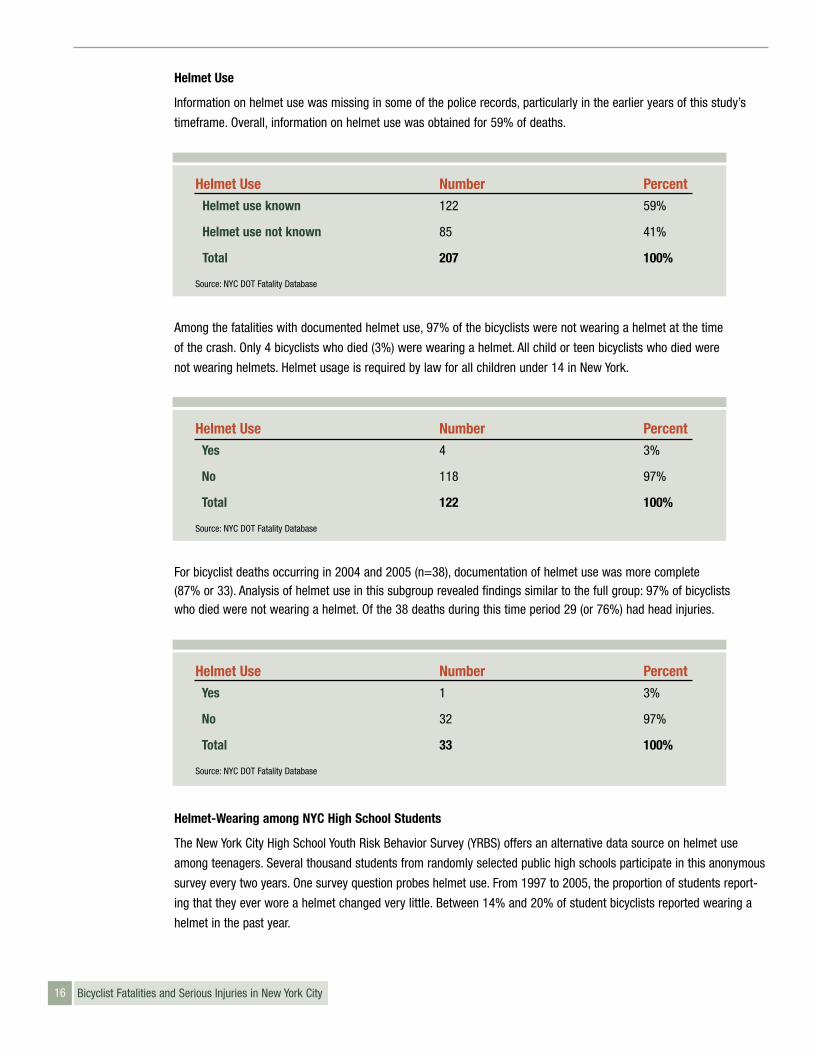
Helmet-Wearing among NYC High School Students
The New York City High School Youth Risk Behavior Survey (YRBS) offers an alternative data source on helmet use
among teenagers. Several thousand students from randomly selected public high schools participate in this anonymous
survey every two years. One survey question probes helmet use. From 1997 to 2005, the proportion of students report-
ing that they ever wore a helmet changed very little. Between 14% and 20% of student bicyclists reported wearing a
helmet in the past year.
Helmet Use Number PercentHelmet use known 122 59%
Helmet use not known 85 41%
Total 207 100%
Source: NYC DOT Fatality Database
Helmet Use Number PercentYes 4 3%
No 118 97%
Total 122 100%
Source: NYC DOT Fatality Database
Helmet Use Number PercentYes 1 3%
No 32 97%
Total 33 100%
Source: NYC DOT Fatality Database
17Bicyclist Fatalities and Serious Injuries in New York City
Another source of information on helmet use is available from a 2004 observational study conducted by the New
York Metropolitan Transportation Council at 149 locations throughout New York City. Half of the study location
observations were of bicycling on off-street paths, and half observed bicyclists riding on the street. Overall, the
study found that 49% of bicyclists on off-street paths wore a helmet, whereas only 22% of bicyclists on streets
wore a helmet.
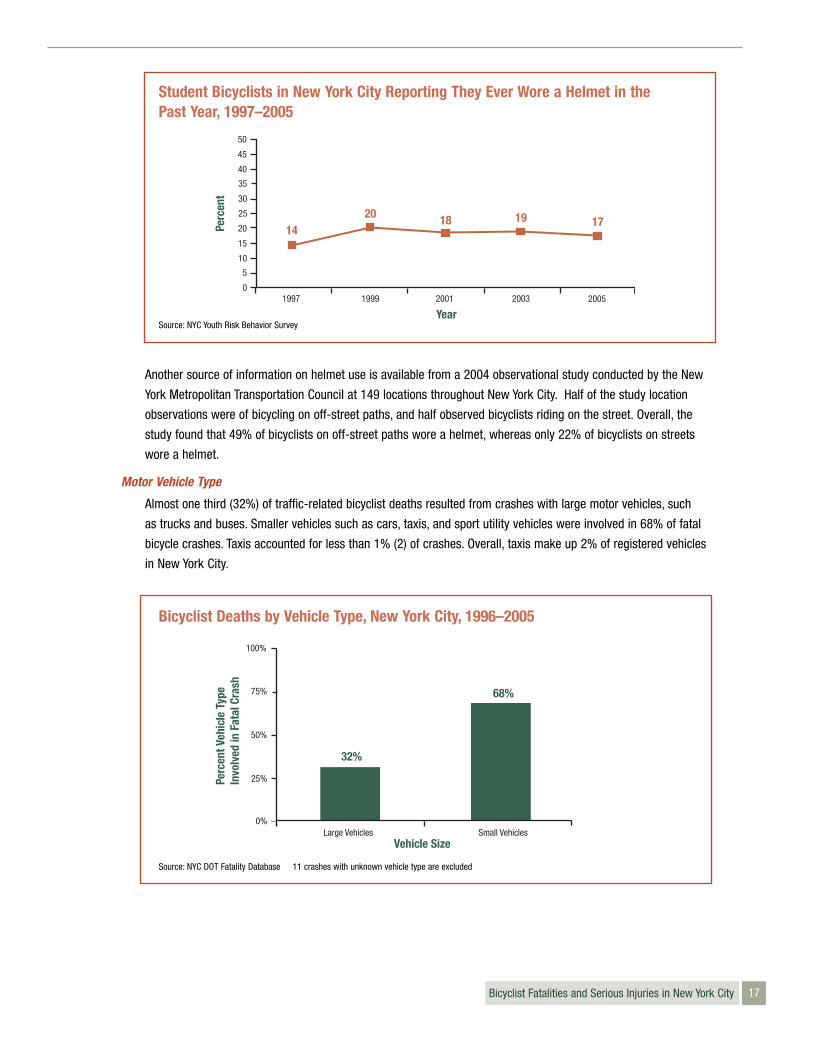
Motor Vehicle Type
Almost one third (32%) of traffic-related bicyclist deaths resulted from crashes with large motor vehicles, such
as trucks and buses. Smaller vehicles such as cars, taxis, and sport utility vehicles were involved in 68% of fatal
bicycle crashes. Taxis accounted for less than 1% (2) of crashes. Overall, taxis make up 2% of registered vehicles
in New York City.
1420 18 19 17Pe
rcen
t
50
45
40
35
30
25
20
15
10
5
01997 1999 2001 2003 2005
Year
Student Bicyclists in New York City Reporting They Ever Wore a Helmet in the Past Year, 1997–2005
Source: NYC Youth Risk Behavior Survey
100%
75%
50%
25%
0%Large Vehicles Small Vehicles
Vehicle Size
Perc
ent V
ehic
le T
ype
Invo
lved
in F
atal
Cra
sh
32%
68%
Bicyclist Deaths by Vehicle Type, New York City, 1996–2005
Source: NYC DOT Fatality Database 11 crashes with unknown vehicle type are excluded
18
Crash-Related Factors for Motor Vehicle Drivers and Bicyclists
In a crash scene investigation, investigators determine the apparent contributing factors for the fatal crash. Contributing
factors do not assign blame. The purpose of assigning contributing factors to the motor vehicle driver, the bicyclist or
both is to understand the actions that may have played a role in the crash. Contributing factors are categorized into
three major types: human, vehicular and environmental. Contributing factors are listed on the police accident report;
crash investigators use their professional judgement to indicate the apparent reasons for the accident. Factors were
documented in almost all (97%) traffic-related fatal bicycle crashes.
In crashes where factors were documented, almost all (94%) included human factors such as inattention or disregarding
a traffic control device (i.e. a stop sign or traffic signal). Environmental factors, which accounted for 5%, included
obstructed view, glare, slippery pavement and a defective shoulder. Vehicular factors such as defective brakes accounted
for 1% of contributing factors.
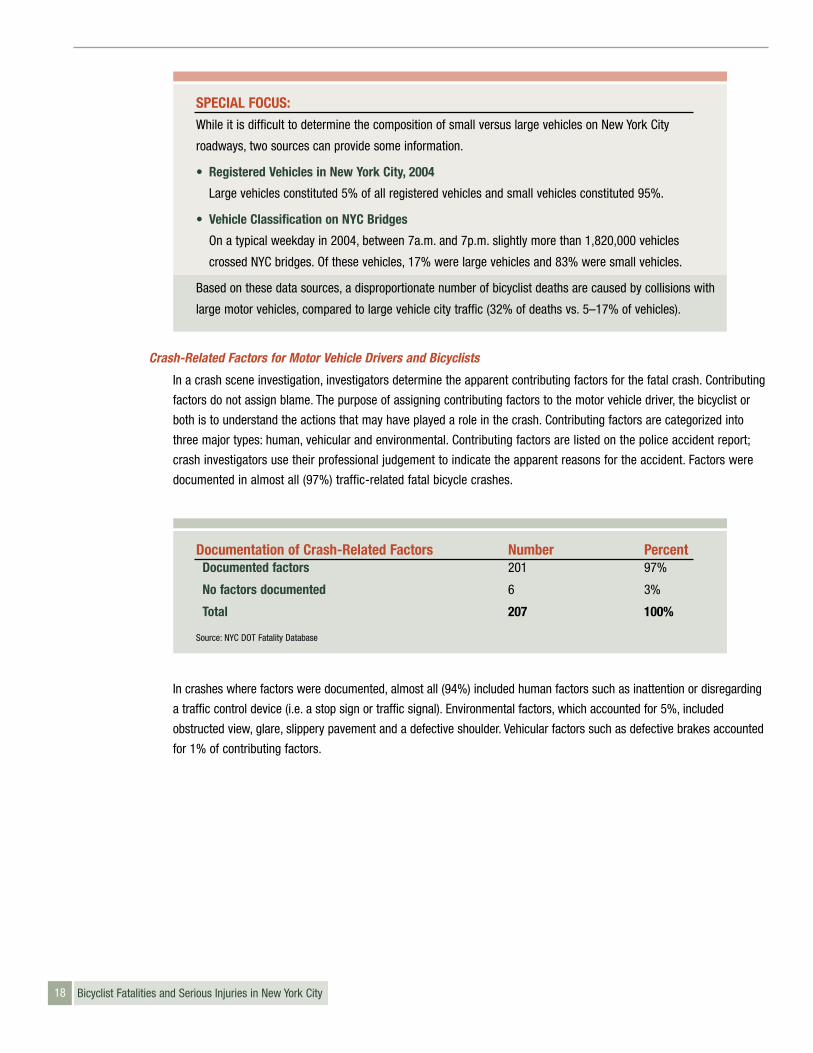
Documentation of Crash-Related Factors Number PercentDocumented factors 201 97%
No factors documented 6 3%
Total 207 100%
Source: NYC DOT Fatality Database
Bicyclist Fatalities and Serious Injuries in New York City
SPECIAL FOCUS: While it is difficult to determine the composition of small versus large vehicles on New York City
roadways, two sources can provide some information.
• Registered Vehicles in New York City, 2004
Large vehicles constituted 5% of all registered vehicles and small vehicles constituted 95%.
• Vehicle Classification on NYC Bridges
On a typical weekday in 2004, between 7a.m. and 7p.m. slightly more than 1,820,000 vehicles
crossed NYC bridges. Of these vehicles, 17% were large vehicles and 83% were small vehicles.
Based on these data sources, a disproportionate number of bicyclist deaths are caused by collisions with
large motor vehicles, compared to large vehicle city traffic (32% of deaths vs. 5–17% of vehicles).
Multiple factors
Each fatal crash may have multiple contributing factors assigned. For example, a bicyclist may have disregarded
traffic controls while at the same time the motor vehicle driver may have been inattentive, resulting in two contributing
factors for one crash. In 36% of crashes with documented factors, both the bicyclist and the driver were assigned
factors that contributed to the crash. Overall, the bicyclist was assigned a factor more frequently than the motor
vehicle driver. In interpreting these data, it is important to remember that in some fatal crashes the motor vehicle
driver’s recollection of the crash is the only one available, which may bias these findings to show more bicyclist
errors compared to motor vehicle driver errors.
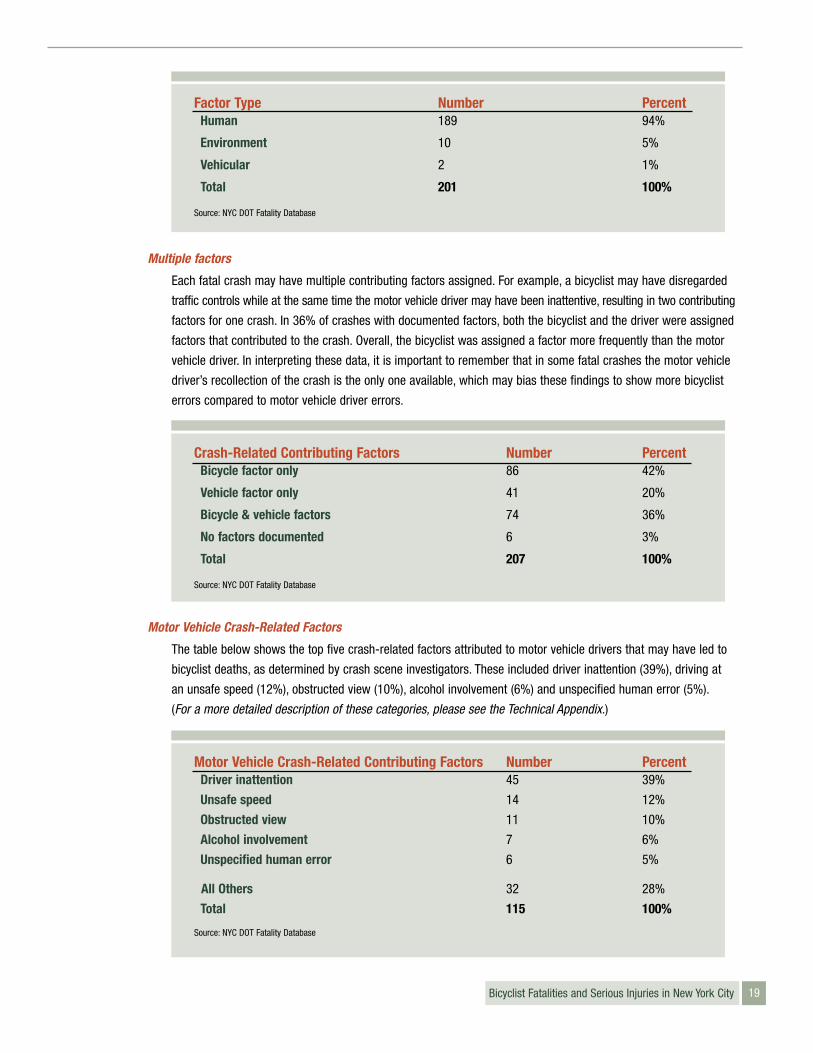
Motor Vehicle Crash-Related Factors
The table below shows the top five crash-related factors attributed to motor vehicle drivers that may have led to
bicyclist deaths, as determined by crash scene investigators. These included driver inattention (39%), driving at
an unsafe speed (12%), obstructed view (10%), alcohol involvement (6%) and unspecified human error (5%).
(For a more detailed description of these categories, please see the Technical Appendix.)
Crash-Related Contributing Factors Number PercentBicycle factor only 86 42%
Vehicle factor only 41 20%
Bicycle & vehicle factors 74 36%
No factors documented 6 3%
Total 207 100%
Source: NYC DOT Fatality Database
Motor Vehicle Crash-Related Contributing Factors Number PercentDriver inattention 45 39%
Unsafe speed 14 12%
Obstructed view 11 10%
Alcohol involvement 7 6%
Unspecified human error 6 5%
All Others 32 28%
Total 115 100%
Source: NYC DOT Fatality Database
Factor Type Number PercentHuman 189 94%
Environment 10 5%
Vehicular 2 1%
Total 201 100%
Source: NYC DOT Fatality Database
Bicyclist Fatalities and Serious Injuries in New York City 19
20 Bicyclist Fatalities and Serious Injuries in New York City
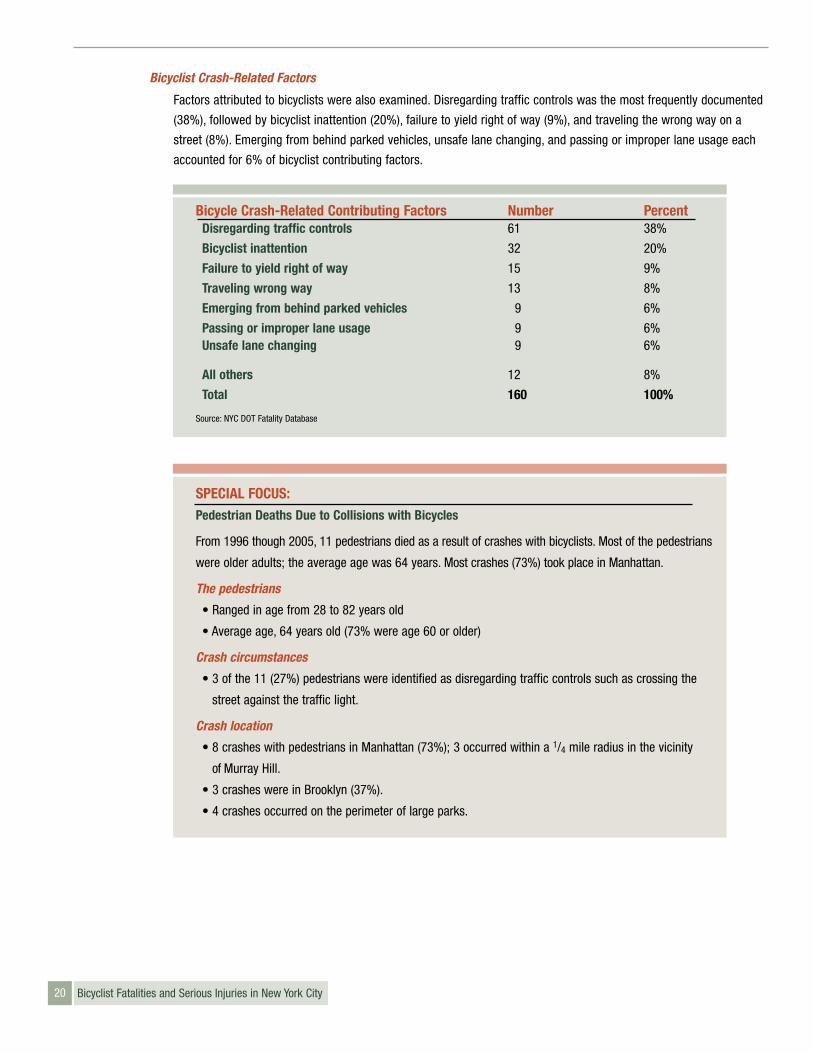
Bicyclist Crash-Related Factors
Factors attributed to bicyclists were also examined. Disregarding traffic controls was the most frequently documented
(38%), followed by bicyclist inattention (20%), failure to yield right of way (9%), and traveling the wrong way on a
street (8%). Emerging from behind parked vehicles, unsafe lane changing, and passing or improper lane usage each
accounted for 6% of bicyclist contributing factors.
Bicycle Crash-Related Contributing Factors Number PercentDisregarding traffic controls 61 38%
Bicyclist inattention 32 20%
Failure to yield right of way 15 9%
Traveling wrong way 13 8%
Emerging from behind parked vehicles 9 6%
Passing or improper lane usage 9 6%Unsafe lane changing 9 6%
All others 12 8%
Total 160 100%
Source: NYC DOT Fatality Database
SPECIAL FOCUS: Pedestrian Deaths Due to Collisions with Bicycles
From 1996 though 2005, 11 pedestrians died as a result of crashes with bicyclists. Most of the pedestrians
were older adults; the average age was 64 years. Most crashes (73%) took place in Manhattan.
The pedestrians
• Ranged in age from 28 to 82 years old
• Average age, 64 years old (73% were age 60 or older)
Crash circumstances
• 3 of the 11 (27%) pedestrians were identified as disregarding traffic controls such as crossing the
street against the traffic light.
Crash location
• 8 crashes with pedestrians in Manhattan (73%); 3 occurred within a 1/4 mile radius in the vicinity
of Murray Hill.
• 3 crashes were in Brooklyn (37%).
• 4 crashes occurred on the perimeter of large parks.
21Bicyclist Fatalities and Serious Injuries in New York City
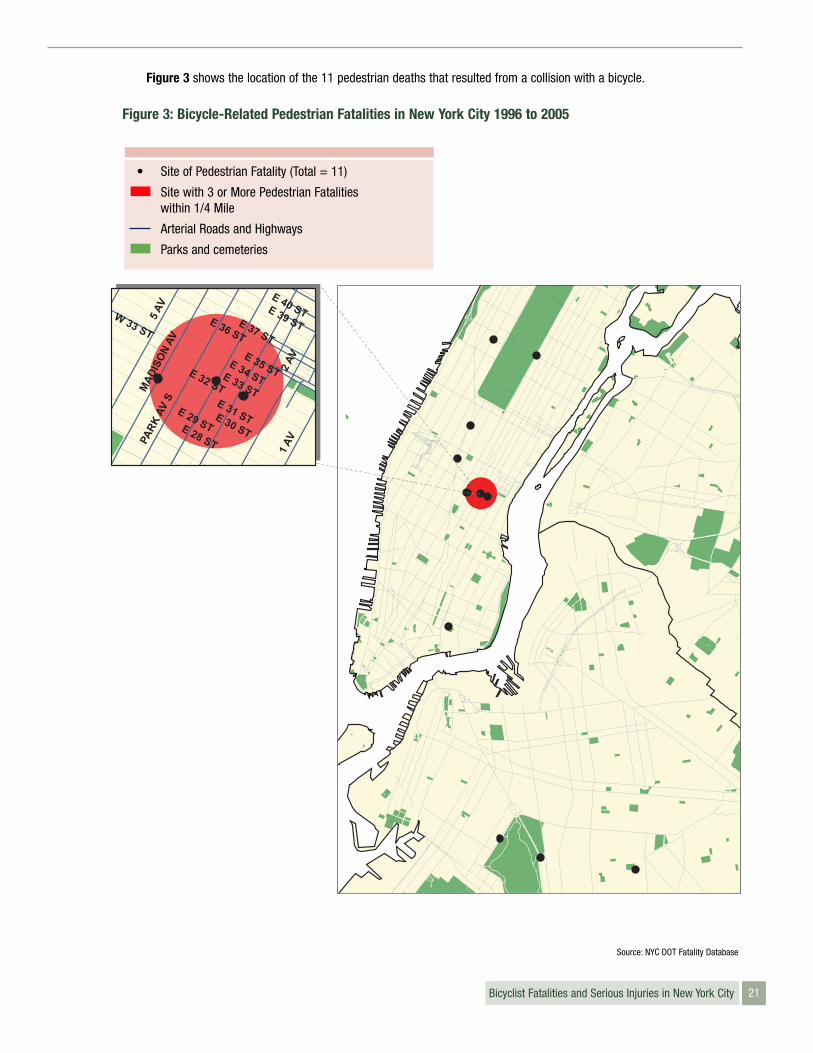
Figure 3 shows the location of the 11 pedestrian deaths that resulted from a collision with a bicycle.
Figure 3: Bicycle-Related Pedestrian Fatalities in New York City 1996 to 2005
2 A
V
E 36 ST
E 34 ST
E 29 ST
E 33 ST
E 32 ST
E 30 ST
E 35 ST
E 37 ST
MA
DIS
ON
AV
5 A
V E 39 ST
PAR
K A
V S
1 A
V
E 31 ST
E 40 STW 33 ST
E 28 ST
• Site of Pedestrian Fatality (Total = 11)
Site with 3 or More Pedestrian Fatalities within 1/4 Mile
Arterial Roads and Highways
Parks and cemeteries
Source: NYC DOT Fatality Database
22 Bicyclist Fatalities and Serious Injuries in New York City
Non-Fatal Bicyclist Injuries As mentioned earlier, fatal crashes are the most thoroughly investigated type of crash. For traffic-related bicycle crashes
that result in serious injury, data are available from the NYS DOT Safety Information Management System (SIMS).
However, information on the circumstances of these crashes is less complete. This section highlights traffic-related bicy-
cle crashes for the eight-year period 1996 through 2003, the most recent year for which data are available (information
on non-traffic crashes is not collected). Serious injuries are defined as injuries that require the bicyclist to be taken to the
hospital, and may include amputation, concussion, internal bleeding, severe burns, fracture and dislocation.
Overview
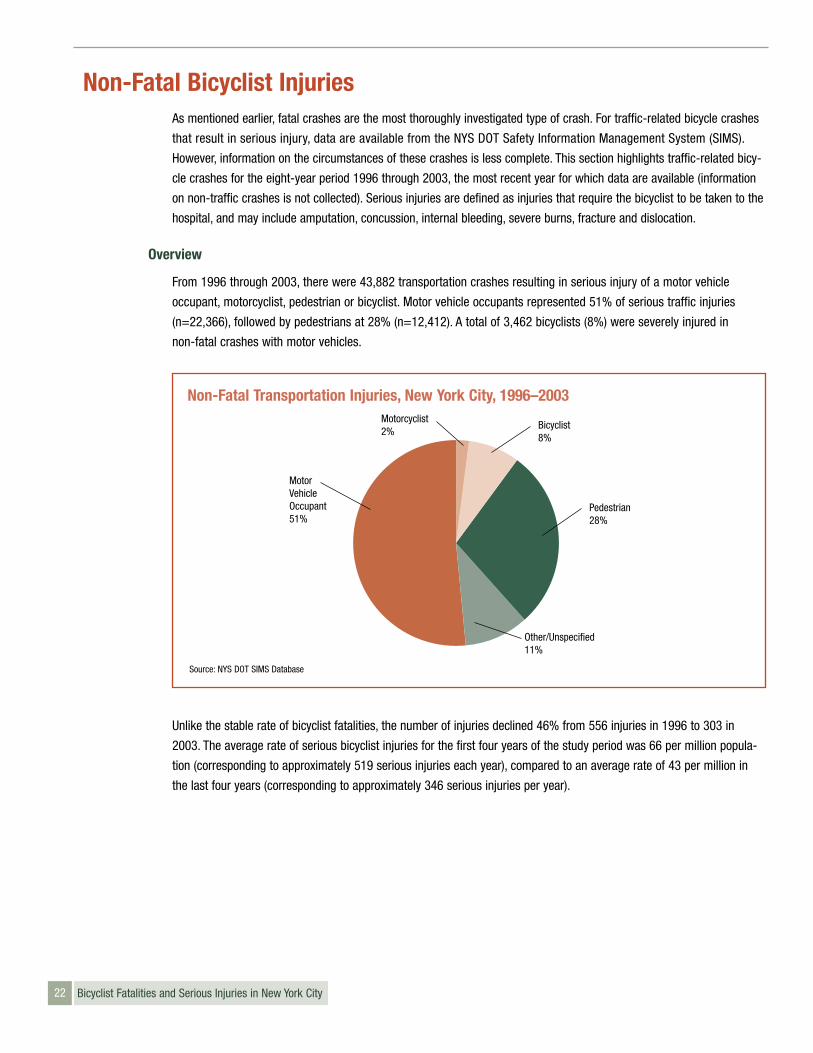
From 1996 through 2003, there were 43,882 transportation crashes resulting in serious injury of a motor vehicle
occupant, motorcyclist, pedestrian or bicyclist. Motor vehicle occupants represented 51% of serious traffic injuries
(n=22,366), followed by pedestrians at 28% (n=12,412). A total of 3,462 bicyclists (8%) were severely injured in
non-fatal crashes with motor vehicles.
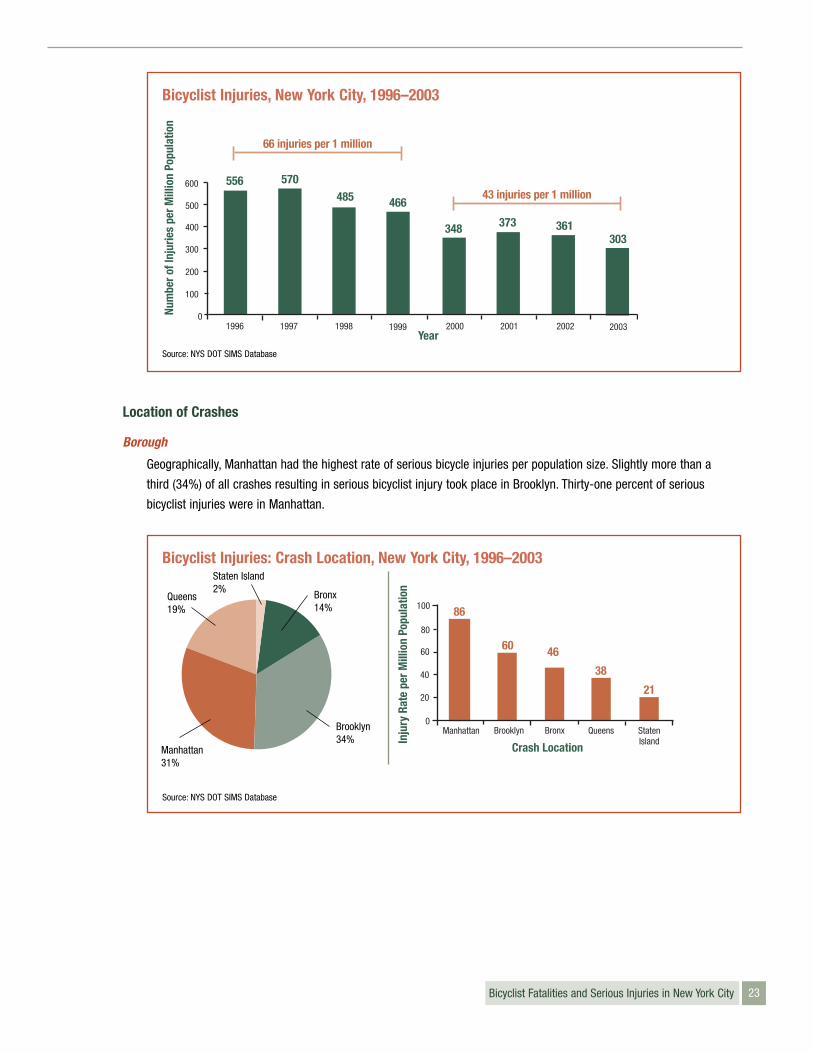
Unlike the stable rate of bicyclist fatalities, the number of injuries declined 46% from 556 injuries in 1996 to 303 in
2003. The average rate of serious bicyclist injuries for the first four years of the study period was 66 per million popula-
tion (corresponding to approximately 519 serious injuries each year), compared to an average rate of 43 per million in
the last four years (corresponding to approximately 346 serious injuries per year).
Source: NYS DOT SIMS Database
Non-Fatal Transportation Injuries, New York City, 1996–2003Motorcyclist2%
MotorVehicleOccupant51%
Bicyclist8%
Pedestrian28%
Other/Unspecified11%
23Bicyclist Fatalities and Serious Injuries in New York City
Location of Crashes
Borough
Geographically, Manhattan had the highest rate of serious bicycle injuries per population size. Slightly more than a
third (34%) of all crashes resulting in serious bicyclist injury took place in Brooklyn. Thirty-one percent of serious
bicyclist injuries were in Manhattan.
100
80
60
40
20
0
60
Inju
ry R
ate
per M
illio
n Po
pula
tion
Brooklyn Bronx
86
Manhattan
Crash Location
38
Queens
21
StatenIsland
46
Source: NYS DOT SIMS Database
Bicyclist Injuries: Crash Location, New York City, 1996–2003
Queens19%
Manhattan31%
Staten Island 2% Bronx
14%
Brooklyn34%
Num
ber o
f Inj
urie
s pe
r Mill
ion
Popu
latio
n556 570
485 466
348 373 361303
600
500
400
300
200
100
01996 1997 1998 1999 2000
Year2001 2002 2003
66 injuries per 1 million
43 injuries per 1 million
Bicyclist Injuries, New York City, 1996–2003
Source: NYS DOT SIMS Database
24 Bicyclist Fatalities and Serious Injuries in New York City
Crash Location: Intersection vs. Mid-block
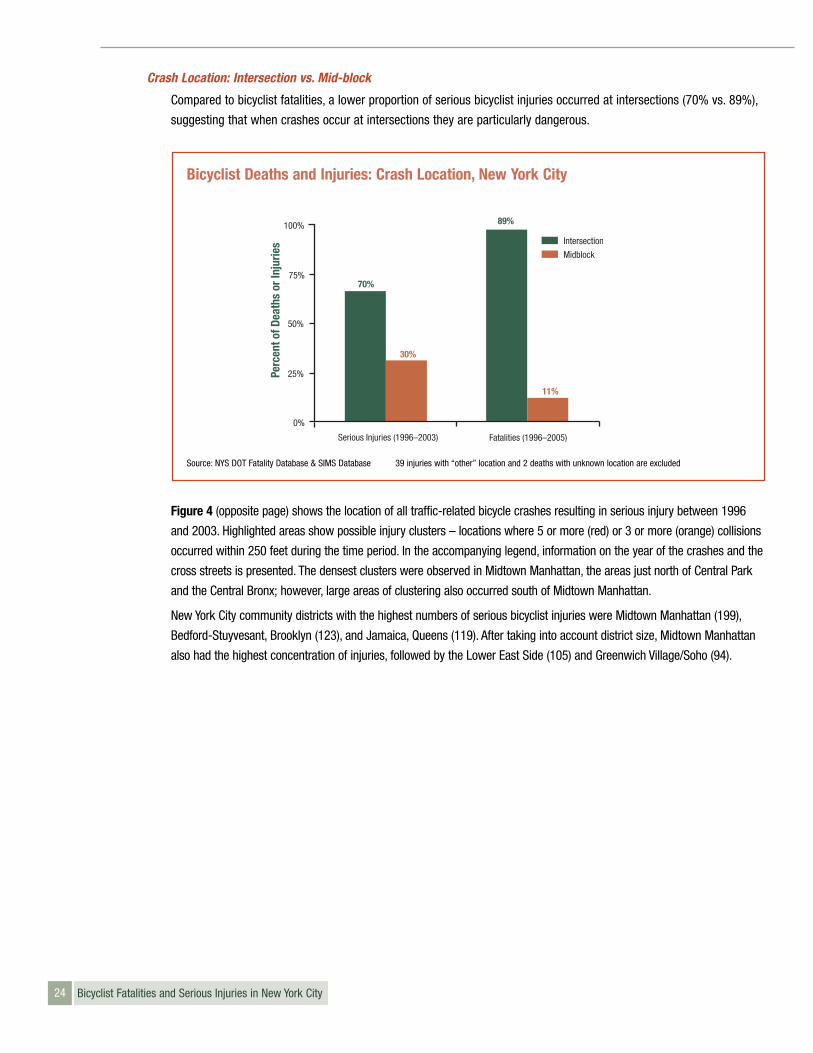
Compared to bicyclist fatalities, a lower proportion of serious bicyclist injuries occurred at intersections (70% vs. 89%),
suggesting that when crashes occur at intersections they are particularly dangerous.
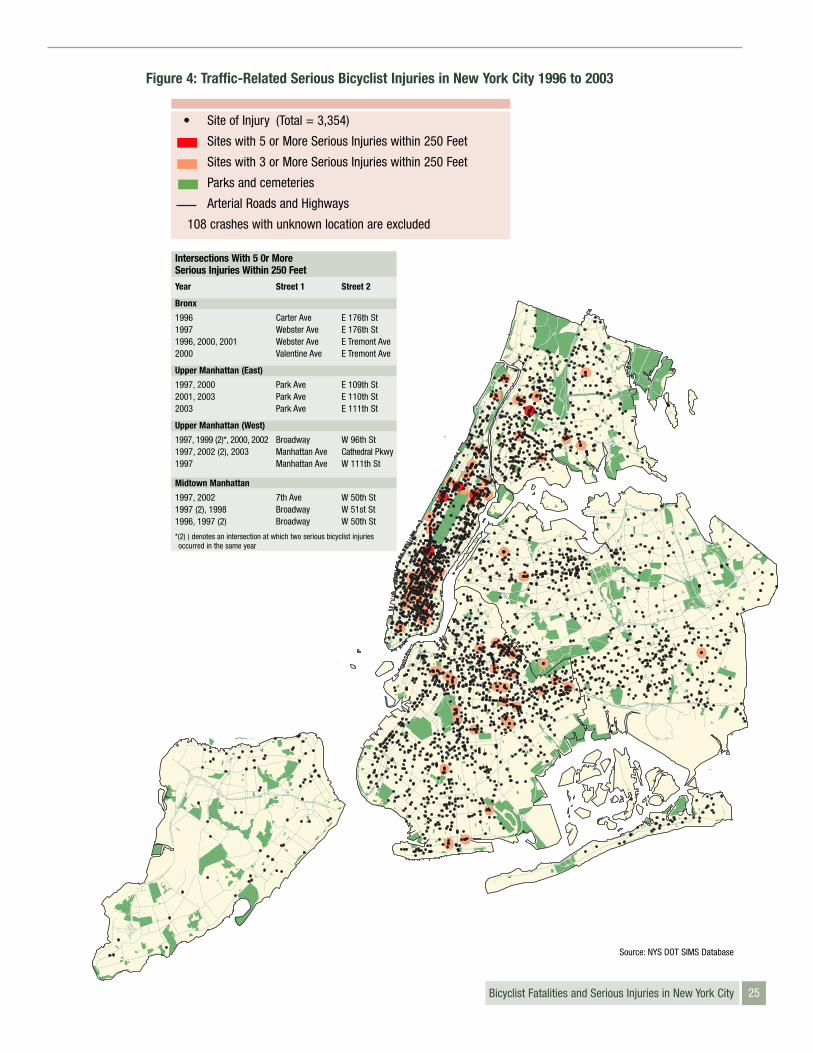
Figure 4 (opposite page) shows the location of all traffic-related bicycle crashes resulting in serious injury between 1996
and 2003. Highlighted areas show possible injury clusters – locations where 5 or more (red) or 3 or more (orange) collisions
occurred within 250 feet during the time period. In the accompanying legend, information on the year of the crashes and the
cross streets is presented. The densest clusters were observed in Midtown Manhattan, the areas just north of Central Park
and the Central Bronx; however, large areas of clustering also occurred south of Midtown Manhattan.
New York City community districts with the highest numbers of serious bicyclist injuries were Midtown Manhattan (199),
Bedford-Stuyvesant, Brooklyn (123), and Jamaica, Queens (119). After taking into account district size, Midtown Manhattan
also had the highest concentration of injuries, followed by the Lower East Side (105) and Greenwich Village/Soho (94).
Perc
ent o
f Dea
ths
or In
jurie
s70%
89%
11%
30%
100%
75%
50%
25%
0%
Serious Injuries (1996–2003) Fatalities (1996–2005)
Intersection
Midblock
Bicyclist Deaths and Injuries: Crash Location, New York City
Source: NYS DOT Fatality Database & SIMS Database 39 injuries with “other” location and 2 deaths with unknown location are excluded
25Bicyclist Fatalities and Serious Injuries in New York City
Figure 4: Traffic-Related Serious Bicyclist Injuries in New York City 1996 to 2003
• Site of Injury (Total = 3,354)
Sites with 5 or More Serious Injuries within 250 Feet
Sites with 3 or More Serious Injuries within 250 Feet
Parks and cemeteries
Arterial Roads and Highways
108 crashes with unknown location are excluded
Intersections With 5 0r More Serious Injuries Within 250 Feet
Year Street 1 Street 2
Bronx
1996 Carter Ave E 176th St1997 Webster Ave E 176th St1996, 2000, 2001 Webster Ave E Tremont Ave2000 Valentine Ave E Tremont Ave
Upper Manhattan (East)
1997, 2000 Park Ave E 109th St2001, 2003 Park Ave E 110th St2003 Park Ave E 111th St
Upper Manhattan (West)
1997, 1999 (2)*, 2000, 2002 Broadway W 96th St1997, 2002 (2), 2003 Manhattan Ave Cathedral Pkwy 1997 Manhattan Ave W 111th St
Midtown Manhattan
1997, 2002 7th Ave W 50th St1997 (2), 1998 Broadway W 51st St1996, 1997 (2) Broadway W 50th St
*(2) ) denotes an intersection at which two serious bicyclist injuries occurred in the same year
Source: NYS DOT SIMS Database
26 Bicyclist Fatalities and Serious Injuries in New York City
Time of Crashes
Month and Day of Week
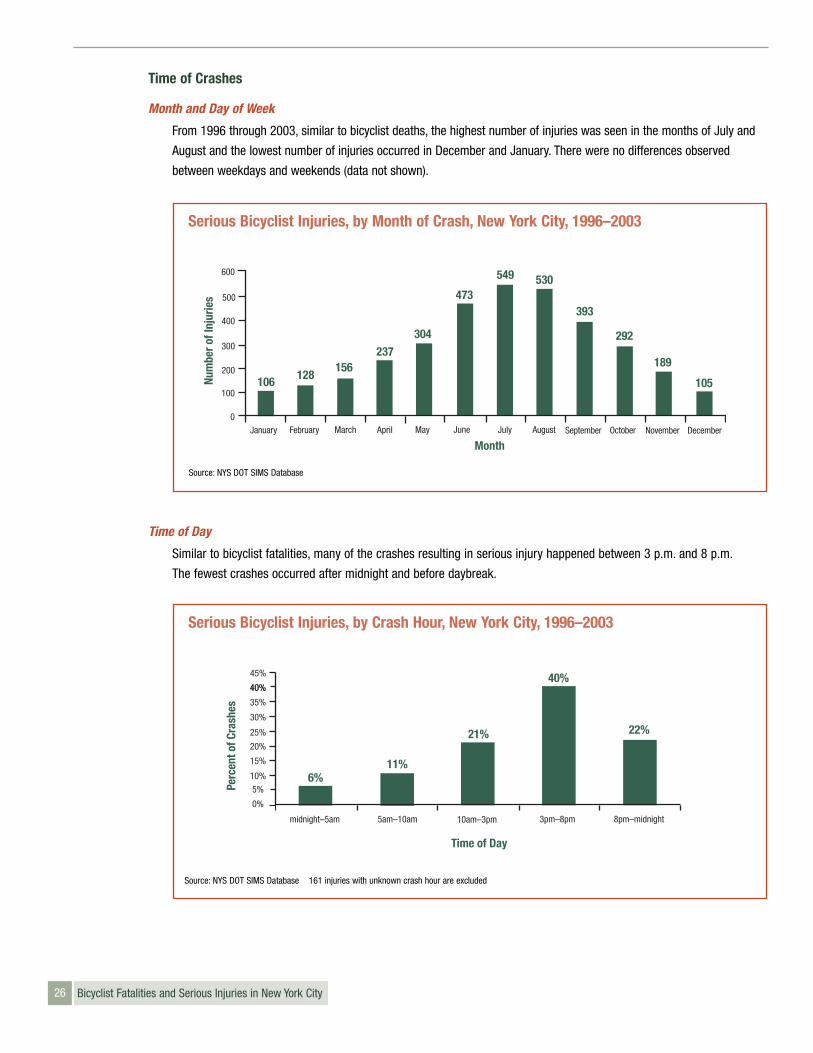
From 1996 through 2003, similar to bicyclist deaths, the highest number of injuries was seen in the months of July and
August and the lowest number of injuries occurred in December and January. There were no differences observed
between weekdays and weekends (data not shown).
Time of Day
Similar to bicyclist fatalities, many of the crashes resulting in serious injury happened between 3 p.m. and 8 p.m.
The fewest crashes occurred after midnight and before daybreak.
Num
ber o
f Inj
urie
s
106 128156
237304
473
549 530
393
292
189
Month
105
600
500
400
300
200
100
0January February March April May June July August September October November December
Serious Bicyclist Injuries, by Month of Crash, New York City, 1996–2003Pe
rcen
t of C
rash
es
Time of Day
6%11%
21%
40%
22%
40%
35%
30%
40%
25%
20%
15%
10%
5%
0%
midnight–5am 5am–10am 10am–3pm 3pm–8pm 8pm–midnight
45%
Source: NYS DOT SIMS Database 161 injuries with unknown crash hour are excluded
Source: NYS DOT SIMS Database
Serious Bicyclist Injuries, by Crash Hour, New York City, 1996–2003
27Bicyclist Fatalities and Serious Injuries in New York City
Characteristics of Crashes
Helmet Use
Documentation of helmet use among bicyclists suffering serious injuries improved markedly beginning in 2001. Even
so, for the time period 2001–2003, helmet use was only documented in 32% of crashes resulting in serious injuries.
Among serious injury crashes for which helmet use was documented, 87% of bicyclists were not wearing a helmet at
the time of the crash; 13% were wearing a helmet. While interpretation is hampered by missing data, the lower level of
helmet use in fatal crashes (3% vs. 13%) suggests that not wearing a helmet may be particularly dangerous.
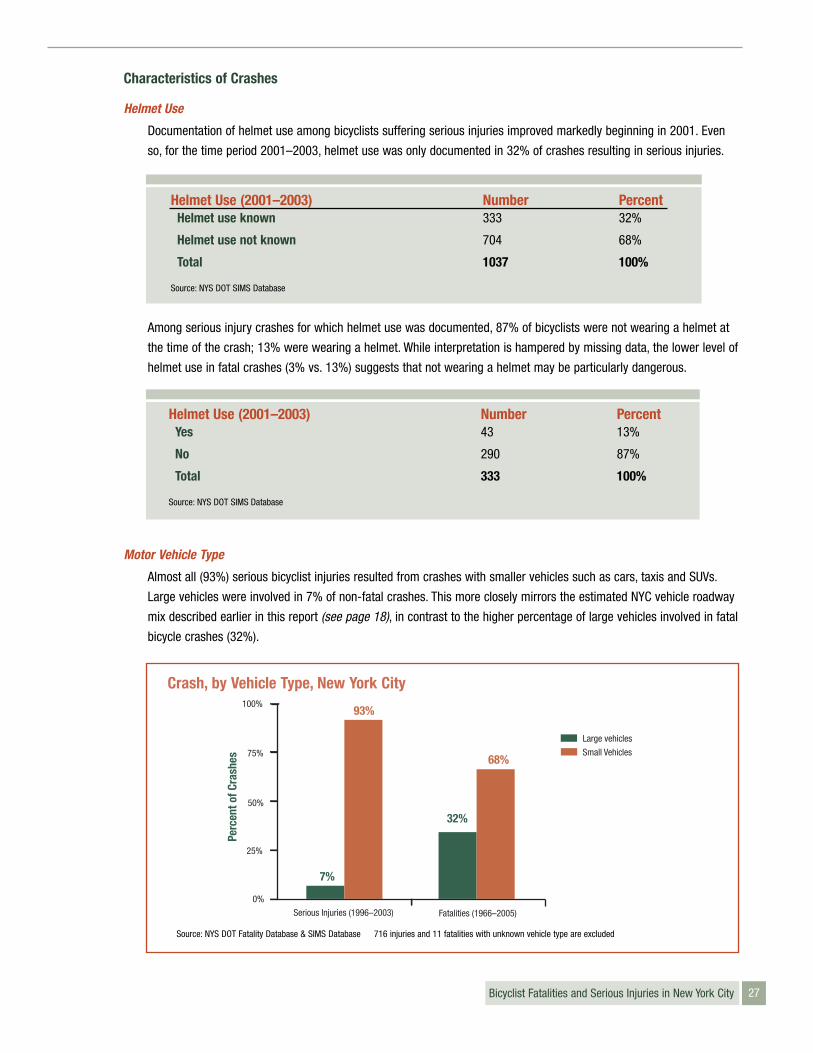
Motor Vehicle Type
Almost all (93%) serious bicyclist injuries resulted from crashes with smaller vehicles such as cars, taxis and SUVs.
Large vehicles were involved in 7% of non-fatal crashes. This more closely mirrors the estimated NYC vehicle roadway
mix described earlier in this report (see page 18), in contrast to the higher percentage of large vehicles involved in fatal
bicycle crashes (32%).
Helmet Use (2001–2003) Number PercentHelmet use known 333 32%
Helmet use not known 704 68%
Total 1037 100%
Source: NYS DOT SIMS Database
Large vehicles
Small Vehicles
Perc
ent o
f Cra
shes
7%
93%
32%
68%
100%
75%
50%
25%
0%
Serious Injuries (1996–2003) Fatalities (1966–2005)
Crash, by Vehicle Type, New York City
Source: NYS DOT Fatality Database & SIMS Database 716 injuries and 11 fatalities with unknown vehicle type are excluded
Helmet Use (2001–2003) Number PercentYes 43 13%
No 290 87%
Total 333 100%
Source: NYS DOT SIMS Database
28 Bicyclist Fatalities and Serious Injuries in New York City
Crash-Related Factors
As with fatal crashes, investigators attempt to determine the contributing factors that played a role in non-fatal
crashes, including the role of human factors (drivers and bicyclists), vehicular factors, and environmental factors.
Factors were documented in more than half (55%) of bicycle crashes resulting in serious injury.
Of crashes with documented factors, almost all (95%) were human factors, such as inattention or disregarding traffic
controls. Environmental factors, such as obstruction, glare, and slippery pavement, accounted for 3% of factors.
Vehicular factors, such as defective brakes, accounted for 2% of contributing factors.
Multiple Factors
In contrast to bicyclist deaths, a higher proportion of serious injury crash factors were assigned to motor vehicle drivers
than to bicyclists, and only a small proportion (6%) were documented to be the result of both motor vehicle driver and
bicyclist factors. Because both the bicyclist and the driver are available to recount the events leading up to the crash, the
assignment of contributing factors for serious injuries might be more accurate than among fatalities. However the large
amount of missing information makes this difficult to confirm.
Crash-Related Contributing Factor Type Number PercentBicycle factor only 455 13%
Vehicle factor only 1222 35%
Bicycle & vehicle factors 222 6%
No factors documented 1563 45%
Total 3462 100%
Source: NYS DOT SIMS Database
Factors Types Number PercentHuman 1804 95%
Environmental 60 3%
Vehicular 35 2%
Total 1899 100%
Source: NYS DOT SIMS Database
Documentation of Crash-Related Factors Number PercentDocumented factors 1899 55%
No factors documented 1563 45%
Total 3462 100%
Source: NYS DOT SIMS Database
29Bicyclist Fatalities and Serious Injuries in New York City
Motor Vehicle Crash-Related Contributing Factors
Driver inattention (31%), unspecified human error (29%), failure to yield (9%), speeding (4%) and disregarding traffic
controls (4%) were the five most common factors attributed to motor vehicle drivers.
Bicycle Crash-Related Contributing Factors
Among the top factors attributed to bicyclists, a bicyclist crossing into a vehicle path accounted for 84% of documented
bicyclist contributing factors. This was followed by disregarding traffic controls (8%), failure to yield (2%), speeding
(1%) and turning improperly (1%).
Motor Vehicle Crash-Related Contributing Factors Number PercentDriver inattention 454 31%
Unspecified human error 422 29%
Failure to yield 133 9%
Speeding 62 4%
Disregarding traffic controls 58 4%
All others 315 22%
Total 1444 100%
Source: NYS DOT SIMS Database
Bicycle Crash-Related Contributing Factors Number PercentBicyclist crossing into a vehicle path 572 84%
Disregarding traffic controls 54 8%
Failure to yield 13 2%
Speeding 9 1%
Turning improperly 8 1%
All others 21 3%
Total 677 100%
Source: NYS DOT SIMS Database
30 Bicyclist Fatalities and Serious Injuries in New York City
DiscussionSummary
This report describes bicyclist fatalities in New York City over a ten-year period, as well as bicyclist serious injuries for an 8-year
period. Several key points emerge from the analysis. First, nearly all bicyclist deaths were the result of a collision with a motor
vehicle. In particular, a high proportion of bicyclist fatalities were due to a crash with a large vehicle, such as a truck or a bus.
Second, the vast majority of deaths occurred outside of bicycle lanes and other bicycle facilities. When a fatal bicycle crash with a
motor vehicle occurred on a city street with a bicycle lane, the bicyclist was always outside of the lane itself, suggesting that ded-
icated bicycle paths or lanes may help reduce crashes with a motor vehicle. Third, human factors on the part of both motorists
and bicyclists were the most common type of contributing factor for bicyclist deaths. For motor vehicle drivers, inattention was
the most frequent cause of involvement in a fatal bicyclist crash. For bicyclists, disregarding traffic signs or signals at inter-
sections was demonstrated to be particularly deadly. Fourth, most bicyclists who died had head injuries, and nearly all of the
bicyclists killed were not wearing a helmet at the time of the crash. Head injuries may not have been the primary cause of death
in all cases, but these findings do highlight the head as being particularly vulnerable to injury and a likely major cause of bicyclist
fatalities. While the rate of helmet use among those bicyclists with serious injuries was low, it was six times higher than the rate
among those bicyclists killed. These data suggest that helmet use is a critically important protection for all bicyclists. Fifth, nearly
all bicyclists who died were male. While the majority of bicyclists in NYC may indeed be male, these findings suggest that they
are at greater risk for having a fatal accident. This report also identifies several geographic clusters of bicyclist fatalities and
serious injuries. While not adjusted for level of bicycling activity, these clusters could be used to inform programs intended to
increase bicyclist safety.
Many of the key findings in this report may be related to NYC’s uniquely dense urban environment. The City’s fast pace contributes
to road users of all types frequently disregarding traffic signs and signals which can cause frequent and dangerous transportation
encounters. Different trend patterns were noted between bicyclist fatalities and serious injuries. While serious bicycle injuries
declined, fatalities remained fairly constant suggesting that additional resources and education are needed. Knowledge of whether
bicycling increased, decreased, or stayed the same over the 10-year timeframe is limited, but screen-line count data and YRBS
survey findings suggest that no large increase or decrease occurred. The possible lack of increase in bicycling in most recent
years warrants attention, as promotion of bicycling can help address health problems such as obesity and diabetes.
Limitations
One limitation of this report is its inability to calculate actual mortality rates among bicyclists to estimate the true risk associated
with different bicycling practices. To do so would require more information about the number of bicyclists in NYC, how much
they ride, and where they ride in the city. Geographic areas or demographic groups identified in this report as having higher
numbers of fatalities or injuries may be the result of more bicyclists in these groups, as opposed to being at higher risk for
bicycle crashes. Similarly, data measuring time of day and month are not normalized to take into account the volume of motor
vehicles and bicyclists on the road.
This report describes all bicyclist fatalities and non-fatal serious bicyclist injuries in NYC identified by the following city agencies:
DOT, NYPD, DOHMH, and OCME. The process of matching information on bicyclist fatalities from DOT and NYPD to DOHMH
death certificates, and OCME files should have captured all bicyclist fatalities occurring in NYC during the study time frame.
It is possible, however, that additional bicyclist fatalities or serious injuries occurred that were not properly reported.
While substantial effort was made to improve the quality and completeness of data by reviewing original records, this report is
limited by missing information. Certain types of data were hard to capture, such as helmet use, contributing factors, traffic
violations, and type of injury. The contributing factor data from bicyclist fatalities may be particularly incomplete, since many
bicyclist fatalities lacked witnesses other than the motor vehicle driver.
31Bicyclist Fatalities and Serious Injuries in New York City
Recommendations
The following recommendations are aimed at promoting bicycling and increasing bicycle safety. Recommendations are
grouped for the following constituencies: motor vehicle drivers, bicyclists, community-based organizations and health care
providers.
Motor Vehicle driver education and safety messages should explicitly address bicyclist safety, with a focus on the
following critical messages:
• Be aware at all times—Motorist inattention was found to be the most frequent known contributing factor for motor
vehicle drivers in both fatal and serious injury bicycle crashes.
• Respect bicyclists’ right to the road—By law, a bicyclist is granted the same rights to the road as a motor vehicle.
However, in the case of an accident between a motor vehicle and a bicyclist, the bicyclist bears a far greater risk of death
and injury than a driver. Motor vehicle drivers should be reminded that driving and parking in bicycle lanes is against the
law, and that staying alert when turning can save lives.
• Take additional precautions when driving large vehicles—Due to the additional danger large vehicles pose and driv-
ers’ diminished ability to see bicyclists, drivers of trucks, vans and large sport utility vehicles should exercise extreme
caution, particularly at intersections. Consider the use of cross over mirrors. Cross over mirrors, placed on the hood of a
large vehicle, enable the driver to see pedestrians or bicyclists passing directly in front of the vehicle. Large vehicle drivers
should be especially careful of the rear part of their vehicle when making a right turn.
• Obey speed limits—Unsafe speed by motor vehicle drivers was the second most frequent known contributing factor to
fatal bicycle crashes.
Bicyclist education and safety messages should be provided to both NYC children and adults:
• Wear a bicycle helmet at all times while riding—Nearly three-quarters of bicyclist fatalities with available information
involved an injury to the head. Nonetheless, our data suggest nearly all (97%) riders involved in a fatal crash, and 87% of
riders seriously injured were not wearing a helmet at the time of the accident. Bicycle helmet usage is mandatory for all
children under the age of 14 in New York; safety messages should remind families of this law and encourage all bicyclists
to wear helmets.
• Follow traffic rules and control devices—Disregarding traffic controls such as traffic signs or signals was the most frequent
contributing factor among bicyclist fatalities and the second most frequent contributing factor in serious injuries.
• Be alert when crossing roadway intersections—Most bicyclist fatalities occurred within 25 feet of an intersection. Even
when following traffic signals properly, bicyclists need to stay alert when crossing roadway intersections.
• Stay on designated bicycle lanes whenever possible—Designated lanes may provide bicycle riders additional protec-
tion from motor vehicles and increase awareness among drivers. Riders are also cautioned against riding on limited access
highways, which is prohibited by law. Crashes on limited access highways accounted for 7% of all fatal crashes.
• Be aware at all times—Bicyclist inattention was the second most frequent known contributing factor to fatal
bicycle crashes.
• Stay off sidewalks and exercise care around pedestrians—The majority of pedestrian deaths occurred on a sidewalk
or in a designated lane shared by pedestrians and bicyclists.
32 Bicyclist Fatalities and Serious Injuries in New York City
Health care providers and community-based organizations should actively promote safe bicycling as a way to increasephysical activity and fitness.
• Encourage bicycling as a fun way to increase physical activity—Regular bicycling improves health by reducing therisk of obesity, cardiovascular disease and other major diseases.
• Offer prevention messages about bicycle safety—Heath care providers and community-based organizations are trustedsources of reliable information. Staff and providers can remind patients about bicycle safety, promote helmet use, encourageriders to wear bright clothing and reflectors, educate riders to stop and look before entering roadways, and ask parents tosupervise young children while they are riding.
• Provide resources to encourage safe bicycling—Health care providers and community-based organizations can provideand distribute information about free and low cost helmet programs, proper use of bicycle helmets, and bicycle mapssuch as those produced by DOT (See Resources).
Action Steps
There are a number of steps that the City of New York can immediately take to improve bicycle safety. The City will under-take the following action steps by September 2007:
Bicycle Infrastructure
The City will continue to expand and improve bicycle facilities. Facilities such as bicycle lanes may lead to increased bicyclesafety and an increase in ridership.
• Complete 200 miles of bicycle facilities (paths, lanes and routes) over the next three years on NYC streets.
• Focus on introducing new bicycle paths and improving and maintaining existing ones.
• Conduct a pilot program of easily identified green-colored lanes to reinforce on-street striped lanes.
• Install chevron markings, bicycle logos, and special signs for bicycle routes designed to improve how bicyclists andmotorists share the road.
• Investigate opportunities to incorporate requirements into the NYC Zoning Resolution for indoor bicycle parking in newbuildings, as well as during substantial renovations.
• Accelerate the placement of outside bicycle parking racks citywide.
• Conduct follow up analyses to better ascertain locations which have disproportionately high fatalities or injuries in relationto exposure. Study these locations for possible safety improvements.
• Install bicycle racks on city park grounds, either as part of planned Capital projects or, where Capital projects are notplanned but demand exists. Use the CityRacks program to incorporate bicycle racks where feasible and appropriate.
• Aggressively pursue grant funding for new greenway construction.
• Upgrade and improve existing greenway infrastructure within City parks.
• Complete 40 miles of greenways in City parks over the next four years, as well as aligned greenway destinations andenhancements such as comfort stations, boat launches, and environmental restoration projects.
• Begin construction of mountain bike trails in the South Park section of Fresh Kills, Staten Island. Complete construction of mountain bike trails in Highland Park and Cunningham Park in Queens.
33Bicyclist Fatalities and Serious Injuries in New York City
Motorist Awareness
The City will take the following steps to increase motorist awareness of bicyclists:
• Launch a public awareness campaign for both motorists and bicyclists to increase roadway awareness and make clear a bicyclist’s right to the road. This campaign will be conducted in collaboration with elected officials, community partnersand transportation advocates.
• Provide materials on bicycle awareness to new driver education and remedial traffic school programs.
• Expand the number of workshops for commercial and non-commercial drivers in the City’s government fleet, and includebicycle safety information.
• Work with commercial and non-commercial driving associations such as American Automobile Association (AAA), theAmerican Trucking Association, the Truck Load Carriers Association and Teamsters Local 16 to increase awarenessaround bicycle safety issues.
Bicyclist Awareness
The City will undertake the following efforts to increase awareness among bicyclists:
• Launch a public awareness campaign for both motorists and bicyclists to increase roadway awareness and make clear a bicy-clist’s right to the road. This campaign will be conducted in collaboration with elected officials, community partners andtransportation advocates.
• Introduce programs to supply free bicycle helmets and helmet fit instructions to all interested bicyclists in New York City.
• Develop a video documentary that depicts the dangers associated with failing to obey traffic laws while riding a bicycle.
• Collaborate with community partners, transportation advocates and schools to increase promotion of helmets and other protective gear (such as bells, lights, mirrors, and bright clothing), and to increase awareness among parents and children about the mandatory bicycle helmet law for children under 14.
• Work with associations of bicycle riders, including delivery and messenger services, to improve bicycle safety among workers.
• Coordinate the DPR Bicycle Safety Education Campaign with off-peak closures in Central Park. Invite bicycling advocates to join city officials at campaign checkpoints.
• Develop a hands-on bicycling skills and safety instruction program to be added to after-school and summer camp pro-grams run by the Department of Parks and Recreation. Participating children will practice riding bicycles and wearinghelmets properly and will receive certificates upon completion.
• Develop a family bicycling program to be offered during the spring and summer months at parks and greenways through-out the city. The program will include safety instruction. Certain venues will also offer guided nature and historic rides ledby Urban Park Rangers.
• Increase participation in the Queens Star Track youth track cycling and mentoring program for children 9-13 years old,located at the Kissena Velodrome. Consider development of an indoor fitness and nutrition component during wintermonths. Support participation in track bicycling competitions for advanced cyclists.
• Educate bicyclists about existing and proposed bike routes through increased distribution of bicycling maps, particularly inareas with high rates of bicycle traffic.
Investigation and Enforcement
The City will undertake the following efforts to improve crash investigations and enforce existing regulations:
• Train more DOT accident investigation staff to ensure that all transportation fatalities are investigated in a timely manner.
• Continue enforcement of laws against motorists who are parked or driving in a bicycle lane, and enforce proper regard oftraffic control signals among motorists and bicyclists.
34 Bicyclist Fatalities and Serious Injuries in New York City
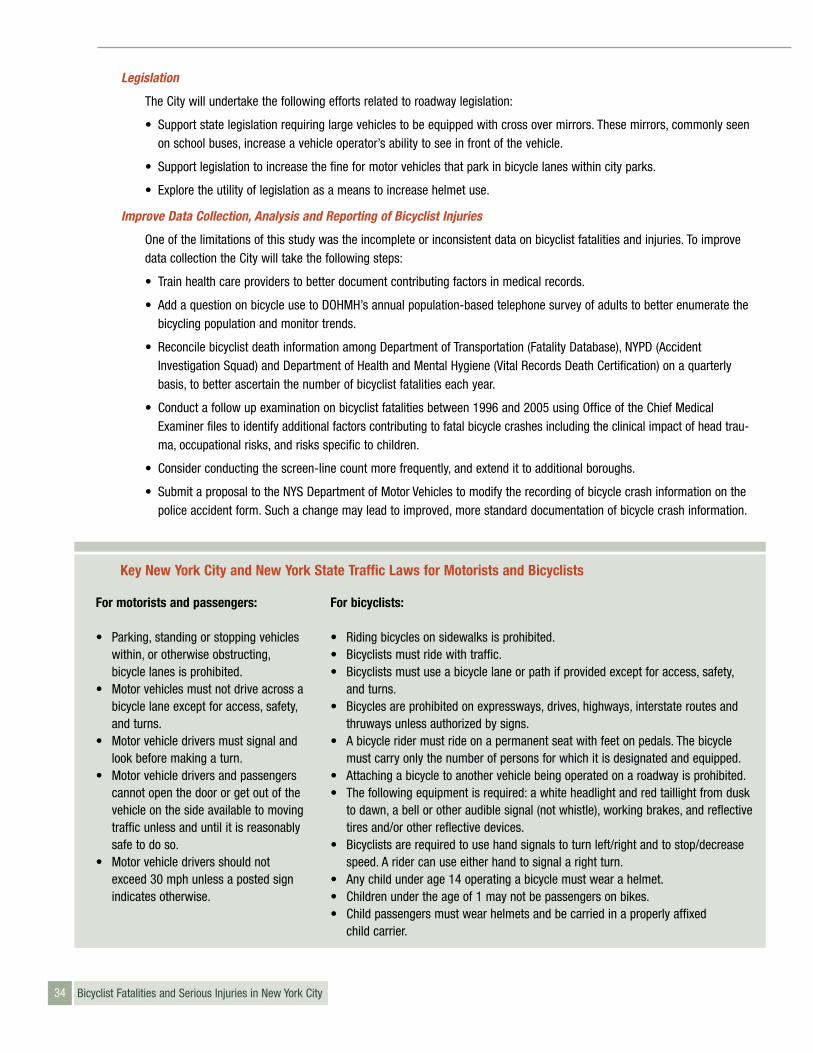
Legislation
The City will undertake the following efforts related to roadway legislation:
• Support state legislation requiring large vehicles to be equipped with cross over mirrors. These mirrors, commonly seenon school buses, increase a vehicle operator’s ability to see in front of the vehicle.
• Support legislation to increase the fine for motor vehicles that park in bicycle lanes within city parks.
• Explore the utility of legislation as a means to increase helmet use.
Improve Data Collection, Analysis and Reporting of Bicyclist Injuries
One of the limitations of this study was the incomplete or inconsistent data on bicyclist fatalities and injuries. To improvedata collection the City will take the following steps:
• Train health care providers to better document contributing factors in medical records.
• Add a question on bicycle use to DOHMH’s annual population-based telephone survey of adults to better enumerate thebicycling population and monitor trends.
• Reconcile bicyclist death information among Department of Transportation (Fatality Database), NYPD (AccidentInvestigation Squad) and Department of Health and Mental Hygiene (Vital Records Death Certification) on a quarterlybasis, to better ascertain the number of bicyclist fatalities each year.
• Conduct a follow up examination on bicyclist fatalities between 1996 and 2005 using Office of the Chief MedicalExaminer files to identify additional factors contributing to fatal bicycle crashes including the clinical impact of head trau-ma, occupational risks, and risks specific to children.
• Consider conducting the screen-line count more frequently, and extend it to additional boroughs.
• Submit a proposal to the NYS Department of Motor Vehicles to modify the recording of bicycle crash information on thepolice accident form. Such a change may lead to improved, more standard documentation of bicycle crash information.
Key New York City and New York State Traffic Laws for Motorists and Bicyclists
For bicyclists:
• Riding bicycles on sidewalks is prohibited.• Bicyclists must ride with traffic.• Bicyclists must use a bicycle lane or path if provided except for access, safety,
and turns.• Bicycles are prohibited on expressways, drives, highways, interstate routes and
thruways unless authorized by signs.• A bicycle rider must ride on a permanent seat with feet on pedals. The bicycle
must carry only the number of persons for which it is designated and equipped.• Attaching a bicycle to another vehicle being operated on a roadway is prohibited.• The following equipment is required: a white headlight and red taillight from dusk
to dawn, a bell or other audible signal (not whistle), working brakes, and reflectivetires and/or other reflective devices.
• Bicyclists are required to use hand signals to turn left/right and to stop/decreasespeed. A rider can use either hand to signal a right turn.
• Any child under age 14 operating a bicycle must wear a helmet.• Children under the age of 1 may not be passengers on bikes.• Child passengers must wear helmets and be carried in a properly affixed
child carrier.
For motorists and passengers:
• Parking, standing or stopping vehicleswithin, or otherwise obstructing,bicycle lanes is prohibited.
• Motor vehicles must not drive across abicycle lane except for access, safety,and turns.
• Motor vehicle drivers must signal andlook before making a turn.
• Motor vehicle drivers and passengerscannot open the door or get out of thevehicle on the side available to movingtraffic unless and until it is reasonablysafe to do so.
• Motor vehicle drivers should notexceed 30 mph unless a posted signindicates otherwise.
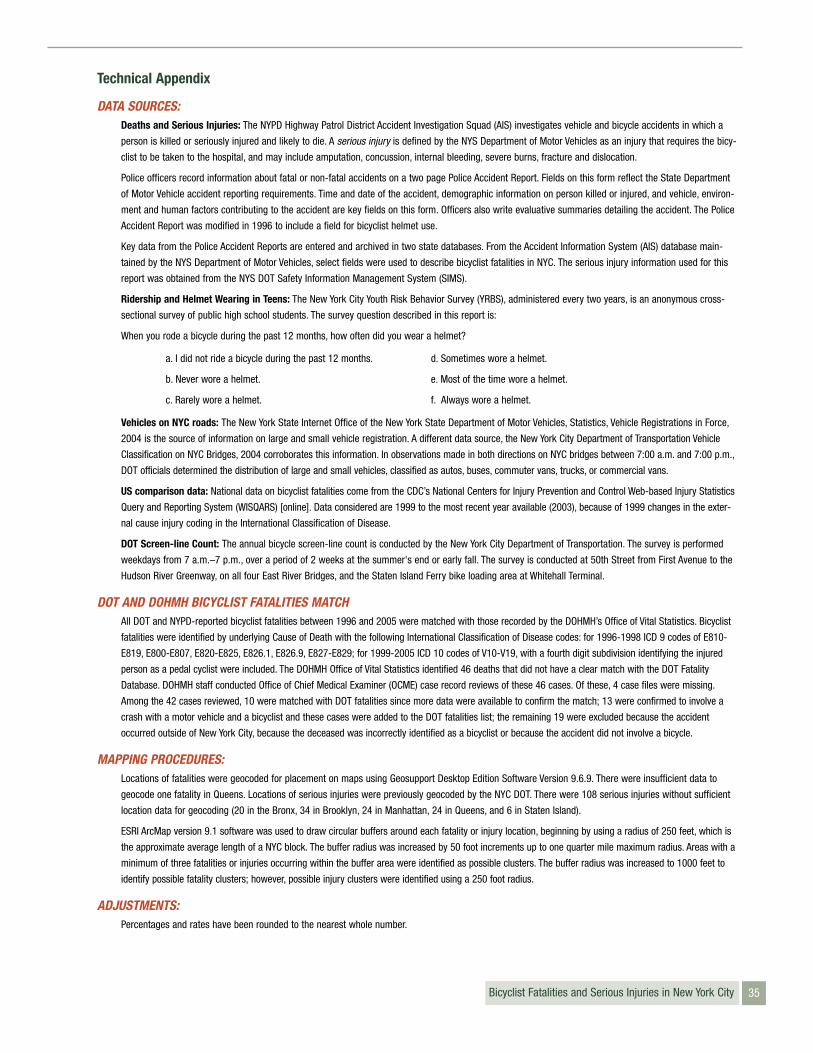
35
Technical Appendix
DATA SOURCES: Deaths and Serious Injuries: The NYPD Highway Patrol District Accident Investigation Squad (AIS) investigates vehicle and bicycle accidents in which a
person is killed or seriously injured and likely to die. A serious injury is defined by the NYS Department of Motor Vehicles as an injury that requires the bicy-
clist to be taken to the hospital, and may include amputation, concussion, internal bleeding, severe burns, fracture and dislocation.
Police officers record information about fatal or non-fatal accidents on a two page Police Accident Report. Fields on this form reflect the State Department
of Motor Vehicle accident reporting requirements. Time and date of the accident, demographic information on person killed or injured, and vehicle, environ-
ment and human factors contributing to the accident are key fields on this form. Officers also write evaluative summaries detailing the accident. The Police
Accident Report was modified in 1996 to include a field for bicyclist helmet use.
Key data from the Police Accident Reports are entered and archived in two state databases. From the Accident Information System (AIS) database main-
tained by the NYS Department of Motor Vehicles, select fields were used to describe bicyclist fatalities in NYC. The serious injury information used for this
report was obtained from the NYS DOT Safety Information Management System (SIMS).
Ridership and Helmet Wearing in Teens: The New York City Youth Risk Behavior Survey (YRBS), administered every two years, is an anonymous cross-
sectional survey of public high school students. The survey question described in this report is:
When you rode a bicycle during the past 12 months, how often did you wear a helmet?
a. I did not ride a bicycle during the past 12 months. d. Sometimes wore a helmet.
b. Never wore a helmet. e. Most of the time wore a helmet.
c. Rarely wore a helmet. f. Always wore a helmet.
Vehicles on NYC roads: The New York State Internet Office of the New York State Department of Motor Vehicles, Statistics, Vehicle Registrations in Force,
2004 is the source of information on large and small vehicle registration. A different data source, the New York City Department of Transportation Vehicle
Classification on NYC Bridges, 2004 corroborates this information. In observations made in both directions on NYC bridges between 7:00 a.m. and 7:00 p.m.,
DOT officials determined the distribution of large and small vehicles, classified as autos, buses, commuter vans, trucks, or commercial vans.
US comparison data: National data on bicyclist fatalities come from the CDC’s National Centers for Injury Prevention and Control Web-based Injury Statistics
Query and Reporting System (WISQARS) [online]. Data considered are 1999 to the most recent year available (2003), because of 1999 changes in the exter-
nal cause injury coding in the International Classification of Disease.
DOT Screen-line Count: The annual bicycle screen-line count is conducted by the New York City Department of Transportation. The survey is performed
weekdays from 7 a.m.–7 p.m., over a period of 2 weeks at the summer's end or early fall. The survey is conducted at 50th Street from First Avenue to the
Hudson River Greenway, on all four East River Bridges, and the Staten Island Ferry bike loading area at Whitehall Terminal.
DOT AND DOHMH BICYCLIST FATALITIES MATCHAll DOT and NYPD-reported bicyclist fatalities between 1996 and 2005 were matched with those recorded by the DOHMH’s Office of Vital Statistics. Bicyclist
fatalities were identified by underlying Cause of Death with the following International Classification of Disease codes: for 1996-1998 ICD 9 codes of E810-
E819, E800-E807, E820-E825, E826.1, E826.9, E827-E829; for 1999-2005 ICD 10 codes of V10-V19, with a fourth digit subdivision identifying the injured
person as a pedal cyclist were included. The DOHMH Office of Vital Statistics identified 46 deaths that did not have a clear match with the DOT Fatality
Database. DOHMH staff conducted Office of Chief Medical Examiner (OCME) case record reviews of these 46 cases. Of these, 4 case files were missing.
Among the 42 cases reviewed, 10 were matched with DOT fatalities since more data were available to confirm the match; 13 were confirmed to involve a
crash with a motor vehicle and a bicyclist and these cases were added to the DOT fatalities list; the remaining 19 were excluded because the accident
occurred outside of New York City, because the deceased was incorrectly identified as a bicyclist or because the accident did not involve a bicycle.
MAPPING PROCEDURES:Locations of fatalities were geocoded for placement on maps using Geosupport Desktop Edition Software Version 9.6.9. There were insufficient data to
geocode one fatality in Queens. Locations of serious injuries were previously geocoded by the NYC DOT. There were 108 serious injuries without sufficient
location data for geocoding (20 in the Bronx, 34 in Brooklyn, 24 in Manhattan, 24 in Queens, and 6 in Staten Island).
ESRI ArcMap version 9.1 software was used to draw circular buffers around each fatality or injury location, beginning by using a radius of 250 feet, which is
the approximate average length of a NYC block. The buffer radius was increased by 50 foot increments up to one quarter mile maximum radius. Areas with a
minimum of three fatalities or injuries occurring within the buffer area were identified as possible clusters. The buffer radius was increased to 1000 feet to
identify possible fatality clusters; however, possible injury clusters were identified using a 250 foot radius.
ADJUSTMENTS:Percentages and rates have been rounded to the nearest whole number.
Bicyclist Fatalities and Serious Injuries in New York City
36 Bicyclist Fatalities and Serious Injuries in New York City
For copies of this report
Please call 311, visit nyc.gov/health or nyc.gov/dot, or email [email protected]
Adrian Benepe Thomas R. Frieden, MD, MPH Raymond W. Kelly Iris WeinshallCommissioner of Parks Commissioner of Health Police Commissioner Commissioner of Transportation
and Recreation and Mental Hygiene
Lorna Thorpe, PhD David WolochDivision of Epidemiology Division of External Affairs
Suggested citation
Nicaj L, Mandel-Ricci J, Assefa S, Grasso K, McCarthy P, Caffarelli A, McKelvey W, Stayton C, Thorpe L, Bicyclist Fatalities and Injuries
in New York City: 1996-2005: A Joint Report from the New York City Departments of Health and Mental Hygiene, Parks and Recreation,
Transportation, and the New York City Police Department, 2006.
Acknowledgements
Thank you to the following individuals who contributed to this report:
Kate Alcorn William Richardson
Jane Bedell Ryan Russo
Joshua Benson Joan Scholvin
Derrick Corrado Jenny Sharfstein
Chris Goranson Gerard Soffian
Adam Karpati Michelle Sorkin
Bonnie Kerker Gretchen Van Wye
Cortnie Lowe William Vaughn
Susan Resnick Susan Wilt
Special thanks to Transportation Alternatives and the New York City Bike Coalition for initiating discussions about the development of this report.
Cover photos provided by Masami Adachi.
ResourcesNYC Government
NYC Department of Transportation, Bicycles & Pedestrians www.nyc.gov/dot
NYC Department of Health and Mental Hygiene www.nyc.gov/health
New York City Police Department www.nyc.gov/nypd
NYC Department of Parks and Recreation, Planning Division www.nyc.gov/parks
NYC Department of City Planning, Transportation Division, www.nyc.gov/planningBicycle Network Development Program
For a listing of additional bicycling resources, please visit: http://www.nyc.gov/html/dcp/html/bike/orgs.shtml

37Bicyclist Fatalities and Serious Injuries in New York City