Embed Size (px)
Citation preview
BICYCLE BEHAVIOR
CHANGES IN KOREA:
Effects of Policy and Facility Designs
Hee Cheol SHIN, Ph.D.
CONTENTS
1. Introduction
2. Bicycle Behavior Changes in Korea
3. Cycling Promotion Policies
4. Public Bike System
5. Bicycle Facility Design
6. Conclusion
2
3
INTRODUCTION
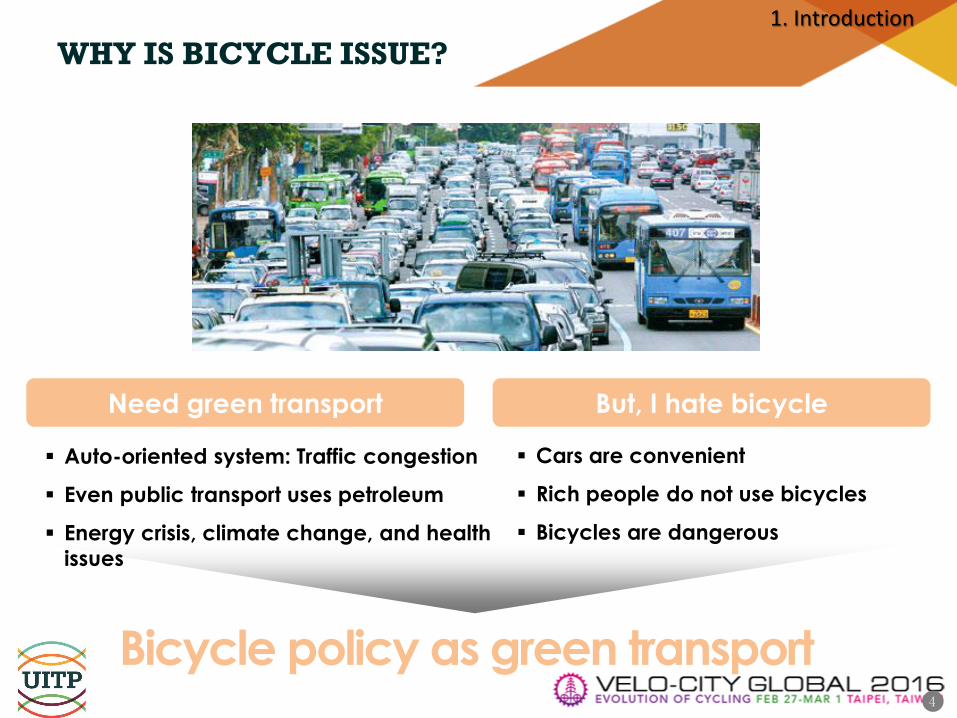
Auto-oriented system: Traffic congestion
Even public transport uses petroleum
Energy crisis, climate change, and health
issues
Cars are convenient
Rich people do not use bicycles
Bicycles are dangerous
Bicycle policy as green transport 4
Need green transport But, I hate bicycle
WHY IS BICYCLE ISSUE?
1. Introduction
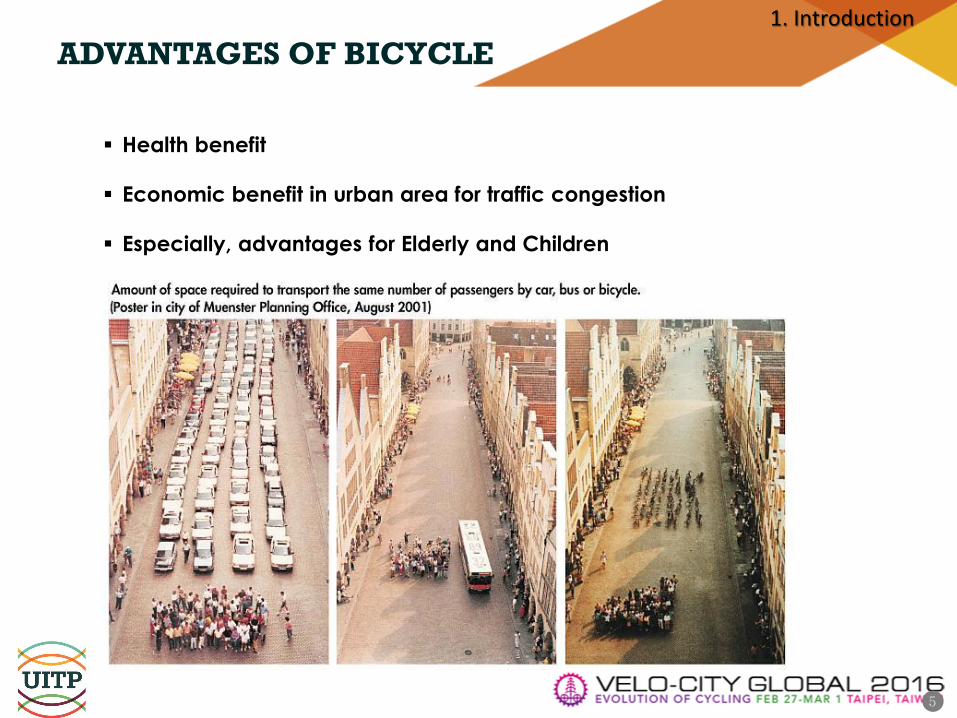
Health benefit
Economic benefit in urban area for traffic congestion
Especially, advantages for Elderly and Children
5
ADVANTAGES OF BICYCLE
1. Introduction
BACKGROUND OF THIS PRESENTATION
We can see more Korean people ride bicycles
nowadays
Is it true that Korean people have changed their
behaviors in bicycles for last ten years?
From surveys, we check if behavior changes are
real true
I am trying to find what are reasons for the bicycle
behavior changes in Korea
Especially, policy effects and facility design effects
will be discussed
6
7
BICYCLE BEHAVIOR
CHANGES IN KOREA
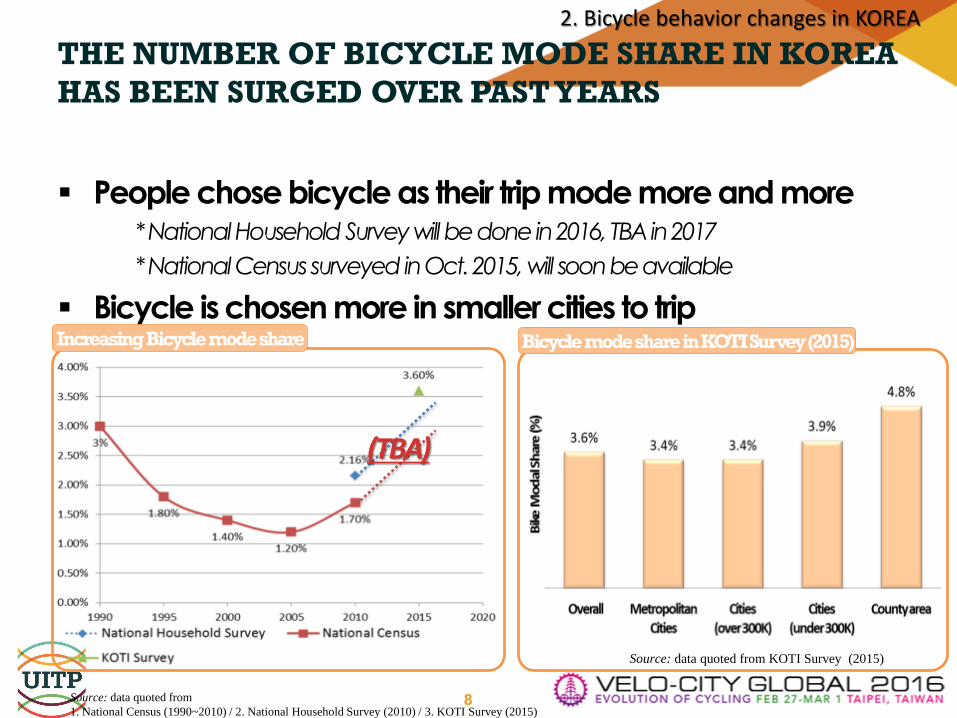
THE NUMBER OF BICYCLE MODE SHARE IN KOREA
HAS BEEN SURGED OVER PAST YEARS
People chose bicycle as their trip mode more and more * National Household Survey will be done in 2016, TBA in 2017
* National Census surveyed in Oct. 2015, will soon be available
Bicycle is chosen more in smaller cities to trip
8
Source: data quoted from KOTI Survey (2015)
Increasing Bicycle mode share Bicycle mode share in KOTI Survey (2015)
(TBA)
2. Bicycle behavior changes in KOREA
Source: data quoted from
1. National Census (1990~2010) / 2. National Household Survey (2010) / 3. KOTI Survey (2015)
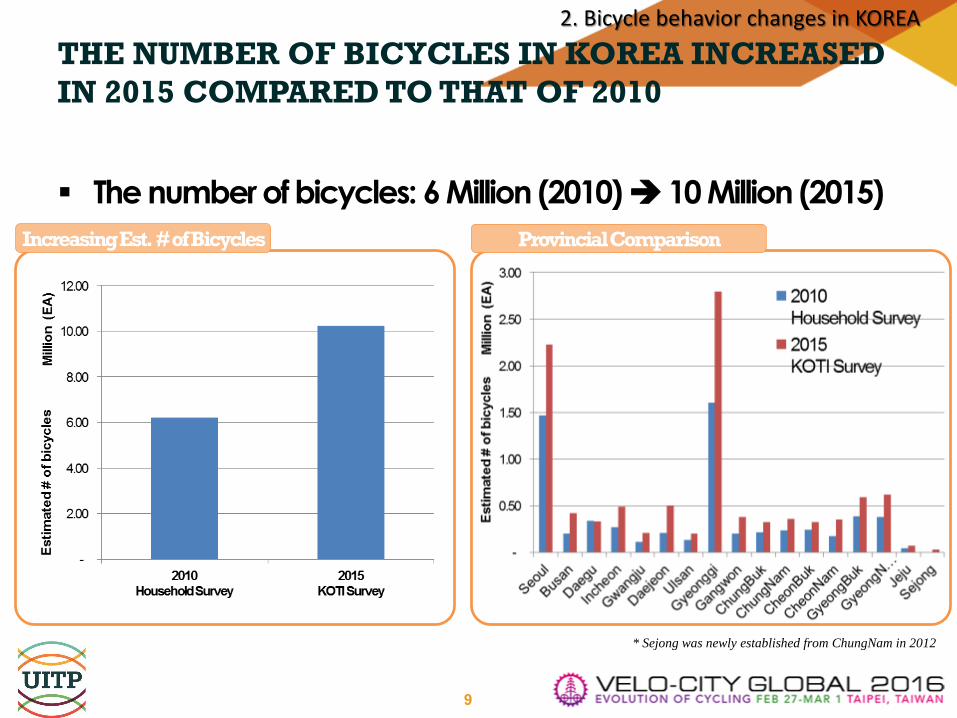
THE NUMBER OF BICYCLES IN KOREA INCREASED
IN 2015 COMPARED TO THAT OF 2010
The number of bicycles: 6 Million (2010) 10 Million (2015)
9
* Sejong was newly established from ChungNam in 2012
Increasing Est. # of Bicycles Provincial Comparison
2. Bicycle behavior changes in KOREA
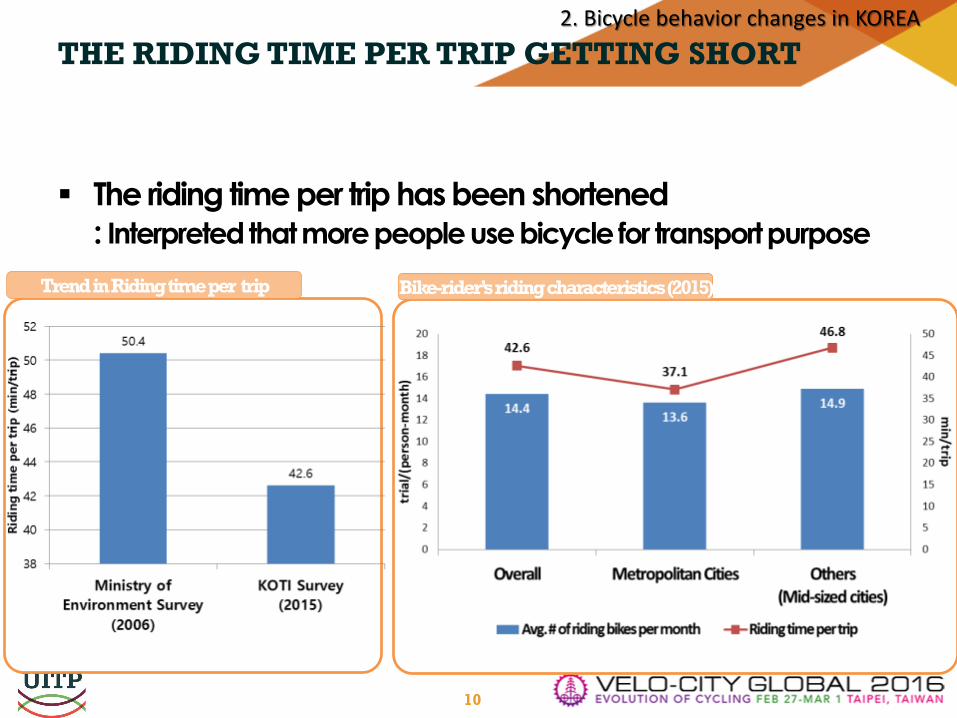
THE RIDING TIME PER TRIP GETTING SHORT
The riding time per trip has been shortened
: Interpreted that more people use bicycle for transport purpose
10
Trend in Riding time per trip Bike-rider’s riding characteristics (2015)
2. Bicycle behavior changes in KOREA

THE BIKE-TRIPS ATTACHED TO THE EVERYDAY LIFE
11
Soaring commuting trip with bicycle Bike Riding Purposes
2. Bicycle behavior changes in KOREA
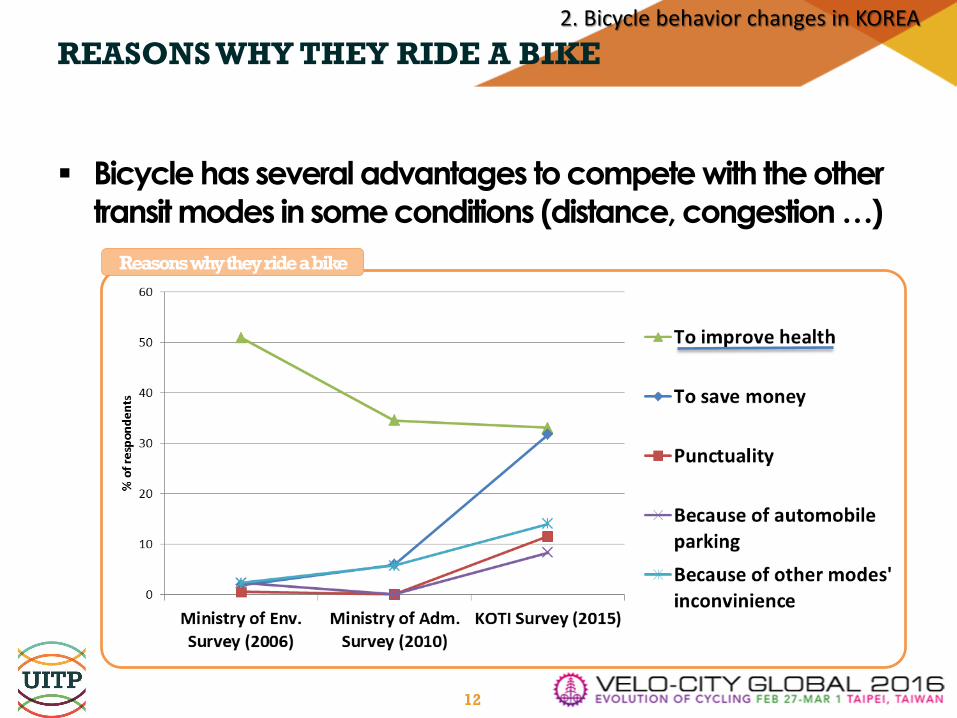
REASONS WHY THEY RIDE A BIKE
Bicycle has several advantages to compete with the other
transit modes in some conditions (distance, congestion …)
12
Reasons why they ride a bike
2. Bicycle behavior changes in KOREA
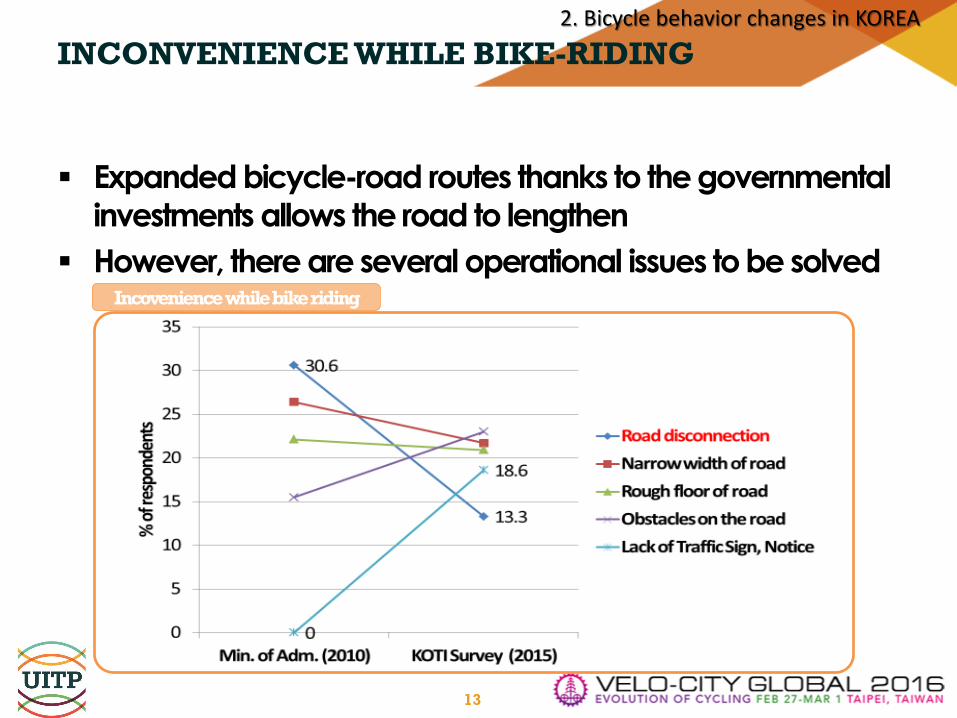
INCONVENIENCE WHILE BIKE-RIDING
Expanded bicycle-road routes thanks to the governmental
investments allows the road to lengthen
However, there are several operational issues to be solved
13
Incovenience while bike riding
2. Bicycle behavior changes in KOREA
14
CYCLING PROMOTION
POLICIES
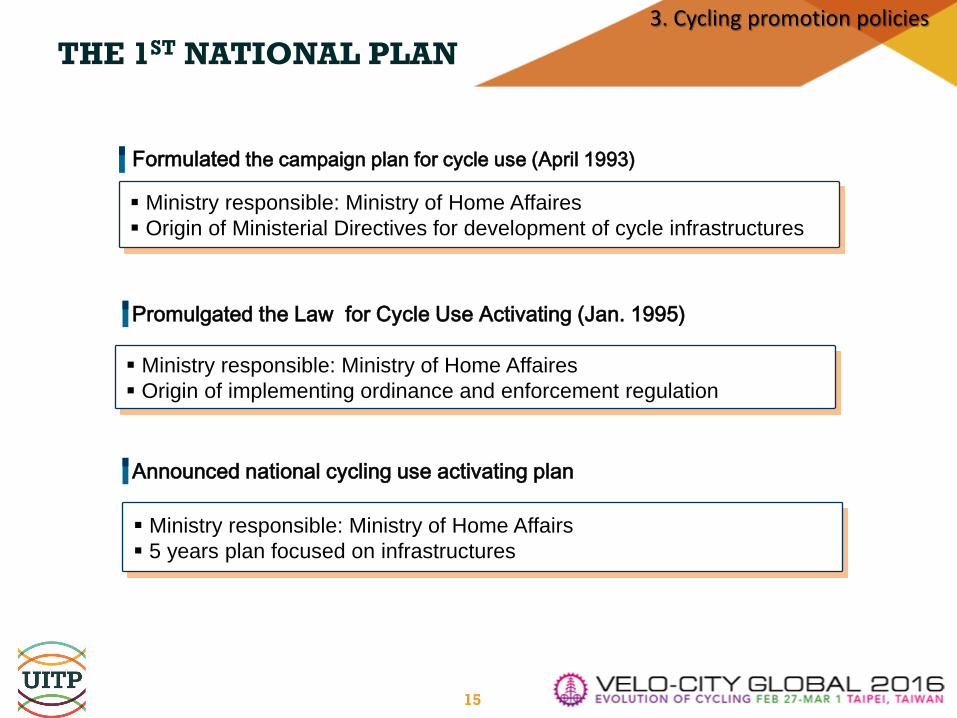
THE 1ST NATIONAL PLAN
15
Promulgated the Law for Cycle Use Activating (Jan. 1995)
Announced national cycling use activating plan
Ministry responsible: Ministry of Home Affaires
Origin of implementing ordinance and enforcement regulation
Ministry responsible: Ministry of Home Affairs
5 years plan focused on infrastructures
Ministry responsible: Ministry of Home Affaires
Origin of Ministerial Directives for development of cycle infrastructures
Formulated the campaign plan for cycle use (April 1993)
3. Cycling promotion policies
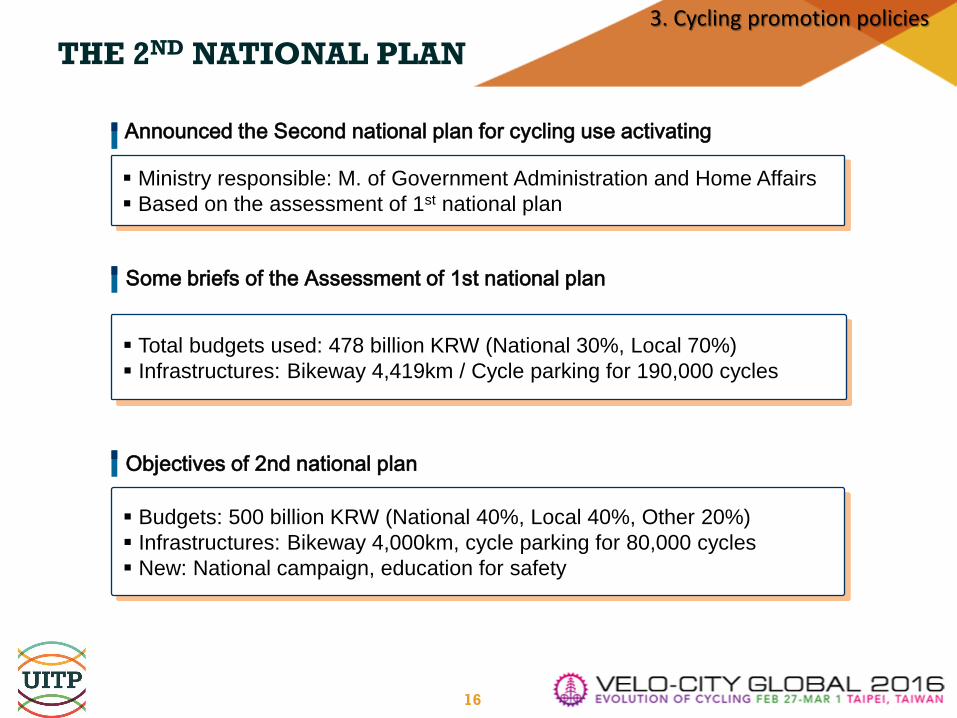
THE 2ND NATIONAL PLAN
16
3. Cycling promotion policies
Some briefs of the Assessment of 1st national plan
Total budgets used: 478 billion KRW (National 30%, Local 70%)
Infrastructures: Bikeway 4,419km / Cycle parking for 190,000 cycles
Objectives of 2nd national plan
Budgets: 500 billion KRW (National 40%, Local 40%, Other 20%)
Infrastructures: Bikeway 4,000km, cycle parking for 80,000 cycles
New: National campaign, education for safety
Ministry responsible: M. of Government Administration and Home Affairs
Based on the assessment of 1st national plan
Announced the Second national plan for cycling use activating
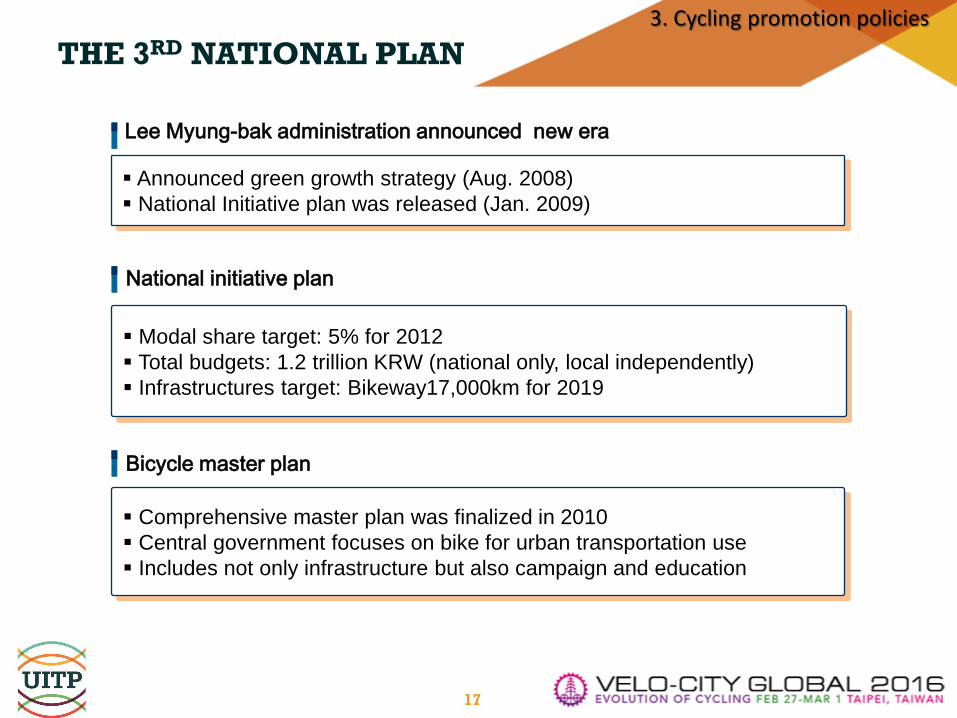
THE 3RD NATIONAL PLAN
17
3. Cycling promotion policies
National initiative plan
Modal share target: 5% for 2012
Total budgets: 1.2 trillion KRW (national only, local independently)
Infrastructures target: Bikeway17,000km for 2019
Bicycle master plan
Comprehensive master plan was finalized in 2010
Central government focuses on bike for urban transportation use
Includes not only infrastructure but also campaign and education
Announced green growth strategy (Aug. 2008)
National Initiative plan was released (Jan. 2009)
Lee Myung-bak administration announced new era
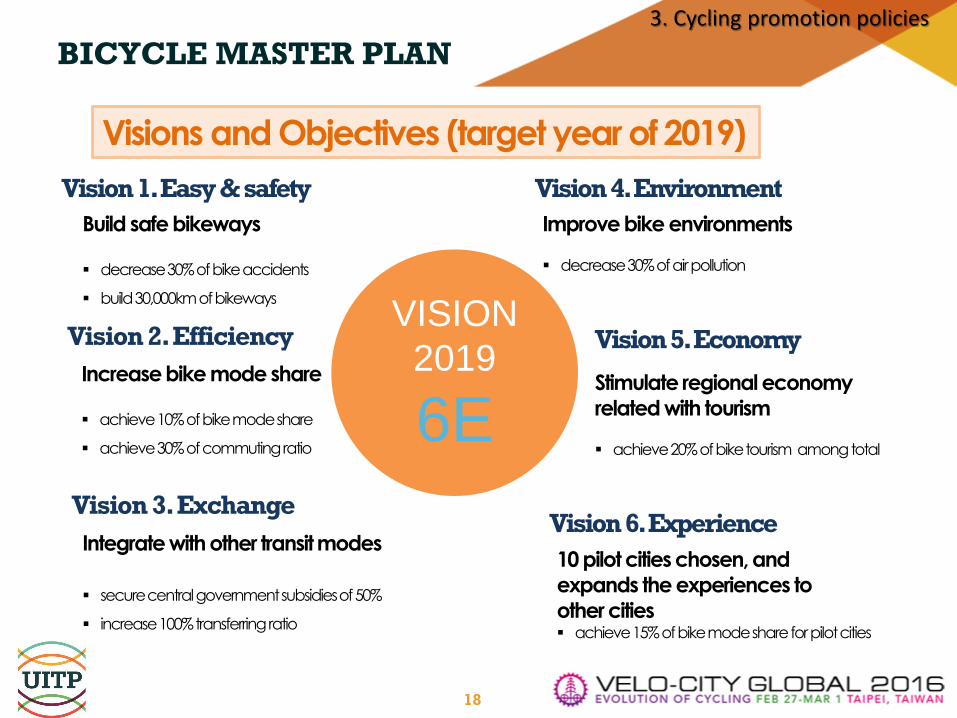
Build safe bikeways
decrease 30% of bike accidents
build 30,000km of bikeways
Increase bike mode share
achieve 10% of bike mode share
achieve 30% of commuting ratio
BICYCLE MASTER PLAN
18
3. Cycling promotion policies
VISION
2019
6E
Vision 1. Easy & safety
Vision 2. Efficiency
Vision 3. Exchange
Vision 4. Environment
Vision 5. Economy
Vision 6. Experience Integrate with other transit modes
secure central government subsidies of 50%
increase 100% transferring ratio
Improve bike environments
decrease 30% of air pollution
Stimulate regional economy
related with tourism
achieve 20% of bike tourism among total
Visions and Objectives (target year of 2019)
10 pilot cities chosen, and
expands the experiences to
other cities achieve 15% of bike mode share for pilot cities
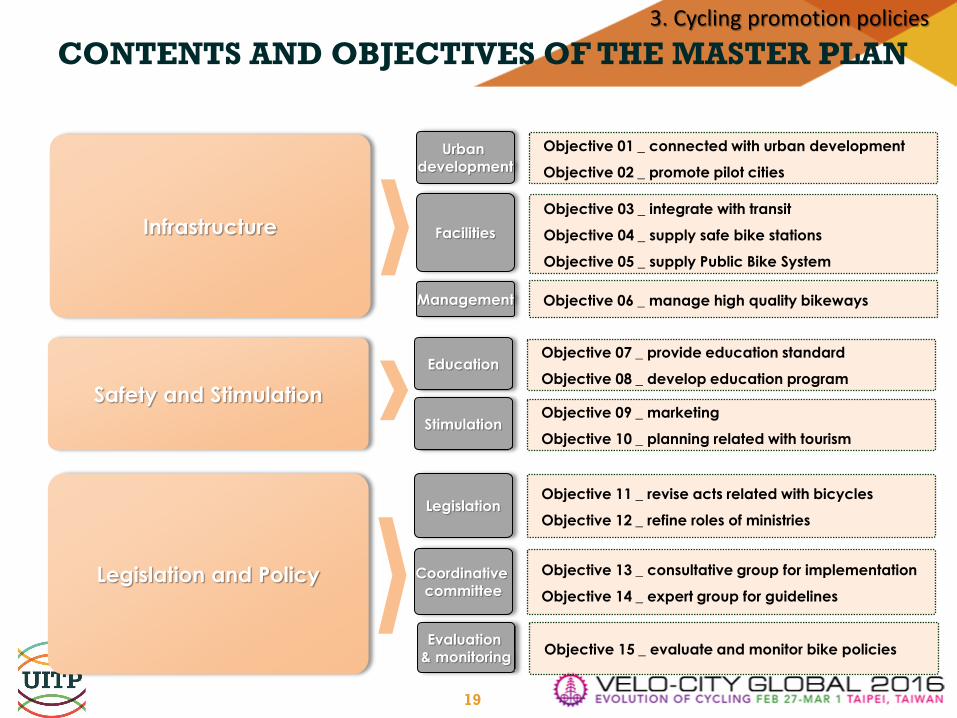
CONTENTS AND OBJECTIVES OF THE MASTER PLAN
19
Infrastructure Objective 03 _ integrate with transit
Objective 04 _ supply safe bike stations
Objective 05 _ supply Public Bike System
Objective 01 _ connected with urban development
Objective 02 _ promote pilot cities
Objective 06 _ manage high quality bikeways
Urban development
Facilities
Management
Safety and Stimulation
Objective 07 _ provide education standard
Objective 08 _ develop education program
Education
Objective 09 _ marketing
Objective 10 _ planning related with tourism
Stimulation
Legislation and Policy
Objective 11 _ revise acts related with bicycles
Objective 12 _ refine roles of ministries
Legislation
Objective 13 _ consultative group for implementation
Objective 14 _ expert group for guidelines
Coordinative committee
Objective 15 _ evaluate and monitor bike policies
Evaluation & monitoring
3. Cycling promotion policies
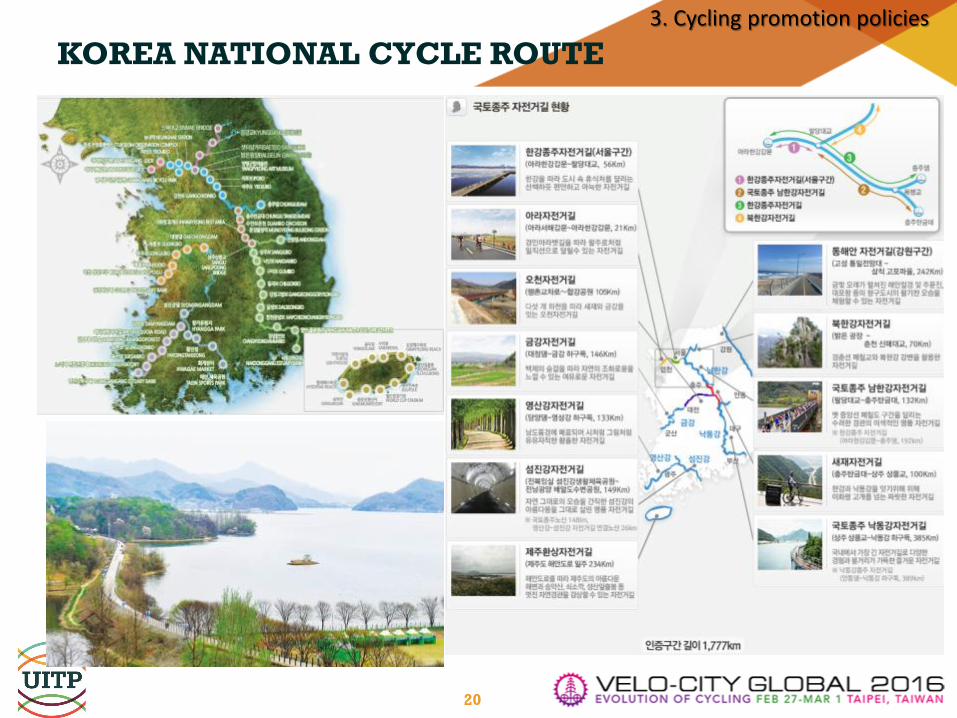
KOREA NATIONAL CYCLE ROUTE
20
3. Cycling promotion policies
21
PUBLIC BIKE SYSTEM
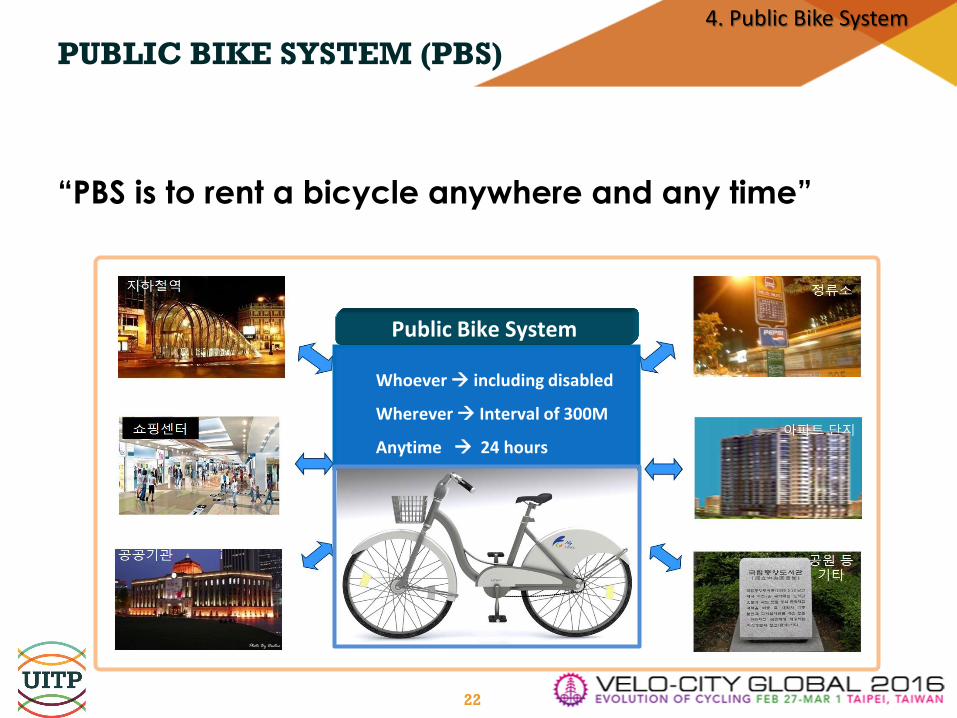
PUBLIC BIKE SYSTEM (PBS)
“PBS is to rent a bicycle anywhere and any time”
22
4. Public Bike System
Public Bike System
Whoever including disabled
Wherever Interval of 300M
Anytime 24 hours

KOREAN PBS OPERATION
23
4. Public Bike System
City Area (km2)
Population (1000)
Name No. of Bicycles No. of Stations Open Year
Changwon 736.3 1,080 Nubija 6000 247 2008
Goyang 267.4 960 Fifteen 3,000 125 2010
Daejeon 539.9 1,500 Tashu 1,909 144 2009
City Operation Description
Changwon Changwon Public Racing
Authority - Subsidy by Changwon city (5 billion KRW)
Daejeon Daejeon Public Facilities
Authority - Plan to expand
Goyang SPC - Operation company: ECO-Bike
Ansan, Seoul and other cities implemented recently Suwon and other cities will operate soon
COSTS OF PBS
24
4. Public Bike System
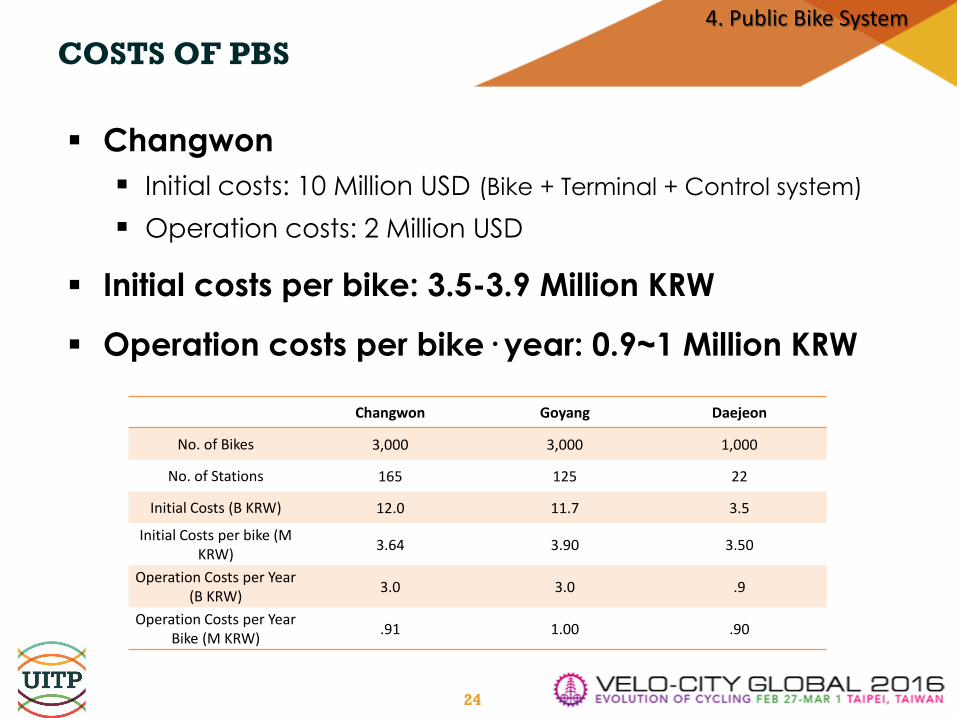
Changwon
Initial costs: 10 Million USD (Bike + Terminal + Control system)
Operation costs: 2 Million USD
Initial costs per bike: 3.5-3.9 Million KRW
Operation costs per bike· year: 0.9~1 Million KRW
Changwon Goyang Daejeon
No. of Bikes 3,000 3,000 1,000
No. of Stations 165 125 22
Initial Costs (B KRW) 12.0 11.7 3.5
Initial Costs per bike (M KRW)
3.64 3.90 3.50
Operation Costs per Year (B KRW)
3.0 3.0 .9
Operation Costs per Year Bike (M KRW)
.91 1.00 .90
PBS OPERATION COSTS AND PROFIT SYSTEM
25
4. Public Bike System
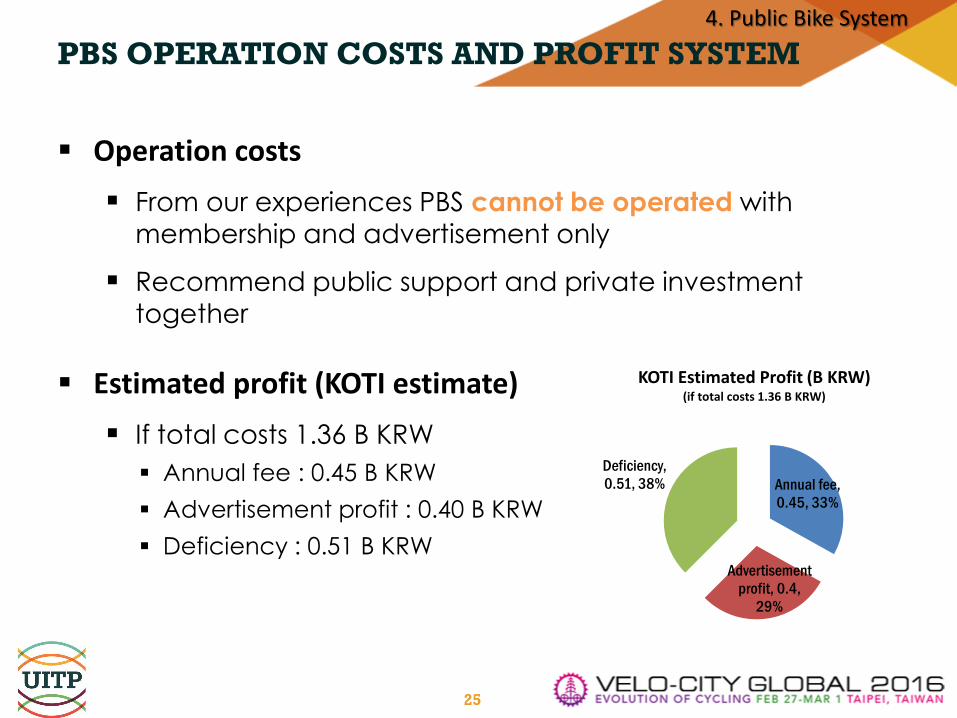
Operation costs
From our experiences PBS cannot be operated with
membership and advertisement only
Recommend public support and private investment
together
Estimated profit (KOTI estimate)
If total costs 1.36 B KRW
Annual fee : 0.45 B KRW
Advertisement profit : 0.40 B KRW
Deficiency : 0.51 B KRW
Annual fee,
0.45, 33%
Advertisement
profit, 0.4,
29%
Deficiency,
0.51, 38%
KOTI Estimated Profit (B KRW) (if total costs 1.36 B KRW)
PBS ECONOMIC BENEFITS
26
4. Public Bike System
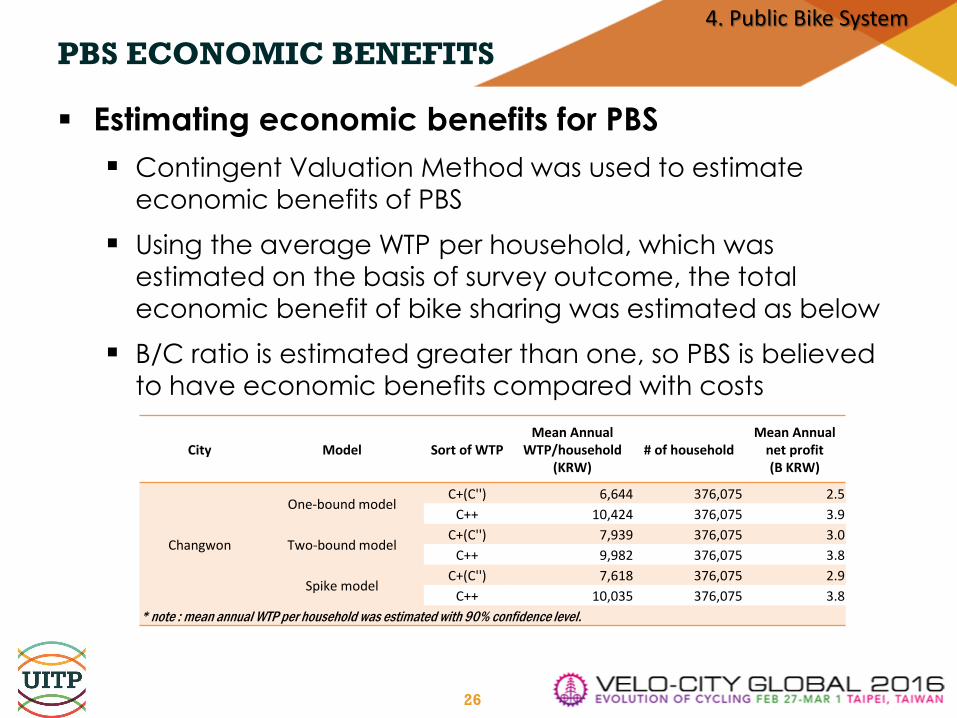
Estimating economic benefits for PBS
Contingent Valuation Method was used to estimate economic benefits of PBS
Using the average WTP per household, which was
estimated on the basis of survey outcome, the total
economic benefit of bike sharing was estimated as below
B/C ratio is estimated greater than one, so PBS is believed
to have economic benefits compared with costs
City Model Sort of WTP Mean Annual
WTP/household (KRW)
# of household Mean Annual
net profit (B KRW)
Changwon
One-bound model C+(C'') 6,644 376,075 2.5
C++ 10,424 376,075 3.9
Two-bound model C+(C'') 7,939 376,075 3.0
C++ 9,982 376,075 3.8
Spike model C+(C'') 7,618 376,075 2.9
C++ 10,035 376,075 3.8
* note : mean annual WTP per household was estimated with 90% confidence level.
PBS –AS PUBLIC TRANSPORTATION SUPPLEMENT
Improves accessibility to public transportation
A supplement for public transportation if that of region is not
enough
Social benefits
Promotion of health
Traffic congestion reduction
CO2 emission reduction
More social benefits than costs
Therefore, PBS is transportation mode which has enough
publicness
Central Government needs to subsidize like Publics transport!
27
4. Public Bike System
INTEGRATION OF PBS AND PUBLIC
TRANSPORTATION (DAEJEON)
28
Bikesharing Mileage System linked with Public Transportation
Ta-shu users can save 200 miles/day (100 miles/each and up to
two transfers per day) and accumulate the mileage up to
20,000 miles per year in each of their accounts
When Ta-shu users transfer to the public transportation such as
bus and metro from the bike with the RFID card (e.g. T-money)
in 30 minutes, they can save their mileage into their accounts.
(To save their mileage, they should buy the 1-year pass)
※ The mileage cannot be used to get a discount of bus or metro fare.
4. Public Bike System
29
BICYCLE FACILITY DESIGN
DESIGN CONSIDERATIONS
30
5. Bicycle Facility Design
Minimize the conflict between „cars and bicycles‟
and „bicycle and pedestrians‟
Seamless bicycle path or lane
Make a bicycle and pedestrians waiting area
Improve the visibility of bicycle path or lane
Integrate bicycle facility and public transportation
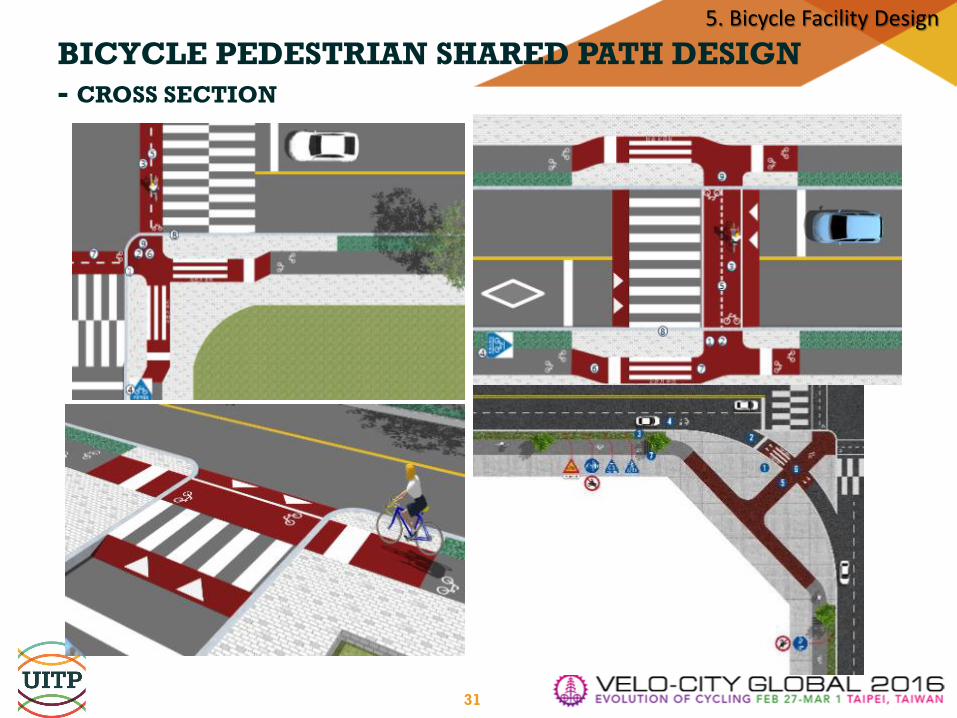
BICYCLE PEDESTRIAN SHARED PATH DESIGN
- CROSS SECTION
31
5. Bicycle Facility Design
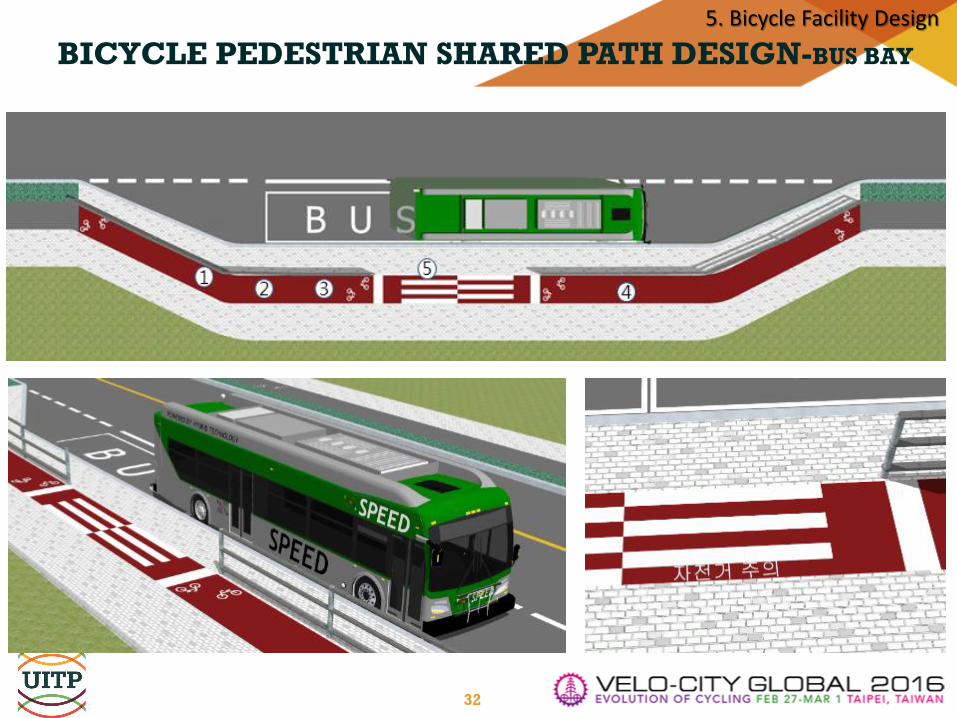
BICYCLE PEDESTRIAN SHARED PATH DESIGN-BUS BAY
32
5. Bicycle Facility Design
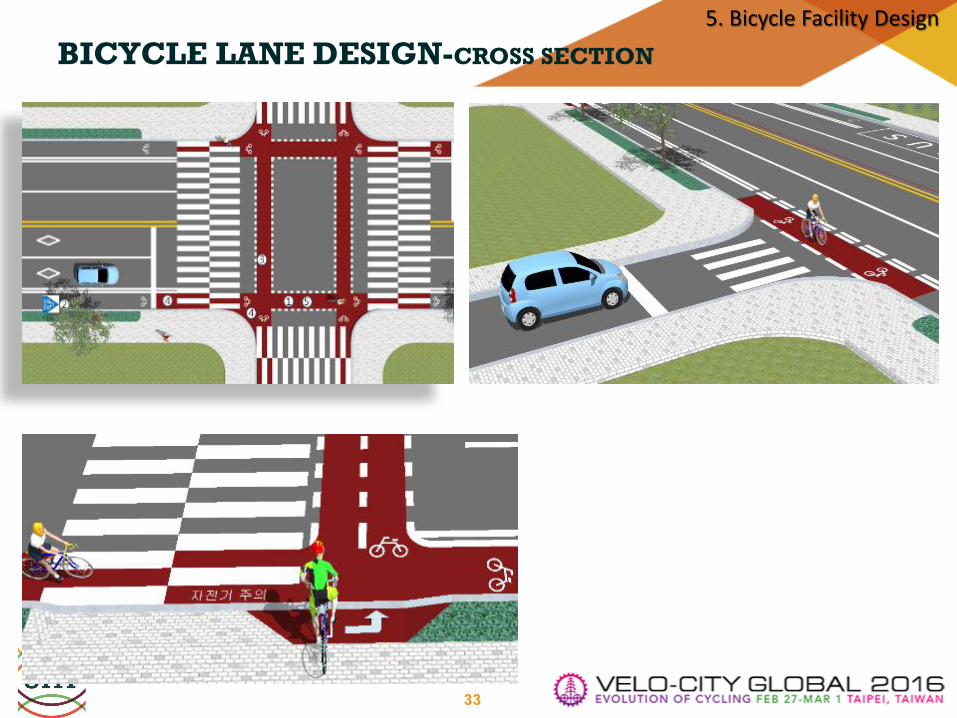
BICYCLE LANE DESIGN-CROSS SECTION
33
5. Bicycle Facility Design
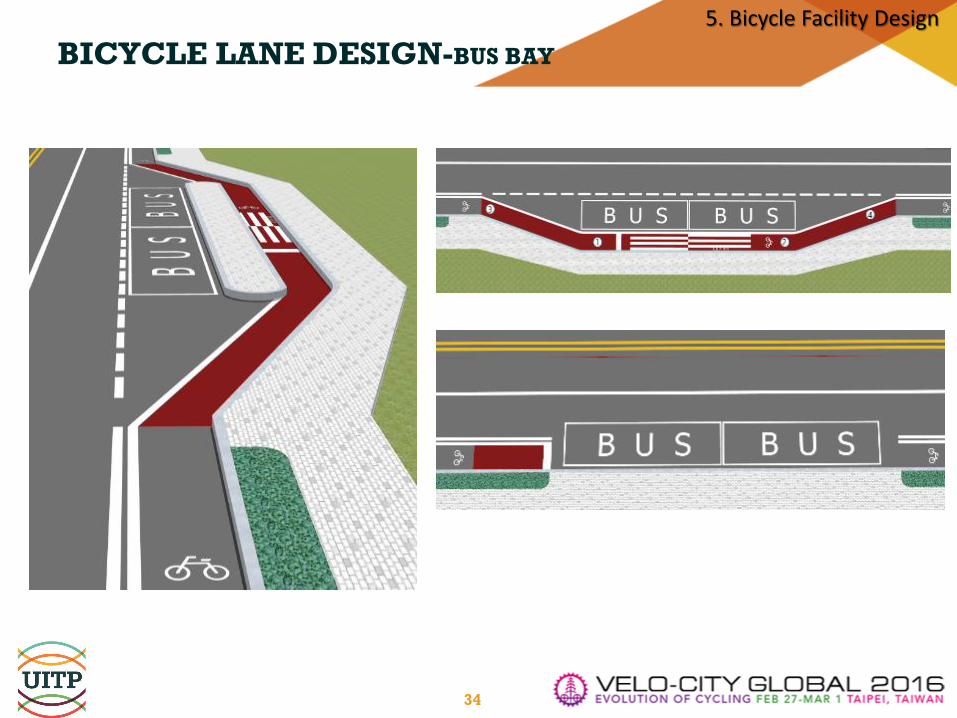
BICYCLE LANE DESIGN-BUS BAY
34
5. Bicycle Facility Design
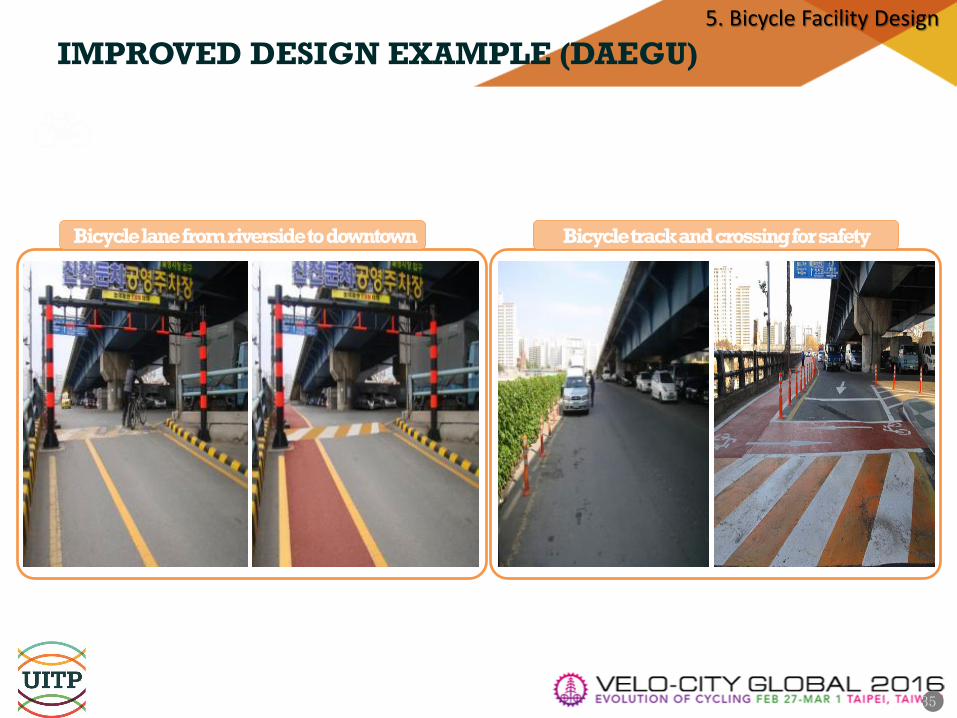
Bicycle track and crossing for safety
35
5. Bicycle Facility Design
IMPROVED DESIGN EXAMPLE (DAEGU)
Bicycle lane from riverside to downtown
36
5. Bicycle Facility Design
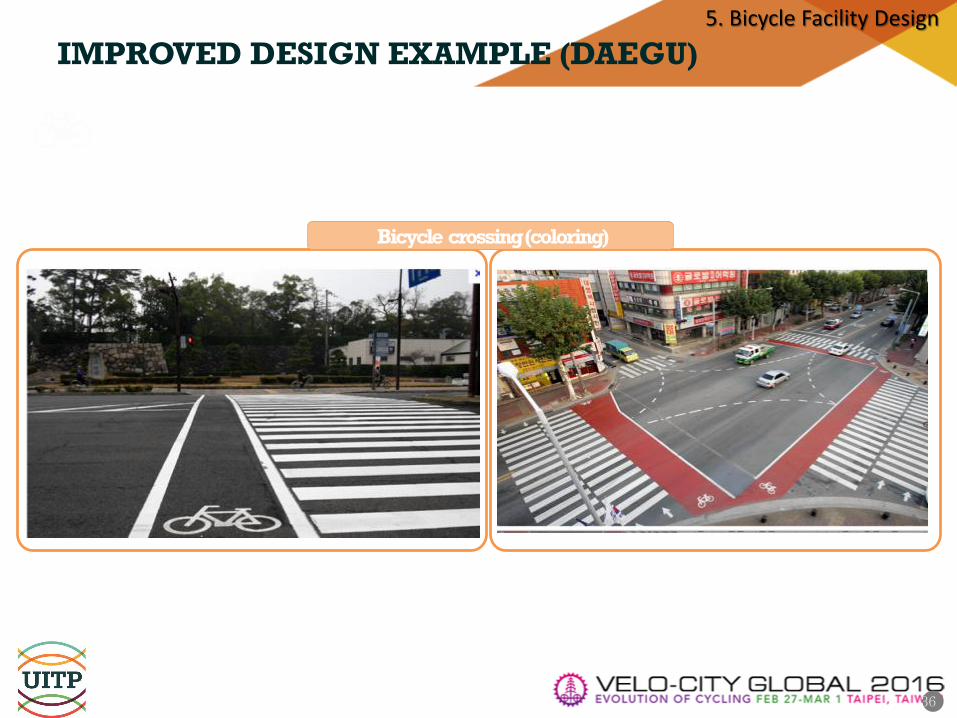
IMPROVED DESIGN EXAMPLE (DAEGU)
Bicycle crossing (coloring)

INTEGRATION OF CYCLE AND PUBLIC TRANSPORT
37
5. Bicycle Facility Design
On Transit Station Parking
space
Access Road
Bicycle pull way
Bicycle gate
Info Sign
Train
Subway
Bus
Easy access to station
Info sign
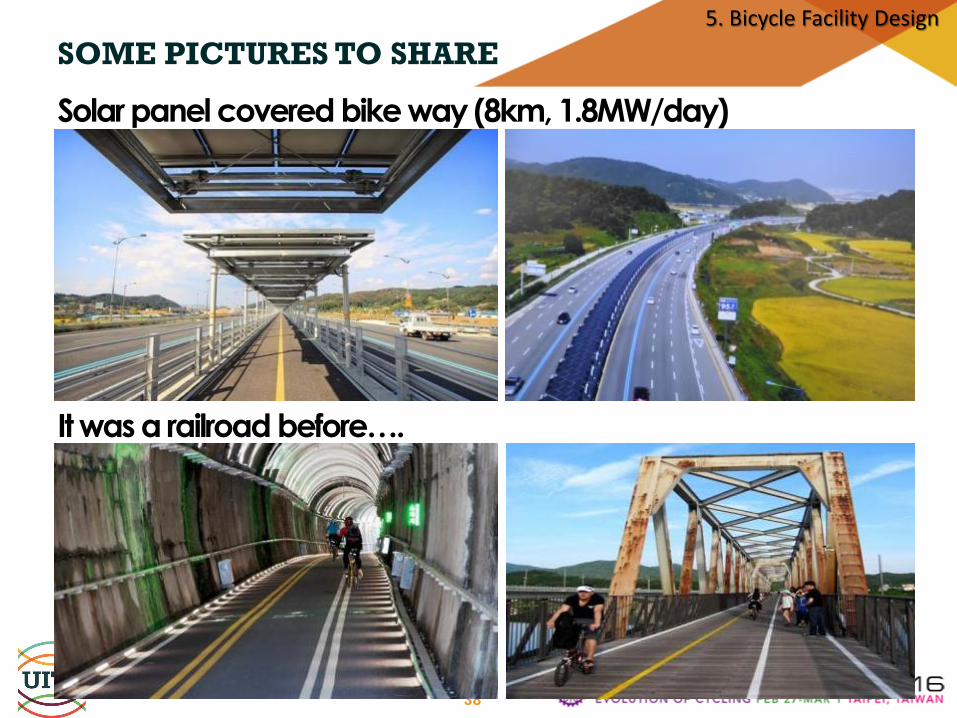
SOME PICTURES TO SHARE
38
Solar panel covered bike way (8km, 1.8MW/day)
It was a railroad before….
5. Bicycle Facility Design
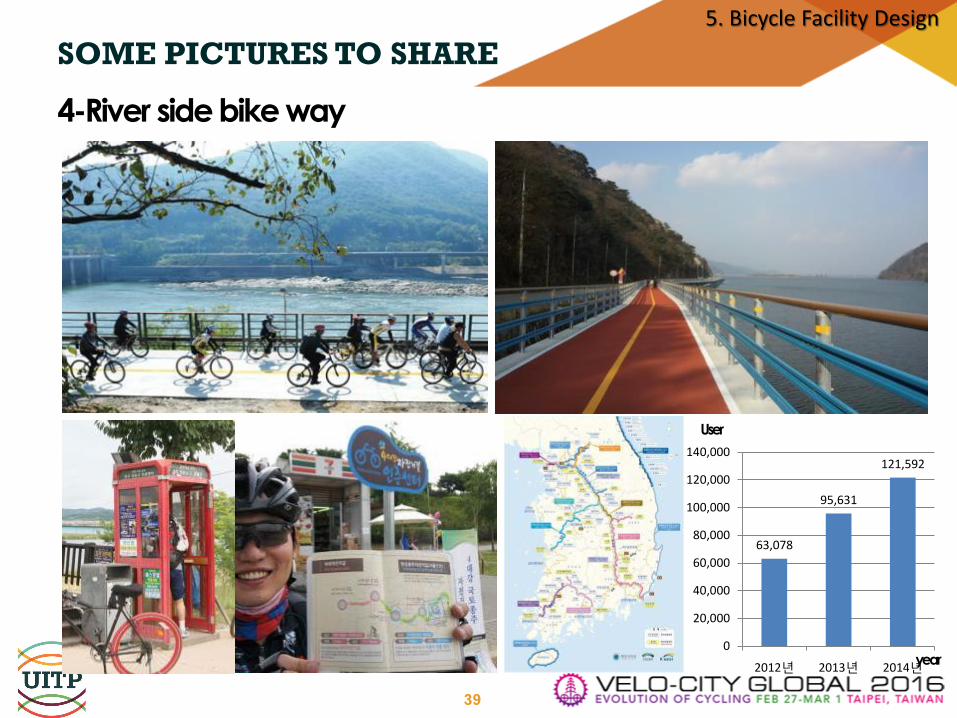
SOME PICTURES TO SHARE
39
4-River side bike way
63,078
95,631
121,592
0
20,000
40,000
60,000
80,000
100,000
120,000
140,000
2012년 2013년 2014년 year
User
5. Bicycle Facility Design
40
CONCLUSION
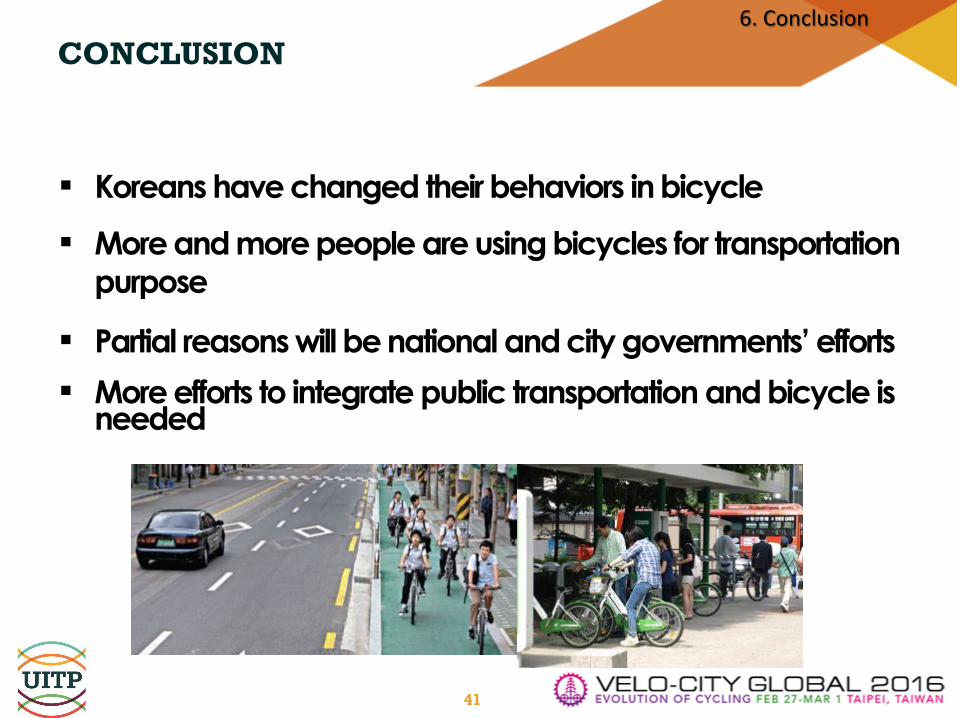
CONCLUSION
41
Koreans have changed their behaviors in bicycle
More and more people are using bicycles for transportation
purpose
Partial reasons will be national and city governments‟ efforts
More efforts to integrate public transportation and bicycle is needed
6. Conclusion