Embed Size (px)
Citation preview

CORRELATION B2T:·7E'SN AN}jl~AL VARIATIONS OF POLYGor~.n'l
BICORNE POPULATIONS Alill SOIL CO~~ITIONS............... IN TH.E EHPORIA, KANSAS, AREA
A Thesis/"
Submitted to
the Department of Biology
Kansas State Teachers College, Emporia, Kansas
In Partial Fulfillment
of the Requirements for the Degree
Master of Science
by
Jon ~arshnll Stucky ~
January, 1970

~uam:l..2edaa
V /

iii
TABLE OF CONTENTS
PAGE
LIST OF TABLES iv
LIST OF FIGURES vi
INTRODUCTION 1
MATERLo\LS AND METHODS 4
RESULTS 12
DISCUSSION 19
SUHMARY 23
LITERATUP.E CITc~ 72
APPENDIX 76

LIST OF TABLES
TABLE PAGZ
I. Vegetational analyses of Area 1, Octob~r, 1967 · · · · • 24
II. Vegetational analysis of Area 2, October, 1967 25· •· ·· III. Vegetational analysis of Areo 2, June, 1968 • 27· · · · · •
IV. Vegetational analysis of Area 2, August, 1968 • · 29· · · · V. Vegetational analy~is of Area 2, Octo~er, 1968 · ·· · • 31
VI. Vegetational analysis of Area 3, October, 1967 · · • 33 · · VII. Vegetational analysis of Area 3, June, 1968 • 35· ·· · · ·
VIII. Vegetational analysis of Area 3, August, 1968 • 36· · · · •
IX. Vegetational analysis ~f Area 3, October, 1968 · · • 37· · X. Vegetational analysis of Area 4, October, 1967.
Species list determined from identification of plant remains • · · · · · · · · · · . · · · · · · · · · 38
XI. Vegetational analysis of Area 4, June, 1968 . · · · · · • 39
XII. Vegetational analysis of Area 4S, June, 1968 · · · · · • 40
XIII. Vegetational analysis of Area 4, August, 1968 • · · · • 41 · XIV. Vegetational analysis of Area 4S, August, 1968 · · · · • 43
xv. Vegetational analysis of Area 4, October, 1968 · · · · • 44
XVI. Vegetational analysis of Area 4S, October, 1968 • · · · • 45
XVII. Vegetational analysis of Area 5, October, 1967. Species list determined from identification of plant remains • . · · • 46 · · · · · · · · · · · · · · · · ·
XVIII. Vegetational analysis of Area 5, June, 1968 • · · · · · • 47
XIX. Vegetational analysis of Area 5, August, 1968 • · • 49 · · · XX. Vegetational anGlysis of Area 5, October, 1968 · · 51· ··
·XXI. Vegetational an81ysis of Area 6, Octobpr, lQ67. Species list det~rmined from identificption of plant rema ins • ·· · · · · · · · · · · · 53· · · · · · ·

v
TABLE PAGE
XXII. Vegetational analysis of Area 6, June, 1968 • · · · · · • 54
XXIII. Ve~etational analysis of Area 6, August, 1968 • · · · · • 56
XXIV. Vegetational analysis of Area 6, October, 1968 · · · · • 58
XXV. Inorganic chemical properties of the soil from Area 1 · · · · · · · · · · · · · · · · · · · · · · · · • 60
XXVI. Inorganic chemical properties of the soil from Area 2 · · · · · · · · · · · · · · · · · · · · · · · · • 61
XXVII. Inorganic chemical properties of the soil Area 3 · · · · · · · · · · · · · · · · ·
from
· · · · · · · • 62
XXVIII. Inorganic chemical properties of the soil from Area 4 · · · · · · · · · · · · · · · · · · · · · · · · • 63
XXIX. Inorganic chemical properties of the soil fro~
Area 48 • · · · · · · · · · · · · · · · · · · · · · · · • 64
xxx. Inorganic chemical properties of the soil from Area 5 · · · · · · · · · · · · · · · · · · · · · · · · • 65
XXXI. Inorganic chemical properties of the soil froe Area 6 · · · · · · · · · · · · · · · · · · · · · · · · · 66
XXXII. Isolated phenolic compounds from soil extracts, leaf extracts of Polygonum bicorne, and solutions of three known phenolic compounds. All runs ~e~e
made on Whatman No. 1 chromatography paper. Rf values were averages of four runs. Color reactions were recorded for zones tested with phenolic indicators and ultraviolet light, with and without exposure to ammonia fumes • • • • • • • • • • • • • • • • 67
XXXIII. Mean root-shoot length + standard error of tomato seedlings after germination and grm7th for 168 hr in a control solution and solutions prepared from the phenolic compounds eluted from chromatograms of soils collected during August, 1968, from the 0-6" soil profile level of study Areas 4 and 48 ..... 70

vi
LIST OF FIGURES
FIGURE PAGE
1. Retardation of the germination rate of tomato seeds by solutions prepared from phenolic compounds eluted from chromatograms of soil extracts prepared from soils collected during August, 1968, from the 0-6" soil profile level of Areas 4 and 48 •• • • • • • • • • • • • • • • • • • • • 69

I NrRODUCTION
As the scientific knowledge of soils increased, it became more
evident that inorganic nutrient factors were of considerable importance
in determining the vegetation in an area. It was also discovered that
even small differences in these soil factors could be responsible for
changes in the vegetational composition of plant communities (Wilde,
Burnan, and Galloway, 1~37).. On two occasions _Billings (1941, 1950)
succeeded in correlating changes of the amount of inorganic nutrient
content of the soil with changes in vegetation. In reference to the
inorganic nutrient factors of the soil Oosting (1956) stated, '~hese
components vary in amount and proportion from place to place and the
variation may be a significant factor in determining the occurrence of
8pecies and vegetational types."
Recent studies showed that plant growth inhibitors, another factor
of the soil environment, could affect the reproduction, growth, and
distribution of plants (Bonner and Galston, 1944; Cox, Munger, and Smith,
1945; Konis, 1947; Bennet and Bonner, 1953; Peterson, 1965; Rice, 1964).
Therefore, it seemed highly probable that changes in the plant growth
inhibitor content of the soil, as well as changes in the inorganic
DUtrient factors of the soil, were capable of affecting the vegetational
composition of plant communities. G. L. Funke (1943) concluded that
UDder field conditions Artemisia absinthium excreted a chemical inhibitor
which, when accumulated in the soil, inhibited the germination and growth
of near-by surrounding plants. Investigations of four species of
Belianthus suggested that unusual distribution patterns of these species,
luch as the "fairy ring" pattern observed in many clones, were responses

2
to the presence in the soil of toxic chemical substances derived from
roots ot the Helianthus plants (Curtis and Cottam, 1950). Went (1942)
showed that annual desert herbs did not grow near plants of Encelia
farinosa, a desert shrub of the Southwest, even though they grew near
other shrubs in the area. Later Gray and Bonner (1948) suggested that
toxic substances leached from the leaves of E. farinosa inhibited seed
germination and subsequent seedling growth near the base of the plants.
Also, pure stands of Bromus inermis were observed to thin out after a
few years of growth. According to Benedict (1941) this phenomenon was,
at least in part, a result of the accumulation in the soil of a
homologous growth inhibiting substance produced by B. inermis. Recent
observations of Polygonum bicorne populations in the Emporia, Kansas,
area showed that they do tend to diminish on recently disturbed soils
in a manner similar to that of B. inermis. This also could be due to
80il borne growth inhibitors.
Polygonum bicorne is a common, annual, weedy herb in much of
~ansas. It blooms as early as mid-May and continues flowering until
frost. Populations ot it occur commonly in low, wet areas throughout
the state and in recently disturbed areas in the eastern half of the
-state. In the latter area P~ bicorne is one of the pioneer, annual
weeds that typically becomes established in the areas where the soil
and previous vegetation have been strongly disturbed. Personal
observations show that during the initial growing season following the
disturbance the population of P. bicorne is usually dense. However,
in subsequent growing seasor~ the population may be greatly reduced or
eveD absent. In wet areas, such as deep ditches and shorelines of
3
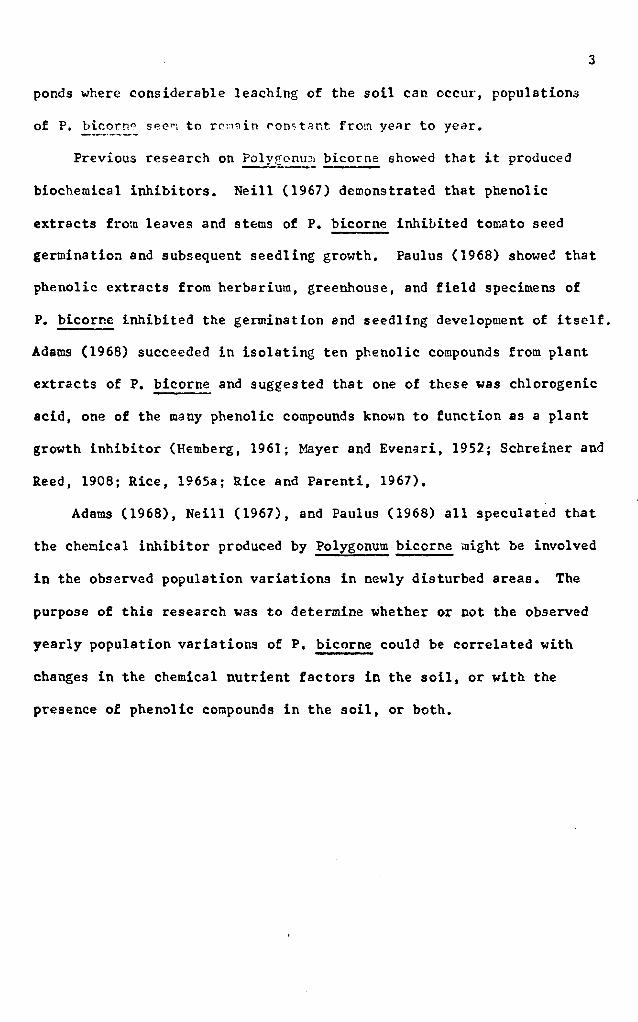
ponds where considerable leaching of the soil can occur, populations
of P. bicorn n see~ to rcngin constant from yeRr to year.
Previous research on Poly~ bico~ showed that it produced
biochemical inhibitors. Neill (1967) demonstrated that phenolic
extracts from leaves and stems of P. bicorne inhibited tomato seed
germination and sUbsequent seedling growth. Paulus (1968) showed that
phenolic extracts from herbarium, greenhouse, and field specimens of
P. ~icorne inhibited the germination and seedling development of itself.
Adams (1968) succeeded in isolating ten phenolic compounds from plant
extracts of P. bicorne and suggested that one of these was chlorogenic
acid, one of the many phenolic compounds known to function as a plant
growth inhibitor (Hemberg, 1961; Mayer and Evenari, 1952; Schreiner and
Reed, 1908; Rice, 1965a; Rice and Parenti, 1967).
Adams (1968), Neill (1967), and Paulus (1968) all speculated that
the chemical inhibitor produced by Polygonum bicorne might be involved
in the observed population variations in newly disturbed areas. The
purpose of this research was to determine whether or not the observed
yearly population variations of p. bicorne could be correlated with
changes in the chemical nutrient factors in the soil, or with the
presence of phenolic compounds in the soil, or both.

MATERIALS AND METHODS
Soils
The study was conducted in the Emporia, Kansas, area. The soils
in this area are dark, greyish-brown, silty, clay loams of the Sogn,.
Summit, Florence, and Idana soil series. The parent geologic materials
are loess deposits, calcareous shales, limestone, and cherty limestone
(Bidwell, 1956).
Study ~
In the fall of 1967 six study areas in Emporia and its vicinity
were selected. In each area, prior to its selection, the soil had been
strongly disturbed. During the first growing season following this
disturbance each area supported populations of Polygonum bicorne. When
the vegetational analyses were begun Areas 1-5 were first-year areas
and Area 6 was a second-year area.
Area 1 was located in a field bordering 18th Avenue directly east
of the Kansas State Teachers College campus. During growing seasons
preceeding the vegetational analyses it had been cultivated until it
laid fallow throughout the 1967 growing season.
Area 2 was situ&ted in a roadside ditch on the west side of
Industrial Street between West 12th and West 15th Avenues. During the
study it was mowed, but the soil was not disturbed.
Area 3 was situated cn a steep. east-facing slope on the Kansas
State Teachers College campus near 18th Avenue. During the winter of
1966 it was disturbed by construction equipment, and in the spring of
1967, Festuca elatior and Lolium multiflorum were planted in the area.

5
Area 4 was located on the north side of the Emporia bypass
approximately one-half mile west of the Merchant Street exit. It was
situated on an elevated embankment above the roadside ditch. This area
was disturbed by land-moving equipment when construction of the bypass
was being completed in the summer of 1967.
In January, 1968, a portion of Area 4 measuring 5 ft x 3 ft was
spaded. Consequently, during the growing season of 1968, this small
area, Area 4S, was simiiar to a first-year, study area while the
remainder of Area 4 was a second-year area.
Area 5 was located in a vacant lot at the corner of 15th Avenue
and Wheeler Street. It was disturbed by land-moving equipcent late
in 1966.
Area 6 was located in a vacant lot on the east side of Lincoln
Street between Old Manor Road and 18th Avenue. It was disturbed in
the spring of 1966.
In the summer of 1969. Area 7 was selected to furnish soil for
chromatographic analyses. This area was located in a field one mile
north of Emporia. Early in the summer this field was cultivated and
later abandoned after rains flooded it. When soil was taken from this
area it supported a first-year population of Polygonum bicorne.
Vegetational analyses
Vegetational analyses of all study areas except 45 and 7 were
conducted during October, 1967. In Areas 1, 2, end 3 rectangular
study quadrats that measured i m x 4 m were spaced along pre-determined
parallel lines at intervals determined by pacing (Oosting, 1956). After
6
each analysis the data from each area was used to draw a species-srea
curve (Caine, 1938) to insure that the number of quadrats sampled was
sUfficient.
Frequency, density, and area occupied for each species encountered
in the study quadrats were determined. Area occupied equaled the total
aerial area (square inches) occupied by a species in all the quadrats
divided by the total area (square inches) of all the quadrats in the
study area. Relative values for these three parameters were then deter
mined for each species. The importance percentage for each species was
then calculateu by dividing the sum of the three relative parameters by
the number of parameters. Dominant and important secondary species
were determined by inspection of the impolotance percentages using the
method suggested by Kornhaus (1965).
By the time Areas 4, 5, and 6 were to be analyzed in the fall of
1967, frost had killed the plants. Counts and measurements of individuals
were then impossible; therefore, an alternative method was used to analy~e
these areas. They were searched and recognizeable plant remains were
collected for species identification. A species list for each area was
then compiled.
In June, August, and October, 1968, three more vegetational analyses
of Areas 2-6 were conducted using the methods that were used to analyze
Areas 1, 2, and 3 in October, 1967. Area 48 was treated as a single
study quadrat because it was only 5 ft x 3 ft. Further analyses of
Area 1 were impossible because the field in which it was located was
cultivated in 1968. Vegetational analyses of ArEa 7 were not conducted.
7
Soil inoE]anic chemical analyses
Soil samples for chemical analyses were collected fro~ Areas 1-6
when each vegetational analysis was conducted. At fifteen randomly
located sites within each area a soil auger was used to collect one
soil core from the 0-6" soil profile level and one from the 6-12"
level. All cores from an area taken from the same level on the same
date were then combined to make a composite satllple. The composite
samples were then air dried, ground in a motorized soil mill, screened
through a 0.25 rom sieve, and stored for later analyses.
The pH values for the composite samples were determined by testing
a 1:1 (w/v) soil:water solution with a Zeromatic pH meter. The 1:1
solution was used because it closely approximated ratios most likely to
occur in the field (Jackson, 1958). Five readings for each composite
sample were averaged and the average recorded.
The organic carbon content of the cooposite samples, an approxi
mation of the organic matter content of the soil, was determined by
the Walkley-Black method as described by Piper (1942). The effect of
elementary carbon in the soil upon the final values was negligible when
this method was used.
Portions of all the composite soil samples were mailed to the
Harris Laboratories in Lexington, Nebraska, for determination of the
exchangeable megnesium and calcium ion concentrations. The atomic
absorption method (see appendix) was used in the determinations.
Total nitrogen was determined by the Kjeldahl method described by
Jackson (1958). ~h2 final values included nitrog~n in the organic,
ammoniul:l, and nitrate form,:;. Nitrite contpnt \<:'D3 r.ot d':tc'r~i!'.t::d ':x'cause

8
it was usually found to be negligible in all soils except those which
were strongly alkaline and heavily fertilized with ammonium fertilizers.
The 1, 2, 4-aminonapthosulfonic acid-reduced molybdophosphoric
blue color method in a perchloric acid system (Jackson, 1958) was used
to determine the concentration of total phosphorus. A Bausch and Lomb
Spectronic 20 spectrophotometer set at a wavelength of 660 mu was used
to detect the blue color intensities. This method was used because it
detected phosphorus concentrations over a wide range and because the
final values were only slightly affected by moderate variations in
soil acidity.
Soil and plant chromatographic analyses
Portions of some of the composite soil samplea taken during the
first and second growing seasons following disturbance from Areas 2,
3, 4, and 43 were saved for chromatographic analyses for the presence
of phenolic compounds which might act as plant growth inhibitors. In
addition, soil samples were taken from Area 7 during the summer of 196?
for chromatographic analyses.
Extracts of each of the soil samples were prepared by gently
boiling six oixtures of 100 g of soil and 150 001 of 100% methanol on
8 hotplate for five hours and filtering off the soil particles in a
Buchner funnel using Whatman No.3 filter paper. The six filtered
extracts were then combined and evaporated from their original combined
volume to 135 ml in a flash evnporator in order to concentrate any
phenolic cor;~pounds that mip;ht be present.
To isolate phenolic compounds, 10 ml of ear.h of the concentrated
soil extracts were applied in a streak 30 em long on four t~atrnan No. 1

9
chromatography papers. These streaked papers were developed by
descending chromatography in Warner-Chilcott ~1odel A-125 chromatocabs:
two in BA~ (n-butanol-acetic acid-water, 63-10-27 v/v) and two in 2%
aqueous acetic acid, solvent systems suggested for separation of
phenolic compounds (Smith, 1960). The developed chromatograms were
air dried and then viewed under long and short wave ultraviolet light
with and without exposure to ammonia fumes. The fluorescing zones
were outlined with pencil, colors of the zones under the different
ultraviolet light treatments were recorded, and Rf values of the zones
were determined.
A leaf extract of Polygonu~ bicorne was prepared and chromato
graphed for comparison with the chromatograms of the soil extracts.
The leaf extract was prepared by grinding 20 g of fresh leaves with
100 ml of 100% methanol for 10 minutes in a Waring blender and filterir~
off the leaf particles in 8 Buchner funnel using Whatman No.3 filter
paper. Three 001 of the filtered extract were applied in a 30 coo streak
to each of four Whatman No. 1 chromatography papers. The four papers
were developed in the 2% aqueous acetic acid solvent system and viewed
for fluorescing zones using techniques that were used with the soil
extract chromatograms. Color reactions and Rf values of fluorescing
zones on chromatograms of the leaf extracts and soil extracts were
compared. Eight more chro~tograms of each soil extract which showed
fluorescing zones on the original chromatograms were developed in the
2% aqueous acetic acid solvent system and viewed under ultraviolet
light.

10
Fluorescing zones from the soil extract and leaf extract chromato
grams which demonstrated similar color reactions under ultraviolet
light and similar Rf values were cut into small strips and immersed in
280 ml of 100% methanol for five hours. The elutant was then decanted
and 280 ml of fresh 100% methanol was added to the strips. After five
more hours, the second elutant portion was decanted and combined with
the first portion. The paper strips were then sir dried, taped
together, and checked under ultraviolet light after exposure to ammonia
fumes for the presence of fluorescing compounds.
Half of the combined methanolic elutant of each fluorescing zone
from the soil extract and leaf extract chromatograms was evaporated
in a flash eveporator to a volume of 15 ml to concentrate phenolic
compounds which were present in the elutant. Two ml of each concen
trated soil extract and leaf extract elutant were spott~d on Whatman
No. 1 chromatography paper along with 0.2 ml of a 0.2% solution in
95% ethanol of three different known phenolic plant growth inhibitors;
chlorogenic, caffeic, and quinic acids. Chromatograms were air dried
and viewed under ultraviolet light for fluorescing zones. The color
of the zones and their Rf values were recorded.
Two fluorescing zones developed from each elutant and each
phenolic solution were tested with FeC13-K3Fe(CN)6 reagents (Smith,
1960), a general test for phenolic compounds. Also, two more of each
of the zones were tested with Hoepfner's Reaction reagents (Rice,
1965b; Roberts anu ~ood, 1951), a specific test for chlorogenic ~cid
isomers.

11
~ gercination ~
A seed germination test was conducted using to~to seeds in
solutions of the phenolic compounds detected on chromatograms of soil
extracts prepared from the August, 1968, samples from Area 4, a second
year area, and Area 48, a first-year area. Half of the methanolic
elutants were each evaporated in'8 flash evaporator to 8 volume of 5 ml
and then diluted with enough distilled water to make a 1.5% solution.
Eight hundred tomato seeds were placed on autoclaved white quartz
sand in 40, plastic, petri dishes (20 seeds per dish). The sand in
each of 10 petri dishes was then saturated with 9 ml of the 1.5%
elutant solution from chromatograms of Area 4. To each of 10 other
petri dishes, 9 m1 of the elutant solution from chromatograms of
-Area 48 were added. Ten dishes of seeds to which 9 ml of a 1.5%
aqueous methanol solution was added served as a control. Sand in 10
other petri dishes of seeds was saturated with 9 ml of distilled water
to test the viability of the seeds. Excess loss of moisture was
prevented by wrapping the petri dishes with rubber seals. The dishes
were set out at a room temperature of 78-82 F. Germination counts
were made every 24 hr for a total of seven days.
~-~ development ~
After the 168 hr seed germination count, one-fourth of the seeds
that had germinated in each solution were randomly selected. The root
shoot axis of the germinated seeds was measured and the mean length for
the axes in each solution + standard error was determined. T-tests
were run to statistically compare the growth that occurred in the
different solutions.

RESULTS
Veg~tational analyses
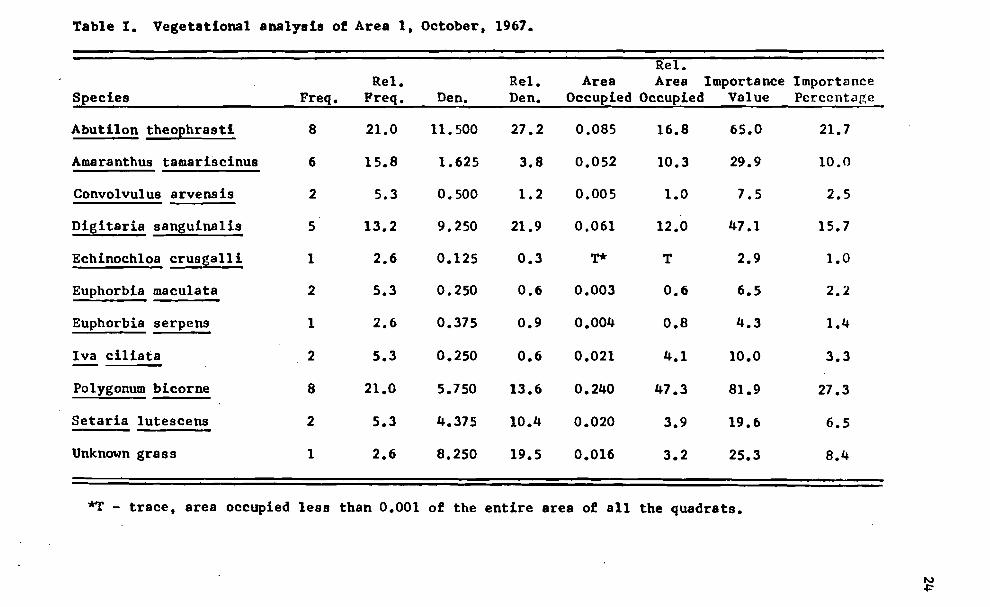
Results of the vegetational analyses indicated that the dominant
species in Area 1 during October, 1967, were Abutilon theophrasti,
Digitaria sanguinalis, and Polygonum bicorne. Amaranthus tamariscinus
was an important secondary species (Table I).
In Area 2 during O~tober, 1967, Bromus in~rmis was the single
dominant species. Sorghum vulgare and Polygonum bicorne were important
secondary species (Table II). During June, 1968, B. inermis was again
the only dominant while Setaria viridis was an important secondary
species (Table III). Bromus inermis and S. viridis both retained their
relative importance in Area 2 through August of 1968, while no other
.pecies appeared to increase significantly in importance (Table IV).
In October, 1968, B. inermis was by far the most important species.
Digitaria sanguinalis and Echinochloa crusgalli were important secondary
species (Table V). During none of the three vegetational analyses dates
in 1968 was P. bicorne found to approach its importance percentage of
11.7 for October, 1967 (Tables II-V).
In Area 3 during October, 1967, at the end of the first growing
.eason, Buchloe dactyloides, Festuca elatior, and Polygonum bicorne
were the dominants. There were no important secondary species with
importance percentages above 10.0; however, Setaria lutescens and
Echinochloa crusgalli had importance percentages of 9.3 and 8.0,
respectively (Table VI). In June, 1968, F. elatior and Lalium multi
florum were dominant. Trifolium repens and ~~ were important
secondary species (Table VII). Again in August, 1968, F. elatior and

13
L. multiflorum were the dominants and ,T. repens was an important sec
ondary species (Table VIII). Festuca elatior maintained its position
of dominance through October, 1968. At this time S. lutescens and
T. repens were important secondary species (Table IX). The highest
importance percentage attained by P. bicorne during the thr~e sampling
dates of 1968 was 1.6 in both June and August (Tables VII and VIII).
Frost killed the plants in Areas 4, 5, and 6 before a mathematically
based vegetational analysis could be conducted; however, results of the
identification of plant remains confirmed the presence of Polygonum
bicorne in these areas during October, 1967 (Tables X, XVII, and XXX).
Personal observations earlier in the fall of 1967 revealed that the
P. bicorne populations were dense in Areas 4 and 5, but only moderate
in Area 6.
In June, 1968, Trifolium repens was the single dominant species in
Area 4. Festuca elatior and Lo1ium mu1tiflorum were important secondary
species. At this time the importance percentage for Polysonum bicorne
in Area 4 was 0.7 (Table XI), while in Area 4S its importance percentage
was 58.1 (Table XII). In August, 1968, the dominants in Area 4 were
Bromus inermis, Setaria. lutescens , and T. repens. There were no sec
ondary species with importance percentages above 10.0; however, the
importance percentage for F. elatior was 8.7. Polygonum bicorne was
not encountered during this vegetational analysis of Area 4 (Table XIII).
At this time the importance percentage for P. bicorne in Area 4S was
29.2 (Table XIV). In October, 1968, the dominant species in Area 4
were B. inermis, Setaria faberii, S. lutescens and T. repens. Po1ygonum
bicorne was not encountered during this vegetational analysis (Table XV) •
•

14
At the same time in Area 4S the importance percentage for P. bicorne
~as 35.1 (Table A~I).
During June, 1968, the single do~inant species in Area 5 ~as
Bromus japonicus. The importance percentage of the other species did
not indicate that any were of significant secondary importance (Table
XVIII). In August, 1968, !£! pratensis aff. ~as the dominant in the
area (Table XIX). During October, 1968, P. Fratensis aff. was again
the single dominant. Convolvulus arvensis and 'Setaria lutescens were
important secondary species. The highest importance percentage deter
mined for Polygonum bicorne in Area 5 during the 1968 growing season
was 7.8 in October (Table XX).
In June, 1968, Lespedeza striata, Setaria lutescens and Sporobolus
vaginiflorus were the dominant species in Area 6. The results indicated
no other species of significant secondary importance (Table XXII). In
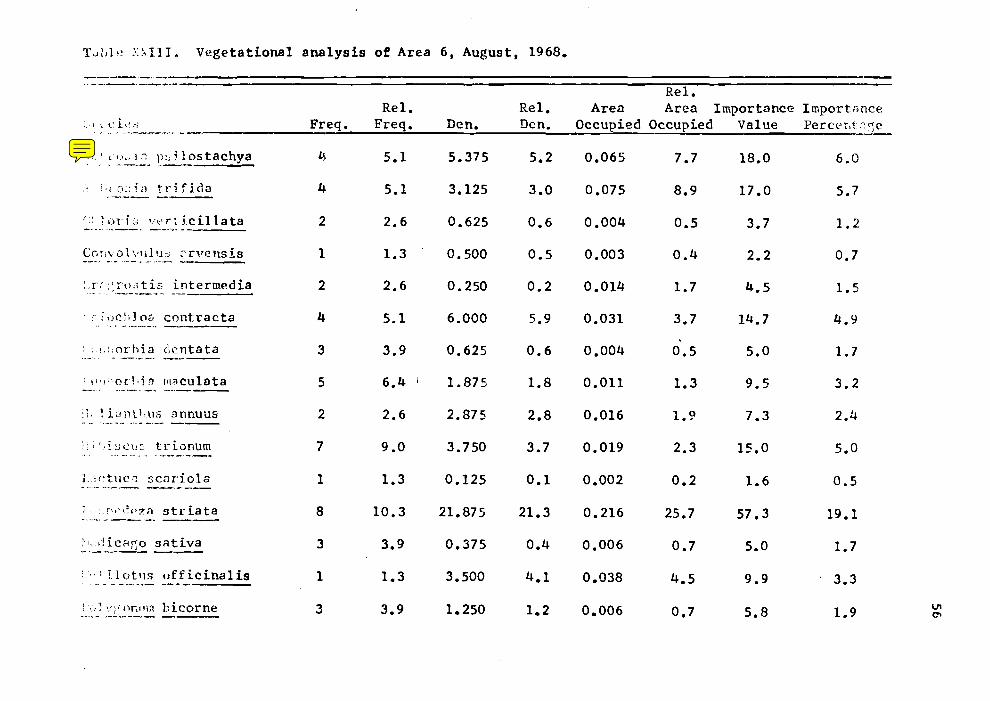
August, 1968, L. striata and S. lutescens were again dominants while
s. vaginifl~ ~as an important secondary species (Table XXIII). In
October, 1968, the same three species and Echinochloa crusgalli were the
dominants (Table XXIV). The highest importance percentage recorded for
Polygonum bicorne in Area 6 during 1968 ~as 2.8 in June (Table XXII).
~ inorganic chemical analyses
The results of the analyses of the soil taken from Area 1 in
October, 1967, indicated that the properties in the 0-6" and 6-12" soil
profile levels differed little from each other. However, it appeared
that the total nitrogen content and total phosphorus content of this
soil were considerably higher than in the soil from most of the other
study areas for October, 1967 (Table XXV). The field in which this

15
study area ~as located wa~ cultivated in 1968. so it ,,,as impossible to
further sao~le the soil to note any seasonal trends in the chemical
properties that night occur.
Results of the Area 2 soil analyses indicated that the chemical
properties in the 0-6" and 6-12" soil profile levels closely approxi
mated each other. The only exceptions were the organic carbon content
of the August, 1968, sample and the exchangeable magnesium ion concen
tration of the June, 1968, sample. The pH values of the soil samples
taken in 1907 and 1968 were relatively constant. The results indicated
a slight increase in the organic carbon content of the soil in this
area during the growing season of 1968, but the content in October, 1968,
was only slightly higher than the content in October, 1967. Steady
decreases in the values for exchangeable calcium ion content of the soil
were demonstrated in 1968; however, the values for this property in
October, 1968, were also consistent with the values determined for the
October, 1967, soil samples. Total nitrogen and total phosphorus content
of the soil appeared to remain relatively stable from October, 1967, to
October, 1968 (Table XXVI).
The October, 1968, values for pH and exchangeable calcium ion of
Area 3 were slightly higher than the corresponding values in October,
1967. Other chemical properties appeared comparatively stable from
October, 1967, to October, 1968 (Table XXVII).
In Area 4 the values for exchangeable magnesium ion concentration,
total nitrogen, and total phosphorus content of the soil samples
fluctuated slightly, but did not shew any major changes en the different
sampling dates. The values for pH and organic carbon content in th~

16
October, 1968, soil samples were slightly higher than the corresponding
values for the October, 1967, samples. The concentration of exchange
able calcium ion did appear considerably higher in October. 1968. than
in October, 1967 (Table XXVIII).
Analyses of the soil samples taken from Area 48 during 1968
revealed an increase in the organic carbon content of the soil and a
decrease in the exchangeable calcium ion concentration. Values deter
mined for the other chemical factors did not appear to vary greatly
during the sampling period of 1968 (Table XXIX).
The pH values of the soil from Area 5 consistently indicated basic
conditions. The organic carbon content of the soil was high in October,
1967, when compared to the values determined for 1968. The exchangeable
magnesium ion concentration and total nitrogen content of the soil demon
strated minor changes during the study period. The values for the
phosphorus concentration remained relatively constant throughout the
study even though they were considerably higher than the phosphorus
concentration values for all of the other study areas. The exchangeable
calcium ion concentration increased in the 0-6" level from October, 1967,
to October. 1968, but decreased in the 6-12" level (Table XXX).
The pH, organic carbon content. total nitrogen content. and total
phosphorus concentration of the soil from Area 6 remainp.d stable through
out the growing season of 1968 and were comparable to the corresponding
values for October. 1967. The exchangeable magnesium and calcium ion
concentrations increased significantly during 1968 over their respective
values for October, 1967 (Table XXXI).

17
~.~ plant chromatographic analyses
Fluorescing phenolic zones were detected on the two original
chromatograms of each soil extract that were developed in the 2%
aqueous acetic acid solvent system; however, no phenolic zones were
detected on the chromatograms developed in the BAW solvent system.
The eluted chromatography paper strips did not fluoresce under
ultraviolet light after exposure to ammonia fumes. This indicated
that the elution process effectively removed the phenolic compounds
from the paper.
The results of the chromatography using the elutants extracted
from the original streaked chromatograms indicated the presence of
phenolic compounds in all the soil extracts. The Rf values and color
reactions of most of the phenolic compounds of these different soil
extract elutants corresponded closely with cne another and with the
Rf values and color reactions of one of the phenolic zones of the
Polygonu~ bicorne leaf extract elutant. However, Rf values and color
reactions of these phenolic zones did not correlate closely with the
at values and color reactions of chI orogenic , caffeic, and quinic
acids (Table XXXII).
Seed germination ~
The seed germination rate appeared to be retarded in both test
solutions when compared with the control solution. The biggest
difference among the germination percentages occurred in the period
between the 72 hr and 120 hr germination counts. The germination
percentage in the control solution was higher than in both test solutions
until approxioately the time that the 144 hr count was made. At this

18
time, the germination percentage for the seeds in the Area 4S solution
surpassed that of the control. Also, at this tio~, the germination
percentage for the seeds in the Area 4 solution closely approached
that of the control. Throughout the test, the germination rate in
the Area 4 solution appeared to be more retarded than the rate in the
Area 48 solution (Figure 1).
~-shoot development test
At the end of 168 hr of development in the test and control
solutions, root-shoot length measurements revealed that growth in the
test solutions was retarded when compared with growth in the control
solution. T-values indicated that the difference in growth between the
seeds in the Area 4 solution and those in the control was significant
at or below the 1% level. The difference in gro~th between th~ seeds
in the Area 48 solution and those in the control was significant at
or below the 5% level. Growth appeared to be significantly more
retarded in the solution from Area 4 when compared to growth in the
solution from Area 48. The t-value that compared the gro~th in these
two solutions showed a difference significant at or below the 1% level.
~

DISCUSSION
Vegetational ~nalyses
During October, 1967, vegetational analyses of the first-year,
study areas revealed dense and visually dominant populations of
Polygonum bicorne and other species that charactp.ristically inhabit
waste areas and recently abandoned fields (Clements, 1928; Steyermark,
1963). Hmvever, in the. second-year, study area, Area 6, during October,
1967, P. bicorne was not visually dominant.
Vegetational analyses of second-year, study areas during the 1968
growing season again revealed dense populations of species that inhabit
recently disturbed areas; however, Polygonum bicorne was not one of
these species. Dense populations of P. bicorne were limited to the
first-year, study areas.
~ inorganic chemical analyses
The pH values for all soil sampled throughout the study fell into
a weak acid to medium alkaline range. This range is consistent with
that found by Bailey (1944) for numerous prairie soils throughout the
United States. Perkins and Schrenk (1948) determined pH values in a
similar range for various Kansas soils.
The organic carbon contents were consistently lower than, but
comparable to those determined by Sewell and Latshaw (1925) for soils
from Scott County, Kansas. Most of the values for the 0-6" soils were
higher than the values for the 6-12" soils as would be expected since
humus is added to the surface of the soil. There were no consistent
.~~

20
differences in the organic carbon contents of the soils between the
first and secono growing seasons.
The values determined for exchangeable calcium and magnesium ions
were very high in comparison to values determined by Perkins and Schrenk
(1948) for various Kansas soils. These values were not accompanied by
correspondingly high pH values or organic carbon contents as might be
expected from the trend reported by Black (1957). In the majority of
the samples. the concentration of exchangeable calcium and magnesium
was greater in the 6-12" than in the 0-6" soil profile level. This
difference was probably caused by leaching of the ions from the upper
soil profile level. The concentration of exchangeable calcium was
higher in some areas during the second growing season than during the
first; however. this tendency was not consistent.
The values for total nitrogen content corresponded with the 0.10
0.25% range reported for prairie soils of the central United States by
Allison (1957) and with the range determined by Sewell and Latshaw
(1925) for soils in Scott County. Kansas. The content for the 0-6" soil
profile levels was higher than that fcr the 6-12" levels as would be
expected since the organic matter, from which most of the soil nitrogen
was derived. was concentrated near the soil surface. The nitrogen
content of the soils from Areas 1 and 5 was higher than that of soils
from the other study areas. During the 1966 growing season Area 1 had
been fertilized. This possibly explained the high nitrogen content in
this study area. No consistent differences in the nitrogen content of
the soils were evident when values for the two growing seasons were
compared.

21
The amount of total phosphorus in most of the soils fell within
the 2.2-8.3 PPQ ran~e reported for most soils by Black (1957). The
amounts in the soils from Areas 1 and 5 were htgher than the amounts
from the other study areas. This corresponded with higher a~ounts of
total nitrogen in these two areas and indicated that Area 5 could have
been fertilized as Area 1 had been. No consistent differences in the
total phosphorus content of the soils were evident when readings for
October, 1967, and October, 1968, were compared.
The noticeable reduction in the Polygonum bicorn~ populations
could not be correlated with consistent changes in any of the inorganic
chemical properties of the soil. The factor responsible for the
population reduction was probably something other than the inorganic
chemical factors that were determined.
~~ plant chromatographic analyses
Several phenolic compounds were detected in the soil e;,tracts. One
of these compounds was present in all soil extracts prepared from soil
of both first- and second-yea~ study areas. Since this phenolic compound
demonstrated an Rf value and color reactions similar to those of one of
the phenolic compounds detected in leaf extracts of Polygonum bicorne,
it is possible that the compounds were identical and that at least some
of this compound was originally produced by P. bicorne and later depos
ited in the soil. This possibility was also suggested by Neill (1967),
Adams (1968), and Paulus (1968). The compound could not be identified
as either chlorogenic acid, a known plant growth inhibitor found in
P. bicorne (Adams, 1968), or its natural breakdown products, caffeic
and quinic acids, which are also inhibitory (Schaal and Johnson, 1955). 0;

22
~germination ~
Solutions of the phenolic compound inhibited germination of tomato
seeds. Since this phenolic compound corresponded with a phenolic
compound found in Polygonum bicorne extracts that inhibited the germi
nation of P. bicorne, as well as tomato seeds (Paulus, 1968; Neill, 1967),
it is possible that the phenolic compound in the soils could also inhib
it germination of P. bicorne seeds. -
Germination inhibition was more pronounced in the solution prepared
from the soil of Area 4, a second-year area, than in the solution pre
pared from Area 4S, a first-year area. This indicated that possibly
there was a higher concentration of the inhibitory phenolic compound in
the soil from the second-year, study area.
~-shoot development ~
Root-shoot development, in addition to seed germination, was
inhibited more in the test solution prepared from the second-year, study
area, Area 4, than in the solution from the first-year area, Area 48.
This also indicated a greater concentration of the inhibitory compound
in the soil from the second-year area.
Inhibition of seed germination and early seedling development can
reduce the ability of a species to compete for nutrients, moisture, and
sanlight and, consequently, reduce the population density of that species
(Clements, 1928). If the phenolic compound found in the soil extracts
can inhibit the germination and development of Polygonum bicor~e, as well
as tomato seeds, the presence of this compound in higher concentrations
in the soil of second-year areas than in soil of first-year areas could
cause the annual variations of P. bicorne populations in these areas.

SlJM}~RY
Vegetational analyses of several disturbed areas in Emporia, Kansas,
and its vicinity revealed that populations of Po1ygonum bicorne were
dominant, or nearly so, during the first growing season, but sparse
during the second groYling season following the original disturbances.
Inorganic chemical analyses of soils sampled from the study areas
during the first and second growing seasons revealed no consistent
differences that could be corre1at€d with the variations of the Po1ygonum
bicorne popUlations.
Chromatographic analyses of various soil extracts prepared from
both first- and second-year soil samples revealed the presence of a
phenolic compound which demonstrated an Rf value and color reactions
similar to those of a phenolic compound present in Po1ygonum bicorne
extracts.
Tests revealed that the phenolic compound found in soils from both
8 first- and a second-year area inhibited germination of tomato seeds
and subsequent root-shoot development. The inhibition in the solution
prepared from soil of the second-year area was greater than that in the
solution prepared from soil of the first-year area.
--
Table I. Vegetational analysis of Area 1, October, 1967.
Rei. ReI. ReI. Area Area Importance Importance
Species Freq. Freq. Den. Den. Occupied Occupied Value Percentage
Abutilon theophrasti 8 21.0 11.500 27.2 0.085 16.8 65.0 21.7
Amaranthus tamariscinus 6 15.8 1.625 3.8 0.052 10.3 29.9 10.0
Convolvulus arvensis 2 5.3 0.500 1.2 0.005 1.0 7.5 2.5
Digitaria sanguinalis 5 13.2 9.250 21.9 0.061 12.0 47.1 15.7
Echinochloa crusgal1i 1 2.6 0.125 0.3 T* T 2.9 1.0
Eup?orbia maculata 2 5.3 0.250 0.6 0.003 0.6 6.5 2.2
Euphorbia ~ens 1 2.6 0.375 0.9 0.004 0.8 4.3 1.4
Iva ciliata 2 5.3 0.250 0.6 0.021 4.1 10.0 3.3
Polygonum bicorne 8 21.0 5.750 13.6 0.240 47.3 81.9 27.3
Setaria 1utescens 2 5.3 4.375 10.4 0.020 3.9 19.6 6.5
Unknown grass 1 2.6 8.250 19.5 0.016 3.2 25.3 8.4
*T - trace, area occupied less than 0.001 of the entire area of all the quadrats.
p.,J
+:'

Table II. Vegetational analysis of Area 2, October, 1967.
Rei. Rei. Rei. Area Area Importance Importance
Species Preq. Freq. Den. Den. Occupied Occupied Value Percentage
Abuti10n theophrasti 1 2.3 0.500 1.1 T* T 3.4 1.1
Amaranthus tamariscinus 4 9.1 2.250 4.8 0.026 4.7 18.6 6.2
Bromus inermis 4 9.1 18.500 39.2 0.259 47.2 95.5 31.8
Chenopodium ~ 1 2.3 1.500 3.2 0.021 3.8 9.3 3.1
Chenopodium 1anceo1atum 1 2.3 0.250 0.5 0.001 0.2 3.0 1.0
Digitaria 8anguina1i~ 3 6.8 2.500 5.3 0.028 5.1 17 .2 5.7
Echinochloa crusga11i 2 4.5 0.750 1.6 0.007 1.3 7.4 2.5
Euphorbia dentata 1 2.3 0.250 0.5 0.005 0.9 3.7 1.2
Eupho~ maculata 1 2.3 0.250 0.5 0.002 0.4 3.2 1.1
Geranium caro1inianum- 2 4.5 1.000 2.3 0.001 0.2 7.0 2.3
Hibiscus trionum- 2 4.5 1.000 2.3 0.006 1.1 7.9 2.6
Kochia scoparia 2 4.5 1.250 2.6 0.007 1.3 8.4 2.8
Me1i1otus officina1is- 2 4.5 0.500 1.1 0.011 2.0 7.6 2.5
Oxalis stricta- 3 6.8 1.000 2.3 0.007 1.3 10.4 3.5
Panicum virgatum 1 2.3 0.250 0.5 0.010 1.8 4.6 1.5 '" VI

Table II. (continued)
ReI. ReI. Rel. Area Area Importance Importance
Species Freq. Freq. Den. Den Occupied Occupied Value Percentage
Physalis virginiana 1 2.3 1.750 3.7 0.011 2.0 8.0 2.7
Po1ygonum bicorne 3 6.8 4.250 9.0 0.106 19.3 35.1 11.7
Rumex crispu9 1 2.3 0.250 0.5 0.006 1.1 3.9 1.3
Setaria 1utescens- 1 2.3 0.250 0.5 0.006 1.1 3.9 1.3
Setaria viridis- 1 2.3 0.750 1.6 0.006 1.1 5.0 1.7
Solanum carolinense 2 4.5 0.750 1.6 0.004 0.7 6.8 2.3
Sorghum vulgare 4 9.1 7.250 15.3 0.117 21.3 45.7 15.2
Taraxacum officina1e 1 2.3 0.250 0.5 0.002 0.4 3.2 1.1
*T - trace, area occupied less than 0.001 of the entire area of all the quadrats.
"J 0\
f&

Tabl. 111. Vegetational analysis of Area 2. June. 1968.
Ret. ReI. Ret. Area Area Importance Importance
Species Freq. Freq. Den. Den. Occupied Occupi~~ Value Percentage
Abuti1o~ theophrasti 4 7.8 5.250 4.7 0.003 0.4 12.9 4.3
Bromus inermis- 4 7.8 38.000 34.1 0.523 62.9 104.8 34.9
Bromus japonicus"
3 5.9 1.250 1.1 0.026 3.1 10.1 3.4
Erigeron canadensis 3 5.9 1.000 0.9 0.004 0.5 7.3 2.4
Geranium carolinianum 3 5.9 1.250 1.1 0.026 3.1 10.1 3.4
• llel1anthus 'annuus 2 3.9 1.250 1.1 0.003 0.4 5.4 1.8
Hibiscus trionum- 4 7.8 15.250 13.7 0.011 1.3 22.8 7.0
Lepidium virginicum 4 7.8 7.250 6.5 0.023 2.8 17.1 5.7
Me1ilotus officinalis 3 5.9 0.750 0.7 0.032 3.8 10.4 3.5
Oenothera laciniata 2 3.9 0.750 0.7 0.008 1.0 5.6 1.9
Physalis virginians 2 3.9 3.250 2.9 0.040 4.8 11.6 3.9
Polygonu~ bicorne 1 2.0 0.250 0.2 T* T 2.2 0.7
Rumex crispus 1 2.0 0.250 0~2 0.002 0.2 2.4 0.8
Setaria viridis 3 5.9 24.500 22.0 0.050 6.0 33.9 11.3
Silene antirrhina 2 3.9 0.500 0.4 0.004 0.5 4.8 1.6 N....,

Table III. (continued)
ReT: -- - -
ReI. ReI. Area Area Importance Importance Species Preq. Preq. Den. Den. Occupied Occupied Value Percentage
Solanum carolinense 4 7.8 8.250 7.4 0.056 6.7 21.9 7.3
Sporobolus !!fer 2 3.9 1.000 0.9 0.003 0.4 5.2 1.7
Taraxacum officinale 2 3.9 0.500 0.4 0.014 1.7 6.0 2.0
Tragopogon major 2 3.9 0.750 0.7 0.004 0.5 5.1 1.7
*T - trace, area occupied les8 than 0.001 of the entire area of all the quadrats.
I'.> Q)
~
e

Table IV. Vegetational aDa1ysis of Area 2, August, 1968.
Specie8 Freq. ReI.
Freq. Den. ReI. Den.
Ret. Area Area Importance Importance
Occupied Occupied Value Percp.nta~
Abutilo~ theophrasti 1 2.3 0.750 1.1 0.001 0.1 3.5 1.2
Bromus inermis 4 9.1 22.000 32.4 0.508 63.1 104.6 34.9
Convolvulus arvensi8 1 2.3 0.250 0.4 0.002 0.2 2.9 1.0
Digitaria sanguinalis 2 4.5 1.500 2.2 0.006 0.7 7.4 2.5
Erigeron canadensis 2 4.5 1.000 1.5 0.003 0.4 6.4 2.1
Eriochloa contracta 2 4.5 0.500 0.7 0.003 0.4 5.6 1.9
Euphorbia dentata 2 4.5 1.000 1.5 0.008 1.0 7.0 2.3
Euphorbia macu1ata 1 2.3 0.250 0.4 0.001 0.1 2.8 0.9
Helianthu8 annuus
Hibiscus trionum
1
4
2.3
9.1
0.250
6.500
0.4
9.6
0.003
0.022
0.4. 2.7
3.1
21.4
1.0
7.1
Kochis scoparis 1 2.3 0.250 0.4 0.001 0.1 2.8 0.9
Lactuca scariola- 1 2.3 0.500 0.7 0.004 0.5 3.5 1.2
~spedeza st~ 2 4.5 0.500 0.7 0.008 1.0 6.2 2.1
Medicago sativa
Oxalis stricta
2
1
4.5
2.3
0.500
0.250
0.7
0.4
0.005
0.001
0.6
0.1
5.8
2.8
1.9
0.9 N 'D

• •
Table IV. (continued)
ReI. ReI. ReI. Area Area Importance Import8nce
Species Freq. Freq. Den. Den. Occupied Occupied Value -
Percc!l':<:l7L
Physalis virginiana 2 4.5 3.250 4.8 0.050 6.2 15.5 5.2
Rumex crlspus 2 4.5 0.500 0.7 0.010 1.2 6.4 2.1
Setaria lutescens- 1 2.3 4.000 5.9 0.023 2.9 11.1 3.7
Setaria viridis 3 6.8 16.750 24.6 0.081 10.1 41.5 13.8
Solanum carolinense 4 9.1 5.000 7.4 0.042 5.2 21.7 7.2
Solanum rostratum 1 2.3 1.500 2.2 0.008 1.0 5.5 1.8
Sorghum vUlgare 1 2.3 0.250 0.4 0.006 0.7 3.4 1.1
Taraxacum officinale- 2 4.5 0.500 0.7 0.006 0.7 5.9 2.0
Xanthium pensylvanicum 1 2.3 0.250 0.4 0.003 0.4 3.1 1.0
w o

Table V. Vegetational analysis of Area 2, October, 1968.
Rei. ReI. ReI. Area Area Importance Importa~ce
Species Freq. Freq. Den. Den. Occupied Occupied Value Percentage
Abutilon theophrasti 1 2.9 0.250 0.3 T* T 3.2 1.1
Aristid! oligantha 1 2.9 0.500 0.6 0.005 0.7 4.2 1.4
Bromus ine rmis 4 11.4 42.250 47.5 0.588 82.0 140.9 46.9
Convolvulus arvensis 1 2.9 0.250 0.3 0.002 0.3 3.5 1.2
Digitaria sanguinali~ 3 8.6 19.000 21.4 0.049 6.8 36.8 12.3
• Echinochloa crusgalli 4 11.4 1.500 1.7 0.002 0.3 13.4 4.5
Eriochloa contracta 1 2.9 0.250 0.3 T T 3.2 1.1
Euphorbia dentata 3 8.6 1.500 1.7 0.007 1.0 11.3 3.8
Hibiscus trionum 3 8.6 5.500 6.2 0.007 1.0 15.8 5.3
Melilotus officinal is 1 2.9 0.250 0.3 0.001 0.1 3.3 1.1
Polygonum bicorne 1 2.9 0.250 0.3 T T 3.2 1.1
Rumex crispus 1 2.9 0.500 0.6 0.005 0.7 4.2 1.4
Setaria lutescens 3 8.6 11.750 13.2 0.030 4.2 26.0 8.7
Setaria viridis 3 8.6 3.000 3.4 0.003 0.4 12.4 4.1
Solanum carolinense 1 2.9 0.250 0.3 0.001 0.1 3.3 1.1 to)....
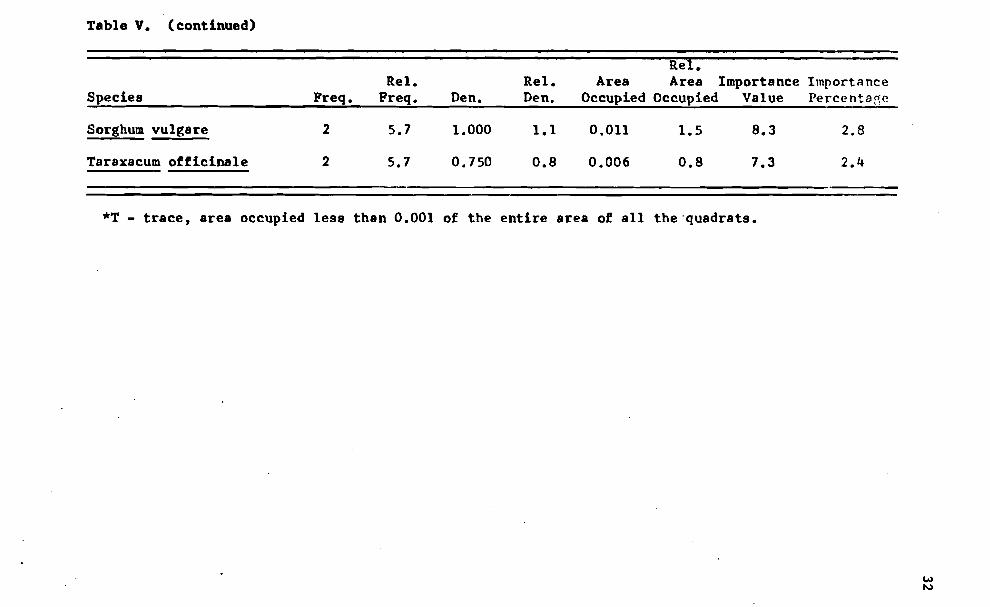
Table V. (continued)
Species Freq. ReI.
Freq. Den. ReI. Den.
lteT.~~---- ._~
_.~---_.--
Area Area Importance Importance Occupied Occupied Value Percentap:e
Sorghum vUlgare 2 5.7 1.000 1.1 0.011 1.5 8.3 2.8
Taraxacum officinale 2 5.7 0.750 0.8 0.006 0.8 7.3 2.4
*T - trace, area occupied less than 0.001 of the entire area of all the "quadrats.
w t-.)
I!t •

Table VI. Vegetational aDelyais of Area 3, October, 1967.
Species Freq. ReI.
Freq. Den. ReI. Den.
Ret. Area Area Importance Importance
Occupied Occupied Value Per~~e
Abutilon theophrasti I 1.4 0.250 0.4 0.001 0.1 1.9 0.6
Amaranthus tamariscinus 7 9.6 3.125 5.1 0.037 4.5 19.2 6.4
Ambrosia trifida 5 6.8 1.125 1.9 0.023 2.8 11.5 3.8
Buchloe dactyloides 7 9.6 13.125 21.7 0.252 30.7 62.0 20.7
Digitsria sanguinalis 2 2.7 1.000 1.7 0.005 0.6 5.0 1.7
Echinochloa crusgalli 8 11.0 4.500 7.5 0.044 5.4 23.9 8.0
Euphorbia maculata 4 5.5 1.500 2.5 0.009 1.1 9.1 3.0
Euphorbia sup ina 2 2.7 0.250 0.4 0.001 0.1 3.2 1.1
Pestuca elatior
Kochis scoparia
8
I
11.0
1.4
20.875
0.125
34.6
0.2
0.180
0.003
21.9. 0.4
67.5
2.0
22.5
0.7
Melilotus officinalis 7 9.6 1.625 2.7 0.019 2.3 14.6 4.9
Polygonum aviculare 2 2.7 0.250 0.4 0.002 0.2 3.3 1.1
Polyg~ bicorne 8 11.0 5.875 9.7 0.165 20.1 40.8 13.6
Setaria lutescens 8 11.0 5.000 9.1 0.065 7.9 28.0 9.3
w w

Table VI. (continued)
Species Freq. ReI.
Freq. Den. ReI. Den.
Rel. Area Area Importance Importance
Occupied Occupied Value Per~ag~
Trifolium pratense 1 1.4 0.250 0.4 T* T 1.8 0.6
Trifolium repens 2 2.7 1.000 1.7 0.015 1.8 6.2 2.1
*T - trace, area occupied less than 0.001 of the entire area of 811 the quadrats.
w ~

Table VII. Vegetational ana1ysia of Area 3, June, 1968.
Species Freq. ReI.
Freq. Den. ReI. Den.
Rei. Area Area Importance Importnnce
Occupied Occupied Value Perccnt!lge
Bromus japonicus 3 6.7 0.375 0.5 0.003 0.4 7.6 2.5
Convolvulus arvensis 1 2.2 0.125 0.2 0.001 0.1 2.5 0.8
Euphorbia macu1ata 2 4.4 0.875 1.2 0.001 0.1 5.7 1.9
Euphorbia supina 2 4.4 0.625 0.8 T* T 5.2 1.7
•
Festuca elatior
Lo1ium mu1tif1orum
8
7
17 .8
15.6
24.875
16.250
32.7
21.4
0.433
0.141
59.3
19.3
109.8
56.3
36.6
18.8
Medicago 1upu1ina 2 4.4 0.250 0.3 0.001 0.1 4.8 1.6
Me1i1otus officina1is 6 13.3 0.875 1.2 0.023 3.2 17.7 5.9
Polygonum bicorne 2 4.4 0.250 0.3 T T 4.7 1.6
Sporobo1u8 asper 1 2.2 0.125 0.2 T T 2.4 0.8
Trifolium repens 6 13.3 11.500 15.1 0.114 15.6 44.0 14.7
Ulmus rubra 5 11.1 19.875 26.2 0.013 1.8 39.1 13.0
*T - trace, area occupied 1es8 than 0.001 of the entire area of all the quadrats.
w VI

--
Table VIII. Vegetational analy.is of Area 3, August, 1968.
ReI. ReI. ReI. Area Area Importance Importance
Species Freq. Freq. Den. Den. Occupied Occupied Value Percentnge
Convolvulus arvensis 1 2.2 1.000 1.2 0.001 0.1 3.5 1.2
Erigeron annuus 1 2.2 0.125 0.1 T* T 2.3 0.8
Euphorbia maculata 3 6.7 1.375 1.6 0.003 0.4 8.7 2.9
Euphorbia supins 3 6.7 1.750 2.0 0.004 0.6 9.3 3.1
Festuca elatior 8 17 .8 29.125 33.7 0.465 64.7 116.2 38.7
Lo1ium mu1tif1orum 8 17 .8 17.125 19.8 0.127 17.7 55.3 18.4
Medica~ lupuUna 1 2.2 0.125 0.1 0.001 0.1 2.4 0.8
Polygonum aviculare 1 2.2 0.125 0.1 T T 2.3 0.8
Polygonum bicorne 2 4.4 0.250 0.3 T T 4.7 1.6 .
Setaria lutescens 5 11.1 10.250 11.9 0.022 3.1 26.1 8.7-Trifolium pratense 1 2.2 0.125 0.1 0.001 0.1 2.4 0.8
Trifolium repens 6 13.3 14.625 16.9 0.087 12.1 42.3 14.1
Ulmus rubra 5 11.1 10.500 12.1 0.008 1.1 24.3 8.1-
*T - trace, area occupied less thaD 0.001 of the entire area of all the quadrats. w 01

--
--
Table IX. Veg~tational analysis of Area 3, October, 1968.
ReI. ReI. ReI. Area Area Importance Importan~e
Species Freq. Freq. Den. Den. Occupied Occupied Value PerCE:n!flg~
Ambrosia trifida 1 2.0 0.125 0.1 0.001 0.1 2.2 0.7
Convolvulus arvensis 1 2.0 2.125 2.4 0.014 1.8 6.2 2.1
Digitaria ssnguina1is 5 10.2 2.125 2.4 0.005 0.6 13.2 4.4
Echinoch1oa crusga11i 2 4.1 0.625 0.7 0.002 0.3 5.1 1.7
Erigeron annuus 1 2.0 0.125 0.1 T* T 2.1 0.7
Euphorbia macu1ata 6 12.2 1.875 2.2 0.009 1.1 15.5 5.2
Euphorbia supina 2 4.1 1.250 1.4 0.005 0.6 6.1 2.0
Festuca e1atior 8 16.3 44.375 51.0 0.613 77 .6 144.9 48.3
Me1i1otus officina1!s 1 2.0 0.250 0.3 0.002 0.3 2.6 0.9 I
Po1ygonum avicu1are 1 2.0 0.250 0.3 T T 2.3 0.8
Po1ygonum bicorne 2 4.1 0.375 0.4 T T 4.5 1.5
Setaria 1utescens 7 14.3 21. 250 24.4 0.058 7.3 46.0 15.3
Trifolium repens 6 12.2 7.250 8.3 0.077 9.7 30.2 10.1
Ulmus rubra 6 12.2 5.000 5.7 0.004 0.5 18.4 6.1
w .....,
*T - trace, area occupied less than 0.001 of the entire area of all the quadrats.

Table X. Vegetational analysis of Area 4, October, 1967. Species list determined from identification of plant remains.
Species Species
Abutilon theophrasti
Amaranthus tamariscinus
Ambrosia artemisiifolia
Ambrosia trifida
Bromus sp.
Chenopodium album
Chenopodium sp.
Cirsium altissimum
Echinochloa crusgalli
Festuca ap.
Gaura sp.
Helianthus annuus
Hibiscus trionum
Medicago sativa
Panicum dichotomiflorum
Panicum scribnerianum
Plantago aristata
Polygonum bicorne
Setaria lutescens
Setaria viridis
Solanum rostratum
Thlaspi arvense
Trifolium repens
Verbena sp.
Xanthium sp.
w
••
00

Table XI. Vegetational analysis of Area 4, June, 1968.
ReI. ReI. ReI. Area Area Importance Importance
Species Fl'eq. Freq. Den. Den. Occupied Occupied Value Percentage
Bromus inermis 1 2.0 1.571 1.4 0.015 1.7 5.1 1.7
Bromus japonicus 6 12.0 2.286 2.1 0.029 3.2 17 .3 5.8
Cynodon dactxlon 1 2.0 0.143 0.1 0.001 0.1 2.2 0.7
Festuca e1atior 5 10.0 14.286 13.1 0.074 8.3 31.4 10.5
Lactuca scario1a 5 10.0 2.429 2.2 0.022 2.5 14.7 4.9
•Lepidium virginicum 1 2.0 0.143 0.1 T* T 2.1 0.7
Lolium mu1tif1orum 7 14.0 8.280 7.0 0.108 12.1 33.7 11.2
Medicago sativa 5 10.0 1.571 1.4 0.080 9.0 20.4 6.8
Me1ilotus officinalis 2 4.0 0.286 0.3 0.010 1.1 5.4 1.8
Plantago aristata 4 8.0 3.286 3.0 0.012 1.3 12.3 4.1
Po1ygonum bicorne 1 2.0 0.143 0.1 0.001 0.1 2.2 0.7
Sorghum ha1epense 5 10.0 2.857 2.6 0.035 3.9 16.5 5.5
Trifo1 ium repens 7 14.0 72.143 65.9 0.504 56.6 136.5 45.5
*T - trace, area occupied les8 than 0.001 of the entire area of all the quadrats. w
•
10

Table XII. Vegetational analysis of Area 4S, June, 1968.
Species Freq. Rel.
Freq. Den. Rel. Den.
Rel. Area Area Importance Importance
Occupied Occupied Value Percentage
Polygonum bicorne 1 50.0 34 61.8 0.113 62.4 174.2 58.1
Unknown grass 1 50.0 21 38.2 0.068 37.6 125.8 41.9
g

Table XIII. Vegetational analysis of Area 4, August, 19b8.
Species_ Fr~q.
ReI. Fre~ Den.
ReI. Den.
ReI. Area Area Importance Importance
Occupied Occupied Value Pe r ce Il!2fl:_
Amaranthus tamariscinus 5 8.9 6.714 9.2 0.047 5.6 23.7 7.9
Bromus i nermis 7 12.5 19.429 26.7 0.194 23.3 62.5 20.8
Chenopodium ~ 1 1.8 0.143 0.2 0.001 0.1 2.1 0.7
Digitaria sanguina1is 3 5.4 3.571 4.9 0.023 2.8 13.1 4 .l~
Eriochloa contracta 4 7.1 2.000 2.7 0.015 1.8 11.6 3.9
• Festuca e1atior- 4 7.1 3.143 4.4 0.122 14.6 26.1 8.7
Lo1ium multif10rum- 1 1.8 0.429 0.6 0.004 0.5 2.9 1.0
Medicago sativa 6 10.7 1.429 2.0 0.073 8.8 21.5 7.2
Poa pratensis 1 1.8 0.714 1.0 0.005 0.6 3.4 1.1
Polygonum convolvulus 1 1.8 0.143 0.2 0.002 0.2 2.2 0.7
Setaria faberii - 6 10.7 4.571 6.3 0.048 5.8 22.8 7.6
Setaria 1utescens 5 8.9 9.000 12.4 0.098 11.8 33.1 H.O
Setaria viridis 1 1.8 0.429 0.6 0.003 0.4 2.8 0.9
~ spinosa 1 1.8 0.143 0.2 0.001 0.1 2.1 0.7
of: .....

Table XIII. (continued)
ReI. ReI. ReI. Area Area Importance Importance
Species Freq. Freq.__ Den. Den. Occupied Occupied Value Percentage
Sorghum ~.~ 3 5.4 0.714 1.0 0.014 1.7 8.1 2.7
Trifolium ~epen5 7 12.5 20.286 27.8 0.183 22.0 62.3 20.8
l='
""
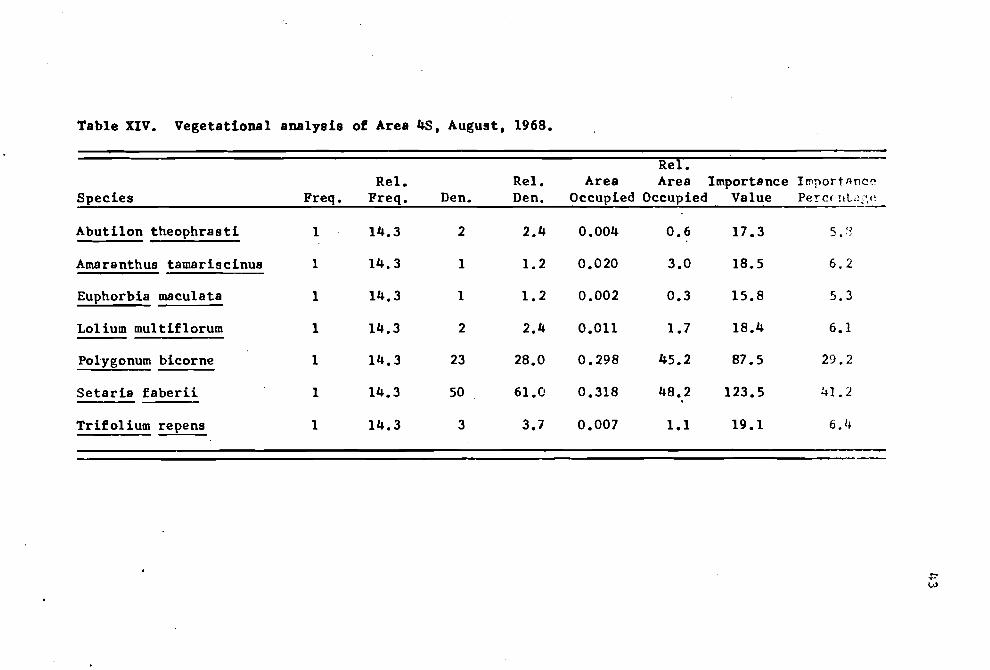
Table XIV. Vegetational analysis of Area 4S, August, 1968.
Ret. ReI. ReI. Area Area Importance I~portRnc~
Species Freq. Freq. Den. Den. Occupied Occupied Value Pe!"Cl'!t t d S', t~
Abuti10n theophrasti 1 14.3 2 2.4 0.004 0.6 17 .3 <; q - .. 'j
Amaranthus- tamariscinus 1 14.3 1 1.2 0.020 3.0 18.5 6 ')... Euphorbia macu1ata 1 14.3 1 1.2 0.002 0.3 15.8 5.3
Lo1ium mu1tif1orum 1 14.3 2 2.4 0.011 1.7 18.4 6.1
Polygonum bicorne 1 14.3 23 28.0 0.298 45.2 87.5 29.2
Setaria faberii 1 14.3 50 61.0 0.318 48.2. 123.5 41.2
Trifolium repens 1 14.3 3 3.7 0.007 1.1 19.1 6. L.
p w

--
Table XV. Vegetational analysis of Area 4, October, 1968.
Re1. Re1. Re1. Area Area Importance Importance
Species Preq. Freq. Den. Den. Occupied Occupied Value Percentage
Amaranthus tamariscinus 5 10.9 3.000 7.3 0.037 ! 8.9 ,27.1 9.0
Bromus ine rmis 5 10.9 4.857 11.8 0.043 10.4 33.1 11.0
Digitaria sanguina1is 2 4.3 2.000 4.9 0.017 4.1 13.3 4.4
Erioch1oa contracts 4 8.7 3.429 8.4 0.024 5.8 22.9 7.6
Festuca e1atior 4 8.7 1.143 2.8 0.022 5.3 16.8 5.6
Medicago sativa 4 8.7 1.000 2.4 0.016 3.9 15.0 5.0
Setaria faberii 6 13.0 6.429 15.7 0.113 27.3 56.0 18.7
Setaria 1utescens 5 10.9 6.143 15.0 0.073 17.7 43.6 14.5-Setaria viridis 1 2.2 0.714 1.7 0.005 1.2 5.1 1.7
Sorghum ha1epense 3 6.5 0.714 1.7 0.009 2.2 10.4 3.5
Trifolium repens 7 15.2 11.571 28.2 0.055 13.3 56.7 18.9
~

Table XVI. Vegetational analysis of Area 48, October. 1968.
ReI. ReI. ReI. Area Area Importance Importance
Species Freq. Freq. Den. Den. Occupied Occupied Value Percentage
Abutilon theophrasti 1 20.0 3 4.3 0.013 2.0 26.3 8.8 •
Amaranthus tamariacinus - 1 20.0 1 1.4 0.017 2.6 24.0 8.0
Euphorbia maculata 1 20.0 1 1.4 0.003 0.5 21.9 7.3
Polygonum bicorne 1 20.0 25 35.7 0.320 49.5 105.2 35.1
Setaria faberii 1 20.0 40 57.1 0.294 45.4 122.5 40.8
~ V1
•

Table XVII. Vegetational analysis of Area 5, October, 1967. Species list determined from identification of plaht remains.
Species Species
Abutilon theophrasti
Amaranthus tamariscinus
Ambrosia trifida
Bromus japonicus
C~enopodium~
Chloris verticil lata
Cirsium sp.
ConvolVUlus arvensis
Cyperus esculentus
Echinochloa crusgalli
Eleusine indica
Eri~eron canadensis
Gutierrezia dracunculoidea
Helianthus annuus
Hibiscus trionum
Kochia scoparia
Lespedeza striata
Panicum capillare
Polygonum aviculare
Polygonum bicorne
Rumex crispus
Setaria viridis
~ spinosa
Solanum rostratum
Sorghu~ vulgare
T~r8xacum officinale
Xan~hillm sp.
~ 0\
•

Table XVIII. Vegetational analysis of Area 5, June, 1968.
Ret. ReI. ReI. Area Area Importance Importance
Species Freq. Freq. Den. Den. Occupied Occupied Value Percentage
Ambrosia trifida 2 5.6 0.500 0.2 0.007 0.7 6.5 2.2
Bromus japonicus 4 11.1 218.250 81.7 0.447 46.0 138.8 46.3
Carex sp. 2 5.6 10.750 4.0 0.023 2.4 12.0 4.0
Convolvulus arvensls 3 8.3 3.750 1.4 0.066 6.8 16.5 5.5
Echinochloa crusga11i 1 2.8 17.750 6.6 0.048 4.9 14.3 4.8
Erigeron annuus 1 2.8 1.250 0.5 0.082 8.4 11.7 3.9
Erigeron canadensis 2 5.6 2.000 0.7 0.018 1.9 8.2 2.7
Gaura biennis- 1 2.8 0.250 0.1 0.019 2.0 4.9 1.6
HeU.anthus annuus 1 2.8 0.250 0.1 0.011 1.1 4.0 1.3
Hordeum pusillum 1 2.8 0.250 0.1 T* T 2.9 1.0
Lactuca scario1a 4 11.1 4.750 1.8 0.114 11.7 24.6 8.2
Medicago 1upu11na 1 2.8 0.250 0.1 0.002 0.2 3.1 1.0
Oxa1is stricta- 1 2.8 0.250 0.1 0.003 0.3 3.2 1.1
Po1yg~ bicorne 2 5.6 1.500 0.6 0.013 1.3 7.5 2.5
Physalis virginiana 1 2.8 0.500 0.2 0.016 1.6 4.6 1.5 ,J:'
"
•

Table XVIII. (continued)
- ReI. ReI. ReI. Area Area Importance Importance
Species Freq. Freq. Den. Den. Occupied Occupied Value Percentnlt:..
Rumex crispus 3 8.3 1. SOO 0.6 0.031 3.2 12.1 4.0
Taraxacum officina1e 4 11.1 2.500 0.9 0.050 5.1 17.1 5.7
Trifolium repens 1 2.8 0.750 0.3 0.007 0.7 3.8 1.3
Ulmus rubra 1 2.8 0.250 0.1 0.015 1.5 4.4 1.5
*T - trace, area occupied less than 0.001 of the entire area of all the quadrats.
~ 0:>
• ~

Table XIX. Vegetational analysis of Area 5, August, 1968.
ReI. ReI. ReI. Area Area Importance Impoltance
Species Freq. Freq. Den. Den. Occupied Occupied Value Perce:t1t"J:L
Abuti10n theophrasti 1 1.8 2.167 1.7 0.003 0.4 3.9 1.3
Amaranthus tamariscinus 1 1.8 0.333 0.3 0.001 0.1 2.2 0.7
Ambrosia trifida 3 5.5 1.333 1.1 0.065 8.4 15.0 5.0
Chenopodium album 2 3.6 0.333 0.3 0.002 0.2 4.1 }.LI
Chloris vertici11ata 1 1.8 0.050 0.4 0.008 1.0 3.2 1.1
• Convolvulus arvensis 2 3.6 7.000 5.5 0.146 18.9 28.0 9.3
Cyperus escu1entus 3 5.5 7.487 5.9 0.069 8.9 20.3 6.8
Digitaria sanguina1is 1 1.8 1.333 1.1 0.007 0.9 3.8 1.3
Echinoch1oe crusga11i 2 3.6 3.167 2.5 0.040 5.2 11.3 3.8
Erigeron canadensis 1 1.8 1.667 1.3 0.001 0.1 3.2 1.1
Erioch1oa contracta 2 3.6 0.667 0.5 0.003 0.4 4.5 1.5
Gaure- biennis 1 1.8 0.333 0.3 0.022 2.9 5.0 1.7
Kochia scopa~ 2 3.6 3.500 2.8 0.039 5.1 11.5 3.8
Lactuca scariola 1 1.8 0.333 0.3 0.010 1.3 3.4 1.1
Lespedeza striata 2 3.6 0.833 0.7 0.008 1.0 5.3 1.8 ~ \0
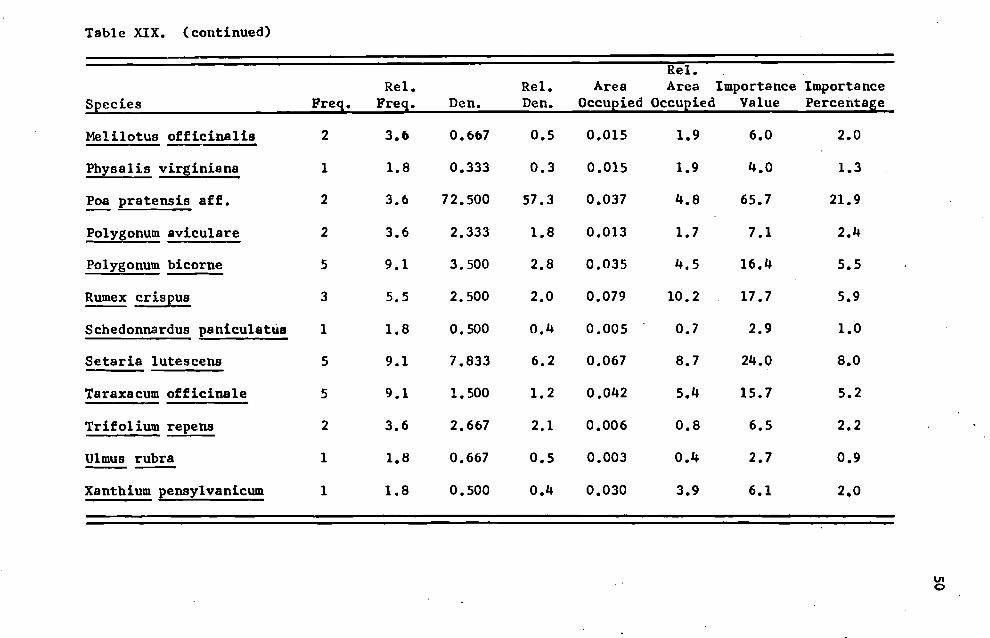
Table XIX. (continued)
Rel. ReI. ReI. Area Area Importance Importance
Species Freq. Freq. Den. Den. Occupied Occupied Value Percentage
Meli10tus officina1is 2 3.6 0.667 0.5 0.015 1.9 6.0 2.0
Physalis virginiana 1 1.8 0.333 0.3 0.015 1.9 4.0 1.3
Poa pratensis aff. 2 3.6 72.500 57.3 0.037 4.8 65.7 21.9
Po1ygonum aviculare 2 3.6 2.333 1.8 0.013 1.7 7.1 2.4
Po1ygonum bicorne 5 9.1 3.500 2.8 0.035 4.5 16.4 5.5
Rumex crispus 3 5.5 2.500 2.0 0.079 10.2 17.7 5.9
Schedonnardus panicu1atu8 1 1.8 o. SOo 0.4 0.005 0.7 2.9 1.0
Setaria 1utescens 5 9.1 7.833 6.2 0.067 8.7 24.0 8.0
Taraxacum officina1e 5 9.1 1.500 1.2 0.042 5.4 15.7 5.2
Trifolium repens 2 3.6 2.667 2.1 0.006 0.8 6.5 2.2
Ulmus rubra 1 1.8 0.667 0.5 0.003 0.4 2.7 0.9
Xanthium pensy1vanicum 1 1.8 0.500 0.4 0.030 3.9 6.1 2.0
o VI

Table XX. Vegetational analysis of Area 5, October, 1968.
ReI. ReI. ReI. Area Area Importance Importance
Species Freq. Freq. Den. Den. Occupied Occupied Value Percentage
Amaranthus tarr~riscinus- 3 6.0 1.000 0.4 0.025 4.3 10.7 3.6
Aristida oligantha 1 2.0 1.333 0.5 0.018 3.1 5.6 1.9
Chloris verticillata- 1 2.0 0.167 0.1 0.003 0.5 2.6 0.9
Convolvulus--- arvensis 5 10.0 16.333 6.5 0.107 18.5 35.0 11.7
Digita~~_ ~~guinali~ 2 4.0 2.167 0.9 0.007 1.2 6.1 2.0
Ec~ochloa crusga1li 4 8.0 1.667 0.7 0.019 3.3 12.0 4.0
Eriochloa- contracts'"'--_._._- 3 6.0 3.167 1.3 0.008 1.4 8.7 2.9
Festuca elatior- 1 2.0 0.167 0.1 0.002 0.3 2.4 0.8
Kochia scoparia 1 2.0 0.167 0.1 0.002 0.3 2.4 0.8
~ ~ratensis aff. 5 10.0 179.667 71.1 0.109 18.9 100.0 33.3
PolygonuQ aviculare 1 2.0 0.333 0.1 T* T 2.1 0.7
Po1ygonu~ bicorne 5 10.0 5.167 2.1 0.065 11.2 23.3 7.8
Rume~ crispus 4 8.0 2.167 0.9 0.083 14.4 23.3 7.8
Sched~~~~ panicu1atus 1 2.0 0.500 0.2 0.005 0.9 3.1 1.0
Setaria lutescens 5 10.0 30.367 12.2 0.071 12.3 34.5 11.5 VI ....

Table XX. (continued)
ReI. ReI. Rei. Area Area Importance Importance
Species Freq. Freq. Den. Den. Occupied Occupied Value Percentage
Setaria viridis 1 2.0 1.667 0.7 0.002 0.3 3.0 1.0
Taraxacum officinale 4 8.0 3.167 1.3 0.050 8.7 18.0 6.0
Trifolium re~ 1 2.0 0.167 0.1 T T 2.1 0.7
Ulmus rubra 1 2.0 0.167 0.1 0.001 0.2 2.3 0.8
Xanthiu~ pensylvanicum 1 2.0 0.167 0.1 0.001 0.2 2.3 0.8
*T - trace, area occupied less than 0.001 of the entire area of all the quadrats.
N VI

Table XXI. Vegetational analysis of Area 6, October, 1967. Species list determined from identification of plant remains.
Species Species
Amaranthus tamariscinus Gaura biennis
Ambrosia artemisiifolia Hibiscus trionum
Ambrosia trifida Lespedeza striata
Aristida oligantha Panicum capillare
Digitaria senguinalis Eolyg~ bicorne
Echinochloa crusgalli Setaria lutescens
Eragrostis pectinacea Setaria viridis
Euphorbia dentata Solanum rostratum
Euphorbia maculata / Ulmus rubra-
W VI

Table XXII. Vegetational analysis of Area 6, June, 1968.
Rel. ReI. ReI. Area Area Importance Importance
Species Freq. Freq. Den. Den. Occupled Occupied Value Percentage
Ambrosia psi10stachya 5 6.1 8.250 3.9 0.039 5.6 15.6 5.2
Ambrosia trifida 7 8.5 4.625 2.2 0.038 5.5 16.2 5.4
BroolUS japonicus 1 1.2 0.125 0.1 T* T 1.3 0.4
Chloris verticil lata 1 1.2 1.625 0.8 0.007 1.0 3.0 1.0
Convolvulus arvensis 1 1.2 0.500 0.2 0.003 0.4 1.8 0.6
Cx~erus fi1icu1mis 1 1.2 0.125 0.1 T T 1.3 0.4
Euphorbia macu1ata 5 6.1 1.875 0.9 0.002 0.3 7.3 2.4
Re1ianthus annuus- 5 6.1 9.125 4.3 0.045 6.5 16.9 5.6
Hibiscus trionum 7 8.5 3.500 1.7 0.012 1.7 11.9 4.0
Lactuca scario1a 1 1.2 0.125 0.1 0.001 0.1 1.4 0.5 /
Lespedeza striata 8 9.8 34.000 16.0 0.172 24.7 50.5 16.8
Medicago 1upu1i~a 7 8.5 8.375 4.0 0.052 7.5 20.0 6.7
Oxa1is stricta 1 1.2 0.250 0.1 T T 1.3 0.4
Physalis virginians 1 1.2 0.125 0.1 T T 1.3 0.4
Po1ygonum convolvulus 1 1.2 0.125 0.1 0.001 0.1 1.4 0.5 VI ,f:

Table XXII. ( continued)
Ret. ReI. ReI. Area Area Importance Importance
Species Frcq. Freq. Den. Den. Occupied Occupied Value Percentage
Polygonum bicorne 5 6.1 3.875 1.8 0.003 0.4 8.3 2.8
Rhus radicans 1 1.2 0.125 0.1 0.002 0.3 1.6 0.5
Setaria lutescens - 8 9.8 50.250 23.7 0.151 21.7 55.2 18.4
Sporobolus vaginif10rus 8 9.8 76.125 35.9 0.163 23.4 69.1 23.0
Ulmus rubra 8 9.8 8.875 4.2 0.006 0.9 14.9 5.0
*T - trace, area occupied less than 0.001 of the entire area of all the quadrsts.
VI. VI
--
---
---
1';.d1l ~~ ':C, II I. Vegetational analysis of Area
---_._.....-..- -~-----.'--,_.~-
ReI. <,' i ':. C l{~~; Freq. Freq.
~_· , , , ..__ __.___ ...... 4_._ ---
6, August, 1968.
ReI. Den. Den.
Rel. Area Area Importance Import"nce
Occupi~d Occupied Value Percer,t.'C,,;c
, !_~;.::.~~. \::, U.?s tachya Ll· 5.1 5.375 5.2 0.065 7.7 18.0 6.0
i'I(":1" ,--...- ...._- trifida 4 5.1 3.125 3.0 0.075 8.9 17.0 5.7
r::1orL v,>rt icillata _...... '..,-- --->,.- 2 2.6 0.625 0.6 0.004 0.5 3.7 1.2
Convolvulu~ ____ •. _ .ow _. _< •••••«.......
2rvensis __, 1 1.3 0.500 0.5 0.003 0.4 2.2 0.7
:.r: :~r\):;tis,--- ~---~- intermedia 2 2.6 0.250 0.2 0.014 1.7 4.5 1.5
" ) Dcl',] 0;:, ' .... ·..........·_·_"W
contracta ___•
4 5.1 6.000 5.9 0.031 3.7 14.7 4.9
i : ,,::ol·hi.Cl ._- .--"'---~~
dcntata -~-
3 3.9 0.625 0.6 0.004 0.5 5.0 1.7
\I"'or.!·i 3 .'-"-~'._~
wlculata_.---- 5 6.4 I 1.875 1.8 0.011 1.3 9.5 3.2
'1, ~ L!!1lI.U5 ....._... annuus_- 2 2.6 2.875 2.8 0.016 ' .1.._a 7.3 2.4
j 'il ;;cu~ trionum ~"- _.....,. - .. _-----.. 7 9.0 3.750 3.7 0.019 2.3 15.0 5.0
L,ctuc·":--,.- ~---._-sC;Jriola---_._- 1 1.3 0.125 0.1 0.002 0.2 1.6 0.5
;nl'\~"?" ~ .. ,.".,._~---._"
striata ---_ ...~-- - 8 10.3 21.875 21.3 0.216 25.7 57.3 19.1
~'!~]iC8f';~ sa~ 3 3.9 0.375 0.4 0.006 0.7 5.0 1.7
',.1 ilotllS ......... ------ .... officinalis--_. 1 1.3 3.500 4.1 0.038 4.5 9.9 3.3
.f...:.1 ~r,~::r~J~ bicorne 3 3.9 1.250 1.2 0.006 0.7 5.8 1.9 VI 0>

Table:' \l! j • (continued)
SpE'C~'.~_._.. __ Freq. Re1.
Freq. Den. Re1. Den.
Re1. Area Area Importance Import;1nce
Occupied Occupied Value Percf'!~....:ge
Setari,. Juj,.i>cens 8 10.3 28.000 27.3 0.212 25.2 62.8 20.9
Setadi! \,!;'j,!is--_._,.,-... - 6 7.7 6.125 6.0 0.028 3.3 17.0 5.7
Solid;;·('o ,.,1 r1'3sima ~,,- .... , -~._--
1 1.3 0.500 0.5 0.005 0.6 2.4 0.8
Solida!', ":.,oudenais --'-~.- ~ ~._.-
1 1.3 1.375 1.3 0.010 1.2 3.8 1.3
SP.?rob(~.~·, 'i;l~'inifloru8 8 10.3 13.500 13.2 0.062 7.4 30.9 10.3
UIn'us __••.__..._"
rllbrD .... ~ ~R
3 3.9 0.750 0.7 0.013 1.5 6.1 2.0
~~~lm !).y~ylvanicum 1 1.3 0.125 0.1 0.001 0.1 1.5 0.5
._----_ .. -.....-.--. _.- _.,
V1
"
~


--
Table XXIV. ( continued)
ReI. ReI. ReI. Area Area lmportance Importance
Species Freq. Freq. Den. Den. Occupied Occupied Value Percentage
Po1ygonum avicu1are 1 1.4 0.125 0.1 T T 1.5 0.5
Po1ygonum bicorne 1 1.4 0.125 0.1 0.002 0.4 1.9 0.6
Setaria 1utescens 8 11.1 30.000 23.1 0.184 34.2 68.4 22.8-Setaria viridis 6 8.3 5.250 4.0 0.007 1.3 13.6 4.5
Sida spinosa 1 1.4 0.375 0.3 T T 1.7 0.6
Sporobo1us vaginif1oru8 6 8.3 22.125 17.0 0.078 14.5 39.8 13.3
Trifolium repens 1 1.4 1.500 1.2 0.010 1.9 4.5 1.5
Ulmus rubra 1 1.4 0.125 0.1 T T 1.5 0.5
*T - trace, ares occupied less than 0.001 of the entire area of all the quadrats.
\Q VI

Table XXV. Inorganic chemical properties of the soil from Area 1.
Exchangeable Organic cotions Total 'rota 1
Date and soil profile level pH
carbon % Me
ppm Ca .
N %
P ppm
October, 1967 0-6" 6.8 1. 50 900 6300 0.204 * 6-12" 6.7 1.56 1080 8100 0.185 9.58
*. - test results ind Lcete concentrations above 10.00 ppm; test is not accurate for concentrationg above 10.00 ppm.
0\ o

Table XXVI. Inorganic chemical properties of the soil from Area 2.
Date and soU profile level pH
Organic carbon
%
Exchangeable cations
ppm Mg Ca
Total N %
Total P
ppm
October, 1967 0-6" 6.4 0.99 920 5000 0.146 4.00
6-12" 6.4 0.96 1260 5400 0.132 3.28
June, 1968 0-6" 6.6 0.90 800 6600 0.159 5.85
6-12" 6.2 i 0.87 1400 7400 0.140 i~.40
August, 1968 0-6" . 7.0 1.02 1040 6200 0.146 3.61
6-12" 7.0 0.75 1260 6600 0.133 3.40
October, 1968 0-6" 6.7 1.14 810 4800 0.142 4.24
6-12" 6.5 0.96 1030 5600 0.128 3.40
0I-'
r,.

Table XXVII. Inorganic chemical properties of the soil from Area 3.
Date and soil profile level pH
Organic carbon
%
.l!.:xchangeable cations
ppm Mg Ca
Total N %
Total P
ppm
October, 1967
0-6" 7.3 1.26 880 6200 o.14l~ 5.20
6-12" 7.3 1.14 880 5900 0.089 5.46
.June, 1968 0-6"
6-12"
7.2
7.5
\
1.20
O. 9l~
1000
620
5300
8200
0.134
0.087
3.75
5.85
August, 1968 0-6" 7.7 1.05 700 5600 0.132 5.28
6-12" 8.3 0.98 800 7200 0.072 5.63
October, 1968 0-6" 7.7 1.17 960 7000 0.139 5.63
6-12" 7.8 1.02 750 8000 0.086 5.39
N 01

--Table XXVIII. Inorg~nic chemical properties of the soil from Area 4.
'Exchan/?;eable Organic cations Total Total
Date and soil carbon ppm N P 01prof ile level pH /0 Mg Ca % ppm
October, 1967 0-6" 7.3 1.02 720 5400 0.123 6.52
6-12" 7.3 0.87 890 5300 0.109 5.85
June t 1968 0-6" 7.6 1.02 720 5600 0.134 7.18
6-12" 7.5 \ 0.93 8L~0 6300 O.llS 7.18
August, 1968 0-6" 7.S 1.23 850 6800 0.122 5.63
6-12" 7.6 0.84 790 6400 0.111 5.63
October, 1968 0-6" 7.7 1.29 830 6300 0.126 7.28
6-12" 7.7 0.93 880 6700 0.106 6.18
0U)
...

Table XXIX. Inorganic chemical properties of the soil from Area 4S.
Exchangeable Organic cations Total Total
Date and BOU carbon ppm N P profile level pH % Mg Ca % ppm
June, 1968 0-6" 7.7 0.87 780 6200 0.122 7.28
6-12" 7.7 0.66 750 7100 0.109 7.40
August, 1968 0-6" 7.6 0.66 990 7200 0.131 .. 7.15
6-12" 7.7 0.87 730 5100 0.108 6.73
October, 1968 0-6" 7.6 1.14 830 5600 0.120 7.00
6-12" 7.8 0.78 780 5700 0.108 6.38
0.::
~

Table XXX. Inorganic chemical properties of the soil from Ares 5.
ECIiangeable Organic cations Total Total
Date and soil carbon ppm N P profile level pH % Mg Ca % ppm
October. 1967 0-6" 7.8 2.01 630 4400 0.167 * 6-12" 7.4 1.65 790 5000 0.169 *
June, 1968 0-6" 7.9 0.72 750 5200 0.179 8.00
6-12" 7.6, 1.41 550 3600 0.183 8.00
August, 1968 0-6" 8.2 0.69 600 4500 0.180 * 6-12" 7.7 1.14 550 3200 0.182 *
October, 1968 0-6" 8.2 1.23 720 5300 0.188 9.00
6-12" 7.7 1.17 580 3700 0.174 *
* - test results indicate concentrations above 10.00 ppm; test is not accurate for concentrations above 10.00 ppm.
0\}1

Tablid XXXI. Inorganic chemical properties of the soil from Area 6.
Date and soU profile level pH
Organic carbon
%
Exchangeable cations
ppm Mg ea
Total N %
Total P
ppm
October, 1967 0-6" 7.3 0.99 740 4000 0.134 3.20
6-12" 7.5 0.75 840 4500 0.123 3.33
•
June, 1968 0-6"
6-12"
7.4
6.9
0.69
1.02
1240
1180
6800
5400
0.136
0.122
3.40
3.90
August, 1968 0-6" 7.0 0.78 1290 6300 0.128 3.52
6-12" 6.7 0.96 1440 6100 0.119 3.30
October, 1968 0-6" 7.8 0.75 990 5000 0.128 3.20
6-12" 7.5 0.84 1220 6100 0.124 3.90
0\ 0\
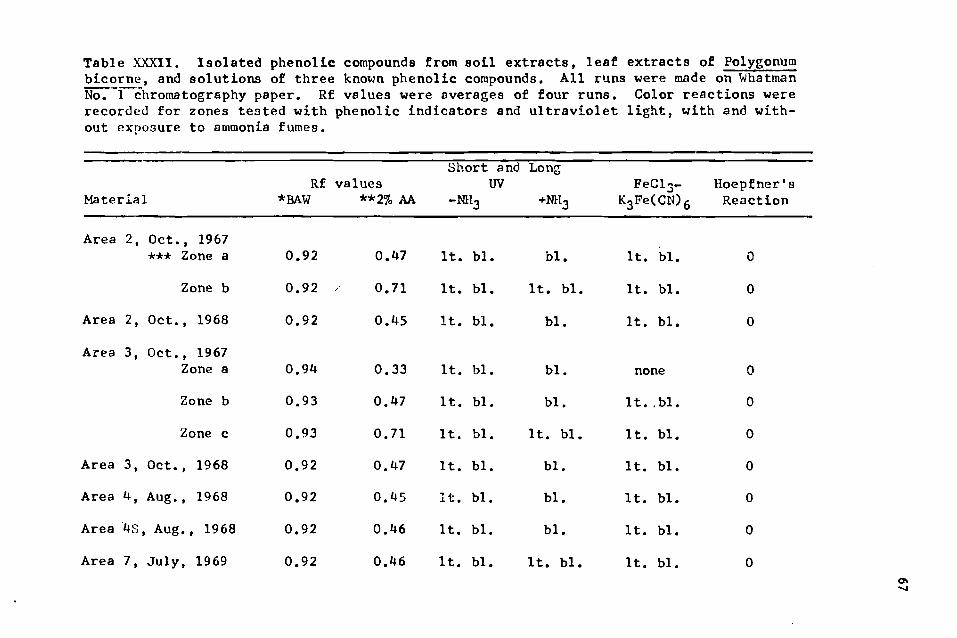
Table XXXII. Isolated phenolic compounds from soil extracts, leaf extracts of Polygonum bicorne, and solutions of three known phenolic compounds. All runs ~ere made on ~hatman
No. -r-chromatography paper. Rf values ~ere Dverages of four runs. Color reactions ~ere recorded for zones tested ~ith phenolic indicators and ultraviolet light, with and ~ithout exposure to ammonia fumes.
Short and Long Rf values UV FeC13 Hoepfner I S
Material *BAW **2% AA -NH3 +NH3 K3Fe(CN)6 Reaction
Area 2, Oct., 1967 *** Zone a 0.92 0.47 1t. bI. bi. 1t. bI. o
Zone b 0.92 0.71 1t. bi. It. bi. It. bI. o
Area 2, Oct., 1968 0.92 0.45 It. bI. bi. It. bi. o
Area 3, Oct., 1967 Zone a 0.94 0.33 1t. bi. bi. none o
Zone b 0.93 0.47 1t. bi. bi. It.. bI. o
Zone c 0.93 0.71 1 t. hI. It. bi. It. bi. o
Area 3, Oct., 1968 0.92 0.47 1t. bi. bI. 1t. bi. o
Area 4, Aug., 1968 0.92 0.45 1t. bi. bi. 1t. bI. o
Area 4S, Aug., 1968 0.92 0.46 It. bI. bi. 1t. bI. o
Area 7, July, 1969 0.92 0.46 1t. bi. 1t. bi. It. bI. o 0.......

Table XXXII. ( continued)
Short and Long
Material Rf values
*BAW **2% AA -NH 3
UV +NH 3
FeCl 3 -K3Fe(CN)6
Hoepfner's Reaction
Polygonum bicorne - -Zone a 0.36 0.33 pk. yeI. bI. 0
Zone b 0.93 0.45 It. bl. b!. bI. 0
Zone c 0.91 0.72 It. bI. DEG bI. +
Chloro~cnic acid 0.55 0.62 bI. DEG dk. bl. + 0.76
Caffeic acid 0.79 0.00 bl. bl. ok. bI. 0 0.38
Quinic acid none none none 0
* BAW, n-butanol-acetic acid-water (63-10-27 v/v). ** 2% AA. aqueous acetic acid.
*** Zone a. if several 20nes were found on a chromatogram. they were randomly desIgnated as zones a. b. or c.
Colors - It., light; dk., dark; bl., blue; pk•• pink; yel., yellow; DEG, duck-egg green.
0\ 00

69
100
Area 4S
Control Area 4
90
80
70
~ 0 'rI ~ 60co ~
-.-1 S '"' tI 'o!l 50 ~ c CII tJ
40 CII '"' Po.
30
20
10
24 48 72 96 120 144 168
Time (hours)
Fi~ure 1. r.~t8rdation of t~e ~er~indticn rat~ of tOT3to s€~d~ by solutions pr~pared fro~ phrnolic co~pounds eluted fron chrom2tO[rG~3 of soil extracts prepared from soils collo:ct"d durin::; AU2;U.<;t, 1968, from U,e 0-6" soil profile level of Areas 4 and 48.
$

Table XXXIII. Mean root-shoot length + standard error of tomato seedlings ~fter germination and-growth for 168 hr in a control solution and solutions prepared from the phenolic compounds eluted from chromatograms of. soils collect~d
during August, 1968, from the 0-6" soil profile level of study Areas 4 and 4S.
Source of Mean length of root-shoot (cm) Solution ± standard error,-------------=--:-._------Area 4 2.6 + 0.15 *
Area 4S 3.9 + 0.27 **
Control 4.8 + 0.26
* t-value for this test when compared to the control and to Area 4S indicated a significant diffe~ence at or below the 1% level.
** t-value for this test when compared to the control indicated a significant difference at or belmJ the 5% level.
"-J o


LITERATURE CITED
Adams, R. 1968. The characterization, isohtion, and idlJntification of inhibitory c:ompounds from Polygonum longistylum Small. Graduate research paper (Unpublished), KanS8S staie-Teachers College, Emporia.
Allison, F. E. 1957. Nitrogen and soil fertility. p. 85-94. In U. S. Department of Agriculture. Soil, the yearbook of agriCulture. U. S. Govt. Printing Office, Washington. 784 p.
Bailey, E. 1944. Hydrogen ion concentrations of the important soils of the United States in relation to other profile characteristics I. Pedocal soils. Soil Sci. 57(6):443-474.
Benedict, R. M. 1941. Inhibitory effect of dead roots on the growth of b~om€gress. Agron. J. 33:1108-1109.
Bennet, E. L. and J. Bonner. 1953. Isolation of plant growth irulibitors from Thamnosa montana. Amer. J. Bot. 40:29-33.
Biawe11, O. W. 1956. Major soils of Kansas. Kansas Agr. Exp. Sta. Circ. 336. Manhattan.
Billin~s, W. D. 1941. Quantitative" correlations between vegetational changes and soil development. Ecology 22(4):448-456.
Billings, W. D. 1950. Vegetation and plant growth as affected by chemically alt €red rocks in the Western Great Basin. Ecology 31:62-74.
Black, C. A. 1957. Soil-plant relationships. John Wiley and Sons, Inc., New York. 332 p.
Bonner, J. ~nd A. W. Galston. 1944. Toxic substances from the culture ~edia of guayule which may inhibit growth. Bot. Gaz. 106:185-198.
Caine, S. A. 1938. The species-area curve. Amer. MidI. Natur. 17:5735Sl.
Clements, F. E. 1928. Plant succession and in~icators. R. W. Wilson Co., New York. 453 p.
Cox, L. D., H. M. Munzer, and E. A. Smith. 1945. A germination ir~ibitor in the seed coats of certain varieties of cabbage. Pla~t Physiol. 20:289-294.
Curtis, J. T. and G. Cottam. 1950. Antibiotic and antitoxic effects in prairie sunflo~er. Bull. Torrey Bot. Club 77:187-191.

73
Funke, G. L. 1943. The influence of Artemisia absinthium on neighboring plants. Blumea 5:281-293. =
Gray, R. and J. Bonner. 19LIO. An inhibitor of plant. growth from the leaves of Encelia farinosa. Amer. J. Bot. 35:52-57.
Hemberg, T. 1961. Biogenous inhibitors. Encycl. Plant Physiol. 14: 1162-1183.
Jackson, M. L. 1958. Soil chemical analysis. Prentice-Hall, Inc., Englewood Cliffs, N. J. 498 p.
Konis, E. 1947. On germination inhibitors VI. The inhibitory action of leaf-sDps on germination and growth. Pal. J. Bot., J. Series 4:77-84.
Kor~~aus, D. W. 1965. Vegetation and soil relationships in a native tall grass prairie invaded by Rhus glabra L. in east central Kansas. Graduate research paper-tUnpub1{shed) , Kansas State Teachers College, Emporia.
MaY~l', A. H. and H. Evenari. 1952. The relation betHcen the structure of coumarin and its derivatives, and their activity as germination inhibitors. J. Exp. Bot. 3:246-262.
Neill, R. I.. 1967. The possible inhibitor,' effects of Polygonum lapathifolium L., P. longistylun S,aall, and P. pennsylvanicum L. Graduate research paper (Unpublished), Kansas State Teac~ College, Emporis.
Oosting, H. J. 1956. The study of plant communities. W. H. Freeoan and Company, San Francisco. 440 p.
Paulus, D. 1968. Inhibitional effects of Folygonu~ 10ngistylun Small on P. longistylum. Graduate research paper (Unpublished), Kansas State Teachers Col13ge, Emporia.
Perkins, A. T. and W. F. Schrenk. 1948. The analysis ano characterization of selected Kansas soils. Trans. Kansas Acad. Sci. Sl( 2) :215-223.
Peterson, E. B. 1965. Inhibition of black spruce primary roots by a water solUble substance in Kalmia angu5tifolia. Forest Sci. 11(4) :473-480. ---- ------
Piper, C. S. 1942. Soil 3 nc pIa nt a na 1y sis. Int~rsciencp Publishers, Inc., N2v~ York. 368 p.
Rice, E. L. lS6!t. Inhibition of nitro~en-fixin~ and nitrifying bacteria by seed plants (1.). Ecology 45(4):824-837.

74
Rice, E. L. 1965a. Inhibition of nitrogen-fixing and nitrifyin3 bacteria by seed plants IV. The irl!"lihi tors produced by Ambros ia elatior Clnd A. PSilost8chya. Soutbwest. N8tur. lO(4):24~r.=-g5:"-
Rice, E. L. 1965b. Inhibition of nitrogen-fixing Bnd nitrifying bacteria by seed plants II. Characterization and i~entification
of inhibitors. Physi01. P13nt. 18:255-268.
Ric~, E. 1,. and R. Parenti. 1967. Inhibition of nitrogen-fixing and nitrifying bacteria by seed plants V. Inhibitors produced by Bromus jap~nicus Thunb. Southwest. Natur. 12(1):97-103.
Roberts, E. A. R. ~nd D. J. Wood. 1951. The polyphenols and amino acids of tobacco leaf. Arch. Biochem. and Biophys. 33:299-303.
Schaal, L. A. and G. Johnson. 1955. The inhibitory effect of phtnolic compounds on Ule growth of Streptomyces scabies as related to scab r.esistance. Phytopathol. -45:626-628.
Schreiner, O. and R. S. I~eed. 1907. Certain organic constituents of soil in relation to soil fertility. U. S. Dep. of Agr., Bur. of Soils Bull. 47.
Sevell, M. C. and W. L. Latshaw. 1925. A soil study in Scott County, Kansas. Trans. Kansas Acad. Sci. 31:81-86.
Smith, I. 1960. Chromatographic and electrophoretic techniques. Interscience Publishers, Inc., New York. 617 p.
Steyerklark, J. 1964. Flora of Missouri. Io,,:a State Uni.versity Press, Ames, 10\-]<). 1725 p.
Went, F. W. 1948. Ecology of desert plants I. Obse,vations on the germination in the Joshua Tree National Forest, California. Ecology 29:242-253.
Wilde, S. A., S. F. Burnan, and R. M. Galloway. 1937. Nutrient content and base exchange properties of the organic layers of forest soils in the Lake States region. Soil Sci. 44:231-238.

XIGN8ddV

PROCEDURE FOR DETER~.!I NI NG E,'{l.llAI,X}EABLE CALCIUN Am> MlI.Gl'lliSIUl-11
Atotni~ ~bsorption Metho~
!. Reagents
A. Extracting Solution: Neutral Normal A~,onium Acetate Add 1400 ml of ammonium hydroxide to about 10 liters of distilled water. Then add 1160 ml of glacial acetic acid. Shake vigorously. Dilute to 20 liters ~ith
redistilled water. Adjust to pH of 7.0 using ammonium hydroxide or acetic acid.
B. Stand~rd Calcium Solution Use certified 1000 PPOl standard or dissolve 1.00 grams of pure CaC03 in sufficient amount of concentrated redistilled Hel and dilute with redistilled water to one liter. This solution contains 400 ppm calcium. Prepare other standards as follows:
Standard Soil ml of 400 ppm Dilute to ppm Ca ppm Ca required Final Volume
--r- 500- 0.5 200 2 1000 1 200 4 2000 2 200 8 4000 4 200
10 5000 5 200 20 10000 10 200
c. Standard Magnesium Solution Use certified magnesium standard or dissolve 1.0 grams of pure magnesium metal in a sufficient amount of concentrated redistilled hydrochloric acid and dilute to one liter. This will give 1000 ppm magnesium. Dilute 100 ml of this to 1000 rol to obtain a 100 ppm magnesium standard. Again dilute 100 ml of this to 1000 ml for a 10 ppm standard and use this 10 ppm standard to prepare the following:
Standard Soil ml of 10 ppm Dilute to ppm Mg ppm Mg required Final Volume 0.25 uS- 2.5 100 o. SO 250 5.0 100 1.00 500 10.0 100 2.00 1000 20.0 100 3.00 1500 30.0 100 5.00 2500 50.0 100
lAdapted from letter frot:l Harris Laboratories, Lexington, Nebraska.

.77
II. Determination
Heasure Ollt 2 grams of soil with a measuring spoon into a plastic vial. Add 10 ml of extracting solution from an automatic dispensing pipette and shakp in a mechanical shaker for 30 minutes. Dilute 0.5 ml of the extract to 50 ml and use this diluted extract to determin~ calcium and magnesium on a #290 atomic absorpticn unit.