Embed Size (px)
Citation preview

BI4Dynamics NAV
White Paper
BI4Dynamics NAV version: 6.2
Last update: March 2018
Version: 01
Content
1 PREFACE 2
2 BI4DYNAMICS PROFILER 5
3 ANALYTICAL AREA: BANK ACCOUNT 11
4 ANALYTICAL AREA: FIXED ASSETS 13
5 ANALYTICAL AREA: GENERAL LEDGER 16
6 ANALYTICAL AREA: INVENTORY 19
7 ANALYTICAL AREA: JOBS AND RESOURCES 24
8 ANALYTICAL AREA: MANUFACTURING 32
9 ANALYTICAL AREA: PAYABLES 36
10 ANALYTICAL AREA: PURCHASE 40
11 ANALYTICAL AREA: RECEIVABLES 48
12 ANALYTICAL AREA: SALES 52
13 ANALYTICAL AREA: SERVICE MANAGEMENT 63
14 ANALYTICAL AREA: WAREHOUSE 66
15 DIMENSIONS 69
16 IMPORTANT NOTES 110
This document contains 111 pages.
BI4Dynamics NAV White Paper 2 Preface
1 PREFACE
1.1 How to use this document
This document describes BI4Dynamics NAV analytical areas with corresponding measures and dimensions used
in a single OLAP cube. This document is presented in two parts:
Part 1 - Analytical Areas or Cubes
List of dimensions in specific cubes
List of measures and their explanations in each specific cube
Part 2 - Dimensions
Details related to the dimensions, attributes and hierarchies; Dimensions are not described in each cube
since many dimension (for example Item) are available in more than one cube. Dimensions are unique,
meaning that they are the same in each cube.
1.2 Understanding dimensions and cubes
In this chapter, the difference between cubes, dimensions, attributes and hierarchies are presented.
Every cube is composed of different dimensions and different set of measures.
Dimension consists of single attributes that are grouped in predefined hierarchy.
Hierarchies have the possibility to drilldown by levels thus making it easier for the business to quickly
analyze the granular data.
Many attributes are visible and many more are hidden. They can be made visible via the Bi4Dynamics
customization wizard or by modification of properties in Microsoft Analysis Server (cube).
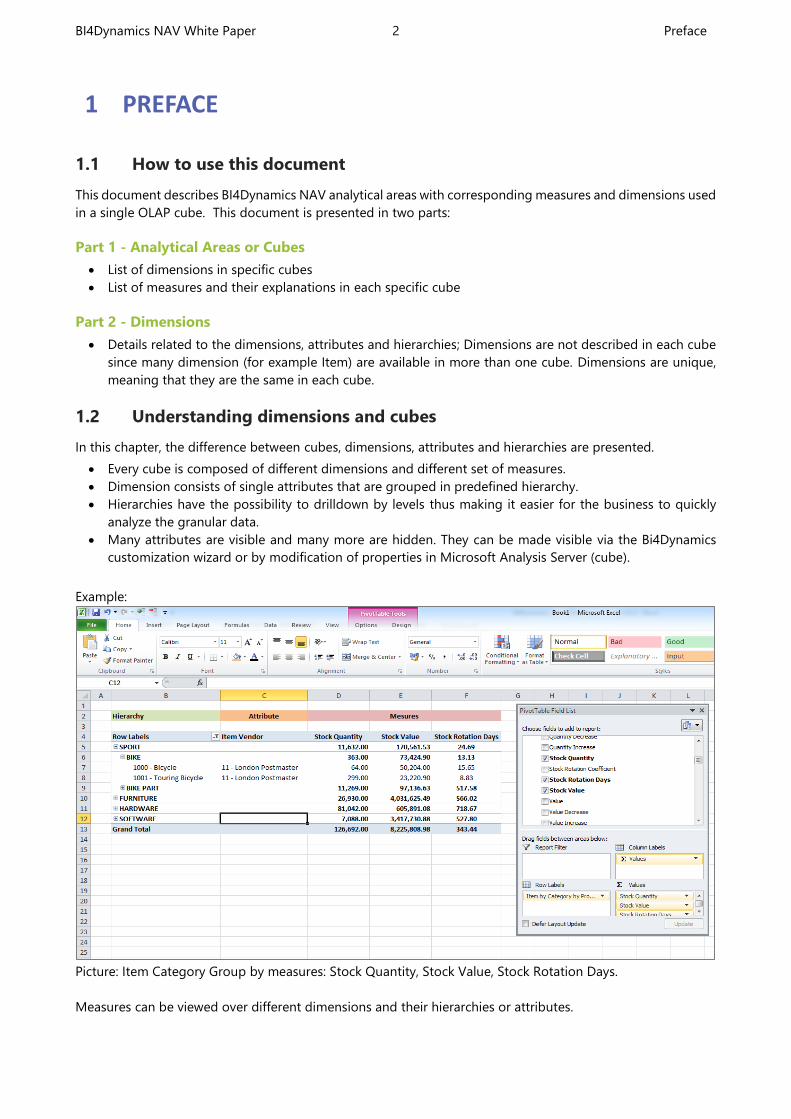
Example:
Picture: Item Category Group by measures: Stock Quantity, Stock Value, Stock Rotation Days.
Measures can be viewed over different dimensions and their hierarchies or attributes.
BI4Dynamics NAV White Paper 3 Preface
1.3 General features
One Installation, Any Database, Any Company,
BI4Dynamics can join data across any supported version of Microsoft Dynamics NAV database and company
within – in one single data warehouse.
Global dimensions
Each measure in a specific OLAP cube can be viewed over multiple companies and over eight global
dimensions.
Local currency, additional currency, posting currency
Standard measures are in local currency. BI4Dynamics NAV supports by default one additional currency that is
calculated in data warehouse with the information from currency exchange rate data in Microsoft Dynamics
NAV. The measures for additional currencies have an ACY suffix. Measures with suffix of PCY have values in
original currency posted. Such measures should always be analyzed with dimension Currency to avoid incorrect
totals.
One Installation, Any Language
Translations for all languages are available in every cube. Users can set-up local connection string (in Excel)
with Locale ID and change the display language in BI client (Excel).
Language
Locale
identifier Connection string
Croatian 1050 Locale identifier=1050
Czech 1029 Locale identifier=1029
Danish 1030 Locale identifier=1030
Dutch - Belgium 2067 Locale identifier=2067
Dutch - Netherlands 1043 Locale identifier=1043
English - United States 1033 Locale identifier=1033
Estonian 1061 Locale identifier=1061
Finnish 1035 Locale identifier=1035
French - France 1036 Locale identifier=1036
German - Germany 1031 Locale identifier=1031
German - Switzerland 2055 Locale identifier=2055
Italian - Italy 1040 Locale identifier=1040
Lithuanian 1063 Locale identifier=1063
Norwegian (Bokmål) 1044 Locale identifier=1044
Polish 1045 Locale identifier=1045
Portuguese - Portugal 2070 Locale identifier=2070
Serbian (Cyrillic) 3098 Locale identifier=3098
Serbian (Latin) 2074 Locale identifier=2074
Slovak 1051 Locale identifier=1051
Slovenian 1060 Locale identifier=1060
Spanish - Spain (Traditional Sort) 1034 Locale identifier=1034
Swedish 1053 Locale identifier=1053
Table of available languages and locale identifiers
This feature is available on STANDARD version of Microsoft SQL server.
BI4Dynamics NAV White Paper 4 Preface
1.4 Documentation of attributes and hierarchies
In some cases this document may not contain all description of dimension attributes and hierarchies. In every
such case filed in a Microsoft Dynamics table is added as dimension attribute to BI4Dynmaics (1:1) with the
same name therefore relations are self-explaining.
1.5 Documentation for Additional currency
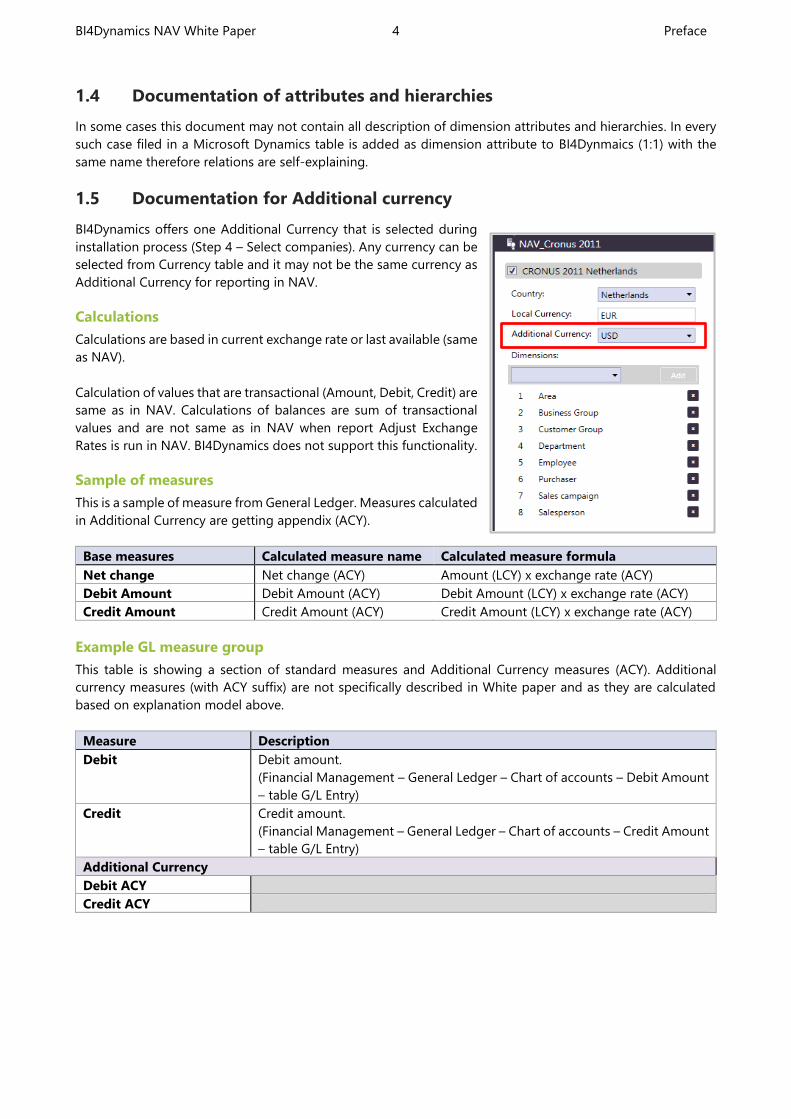
BI4Dynamics offers one Additional Currency that is selected during
installation process (Step 4 – Select companies). Any currency can be
selected from Currency table and it may not be the same currency as
Additional Currency for reporting in NAV.
Calculations
Calculations are based in current exchange rate or last available (same
as NAV).
Calculation of values that are transactional (Amount, Debit, Credit) are
same as in NAV. Calculations of balances are sum of transactional
values and are not same as in NAV when report Adjust Exchange
Rates is run in NAV. BI4Dynamics does not support this functionality.
Sample of measures
This is a sample of measure from General Ledger. Measures calculated
in Additional Currency are getting appendix (ACY).
Base measures Calculated measure name Calculated measure formula
Net change Net change (ACY) Amount (LCY) x exchange rate (ACY)
Debit Amount Debit Amount (ACY) Debit Amount (LCY) x exchange rate (ACY)
Credit Amount Credit Amount (ACY) Credit Amount (LCY) x exchange rate (ACY)
Example GL measure group
This table is showing a section of standard measures and Additional Currency measures (ACY). Additional
currency measures (with ACY suffix) are not specifically described in White paper and as they are calculated
based on explanation model above.
Measure Description
Debit Debit amount.
(Financial Management – General Ledger – Chart of accounts – Debit Amount
– table G/L Entry)
Credit Credit amount.
(Financial Management – General Ledger – Chart of accounts – Credit Amount
– table G/L Entry)
Additional Currency
Debit ACY
Credit ACY
BI4Dynamics NAV White Paper 5 BI4Dynamics Profiler
2 BI4DYNAMICS PROFILER
The Profiler cube enables analysis of BI4Dynamics performance and disk space requirements and it is a very
usable tool when diagnosing performance or content-related problems (e.g. incorrect numbers) in
BI4Dynamics.
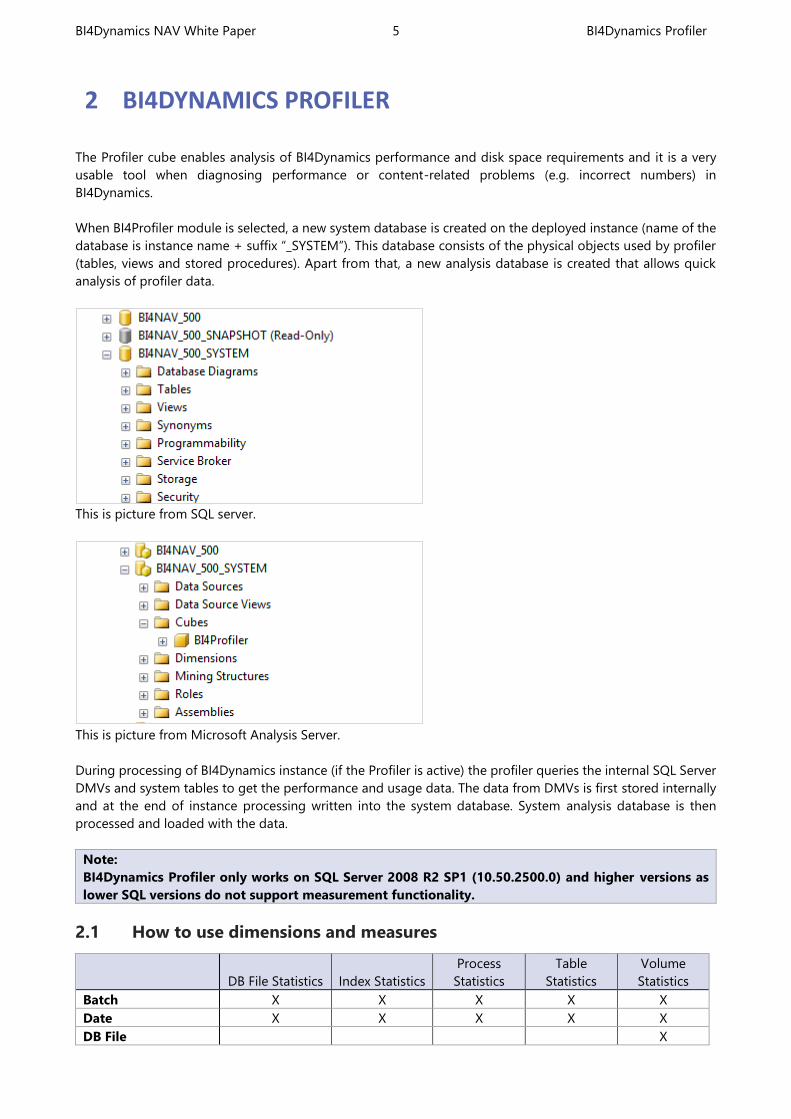
When BI4Profiler module is selected, a new system database is created on the deployed instance (name of the
database is instance name + suffix “_SYSTEM”). This database consists of the physical objects used by profiler
(tables, views and stored procedures). Apart from that, a new analysis database is created that allows quick
analysis of profiler data.
This is picture from SQL server.
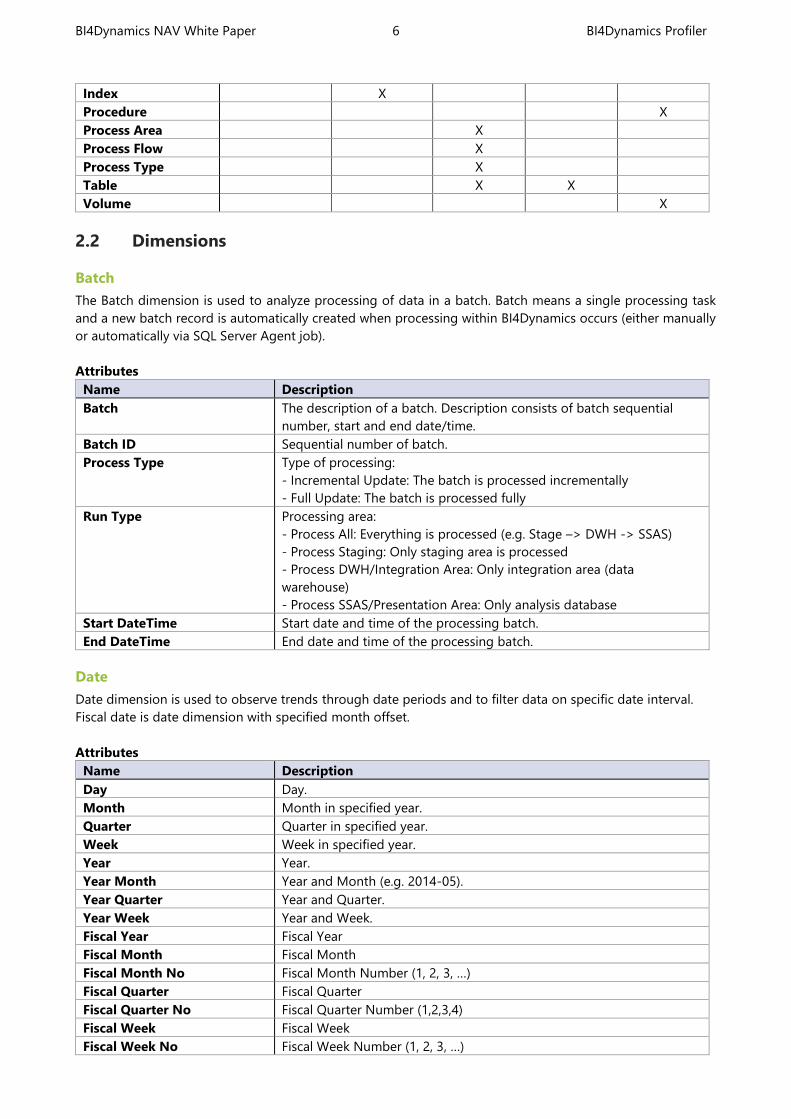
This is picture from Microsoft Analysis Server.
During processing of BI4Dynamics instance (if the Profiler is active) the profiler queries the internal SQL Server
DMVs and system tables to get the performance and usage data. The data from DMVs is first stored internally
and at the end of instance processing written into the system database. System analysis database is then
processed and loaded with the data.
Note:
BI4Dynamics Profiler only works on SQL Server 2008 R2 SP1 (10.50.2500.0) and higher versions as
lower SQL versions do not support measurement functionality.
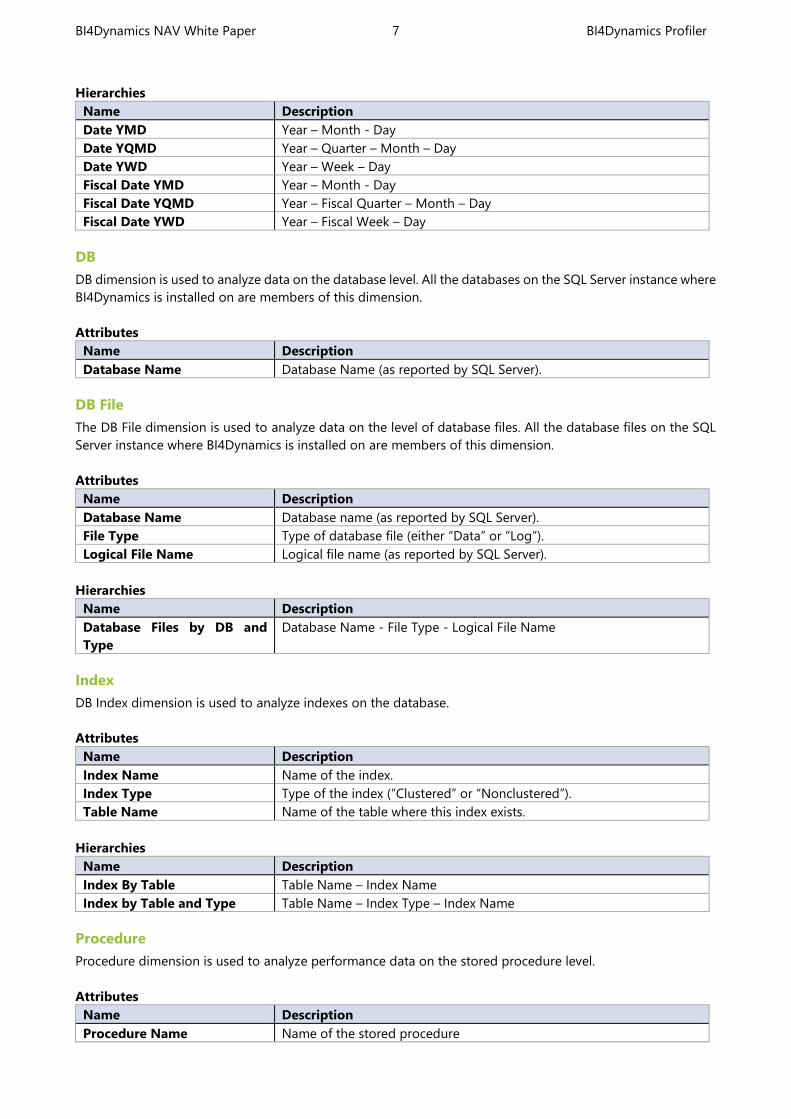
2.1 How to use dimensions and measures
DB File Statistics Index Statistics
Process
Statistics
Table
Statistics
Volume
Statistics
Batch X X X X X
Date X X X X X
DB File X
BI4Dynamics NAV White Paper 6 BI4Dynamics Profiler
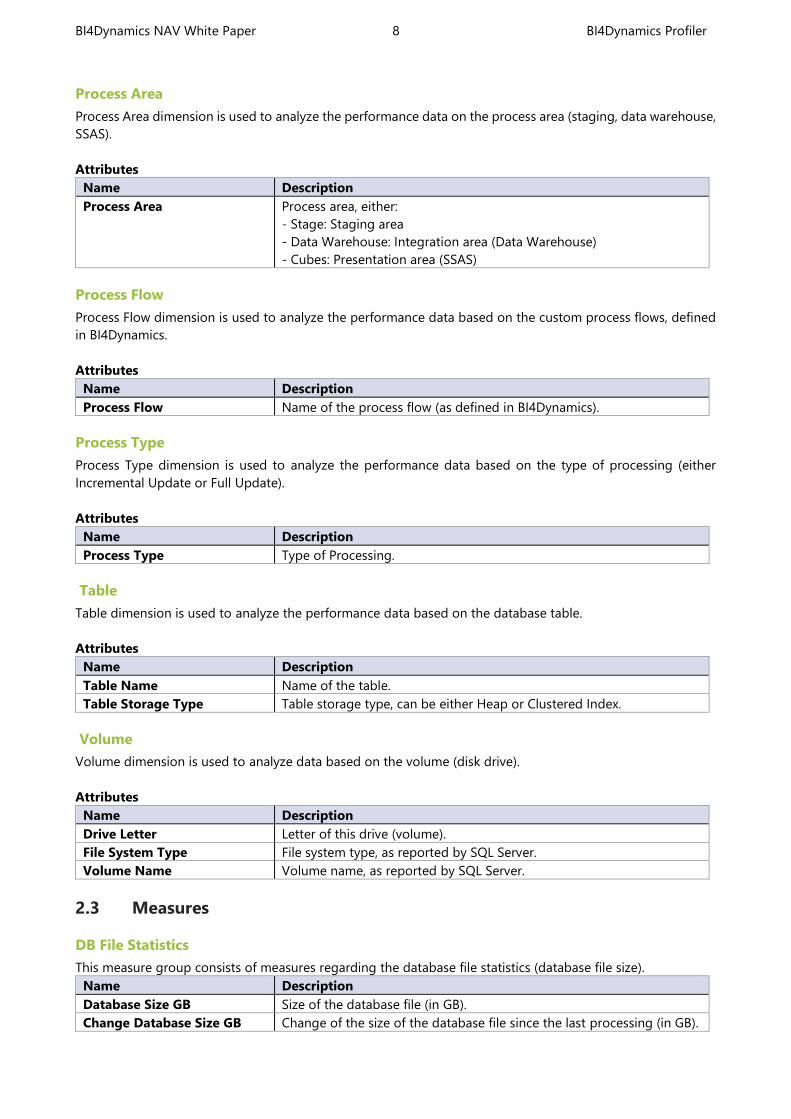
Index X
Procedure X
Process Area X
Process Flow X
Process Type X
Table X X
Volume X
2.2 Dimensions
Batch
The Batch dimension is used to analyze processing of data in a batch. Batch means a single processing task
and a new batch record is automatically created when processing within BI4Dynamics occurs (either manually
or automatically via SQL Server Agent job).
Attributes
Name Description
Batch The description of a batch. Description consists of batch sequential
number, start and end date/time.
Batch ID Sequential number of batch.
Process Type Type of processing:
- Incremental Update: The batch is processed incrementally
- Full Update: The batch is processed fully
Run Type Processing area:
- Process All: Everything is processed (e.g. Stage –> DWH -> SSAS)
- Process Staging: Only staging area is processed
- Process DWH/Integration Area: Only integration area (data
warehouse)
- Process SSAS/Presentation Area: Only analysis database
Start DateTime Start date and time of the processing batch.
End DateTime End date and time of the processing batch.
Date
Date dimension is used to observe trends through date periods and to filter data on specific date interval.
Fiscal date is date dimension with specified month offset.
Attributes
Name Description
Day Day.
Month Month in specified year.
Quarter Quarter in specified year.
Week Week in specified year.
Year Year.
Year Month Year and Month (e.g. 2014-05).
Year Quarter Year and Quarter.
Year Week Year and Week.
Fiscal Year Fiscal Year
Fiscal Month Fiscal Month
Fiscal Month No Fiscal Month Number (1, 2, 3, …)
Fiscal Quarter Fiscal Quarter
Fiscal Quarter No Fiscal Quarter Number (1,2,3,4)
Fiscal Week Fiscal Week
Fiscal Week No Fiscal Week Number (1, 2, 3, …)
BI4Dynamics NAV White Paper 7 BI4Dynamics Profiler
Hierarchies
Name Description
Date YMD Year – Month - Day
Date YQMD Year – Quarter – Month – Day
Date YWD Year – Week – Day
Fiscal Date YMD Year – Month - Day
Fiscal Date YQMD Year – Fiscal Quarter – Month – Day
Fiscal Date YWD Year – Fiscal Week – Day
DB
DB dimension is used to analyze data on the database level. All the databases on the SQL Server instance where
BI4Dynamics is installed on are members of this dimension.
Attributes
Name Description
Database Name Database Name (as reported by SQL Server).
DB File
The DB File dimension is used to analyze data on the level of database files. All the database files on the SQL
Server instance where BI4Dynamics is installed on are members of this dimension.
Attributes
Name Description
Database Name Database name (as reported by SQL Server).
File Type Type of database file (either “Data” or “Log”).
Logical File Name Logical file name (as reported by SQL Server).
Hierarchies
Name Description
Database Files by DB and
Type
Database Name - File Type - Logical File Name
Index
DB Index dimension is used to analyze indexes on the database.
Attributes
Name Description
Index Name Name of the index.
Index Type Type of the index (“Clustered” or “Nonclustered”).
Table Name Name of the table where this index exists.
Hierarchies
Name Description
Index By Table Table Name – Index Name
Index by Table and Type Table Name – Index Type – Index Name
Procedure
Procedure dimension is used to analyze performance data on the stored procedure level.
Attributes
Name Description
Procedure Name Name of the stored procedure
BI4Dynamics NAV White Paper 8 BI4Dynamics Profiler
Process Area
Process Area dimension is used to analyze the performance data on the process area (staging, data warehouse,
SSAS).
Attributes
Name Description
Process Area Process area, either:
- Stage: Staging area
- Data Warehouse: Integration area (Data Warehouse)
- Cubes: Presentation area (SSAS)
Process Flow
Process Flow dimension is used to analyze the performance data based on the custom process flows, defined
in BI4Dynamics.
Attributes
Name Description
Process Flow Name of the process flow (as defined in BI4Dynamics).
Process Type
Process Type dimension is used to analyze the performance data based on the type of processing (either
Incremental Update or Full Update).
Attributes
Name Description
Process Type Type of Processing.
Table
Table dimension is used to analyze the performance data based on the database table.
Attributes
Name Description
Table Name Name of the table.
Table Storage Type Table storage type, can be either Heap or Clustered Index.
Volume
Volume dimension is used to analyze data based on the volume (disk drive).
Attributes
Name Description
Drive Letter Letter of this drive (volume).
File System Type File system type, as reported by SQL Server.
Volume Name Volume name, as reported by SQL Server.
2.3 Measures
DB File Statistics
This measure group consists of measures regarding the database file statistics (database file size).
Name Description
Database Size GB Size of the database file (in GB).
Change Database Size GB Change of the size of the database file since the last processing (in GB).
BI4Dynamics NAV White Paper 9 BI4Dynamics Profiler
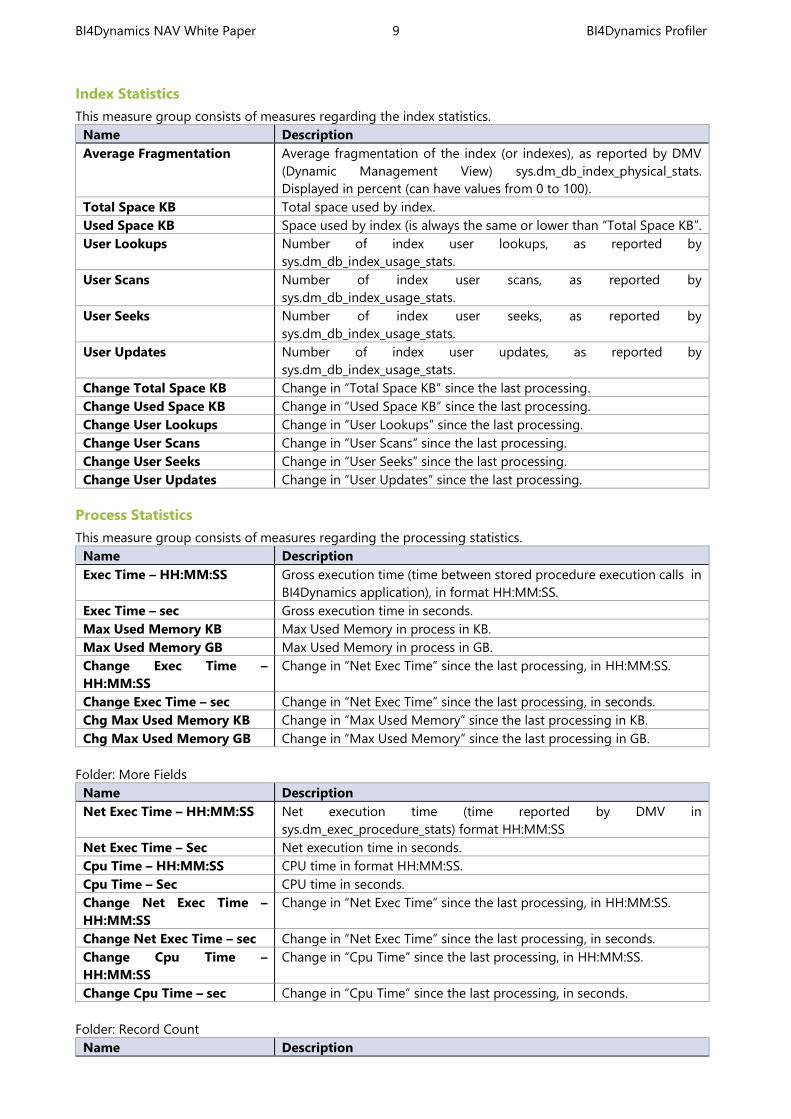
Index Statistics
This measure group consists of measures regarding the index statistics.
Name Description
Average Fragmentation Average fragmentation of the index (or indexes), as reported by DMV
(Dynamic Management View) sys.dm_db_index_physical_stats.
Displayed in percent (can have values from 0 to 100).
Total Space KB Total space used by index.
Used Space KB Space used by index (is always the same or lower than “Total Space KB”.
User Lookups Number of index user lookups, as reported by
sys.dm_db_index_usage_stats.
User Scans Number of index user scans, as reported by
sys.dm_db_index_usage_stats.
User Seeks Number of index user seeks, as reported by
sys.dm_db_index_usage_stats.
User Updates Number of index user updates, as reported by
sys.dm_db_index_usage_stats.
Change Total Space KB Change in “Total Space KB” since the last processing.
Change Used Space KB Change in “Used Space KB” since the last processing.
Change User Lookups Change in “User Lookups” since the last processing.
Change User Scans Change in “User Scans” since the last processing.
Change User Seeks Change in “User Seeks” since the last processing.
Change User Updates Change in “User Updates” since the last processing.
Process Statistics
This measure group consists of measures regarding the processing statistics.
Name Description
Exec Time – HH:MM:SS Gross execution time (time between stored procedure execution calls in
BI4Dynamics application), in format HH:MM:SS.
Exec Time – sec Gross execution time in seconds.
Max Used Memory KB Max Used Memory in process in KB.
Max Used Memory GB Max Used Memory in process in GB.
Change Exec Time –
HH:MM:SS
Change in “Net Exec Time” since the last processing, in HH:MM:SS.
Change Exec Time – sec Change in “Net Exec Time” since the last processing, in seconds.
Chg Max Used Memory KB Change in “Max Used Memory” since the last processing in KB.
Chg Max Used Memory GB Change in “Max Used Memory” since the last processing in GB.
Folder: More Fields
Name Description
Net Exec Time – HH:MM:SS Net execution time (time reported by DMV in
sys.dm_exec_procedure_stats) format HH:MM:SS
Net Exec Time – Sec Net execution time in seconds.
Cpu Time – HH:MM:SS CPU time in format HH:MM:SS.
Cpu Time – Sec CPU time in seconds.
Change Net Exec Time –
HH:MM:SS
Change in “Net Exec Time” since the last processing, in HH:MM:SS.
Change Net Exec Time – sec Change in “Net Exec Time” since the last processing, in seconds.
Change Cpu Time –
HH:MM:SS
Change in “Cpu Time” since the last processing, in HH:MM:SS.
Change Cpu Time – sec Change in “Cpu Time” since the last processing, in seconds.
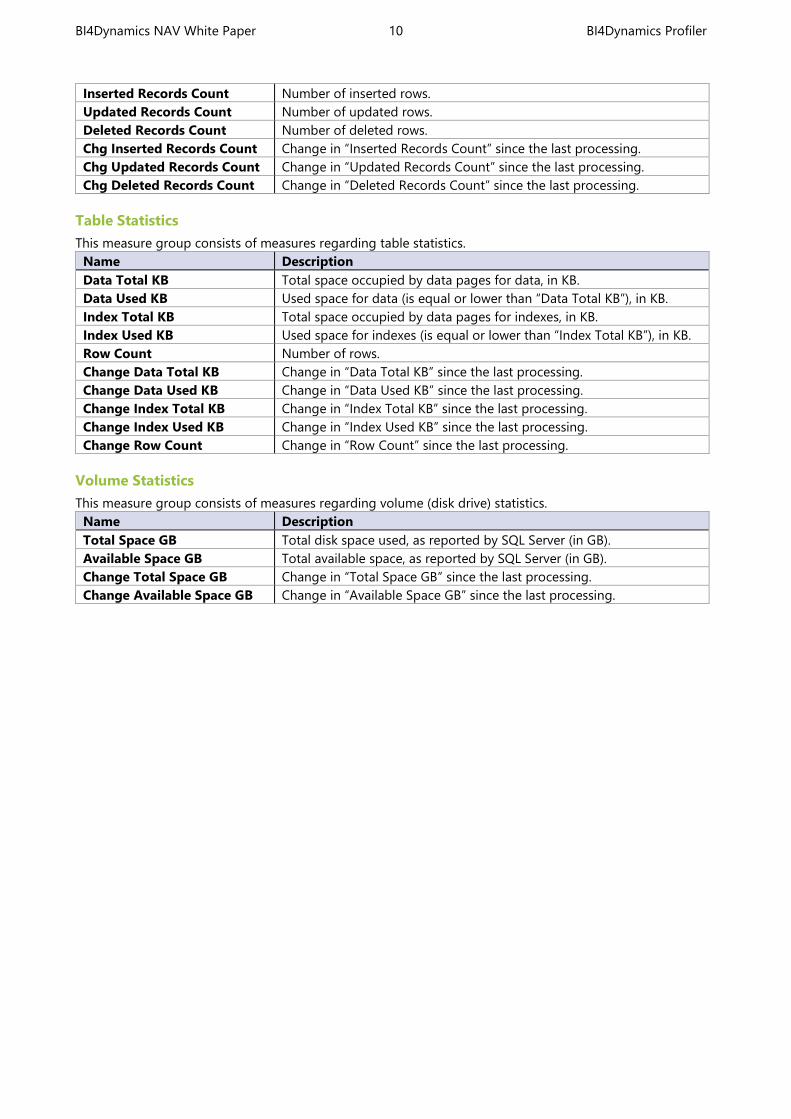
Folder: Record Count
Name Description
BI4Dynamics NAV White Paper 10 BI4Dynamics Profiler
Inserted Records Count Number of inserted rows.
Updated Records Count Number of updated rows.
Deleted Records Count Number of deleted rows.
Chg Inserted Records Count Change in “Inserted Records Count” since the last processing.
Chg Updated Records Count Change in “Updated Records Count” since the last processing.
Chg Deleted Records Count Change in “Deleted Records Count” since the last processing.
Table Statistics
This measure group consists of measures regarding table statistics.
Name Description
Data Total KB Total space occupied by data pages for data, in KB.
Data Used KB Used space for data (is equal or lower than “Data Total KB”), in KB.
Index Total KB Total space occupied by data pages for indexes, in KB.
Index Used KB Used space for indexes (is equal or lower than “Index Total KB”), in KB.
Row Count Number of rows.
Change Data Total KB Change in “Data Total KB” since the last processing.
Change Data Used KB Change in “Data Used KB” since the last processing.
Change Index Total KB Change in “Index Total KB” since the last processing.
Change Index Used KB Change in “Index Used KB” since the last processing.
Change Row Count Change in “Row Count” since the last processing.
Volume Statistics
This measure group consists of measures regarding volume (disk drive) statistics.
Name Description
Total Space GB Total disk space used, as reported by SQL Server (in GB).
Available Space GB Total available space, as reported by SQL Server (in GB).
Change Total Space GB Change in “Total Space GB” since the last processing.
Change Available Space GB Change in “Available Space GB” since the last processing.

BI4Dynamics NAV White Paper 11 Analytical Area: Bank Account
3 ANALYTICAL AREA: BANK ACCOUNT
The Bank Accounts are an important analytical area in larger organizations where Information about
transactions and trends across companies are tracked.
3.1 How to use dimensions and measures
Dimension Bank Account measure group
Bank Account X
Company X
Currency X
Data Source X
Date X
Dimension (1-8) X
Document Bank Account X
Reason Code X
Source Code X
3.2 Dimension
Date
Measure group Date field in MS Dynamics NAV
Bank Account measure group Posting Date.
(Financial Management – Cash Management – Bank Accounts – Bank
Account – Ledger Entries – table BA Ledger Entry)
3.3 Measures
All the following measures are calculated from the Bank Account Ledger Entries (Financial Management – Cash
Management – Bank Accounts – Bank Account – Ledger Entries – table BA Ledger Entry)
Name Description
Average Balance Average Balance (LCY)
Account Balance Account Balance (LCY)
Credit Credit Amount (LCY)
Debit Debit Amount (LCY)
Initial Balance Initial Balance (LCY)
Max Balance in Time Span Maximum Balance in Bank Account (LCY)
Min Balance in Time Span Minimum Balance in Bank Account (LCY)
Net Change Amount (LCY)
Additional Currency
Average Balance ACY
Account Balance ACY
Credit ACY
Debit ACY
Initial Balance ACY
Max Balance ACY in Time Span
Min Balance ACY in Time Span
Net Change ACY
Bank Account Currency
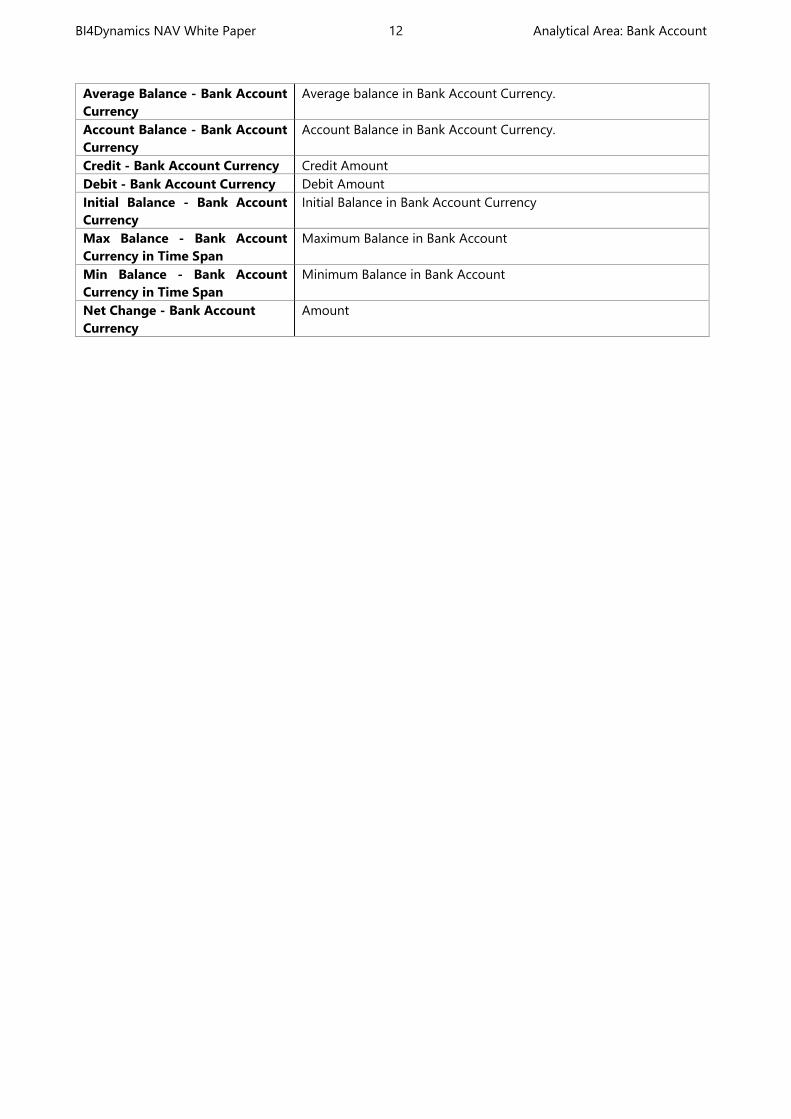
BI4Dynamics NAV White Paper 12 Analytical Area: Bank Account
Average Balance - Bank Account
Currency
Average balance in Bank Account Currency.
Account Balance - Bank Account
Currency
Account Balance in Bank Account Currency.
Credit - Bank Account Currency Credit Amount
Debit - Bank Account Currency Debit Amount
Initial Balance - Bank Account
Currency
Initial Balance in Bank Account Currency
Max Balance - Bank Account
Currency in Time Span
Maximum Balance in Bank Account
Min Balance - Bank Account
Currency in Time Span
Minimum Balance in Bank Account
Net Change - Bank Account
Currency
Amount
BI4Dynamics NAV White Paper 13 Analytical Area: Fixed Assets
4 ANALYTICAL AREA: FIXED ASSETS
The Fixed Asset module enables you to easily track different fixed assets. You can check their maintenance,
posting category, depreciation over multiple companies and global dimensions. In addition you can check the
state of fixed assets.
4.1 Extending functionality of MS Dynamics NAV
Main advantage:
Multiple companies.
8 global dimensions.
Easily check of Fixed Asset state.
Employees taking care of fixed asset.
Easily maintenance checks.
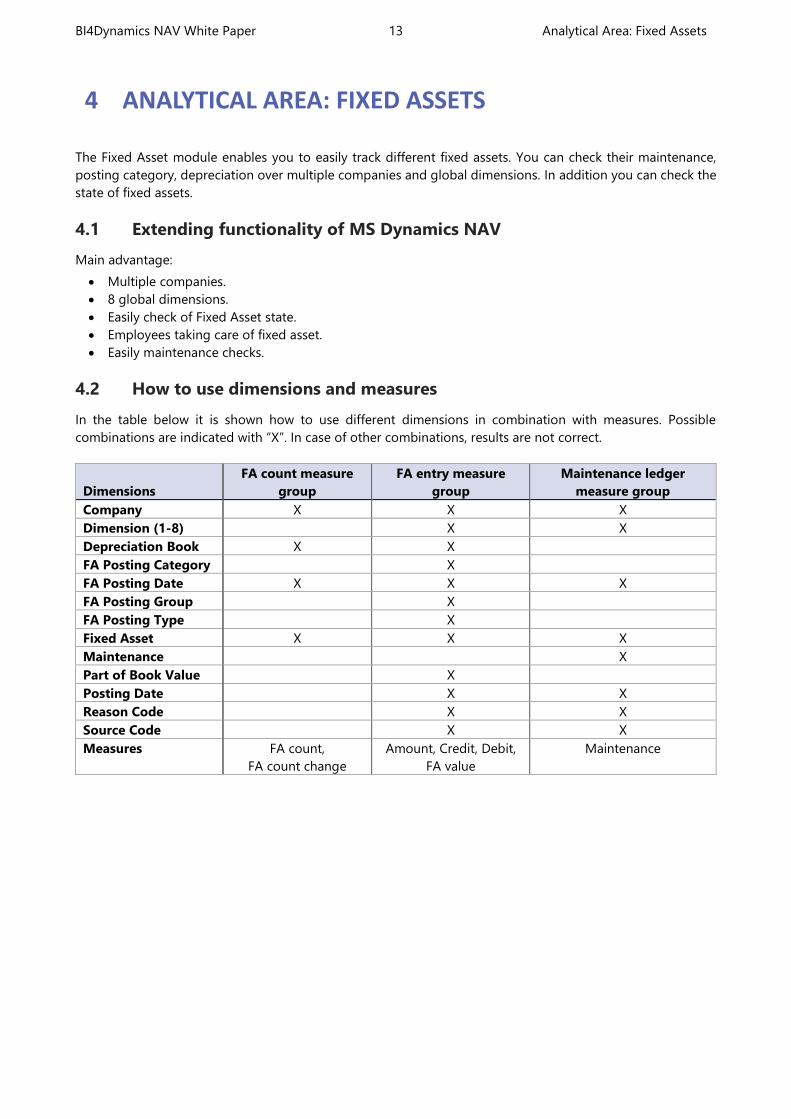
4.2 How to use dimensions and measures
In the table below it is shown how to use different dimensions in combination with measures. Possible
combinations are indicated with “X”. In case of other combinations, results are not correct.
Dimensions
FA count measure
group
FA entry measure
group
Maintenance ledger
measure group
Company X X X
Dimension (1-8) X X
Depreciation Book X X
FA Posting Category X
FA Posting Date X X X
FA Posting Group X
FA Posting Type X
Fixed Asset X X X
Maintenance X
Part of Book Value X
Posting Date X X
Reason Code X X
Source Code X X
Measures FA count,
FA count change
Amount, Credit, Debit,
FA value
Maintenance
BI4Dynamics NAV White Paper 14 Analytical Area: Fixed Assets
4.3 Dimensions
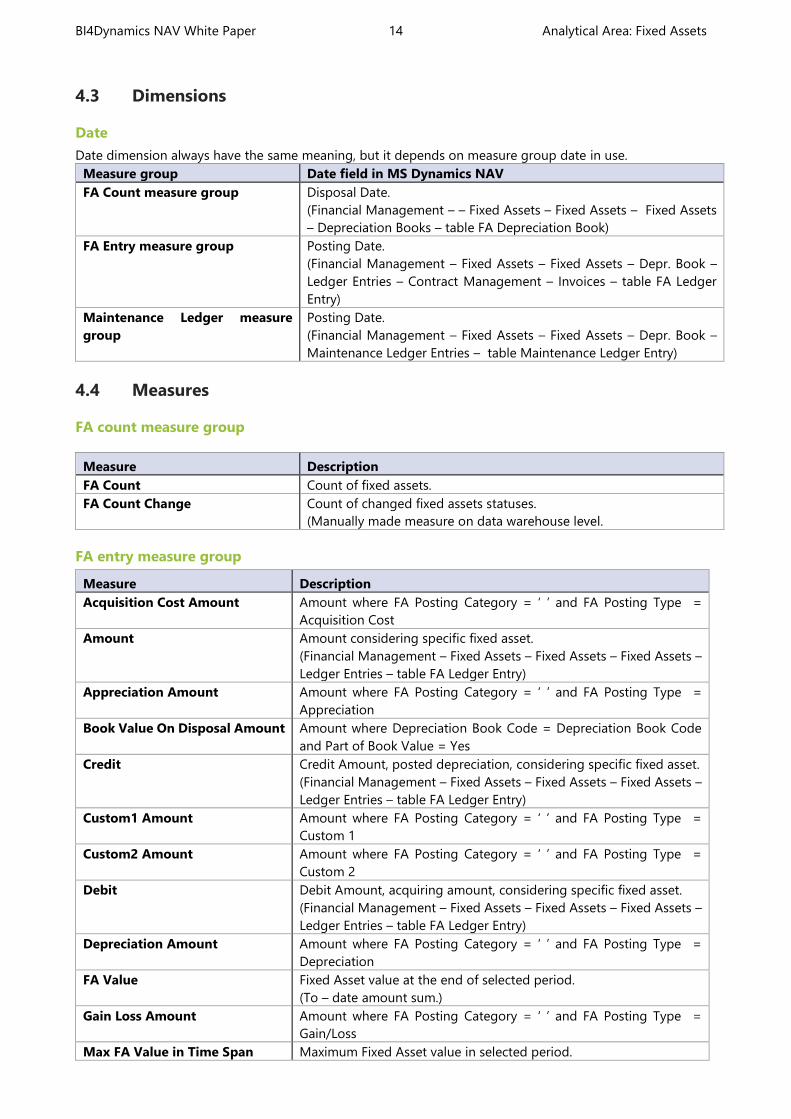
Date
Date dimension always have the same meaning, but it depends on measure group date in use.
Measure group Date field in MS Dynamics NAV
FA Count measure group Disposal Date.
(Financial Management – – Fixed Assets – Fixed Assets – Fixed Assets
– Depreciation Books – table FA Depreciation Book)
FA Entry measure group Posting Date.
(Financial Management – Fixed Assets – Fixed Assets – Depr. Book –
Ledger Entries – Contract Management – Invoices – table FA Ledger
Entry)
Maintenance Ledger measure
group
Posting Date.
(Financial Management – Fixed Assets – Fixed Assets – Depr. Book –
Maintenance Ledger Entries – table Maintenance Ledger Entry)
4.4 Measures
FA count measure group
FA entry measure group
Measure Description
Acquisition Cost Amount Amount where FA Posting Category = ‘ ’ and FA Posting Type =
Acquisition Cost
Amount Amount considering specific fixed asset.
(Financial Management – Fixed Assets – Fixed Assets – Fixed Assets –
Ledger Entries – table FA Ledger Entry)
Appreciation Amount Amount where FA Posting Category = ‘ ’ and FA Posting Type =
Appreciation
Book Value On Disposal Amount Amount where Depreciation Book Code = Depreciation Book Code
and Part of Book Value = Yes
Credit Credit Amount, posted depreciation, considering specific fixed asset.
(Financial Management – Fixed Assets – Fixed Assets – Fixed Assets –
Ledger Entries – table FA Ledger Entry)
Custom1 Amount Amount where FA Posting Category = ‘ ’ and FA Posting Type =
Custom 1
Custom2 Amount Amount where FA Posting Category = ‘ ’ and FA Posting Type =
Custom 2
Debit Debit Amount, acquiring amount, considering specific fixed asset.
(Financial Management – Fixed Assets – Fixed Assets – Fixed Assets –
Ledger Entries – table FA Ledger Entry)
Depreciation Amount Amount where FA Posting Category = ‘ ’ and FA Posting Type =
Depreciation
FA Value Fixed Asset value at the end of selected period.
(To – date amount sum.)
Gain Loss Amount Amount where FA Posting Category = ‘ ’ and FA Posting Type =
Gain/Loss
Max FA Value in Time Span Maximum Fixed Asset value in selected period.
Measure Description
FA Count Count of fixed assets.
FA Count Change Count of changed fixed assets statuses.
(Manually made measure on data warehouse level.
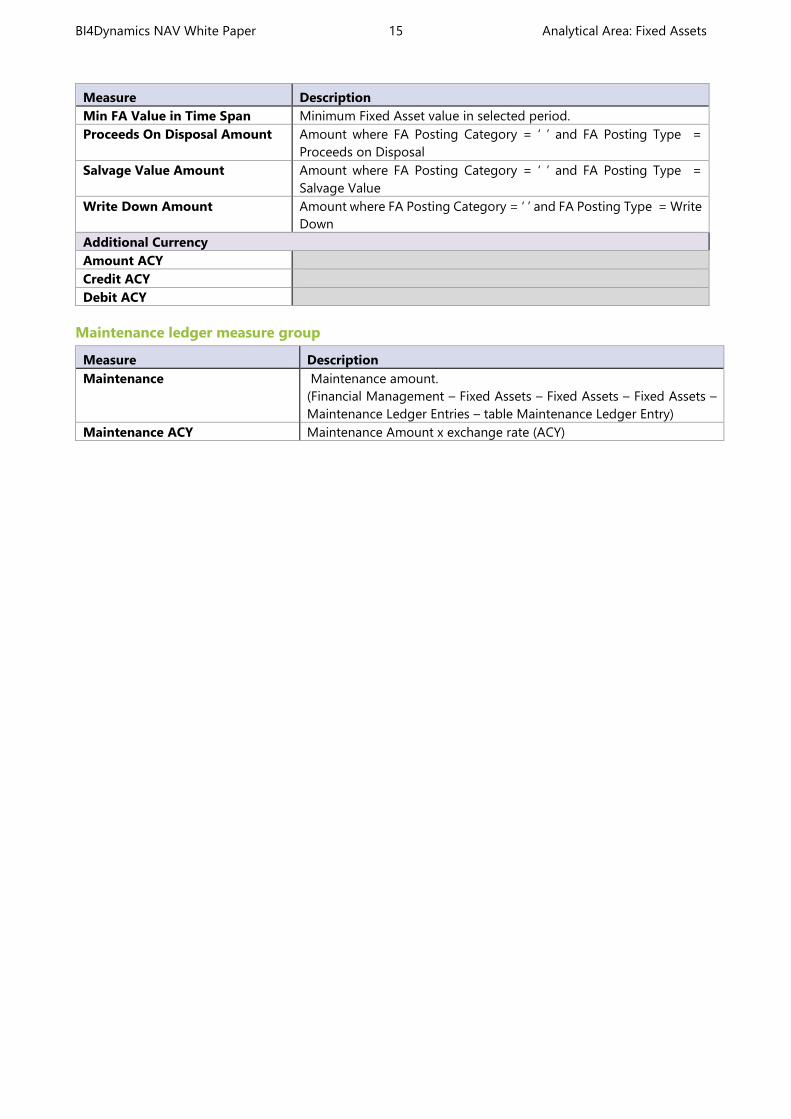
BI4Dynamics NAV White Paper 15 Analytical Area: Fixed Assets
Measure Description
Min FA Value in Time Span Minimum Fixed Asset value in selected period.
Proceeds On Disposal Amount Amount where FA Posting Category = ‘ ’ and FA Posting Type =
Proceeds on Disposal
Salvage Value Amount Amount where FA Posting Category = ‘ ’ and FA Posting Type =
Salvage Value
Write Down Amount Amount where FA Posting Category = ‘ ’ and FA Posting Type = Write
Down
Additional Currency
Amount ACY
Credit ACY
Debit ACY
Maintenance ledger measure group
Measure Description
Maintenance Maintenance amount.
(Financial Management – Fixed Assets – Fixed Assets – Fixed Assets –
Maintenance Ledger Entries – table Maintenance Ledger Entry)
Maintenance ACY Maintenance Amount x exchange rate (ACY)

BI4Dynamics NAV White Paper 16 Analytical Area: General Ledger
5 ANALYTICAL AREA: GENERAL LEDGER
The General Ledger Analysis enables the tracking of all activities regarding General ledger postings and
budgeting. Support for multiple companies over chart of accounts with predefined usage of 8 global
dimensions, makes GL analysis ideally suitable for organizations that have multiple companies in MS Dynamics
NAV.
5.1 Extending functionality of MS Dynamics NAV
Main advantages:
Budget / realization indexes over multiple dimensions and chart of accounts.
Drill down the hierarchy of chart of accounts to single posting.
5.2 How to use dimensions and measures
In the table below it is shown how to use different dimensions in combination with measures. Possible
combinations are indicated with “X”. In case of other combinations, results are not correct.
Dimensions GL budget measure group GL measure group
Account Schedule X X
Business Unit X
Closed Period X
Company X X
Customer X
Date X X
Dimension (1-8) X X
Document GL X X
Fixed Asset X
General Business
Posting Group
X
General Product
Posting Group
X
GL Account X X
GL Budget X
Reason Code X
Source Code X
Source GL X
Vendor X
Measures Net change, Debit, Credit, Balance,
Net change YTD, Net change last YTD,
Net change YTD index
Budget amount, Budget amount YTD,
Budget variance, Budget variance YTD,
Net change/budget index, Net
change/budget YTD index
5.3 Dimension
Date
Date dimension always means the same, but it depends on which cube and measures are checked.
Measure group Date field in MS Dynamics NAV
GL Measure group
Posting Date.
(Financial Management – General Ledger – Chart of accounts – Account –
Ledger entries – table G/L Entry)
BI4Dynamics NAV White Paper 17 Analytical Area: General Ledger
GL Budget group
Date.
(Financial Management – General Ledger – Budgets – table G/L Budget Entry)
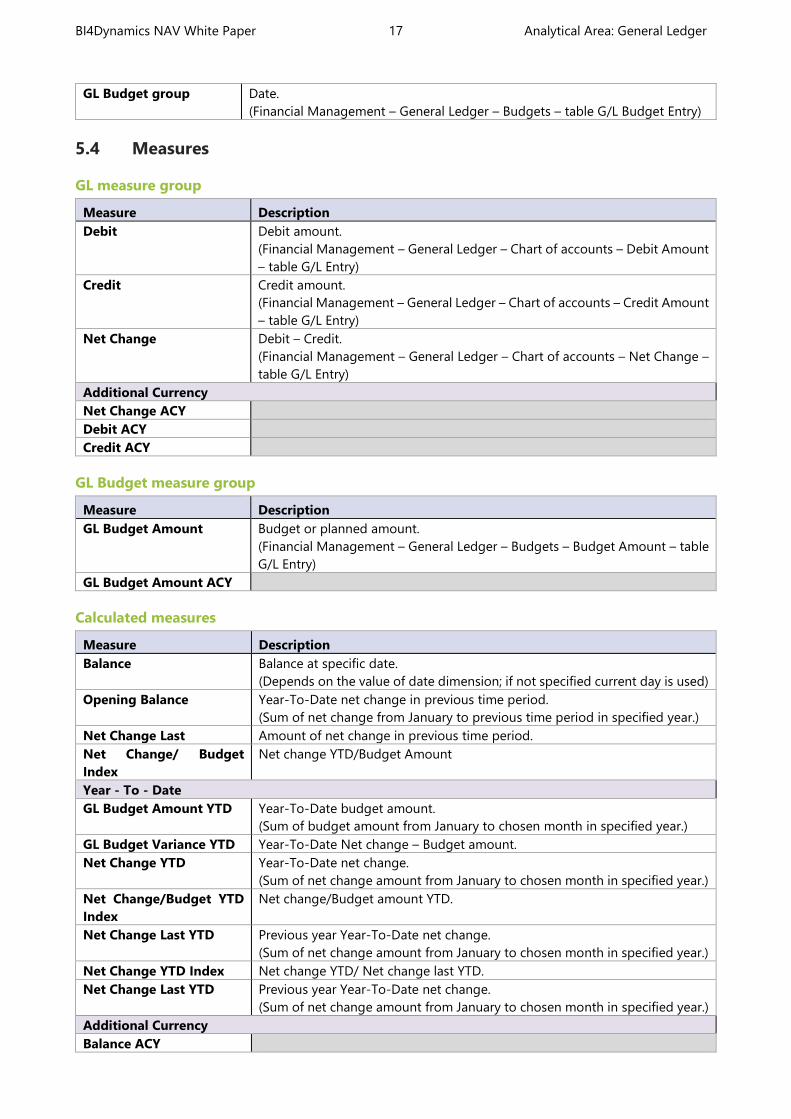
5.4 Measures
GL measure group
Measure Description
Debit Debit amount.
(Financial Management – General Ledger – Chart of accounts – Debit Amount
– table G/L Entry)
Credit Credit amount.
(Financial Management – General Ledger – Chart of accounts – Credit Amount
– table G/L Entry)
Net Change Debit – Credit.
(Financial Management – General Ledger – Chart of accounts – Net Change –
table G/L Entry)
Additional Currency
Net Change ACY
Debit ACY
Credit ACY
GL Budget measure group
Measure Description
GL Budget Amount Budget or planned amount.
(Financial Management – General Ledger – Budgets – Budget Amount – table
G/L Entry)
GL Budget Amount ACY
Calculated measures
Measure Description
Balance Balance at specific date.
(Depends on the value of date dimension; if not specified current day is used)
Opening Balance Year-To-Date net change in previous time period.
(Sum of net change from January to previous time period in specified year.)
Net Change Last Amount of net change in previous time period.
Net Change/ Budget
Index
Net change YTD/Budget Amount
Year - To - Date
GL Budget Amount YTD Year-To-Date budget amount.
(Sum of budget amount from January to chosen month in specified year.)
GL Budget Variance YTD Year-To-Date Net change – Budget amount.
Net Change YTD Year-To-Date net change.
(Sum of net change amount from January to chosen month in specified year.)
Net Change/Budget YTD
Index
Net change/Budget amount YTD.
Net Change Last YTD Previous year Year-To-Date net change.
(Sum of net change amount from January to chosen month in specified year.)
Net Change YTD Index Net change YTD/ Net change last YTD.
Net Change Last YTD Previous year Year-To-Date net change.
(Sum of net change amount from January to chosen month in specified year.)
Additional Currency
Balance ACY
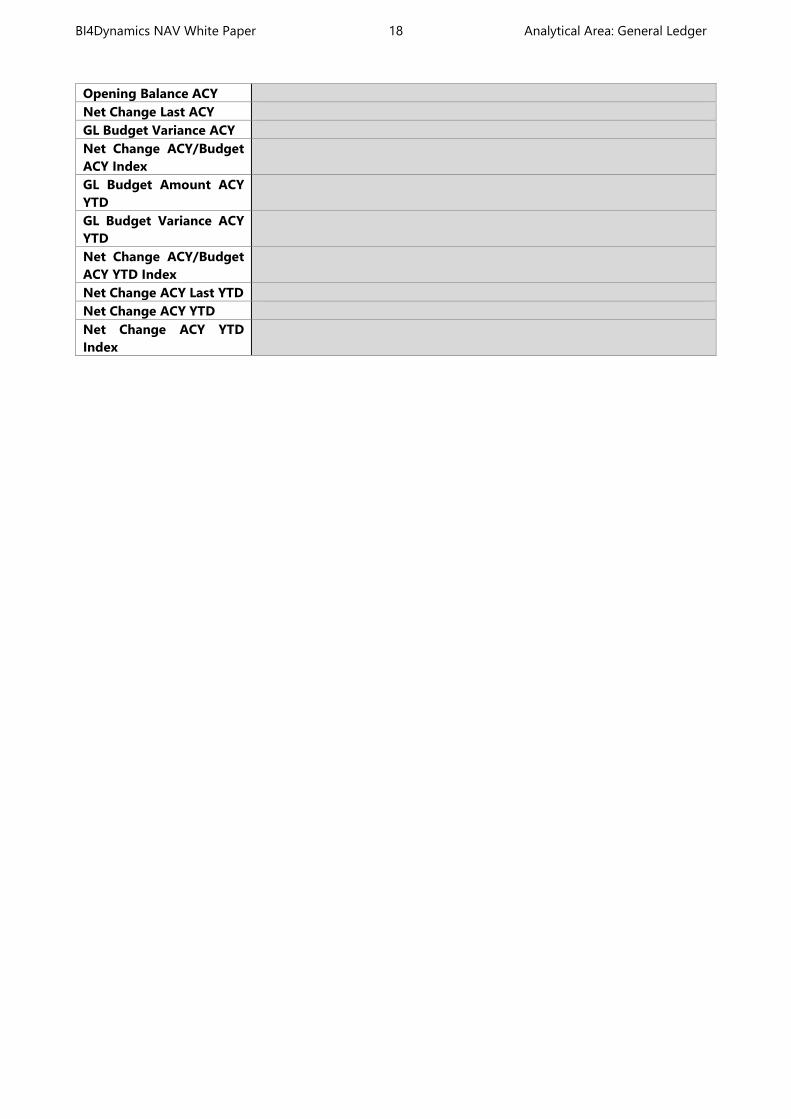
BI4Dynamics NAV White Paper 18 Analytical Area: General Ledger
Opening Balance ACY
Net Change Last ACY
GL Budget Variance ACY
Net Change ACY/Budget
ACY Index
GL Budget Amount ACY
YTD
GL Budget Variance ACY
YTD
Net Change ACY/Budget
ACY YTD Index
Net Change ACY Last YTD
Net Change ACY YTD
Net Change ACY YTD
Index
BI4Dynamics NAV White Paper 19 Analytical Area: Inventory
6 ANALYTICAL AREA: INVENTORY
Inventory analysis is always a challenge in any ERP system, because data has to be calculated for every item
through all posted item entries. Because of this approach, analysis is very slow and analyzing average inventory
value or turnover coefficient over multiple locations and items are almost impossible.
Optimizing inventory is key in any analysis and with this in mind, we created daily snapshots of data in BI4NAV
data warehouse to provide business users with very fast and agile analysis of complete inventory through
history data.
6.1 Extending functionality of MS Dynamics NAV
Main advantages:
Very fast analysis over multiple items and warehouse locations.
Analyzing trends of inventor value/quantity over period of time (years, months, days).
Advanced measures – avg. stock value, stock rotation coefficients, turnover of stock in days.
Analyzing groups of items over multiple locations with turnover in days to see quickly which items are
longer on stock.
Decrease / increase analysis over item ledger entry type (purchase, sales, output, transfers, etc.).
Analyze specific posting through source and reason code.
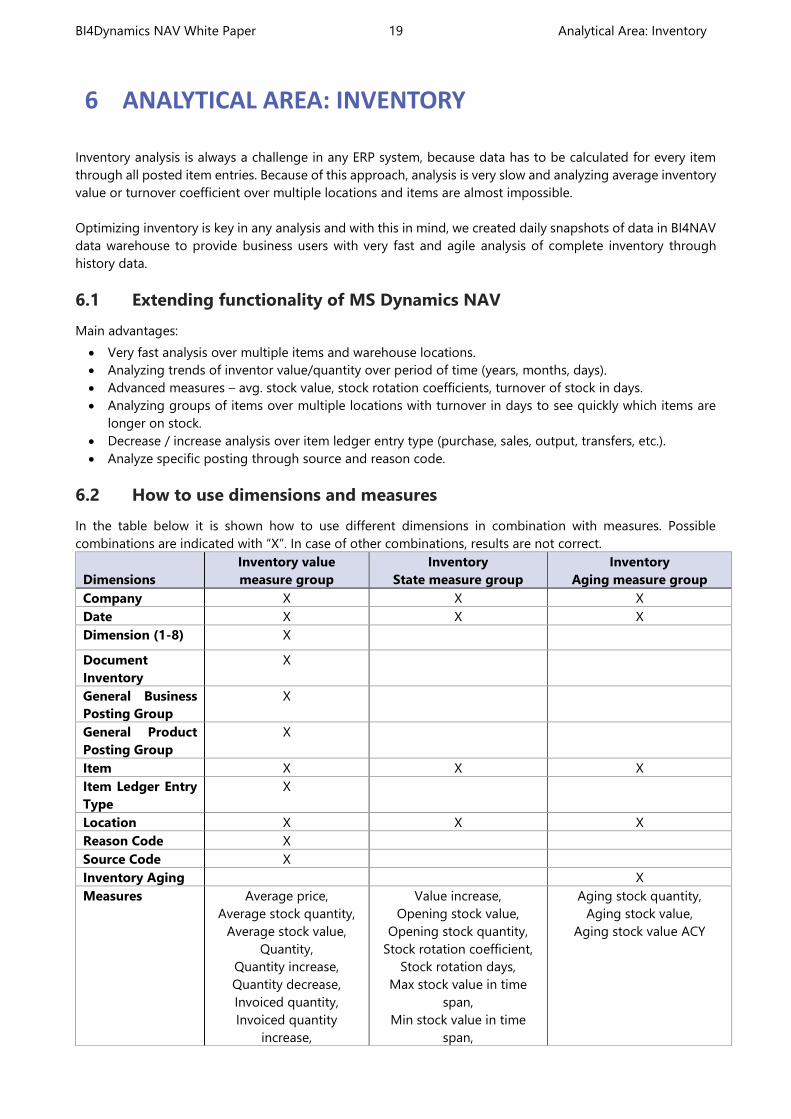
6.2 How to use dimensions and measures
In the table below it is shown how to use different dimensions in combination with measures. Possible
combinations are indicated with “X”. In case of other combinations, results are not correct.
Dimensions
Inventory value
measure group
Inventory
State measure group
Inventory
Aging measure group
Company X X X
Date X X X
Dimension (1-8) X
Document
Inventory
X
General Business
Posting Group
X
General Product
Posting Group
X
Item X X X
Item Ledger Entry
Type
X
Location X X X
Reason Code X
Source Code X
Inventory Aging X
Measures Average price,
Average stock quantity,
Average stock value,
Quantity,
Quantity increase,
Quantity decrease,
Invoiced quantity,
Invoiced quantity
increase,
Value increase,
Opening stock value,
Opening stock quantity,
Stock rotation coefficient,
Stock rotation days,
Max stock value in time
span,
Min stock value in time
span,
Aging stock quantity,
Aging stock value,
Aging stock value ACY
BI4Dynamics NAV White Paper 20 Analytical Area: Inventory
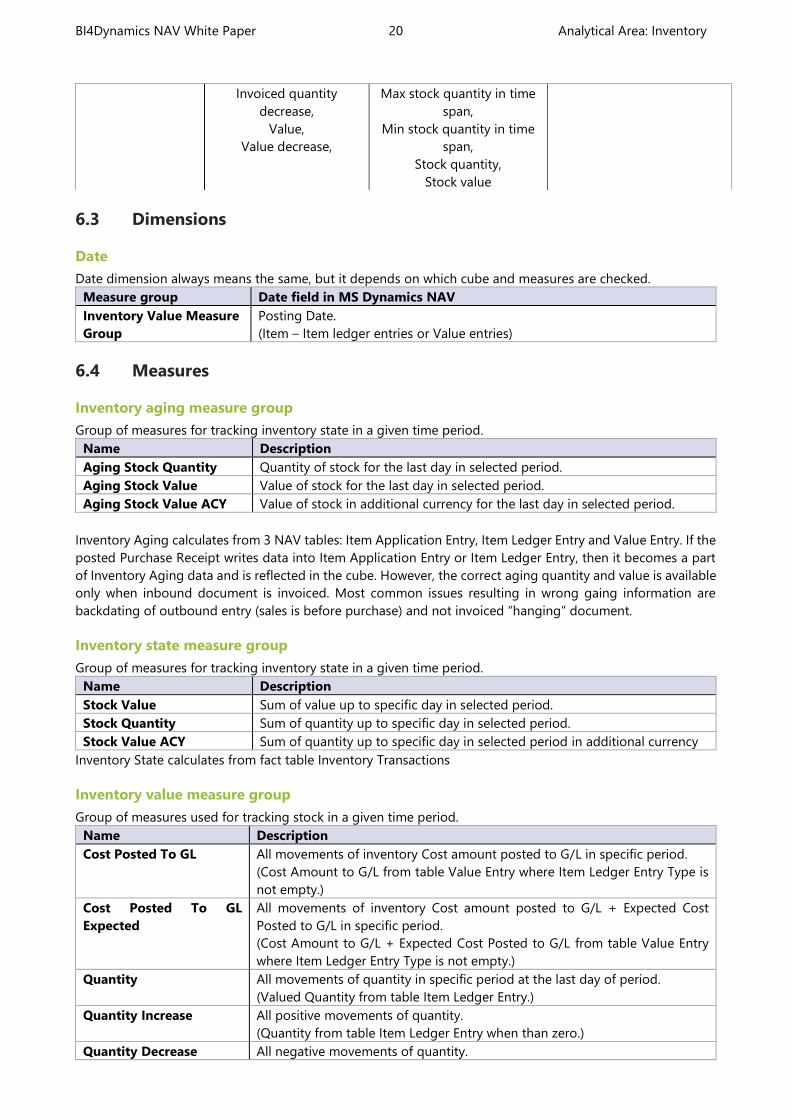
6.3 Dimensions
Date
Date dimension always means the same, but it depends on which cube and measures are checked.
Measure group Date field in MS Dynamics NAV
Inventory Value Measure
Group
Posting Date.
(Item – Item ledger entries or Value entries)
6.4 Measures
Inventory aging measure group
Group of measures for tracking inventory state in a given time period.
Name Description
Aging Stock Quantity Quantity of stock for the last day in selected period.
Aging Stock Value Value of stock for the last day in selected period.
Aging Stock Value ACY Value of stock in additional currency for the last day in selected period.
Inventory Aging calculates from 3 NAV tables: Item Application Entry, Item Ledger Entry and Value Entry. If the
posted Purchase Receipt writes data into Item Application Entry or Item Ledger Entry, then it becomes a part
of Inventory Aging data and is reflected in the cube. However, the correct aging quantity and value is available
only when inbound document is invoiced. Most common issues resulting in wrong gaing information are
backdating of outbound entry (sales is before purchase) and not invoiced “hanging” document.
Inventory state measure group
Group of measures for tracking inventory state in a given time period.
Name Description
Stock Value Sum of value up to specific day in selected period.
Stock Quantity Sum of quantity up to specific day in selected period.
Stock Value ACY Sum of quantity up to specific day in selected period in additional currency
Inventory State calculates from fact table Inventory Transactions
Inventory value measure group
Group of measures used for tracking stock in a given time period.
Name Description
Cost Posted To GL All movements of inventory Cost amount posted to G/L in specific period.
(Cost Amount to G/L from table Value Entry where Item Ledger Entry Type is
not empty.)
Cost Posted To GL
Expected
All movements of inventory Cost amount posted to G/L + Expected Cost
Posted to G/L in specific period.
(Cost Amount to G/L + Expected Cost Posted to G/L from table Value Entry
where Item Ledger Entry Type is not empty.)
Quantity All movements of quantity in specific period at the last day of period.
(Valued Quantity from table Item Ledger Entry.)
Quantity Increase All positive movements of quantity.
(Quantity from table Item Ledger Entry when than zero.)
Quantity Decrease All negative movements of quantity.
Invoiced quantity
decrease,
Value,
Value decrease,
Max stock quantity in time
span,
Min stock quantity in time
span,
Stock quantity,
Stock value
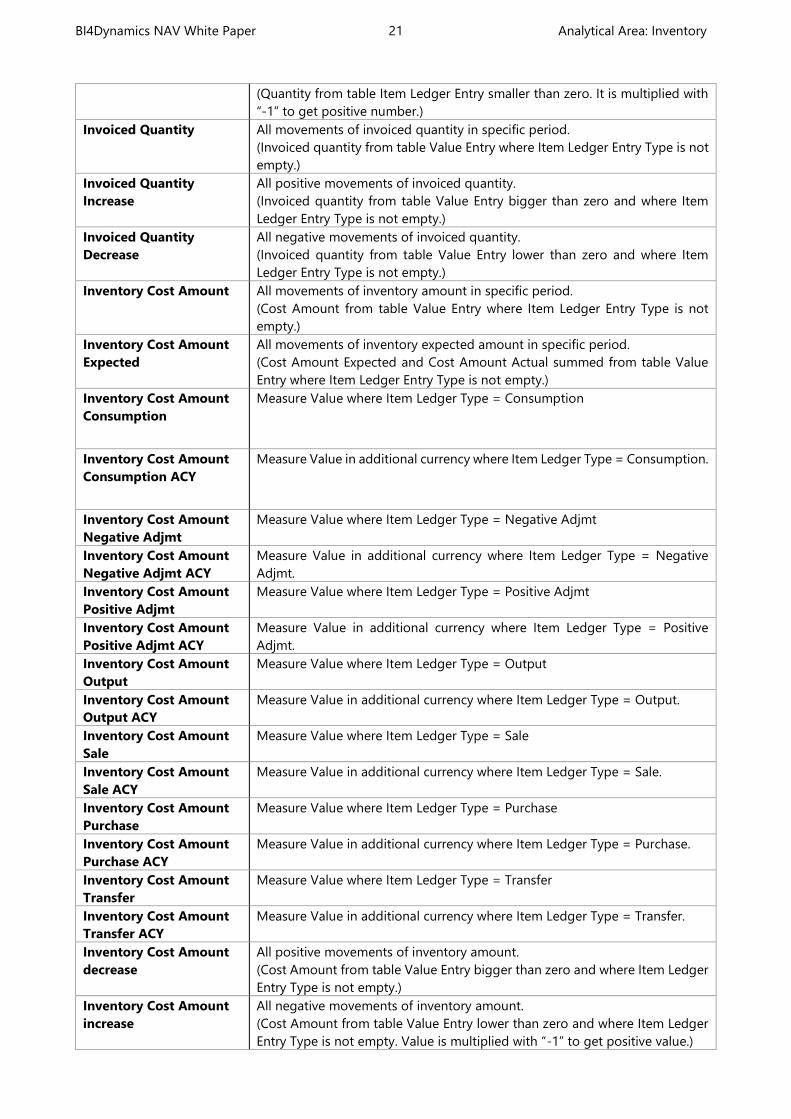
BI4Dynamics NAV White Paper 21 Analytical Area: Inventory
(Quantity from table Item Ledger Entry smaller than zero. It is multiplied with
“-1” to get positive number.)
Invoiced Quantity All movements of invoiced quantity in specific period.
(Invoiced quantity from table Value Entry where Item Ledger Entry Type is not
empty.)
Invoiced Quantity
Increase
All positive movements of invoiced quantity.
(Invoiced quantity from table Value Entry bigger than zero and where Item
Ledger Entry Type is not empty.)
Invoiced Quantity
Decrease
All negative movements of invoiced quantity.
(Invoiced quantity from table Value Entry lower than zero and where Item
Ledger Entry Type is not empty.)
Inventory Cost Amount All movements of inventory amount in specific period.
(Cost Amount from table Value Entry where Item Ledger Entry Type is not
empty.)
Inventory Cost Amount
Expected
All movements of inventory expected amount in specific period.
(Cost Amount Expected and Cost Amount Actual summed from table Value
Entry where Item Ledger Entry Type is not empty.)
Inventory Cost Amount
Consumption
Measure Value where Item Ledger Type = Consumption
Inventory Cost Amount
Consumption ACY
Measure Value in additional currency where Item Ledger Type = Consumption.
Inventory Cost Amount
Negative Adjmt
Measure Value where Item Ledger Type = Negative Adjmt
Inventory Cost Amount
Negative Adjmt ACY
Measure Value in additional currency where Item Ledger Type = Negative
Adjmt.
Inventory Cost Amount
Positive Adjmt
Measure Value where Item Ledger Type = Positive Adjmt
Inventory Cost Amount
Positive Adjmt ACY
Measure Value in additional currency where Item Ledger Type = Positive
Adjmt.
Inventory Cost Amount
Output
Measure Value where Item Ledger Type = Output
Inventory Cost Amount
Output ACY
Measure Value in additional currency where Item Ledger Type = Output.
Inventory Cost Amount
Sale
Measure Value where Item Ledger Type = Sale
Inventory Cost Amount
Sale ACY
Measure Value in additional currency where Item Ledger Type = Sale.
Inventory Cost Amount
Purchase
Measure Value where Item Ledger Type = Purchase
Inventory Cost Amount
Purchase ACY
Measure Value in additional currency where Item Ledger Type = Purchase.
Inventory Cost Amount
Transfer
Measure Value where Item Ledger Type = Transfer
Inventory Cost Amount
Transfer ACY
Measure Value in additional currency where Item Ledger Type = Transfer.
Inventory Cost Amount
decrease
All positive movements of inventory amount.
(Cost Amount from table Value Entry bigger than zero and where Item Ledger
Entry Type is not empty.)
Inventory Cost Amount
increase
All negative movements of inventory amount.
(Cost Amount from table Value Entry lower than zero and where Item Ledger
Entry Type is not empty. Value is multiplied with “-1” to get positive value.)
BI4Dynamics NAV White Paper 22 Analytical Area: Inventory
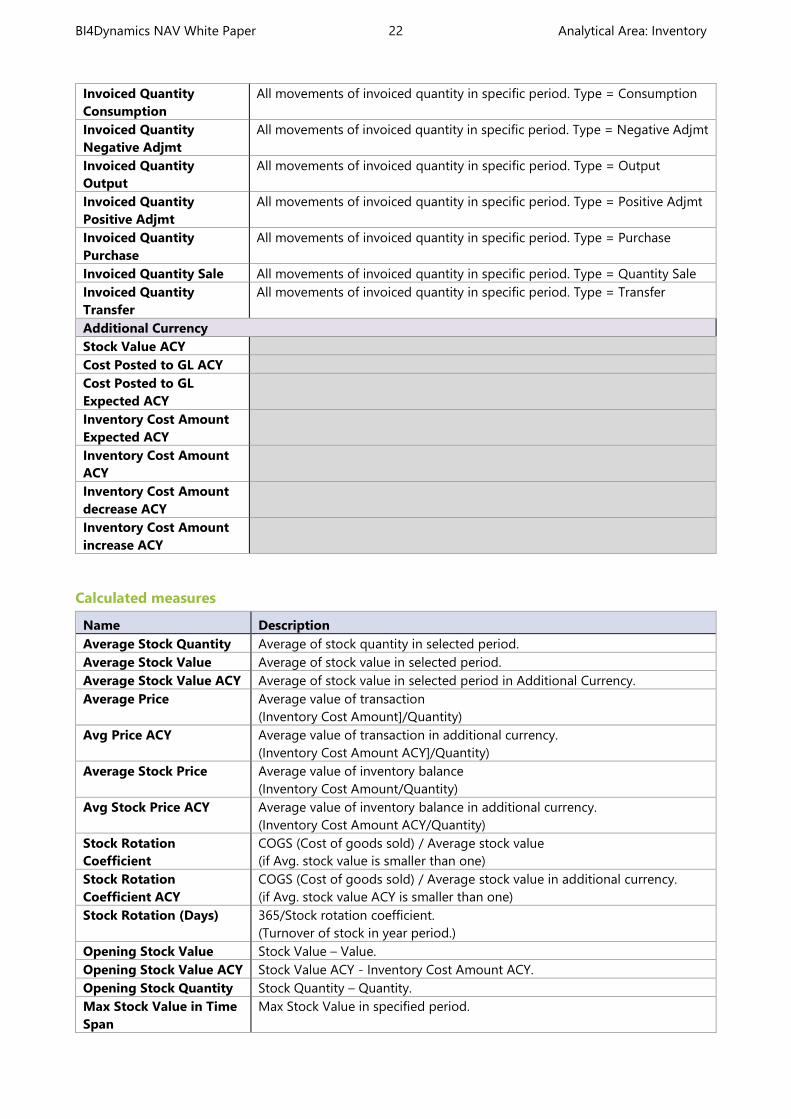
Invoiced Quantity
Consumption
All movements of invoiced quantity in specific period. Type = Consumption
Invoiced Quantity
Negative Adjmt
All movements of invoiced quantity in specific period. Type = Negative Adjmt
Invoiced Quantity
Output
All movements of invoiced quantity in specific period. Type = Output
Invoiced Quantity
Positive Adjmt
All movements of invoiced quantity in specific period. Type = Positive Adjmt
Invoiced Quantity
Purchase
All movements of invoiced quantity in specific period. Type = Purchase
Invoiced Quantity Sale All movements of invoiced quantity in specific period. Type = Quantity Sale
Invoiced Quantity
Transfer
All movements of invoiced quantity in specific period. Type = Transfer
Additional Currency
Stock Value ACY
Cost Posted to GL ACY
Cost Posted to GL
Expected ACY
Inventory Cost Amount
Expected ACY
Inventory Cost Amount
ACY
Inventory Cost Amount
decrease ACY
Inventory Cost Amount
increase ACY
Calculated measures
Name Description
Average Stock Quantity Average of stock quantity in selected period.
Average Stock Value Average of stock value in selected period.
Average Stock Value ACY Average of stock value in selected period in Additional Currency.
Average Price Average value of transaction
(Inventory Cost Amount]/Quantity)
Avg Price ACY Average value of transaction in additional currency.
(Inventory Cost Amount ACY]/Quantity)
Average Stock Price Average value of inventory balance
(Inventory Cost Amount/Quantity)
Avg Stock Price ACY Average value of inventory balance in additional currency.
(Inventory Cost Amount ACY/Quantity)
Stock Rotation
Coefficient
COGS (Cost of goods sold) / Average stock value
(if Avg. stock value is smaller than one)
Stock Rotation
Coefficient ACY
COGS (Cost of goods sold) / Average stock value in additional currency.
(if Avg. stock value ACY is smaller than one)
Stock Rotation (Days) 365/Stock rotation coefficient.
(Turnover of stock in year period.)
Opening Stock Value Stock Value – Value.
Opening Stock Value ACY Stock Value ACY - Inventory Cost Amount ACY.
Opening Stock Quantity Stock Quantity – Quantity.
Max Stock Value in Time
Span
Max Stock Value in specified period.
BI4Dynamics NAV White Paper 23 Analytical Area: Inventory
Min Stock Value in Time
Span
Min Stock Value in specified period.
Max Stock Quantity in
Time Span
Max Stock Quantity in specified period.
Min Stock Quantity in
Time Span
Min Stock Quantity in specified period.
% of Total Invoiced
Quantity
Percent of Invoiced quantity of all transactions - regardless if following filters
are active: Date, Document Inventory, Gen Bus Posting Group,
Gen Prod Posting Group, Item, Item Ledger Entry Type, Location, Reason
Code, Source Code
% of Total Value Percent of Invoiced cost amount of all transactions - regardless if following
filters are active: Date, Document Inventory, Gen Bus Posting Group,
Gen Prod Posting Group, Item, Item Ledger Entry Type, Location, Reason
Code, Source Code
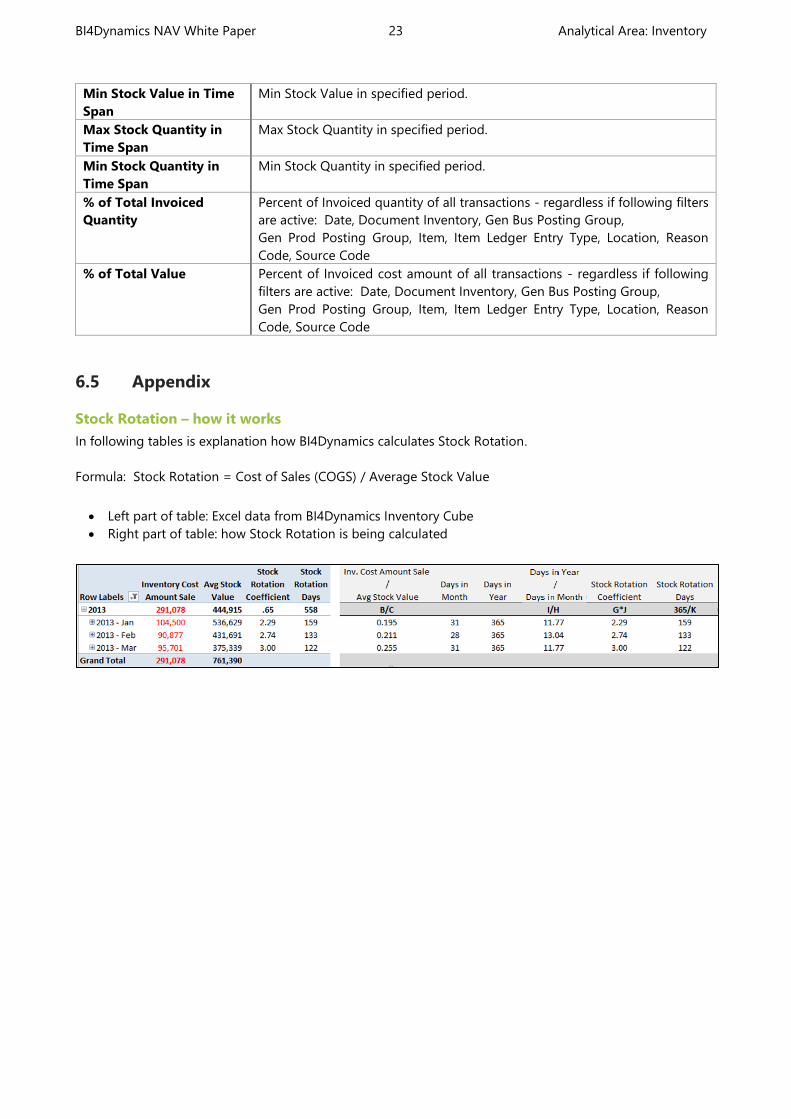
6.5 Appendix
Stock Rotation – how it works
In following tables is explanation how BI4Dynamics calculates Stock Rotation.
Formula: Stock Rotation = Cost of Sales (COGS) / Average Stock Value
Left part of table: Excel data from BI4Dynamics Inventory Cube
Right part of table: how Stock Rotation is being calculated
BI4Dynamics NAV White Paper 24 Analytical Area: Jobs and Resources
7 ANALYTICAL AREA: JOBS AND RESOURCES
Powerful analysis of jobs and resource, which can provide the answer related to budgets, costs and profits on
different open jobs in just one report. Costs and profit can be viewed per hour on specific items or resources.
One of the key advantages is the ability to compare budgets, costs and profit at same time in one report for a
specific project.
Jobs and resources distinguish between MS NAV versions. So module “Jobs and Resources” differs for NAV 4.0
and from NAV 5.0 up.
7.1 Extending functionality of MS Dynamics NAV
Main advantages:
It provides easy cost checking over jobs, items and resources
it provides easy budget checking over jobs, items and resources
it provides cost, budget and profit checking per hour on different dimensions
multiple companies
8 Global dimensions to slice with other dimensions
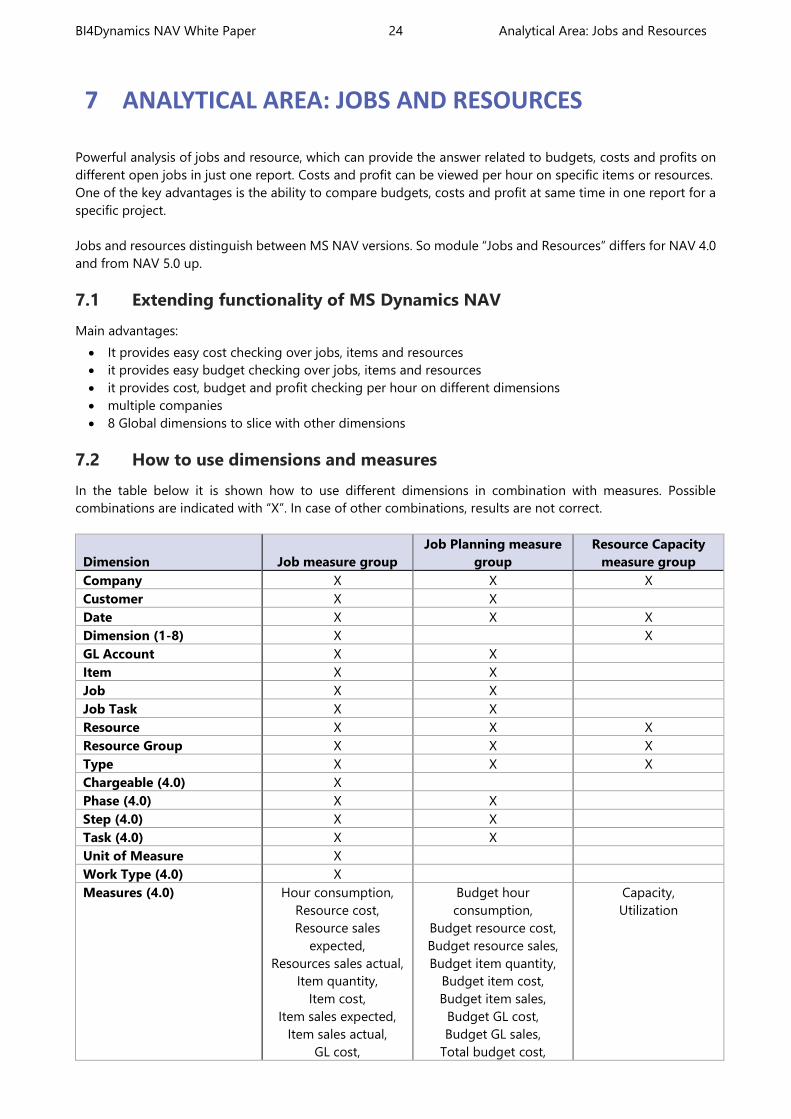
7.2 How to use dimensions and measures
In the table below it is shown how to use different dimensions in combination with measures. Possible
combinations are indicated with “X”. In case of other combinations, results are not correct.
Dimension Job measure group
Job Planning measure
group
Resource Capacity
measure group
Company X X X
Customer X X
Date X X X
Dimension (1-8) X X
GL Account X X
Item X X
Job X X
Job Task X X
Resource X X X
Resource Group X X X
Type X X X
Chargeable (4.0) X
Phase (4.0) X X
Step (4.0) X X
Task (4.0) X X
Unit of Measure X
Work Type (4.0) X
Measures (4.0) Hour consumption,
Resource cost,
Resource sales
expected,
Resources sales actual,
Item quantity,
Item cost,
Item sales expected,
Item sales actual,
GL cost,
Budget hour
consumption,
Budget resource cost,
Budget resource sales,
Budget item quantity,
Budget item cost,
Budget item sales,
Budget GL cost,
Budget GL sales,
Total budget cost,
Capacity,
Utilization

BI4Dynamics NAV White Paper 25 Analytical Area: Jobs and Resources
GL sales,
Item profit,
Item profit%,
Resource sales/h,
Resource profit,
Resource profit%,
Resource profit/h,
Total cost,
Total sales,
Total sales/h,
Total profit,
Total profit%,
Total profit/h,
Invoice rate,
Markup % ,
WIP
Total budget sales
Measures (5.0+) Hour consumption,
Resource cost,
Resource sales
expected,
Resources sales actual,
Item quantity,
Item cost,
Item sales expected,
Item sales actual,
GL cost,
GL sales,
Item profit,
Item profit%,
Resource sales/h,
Resource profit,
Resource profit%,
Resource profit/h,
Total cost,
Total sales,
Total sales/h,
Total profit,
Total profit%,
Total profit/h
Total contracted cost,
Total contracted sales,
Total scheduled cost,
Total scheduled sales,
Contracted hour
consumption,
Contracted resource
cost,
Contracted resource
sales,
Scheduled hour
consumption,
Scheduled resource cost,
Scheduled resource
sales,
Contracted item cost,
Contracted item
quantity,
Contracted item sales,
Scheduled item cost,
Scheduled item quantity,
Scheduled item sales,
Contracted GL cost,
Contracted GL sales,
Scheduled GL cost,
Scheduled GL sales
Capacity,
Utilization
7.3 Dimensions
Date
Date dimension is used to observe costs, budgets and profits over time and to filter data on a specific date
interval.
Measure group Date field in MS Dynamics NAV
Job measure group Posting Date.
(Resource Planning – Jobs – Jobs –Job – table Ledger Entry )
Job Planning measure
group
Date (NAV 4.0)/Planning Date.
(Resource Planning – Jobs – Jobs –Planning – table Job Budget Entry (NAV
4.0)/table Job Planning Line )
BI4Dynamics NAV White Paper 26 Analytical Area: Jobs and Resources
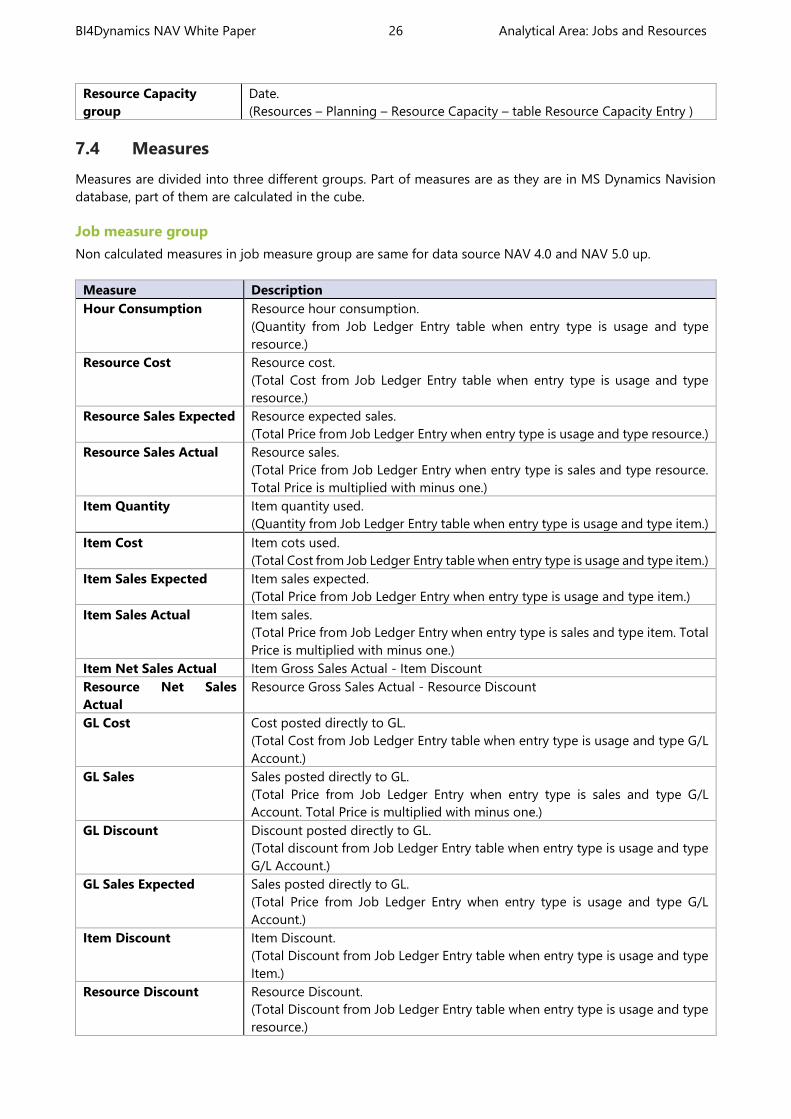
7.4 Measures
Measures are divided into three different groups. Part of measures are as they are in MS Dynamics Navision
database, part of them are calculated in the cube.
Job measure group
Non calculated measures in job measure group are same for data source NAV 4.0 and NAV 5.0 up.
Measure Description
Hour Consumption Resource hour consumption.
(Quantity from Job Ledger Entry table when entry type is usage and type
resource.)
Resource Cost Resource cost.
(Total Cost from Job Ledger Entry table when entry type is usage and type
resource.)
Resource Sales Expected Resource expected sales.
(Total Price from Job Ledger Entry when entry type is usage and type resource.)
Resource Sales Actual Resource sales.
(Total Price from Job Ledger Entry when entry type is sales and type resource.
Total Price is multiplied with minus one.)
Item Quantity Item quantity used.
(Quantity from Job Ledger Entry table when entry type is usage and type item.)
Item Cost Item cots used.
(Total Cost from Job Ledger Entry table when entry type is usage and type item.)
Item Sales Expected Item sales expected.
(Total Price from Job Ledger Entry when entry type is usage and type item.)
Item Sales Actual Item sales.
(Total Price from Job Ledger Entry when entry type is sales and type item. Total
Price is multiplied with minus one.)
Item Net Sales Actual Item Gross Sales Actual - Item Discount
Resource Net Sales
Actual
Resource Gross Sales Actual - Resource Discount
GL Cost Cost posted directly to GL.
(Total Cost from Job Ledger Entry table when entry type is usage and type G/L
Account.)
GL Sales Sales posted directly to GL.
(Total Price from Job Ledger Entry when entry type is sales and type G/L
Account. Total Price is multiplied with minus one.)
GL Discount Discount posted directly to GL.
(Total discount from Job Ledger Entry table when entry type is usage and type
G/L Account.)
GL Sales Expected Sales posted directly to GL.
(Total Price from Job Ledger Entry when entry type is usage and type G/L
Account.)
Item Discount Item Discount.
(Total Discount from Job Ledger Entry table when entry type is usage and type
Item.)
Resource Discount Resource Discount.
(Total Discount from Job Ledger Entry table when entry type is usage and type
resource.)
Resource Capacity
group
Date.
(Resources – Planning – Resource Capacity – table Resource Capacity Entry )
BI4Dynamics NAV White Paper 27 Analytical Area: Jobs and Resources
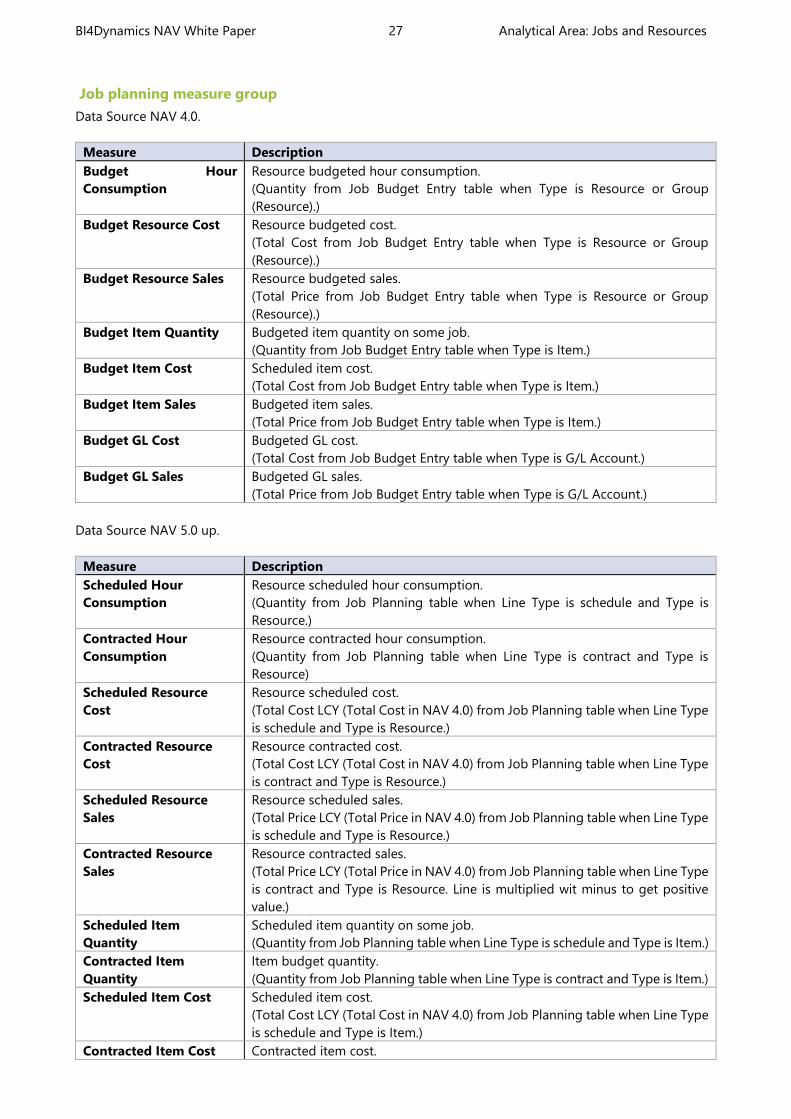
Job planning measure group
Data Source NAV 4.0.
Measure Description
Budget Hour
Consumption
Resource budgeted hour consumption.
(Quantity from Job Budget Entry table when Type is Resource or Group
(Resource).)
Budget Resource Cost Resource budgeted cost.
(Total Cost from Job Budget Entry table when Type is Resource or Group
(Resource).)
Budget Resource Sales Resource budgeted sales.
(Total Price from Job Budget Entry table when Type is Resource or Group
(Resource).)
Budget Item Quantity Budgeted item quantity on some job.
(Quantity from Job Budget Entry table when Type is Item.)
Budget Item Cost Scheduled item cost.
(Total Cost from Job Budget Entry table when Type is Item.)
Budget Item Sales Budgeted item sales.
(Total Price from Job Budget Entry table when Type is Item.)
Budget GL Cost Budgeted GL cost.
(Total Cost from Job Budget Entry table when Type is G/L Account.)
Budget GL Sales Budgeted GL sales.
(Total Price from Job Budget Entry table when Type is G/L Account.)
Data Source NAV 5.0 up.
Measure Description
Scheduled Hour
Consumption
Resource scheduled hour consumption.
(Quantity from Job Planning table when Line Type is schedule and Type is
Resource.)
Contracted Hour
Consumption
Resource contracted hour consumption.
(Quantity from Job Planning table when Line Type is contract and Type is
Resource)
Scheduled Resource
Cost
Resource scheduled cost.
(Total Cost LCY (Total Cost in NAV 4.0) from Job Planning table when Line Type
is schedule and Type is Resource.)
Contracted Resource
Cost
Resource contracted cost.
(Total Cost LCY (Total Cost in NAV 4.0) from Job Planning table when Line Type
is contract and Type is Resource.)
Scheduled Resource
Sales
Resource scheduled sales.
(Total Price LCY (Total Price in NAV 4.0) from Job Planning table when Line Type
is schedule and Type is Resource.)
Contracted Resource
Sales
Resource contracted sales.
(Total Price LCY (Total Price in NAV 4.0) from Job Planning table when Line Type
is contract and Type is Resource. Line is multiplied wit minus to get positive
value.)
Scheduled Item
Quantity
Scheduled item quantity on some job.
(Quantity from Job Planning table when Line Type is schedule and Type is Item.)
Contracted Item
Quantity
Item budget quantity.
(Quantity from Job Planning table when Line Type is contract and Type is Item.)
Scheduled Item Cost Scheduled item cost.
(Total Cost LCY (Total Cost in NAV 4.0) from Job Planning table when Line Type
is schedule and Type is Item.)
Contracted Item Cost Contracted item cost.

BI4Dynamics NAV White Paper 28 Analytical Area: Jobs and Resources
(Total Cost LCY (Total Cost in NAV 4.0) from Job Planning table when Line Type
is contract and Type is Item.)
Scheduled Item Sales Scheduled item sales.
(Total Price LCY (Total Price in NAV 4.0) from Job Planning table when Line Type
is schedule and Type is Item.)
Contracted Item Sales Contracted item sales.
(Total Price LCY (Total Price in NAV 4.0) from Job Planning table when Line Type
is contract and Type is Item. Line is multiplied with minus to get positive value.)
Contracted Item
Discount
Contracted Item Discount.
(Total Discount from Job Planning table when Line Type is contract and Type is
Item.)
Scheduled Item
Discount
Scheduled Item Discount.
(Total Discount from Job Planning table when Line Type is schedule and Type
is Item.)
Contracted Item Net
Sales
Contracted Item Net Sales.
(Total Net Sales from Job Planning table when Line Type is contract and Type
is Item.)
Scheduled Item Net
Sales
Scheduled Item Net Sales.
(Total Net Sales from Job Planning table when Line Type is schedule and Type
is Item.)
Contracted Resource
Net Sales
Contracted Resource Net Sales.
(Total Net Sales from Job Planning table when Line Type is contract and Type
is Resource.)
Scheduled Resource Net
Sales
Scheduled Resource Net Sales.
(Total Net Sales from Job Planning table when Line Type is scheduled and Type
is Resource.)
Contracted Resource
Discount
Contracted Resource Discount.
(Total Discount from Job Planning table when Line Type is contract and Type is
Resource.)
Scheduled Resource
Discount
Scheduled Resource Discount.
(Total Discount from Job Planning table when Line Type is schedule and Type
is Resource.)
Contracted Resource
Profit
Contracted Resource Profit.
(Total Profit from Job Planning table when Line Type is contracted and Type is
Resource.)
Scheduled GL Cost Scheduled GL cost.
(Total Cost LCY (Total Cost in NAV 4.0) from Job Planning table when Line Type
is schedule and Type is G/L Account.)
Contracted GL Cost Contracted GL cost.
(Total Cost LCY (Total Cost in NAV 4.0) from Job Planning table when Line Type
is contract and Type is G/L Account.)
Scheduled GL Sales Scheduled GL sales.
(Total Price LCY (Total Price in NAV 4.0) from Job Planning table when Line Type
is schedule and Type is G/L Account.)
Contracted GL Sales Contracted GL sales.
(Total Price LCY (Total Price in NAV 4.0) from Job Planning table when Line Type
is contract and Type is G/L Account.)
Scheduled GL Discount Scheduled GL Discount.
(Total Discount from Job Planning table when Line Type is schedule and Type
is GL.)
Contracted GL Discount Contracted GL Discount.
(Total Discount from Job Planning table when Line Type is contract and Type is
GL.)
Contracted GL Net Sales Contracted GL Net Sales.
BI4Dynamics NAV White Paper 29 Analytical Area: Jobs and Resources
(Total Net Sales from Job Planning table when Line Type is contract and Type
is GL.)
Scheduled GL Net Sales Scheduled GL Net Sales.
(Total Net Sales from Job Planning table when Line Type is schedule and Type
is GL.)
Contracted GL Profit Contracted GL Profit.
(Total Profit from Job Planning table when Line Type is contracted and Type is
GL.)
Contracted Item Profit Contracted Item Profit.
(Total Profit from Job Planning table when Line Type is contracted and Type is
Item.)
Resource capacity measure group
Measure Description
Capacity Resource capacity.
(Capacity from table Res. Capacity Entry table.)
Calculated measures
Data Source NAV 4.0.
Measure Description
Item Profit Item sales actual – Item cost.
Item Profit % Item profit/Item sales actual.
Resource Sales/H Resources sales actual/Hour consumption.
Resource Profit Resource sales actual – Resource cost.
Resource Profit % Resource profit/Resource sales actual.
Resource Profit/H Resource profit/Hour consumption.
Total Cost GL cost + Item cost + Resource cost.
Total Sales GL sales + Item sales actual + Resource sales actual.
Total Sales/H Total sales/Hour consumption.
Total Profit Total sales – Total cost.
Total Profit % Total profit/Total sales.
Total Profit/H Total profit/Hour consumption.
Invoice Rate Hour consumption (when charged)/Hour consumption.
Markup % Total sales (when charged)/Total cost – 1.
WIP Remaining amount.
Utilization Hour consumption/Capacity.
Total Budget Cost Budget item cost + Budget resource cost.
Total Budget Sales Budget item sales + Budget resource sales.
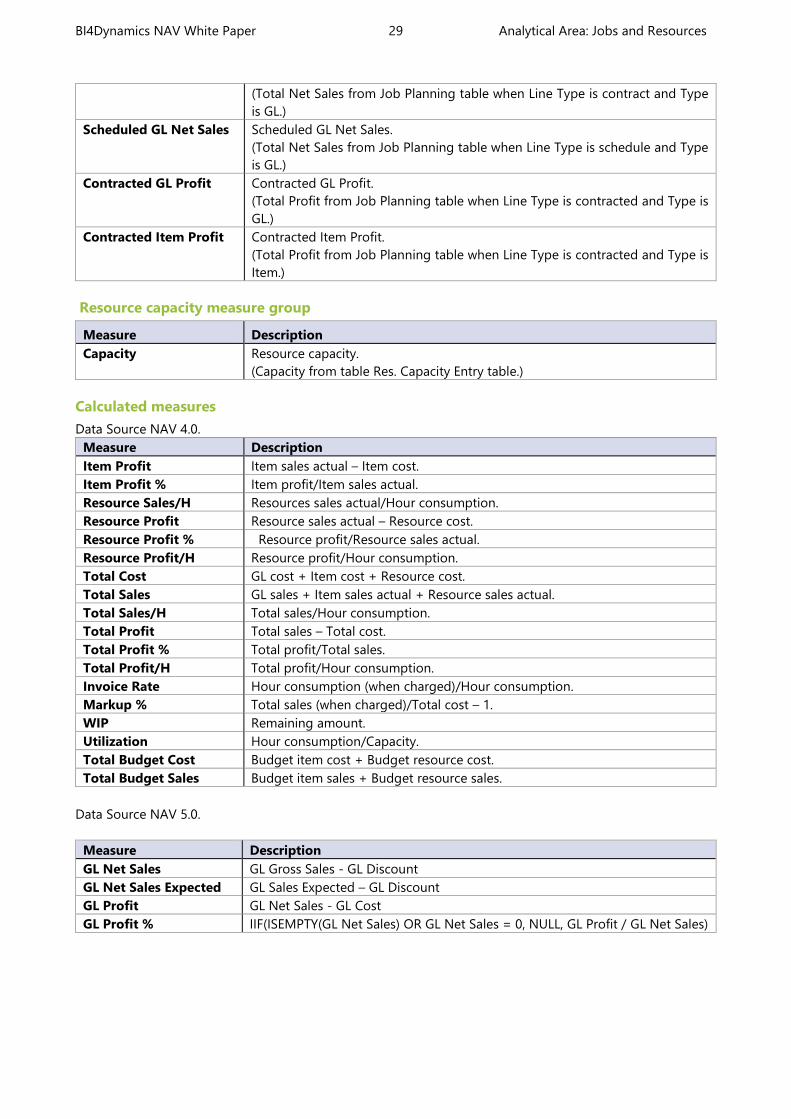
Data Source NAV 5.0.
Measure Description
GL Net Sales GL Gross Sales - GL Discount
GL Net Sales Expected GL Sales Expected – GL Discount
GL Profit GL Net Sales - GL Cost
GL Profit % IIF(ISEMPTY(GL Net Sales) OR GL Net Sales = 0, NULL, GL Profit / GL Net Sales)
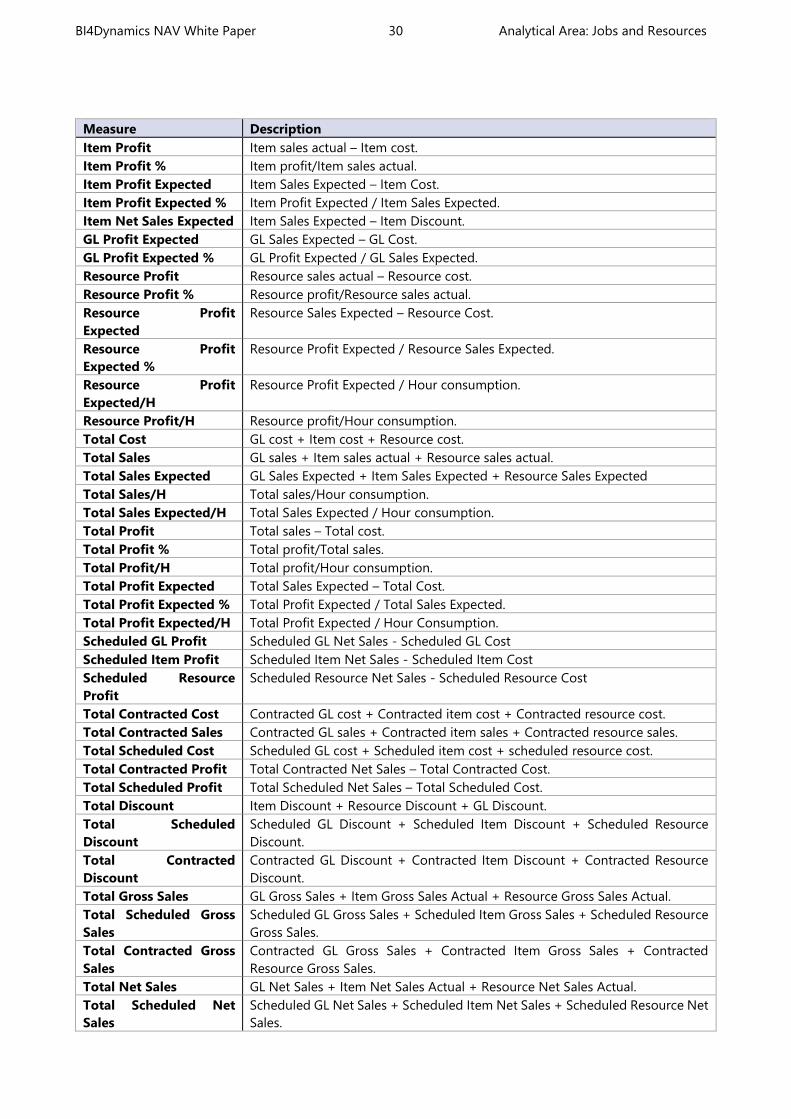
BI4Dynamics NAV White Paper 30 Analytical Area: Jobs and Resources
Measure Description
Item Profit Item sales actual – Item cost.
Item Profit % Item profit/Item sales actual.
Item Profit Expected Item Sales Expected – Item Cost.
Item Profit Expected % Item Profit Expected / Item Sales Expected.
Item Net Sales Expected Item Sales Expected – Item Discount.
GL Profit Expected GL Sales Expected – GL Cost.
GL Profit Expected % GL Profit Expected / GL Sales Expected.
Resource Profit Resource sales actual – Resource cost.
Resource Profit % Resource profit/Resource sales actual.
Resource Profit
Expected
Resource Sales Expected – Resource Cost.
Resource Profit
Expected %
Resource Profit Expected / Resource Sales Expected.
Resource Profit
Expected/H
Resource Profit Expected / Hour consumption.
Resource Profit/H Resource profit/Hour consumption.
Total Cost GL cost + Item cost + Resource cost.
Total Sales GL sales + Item sales actual + Resource sales actual.
Total Sales Expected GL Sales Expected + Item Sales Expected + Resource Sales Expected
Total Sales/H Total sales/Hour consumption.
Total Sales Expected/H Total Sales Expected / Hour consumption.
Total Profit Total sales – Total cost.
Total Profit % Total profit/Total sales.
Total Profit/H Total profit/Hour consumption.
Total Profit Expected Total Sales Expected – Total Cost.
Total Profit Expected % Total Profit Expected / Total Sales Expected.
Total Profit Expected/H Total Profit Expected / Hour Consumption.
Scheduled GL Profit Scheduled GL Net Sales - Scheduled GL Cost
Scheduled Item Profit Scheduled Item Net Sales - Scheduled Item Cost
Scheduled Resource
Profit
Scheduled Resource Net Sales - Scheduled Resource Cost
Total Contracted Cost Contracted GL cost + Contracted item cost + Contracted resource cost.
Total Contracted Sales Contracted GL sales + Contracted item sales + Contracted resource sales.
Total Scheduled Cost Scheduled GL cost + Scheduled item cost + scheduled resource cost.
Total Contracted Profit Total Contracted Net Sales – Total Contracted Cost.
Total Scheduled Profit Total Scheduled Net Sales – Total Scheduled Cost.
Total Discount Item Discount + Resource Discount + GL Discount.
Total Scheduled
Discount
Scheduled GL Discount + Scheduled Item Discount + Scheduled Resource
Discount.
Total Contracted
Discount
Contracted GL Discount + Contracted Item Discount + Contracted Resource
Discount.
Total Gross Sales GL Gross Sales + Item Gross Sales Actual + Resource Gross Sales Actual.
Total Scheduled Gross
Sales
Scheduled GL Gross Sales + Scheduled Item Gross Sales + Scheduled Resource
Gross Sales.
Total Contracted Gross
Sales
Contracted GL Gross Sales + Contracted Item Gross Sales + Contracted
Resource Gross Sales.
Total Net Sales GL Net Sales + Item Net Sales Actual + Resource Net Sales Actual.
Total Scheduled Net
Sales
Scheduled GL Net Sales + Scheduled Item Net Sales + Scheduled Resource Net
Sales.
BI4Dynamics NAV White Paper 31 Analytical Area: Jobs and Resources
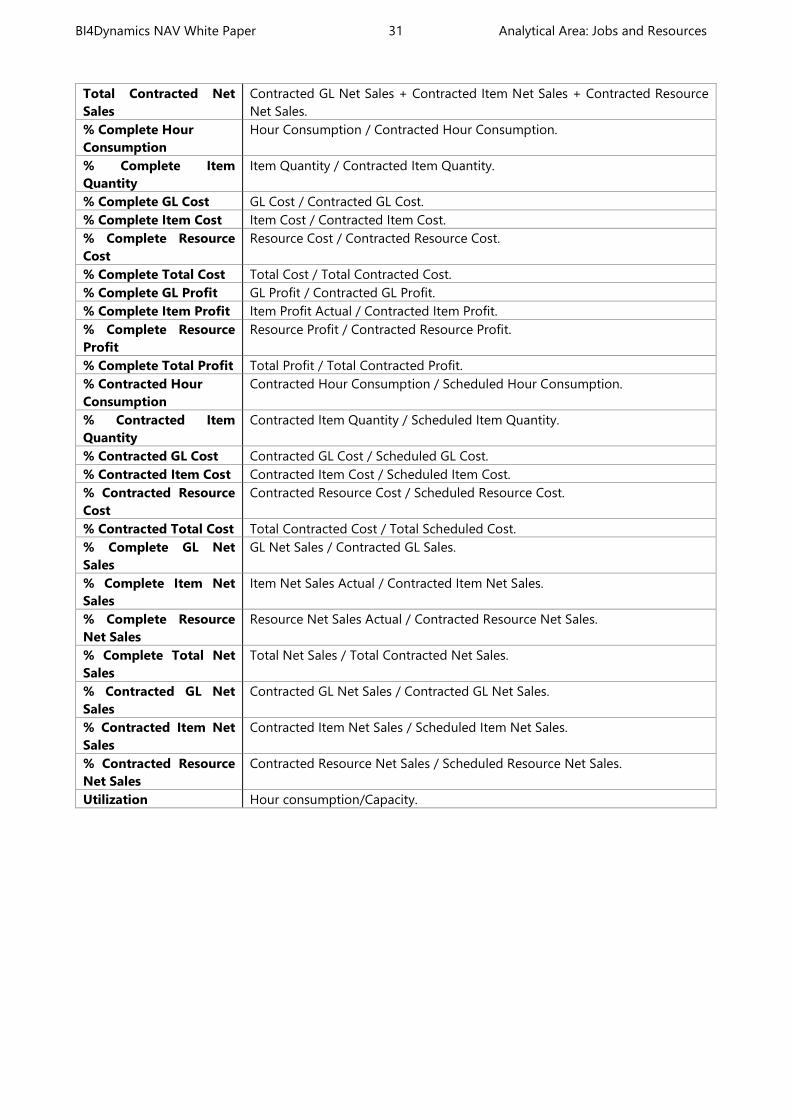
Total Contracted Net
Sales
Contracted GL Net Sales + Contracted Item Net Sales + Contracted Resource
Net Sales.
% Complete Hour
Consumption
Hour Consumption / Contracted Hour Consumption.
% Complete Item
Quantity
Item Quantity / Contracted Item Quantity.
% Complete GL Cost GL Cost / Contracted GL Cost.
% Complete Item Cost Item Cost / Contracted Item Cost.
% Complete Resource
Cost
Resource Cost / Contracted Resource Cost.
% Complete Total Cost Total Cost / Total Contracted Cost.
% Complete GL Profit GL Profit / Contracted GL Profit.
% Complete Item Profit Item Profit Actual / Contracted Item Profit.
% Complete Resource
Profit
Resource Profit / Contracted Resource Profit.
% Complete Total Profit Total Profit / Total Contracted Profit.
% Contracted Hour
Consumption
Contracted Hour Consumption / Scheduled Hour Consumption.
% Contracted Item
Quantity
Contracted Item Quantity / Scheduled Item Quantity.
% Contracted GL Cost Contracted GL Cost / Scheduled GL Cost.
% Contracted Item Cost Contracted Item Cost / Scheduled Item Cost.
% Contracted Resource
Cost
Contracted Resource Cost / Scheduled Resource Cost.
% Contracted Total Cost Total Contracted Cost / Total Scheduled Cost.
% Complete GL Net
Sales
GL Net Sales / Contracted GL Sales.
% Complete Item Net
Sales
Item Net Sales Actual / Contracted Item Net Sales.
% Complete Resource
Net Sales
Resource Net Sales Actual / Contracted Resource Net Sales.
% Complete Total Net
Sales
Total Net Sales / Total Contracted Net Sales.
% Contracted GL Net
Sales
Contracted GL Net Sales / Contracted GL Net Sales.
% Contracted Item Net
Sales
Contracted Item Net Sales / Scheduled Item Net Sales.
% Contracted Resource
Net Sales
Contracted Resource Net Sales / Scheduled Resource Net Sales.
Utilization Hour consumption/Capacity.
BI4Dynamics NAV White Paper 32 Analytical Area: Manufacturing
8 ANALYTICAL AREA: MANUFACTURING
The Manufacturing module enables the tracking of all activities related to the production of different products.
It is easy to check expected and actual consumption and output costs with quantities. In case of differences
between consumption and output can be checked by run, scrap and stop time over dates, orders, scraps and
stops reason.
8.1 Extending functionality of MS Dynamics NAV
Main advantages:
All information about items and capacities in one place
All about where are items or capacities consumed
All about how has been produced one item
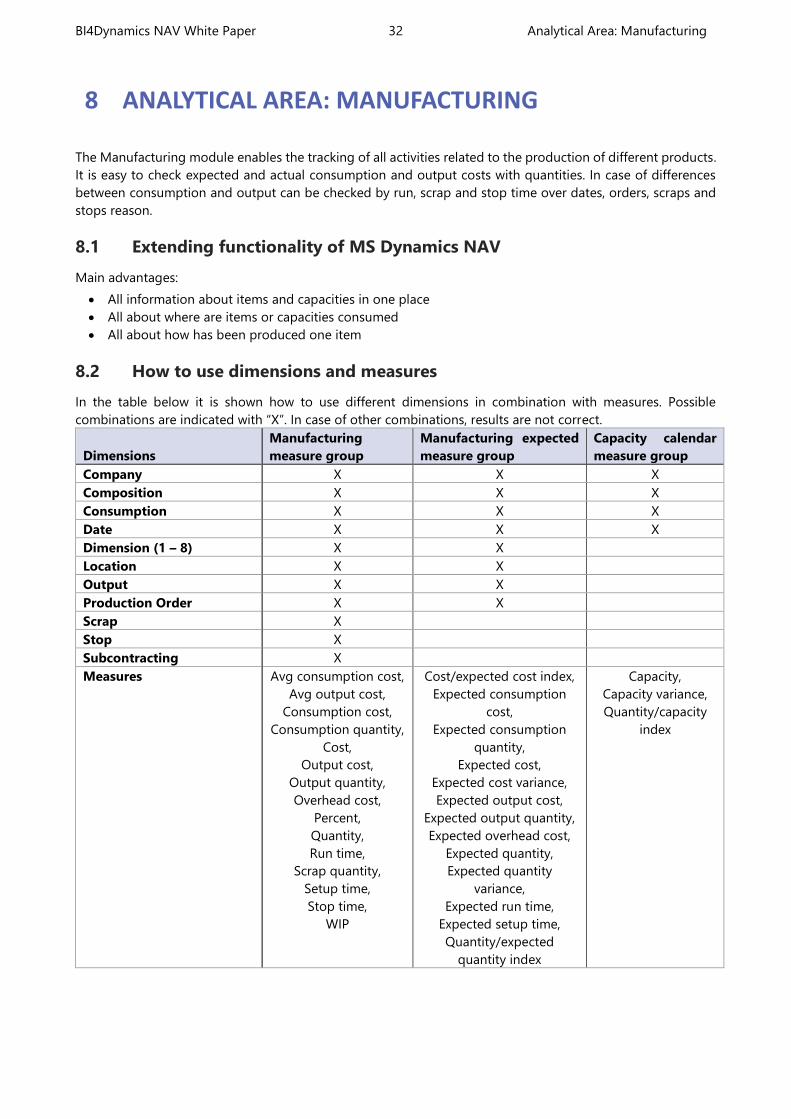
8.2 How to use dimensions and measures
In the table below it is shown how to use different dimensions in combination with measures. Possible
combinations are indicated with “X”. In case of other combinations, results are not correct.
Dimensions
Manufacturing
measure group
Manufacturing expected
measure group
Capacity calendar
measure group
Company X X X
Composition X X X
Consumption X X X
Date X X X
Dimension (1 – 8) X X
Location X X
Output X X
Production Order X X
Scrap X
Stop X
Subcontracting X
Measures Avg consumption cost,
Avg output cost,
Consumption cost,
Consumption quantity,
Cost,
Output cost,
Output quantity,
Overhead cost,
Percent,
Quantity,
Run time,
Scrap quantity,
Setup time,
Stop time,
WIP
Cost/expected cost index,
Expected consumption
cost,
Expected consumption
quantity,
Expected cost,
Expected cost variance,
Expected output cost,
Expected output quantity,
Expected overhead cost,
Expected quantity,
Expected quantity
variance,
Expected run time,
Expected setup time,
Quantity/expected
quantity index
Capacity,
Capacity variance,
Quantity/capacity
index

BI4Dynamics NAV White Paper 33 Analytical Area: Manufacturing
8.3 Dimensions
Date
The Date dimension always have the same meaning, but it depends on measure group date in use.
Measure group Date field in MS Dynamics NAV
Manufacturing measure
group
Posting Date.
(Manufacturing – History – Finished prod. Orders – table Item Ledger Entry,
Capacity Ledger Entry)
Manufacturing Expected
measure group
Due Date.
(Manufacturing – History – Finished prod. Orders – table Prod. Order
Component)
Capacity Calendar measure
group
Date.
(Manufacturing – Capacities – Work Centers (Machine Center) – Planning –
Calendar – table Calendar Entry)
8.4 Measures
Manufacturing measure group
Measure Description
Output Quantity Actual quantity we have on specific output.
(In the case of item it is Quantity from table Item Ledger Entry, where Entry
Type is Output.
When we have capacity Output Quantity is always 0.)
Consumption Quantity Actual quantity used in production.
(In case of item it is Invoiced Quantity from table Value Entry where Item
Ledger Entry Type is Consumption. Measure is multiplied with “-1”, to get
positive value.
When we have capacity it is Quantity from table Capacity Ledger Entry where
Value Entry type is Direct cost.)
Quantity Total quantity of consumption and output.
Scrap Quantity Scrap quantity we had.
(When we have capacity, then it is Scrap Quantity from table Capacity Ledger
Entry.)
Setup Time Setup time.
(When we have capacity, then it is Setup Time from table Capacity Ledger
Entry.)
Run Time Run time of a capacity.
(When we have capacity then it is Run Time from table Capacity Ledger
Entry.)
Stop Time Stop time of a capacity.
(When we have capacity, then it is Stop Time from table Capacity Ledger
Entry.)
Output Cost Actual cost we had on specific output.
(In the case of Item it is Cost Amount Actual from table Value Entry where
Item Ledger Entry Type is Output and Value Entry Type is Indirect Cost.
When we have capacity Actual Output Cost is always 0.)
Consumption Cost Actual cost for used item or a capacity.
(In the case of Item it is Cost Amount Actual from table Value Entry where
Item Ledger Entry Type is Consumption and Value Entry Type is Direct Cost.
Measure is multiplied with “-1”, to get positive value.
When we have capacity it is Cost Amount Actual from table Value Entry
where Value Entry Type is Direct Cost.)
Cost Total cost of consumption and output.
BI4Dynamics NAV White Paper 34 Analytical Area: Manufacturing
Measure Description
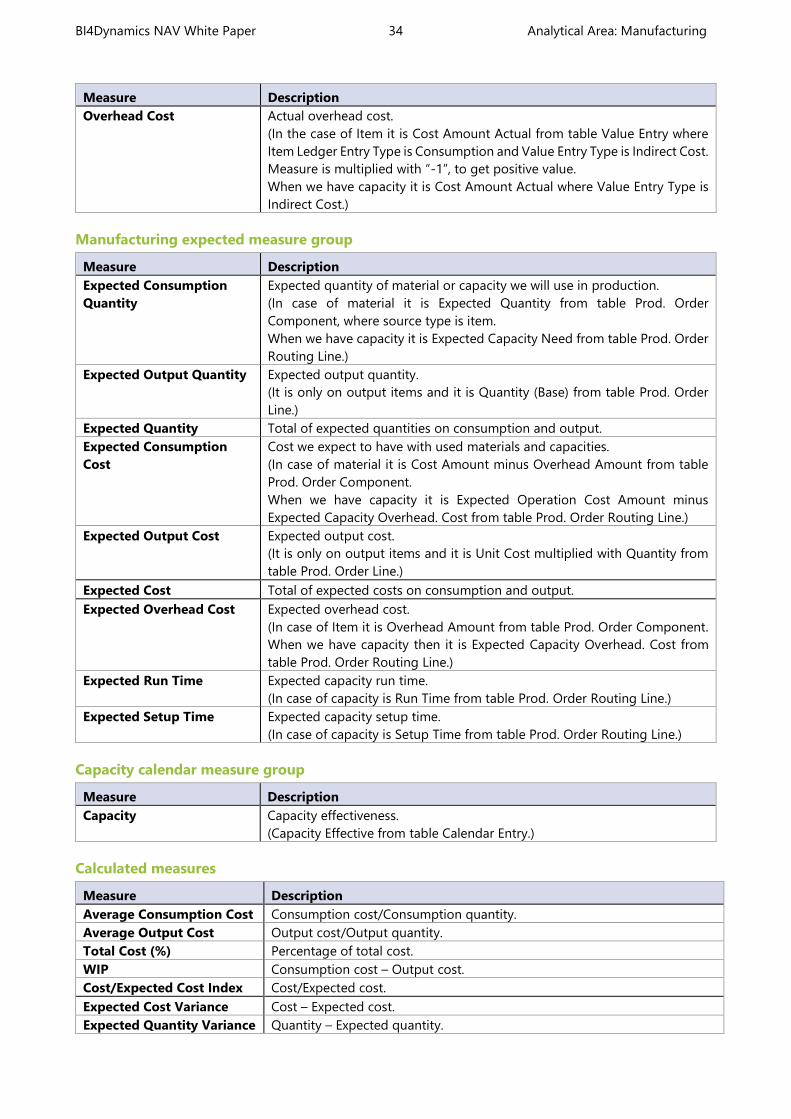
Overhead Cost Actual overhead cost.
(In the case of Item it is Cost Amount Actual from table Value Entry where
Item Ledger Entry Type is Consumption and Value Entry Type is Indirect Cost.
Measure is multiplied with “-1”, to get positive value.
When we have capacity it is Cost Amount Actual where Value Entry Type is
Indirect Cost.)
Manufacturing expected measure group
Measure Description
Expected Consumption
Quantity
Expected quantity of material or capacity we will use in production.
(In case of material it is Expected Quantity from table Prod. Order
Component, where source type is item.
When we have capacity it is Expected Capacity Need from table Prod. Order
Routing Line.)
Expected Output Quantity Expected output quantity.
(It is only on output items and it is Quantity (Base) from table Prod. Order
Line.)
Expected Quantity Total of expected quantities on consumption and output.
Expected Consumption
Cost
Cost we expect to have with used materials and capacities.
(In case of material it is Cost Amount minus Overhead Amount from table
Prod. Order Component.
When we have capacity it is Expected Operation Cost Amount minus
Expected Capacity Overhead. Cost from table Prod. Order Routing Line.)
Expected Output Cost Expected output cost.
(It is only on output items and it is Unit Cost multiplied with Quantity from
table Prod. Order Line.)
Expected Cost Total of expected costs on consumption and output.
Expected Overhead Cost Expected overhead cost.
(In case of Item it is Overhead Amount from table Prod. Order Component.
When we have capacity then it is Expected Capacity Overhead. Cost from
table Prod. Order Routing Line.)
Expected Run Time Expected capacity run time.
(In case of capacity is Run Time from table Prod. Order Routing Line.)
Expected Setup Time Expected capacity setup time.
(In case of capacity is Setup Time from table Prod. Order Routing Line.)
Capacity calendar measure group
Measure Description
Capacity Capacity effectiveness.
(Capacity Effective from table Calendar Entry.)
Calculated measures
Measure Description
Average Consumption Cost Consumption cost/Consumption quantity.
Average Output Cost Output cost/Output quantity.
Total Cost (%) Percentage of total cost.
WIP Consumption cost – Output cost.
Cost/Expected Cost Index Cost/Expected cost.
Expected Cost Variance Cost – Expected cost.
Expected Quantity Variance Quantity – Expected quantity.

BI4Dynamics NAV White Paper 35 Analytical Area: Manufacturing
Measure Description
Quantity/Expected
Quantity Index
Quantity/Expected quantity.
Capacity Variance Quantity – Capacity
Quantity/Capacity Index Quantity/Capacity.
Run Time (%) Percentage of run time.
Setup Time (%) Percentage of setup time.
Stop Time (%) Percentage of stop time.
Expected Run Time (%) Percentage of Expected Run time.
Expected Setup Time (%) Percentage of Expected Setup time.
BI4Dynamics NAV White Paper 36 Analytical Area: Payables
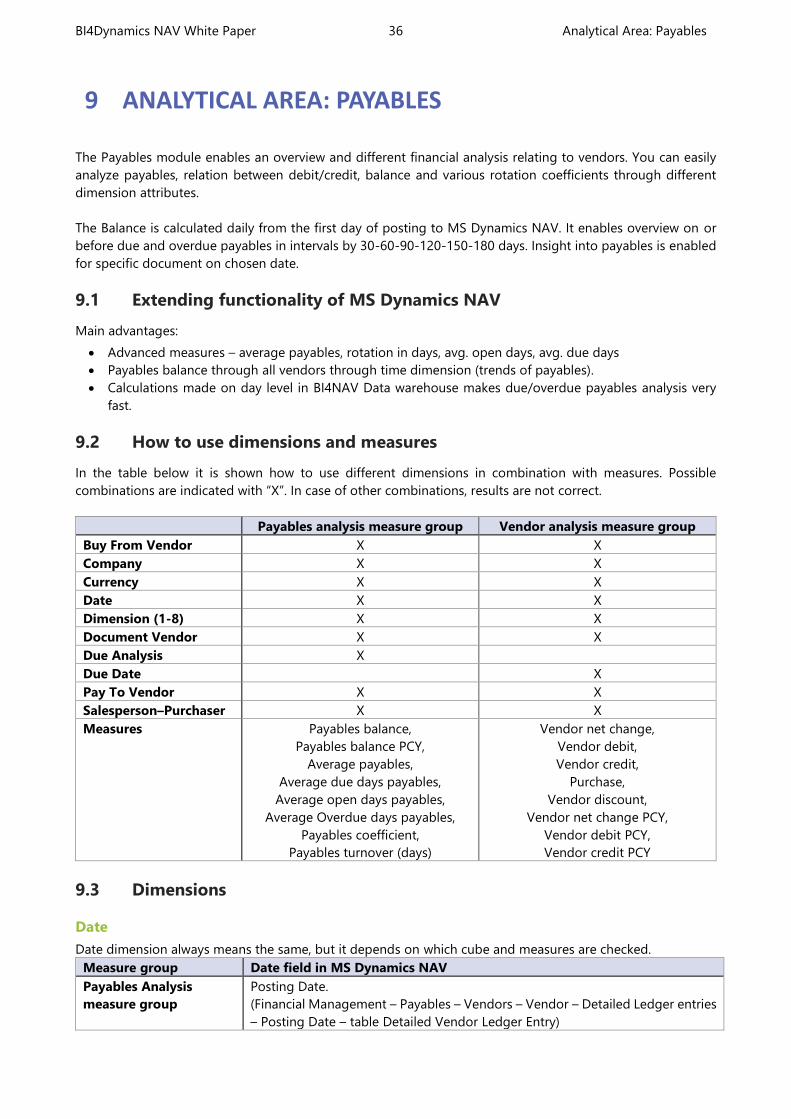
9 ANALYTICAL AREA: PAYABLES
The Payables module enables an overview and different financial analysis relating to vendors. You can easily
analyze payables, relation between debit/credit, balance and various rotation coefficients through different
dimension attributes.
The Balance is calculated daily from the first day of posting to MS Dynamics NAV. It enables overview on or
before due and overdue payables in intervals by 30-60-90-120-150-180 days. Insight into payables is enabled
for specific document on chosen date.
9.1 Extending functionality of MS Dynamics NAV
Main advantages:
Advanced measures – average payables, rotation in days, avg. open days, avg. due days
Payables balance through all vendors through time dimension (trends of payables).
Calculations made on day level in BI4NAV Data warehouse makes due/overdue payables analysis very
fast.
9.2 How to use dimensions and measures
In the table below it is shown how to use different dimensions in combination with measures. Possible
combinations are indicated with “X”. In case of other combinations, results are not correct.
Payables analysis measure group Vendor analysis measure group
Buy From Vendor X X
Company X X
Currency X X
Date X X
Dimension (1-8) X X
Document Vendor X X
Due Analysis X
Due Date X
Pay To Vendor X X
Salesperson–Purchaser X X
Measures Payables balance,
Payables balance PCY,
Average payables,
Average due days payables,
Average open days payables,
Average Overdue days payables,
Payables coefficient,
Payables turnover (days)
Vendor net change,
Vendor debit,
Vendor credit,
Purchase,
Vendor discount,
Vendor net change PCY,
Vendor debit PCY,
Vendor credit PCY
9.3 Dimensions
Date
Date dimension always means the same, but it depends on which cube and measures are checked.
Measure group Date field in MS Dynamics NAV
Payables Analysis
measure group
Posting Date.
(Financial Management – Payables – Vendors – Vendor – Detailed Ledger entries
– Posting Date – table Detailed Vendor Ledger Entry)
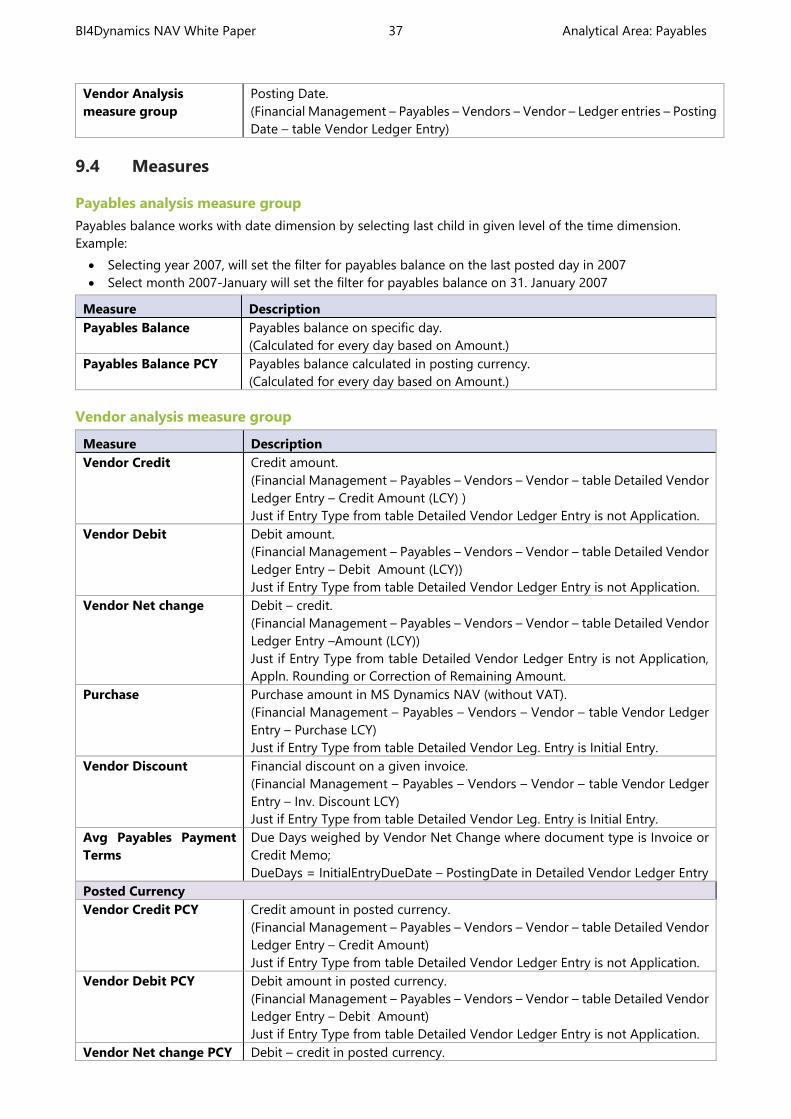
BI4Dynamics NAV White Paper 37 Analytical Area: Payables
Vendor Analysis
measure group
Posting Date.
(Financial Management – Payables – Vendors – Vendor – Ledger entries – Posting
Date – table Vendor Ledger Entry)
9.4 Measures
Payables analysis measure group
Payables balance works with date dimension by selecting last child in given level of the time dimension.
Example:
Selecting year 2007, will set the filter for payables balance on the last posted day in 2007
Select month 2007-January will set the filter for payables balance on 31. January 2007
Measure Description
Payables Balance Payables balance on specific day.
(Calculated for every day based on Amount.)
Payables Balance PCY Payables balance calculated in posting currency.
(Calculated for every day based on Amount.)
Vendor analysis measure group
Measure Description
Vendor Credit Credit amount.
(Financial Management – Payables – Vendors – Vendor – table Detailed Vendor
Ledger Entry – Credit Amount (LCY) )
Just if Entry Type from table Detailed Vendor Ledger Entry is not Application.
Vendor Debit Debit amount.
(Financial Management – Payables – Vendors – Vendor – table Detailed Vendor
Ledger Entry – Debit Amount (LCY))
Just if Entry Type from table Detailed Vendor Ledger Entry is not Application.
Vendor Net change Debit – credit.
(Financial Management – Payables – Vendors – Vendor – table Detailed Vendor
Ledger Entry –Amount (LCY))
Just if Entry Type from table Detailed Vendor Ledger Entry is not Application,
Appln. Rounding or Correction of Remaining Amount.
Purchase Purchase amount in MS Dynamics NAV (without VAT).
(Financial Management – Payables – Vendors – Vendor – table Vendor Ledger
Entry – Purchase LCY)
Just if Entry Type from table Detailed Vendor Leg. Entry is Initial Entry.
Vendor Discount Financial discount on a given invoice.
(Financial Management – Payables – Vendors – Vendor – table Vendor Ledger
Entry – Inv. Discount LCY)
Just if Entry Type from table Detailed Vendor Leg. Entry is Initial Entry.
Avg Payables Payment
Terms
Due Days weighed by Vendor Net Change where document type is Invoice or
Credit Memo;
DueDays = InitialEntryDueDate – PostingDate in Detailed Vendor Ledger Entry
Posted Currency
Vendor Credit PCY Credit amount in posted currency.
(Financial Management – Payables – Vendors – Vendor – table Detailed Vendor
Ledger Entry – Credit Amount)
Just if Entry Type from table Detailed Vendor Ledger Entry is not Application.
Vendor Debit PCY Debit amount in posted currency.
(Financial Management – Payables – Vendors – Vendor – table Detailed Vendor
Ledger Entry – Debit Amount)
Just if Entry Type from table Detailed Vendor Ledger Entry is not Application.
Vendor Net change PCY Debit – credit in posted currency.
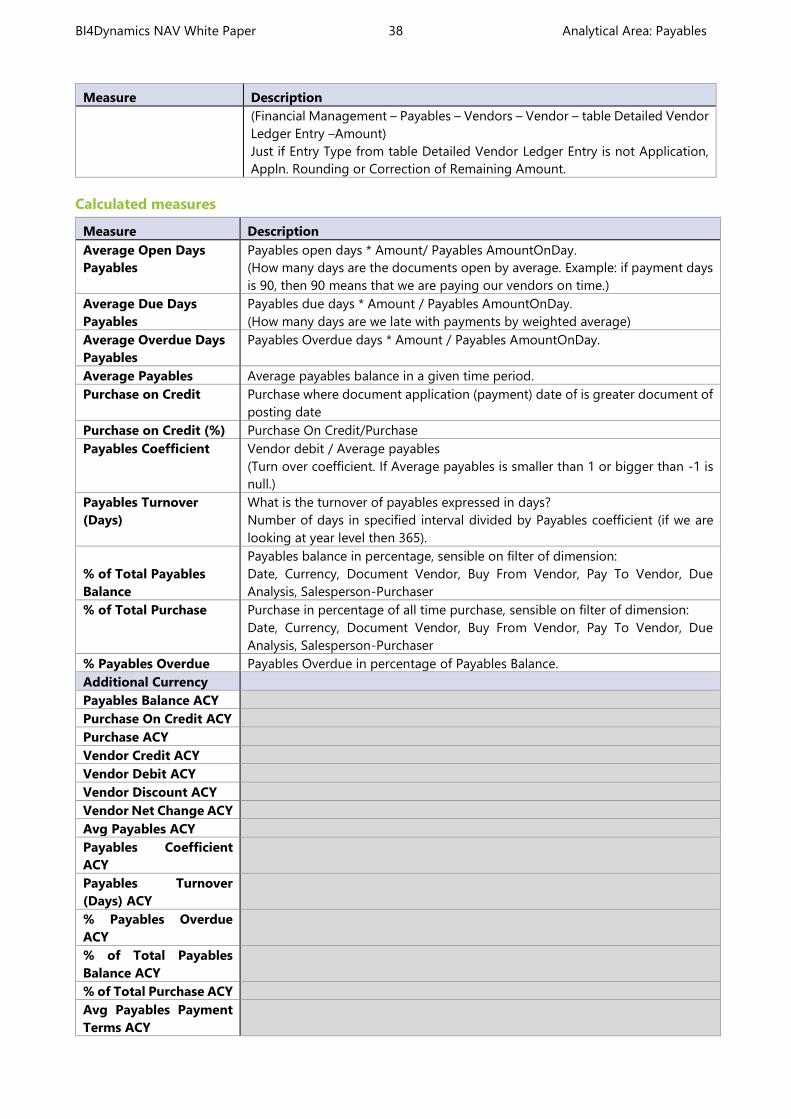
BI4Dynamics NAV White Paper 38 Analytical Area: Payables
Measure Description
(Financial Management – Payables – Vendors – Vendor – table Detailed Vendor
Ledger Entry –Amount)
Just if Entry Type from table Detailed Vendor Ledger Entry is not Application,
Appln. Rounding or Correction of Remaining Amount.
Calculated measures
Measure Description
Average Open Days
Payables
Payables open days * Amount/ Payables AmountOnDay.
(How many days are the documents open by average. Example: if payment days
is 90, then 90 means that we are paying our vendors on time.)
Average Due Days
Payables
Payables due days * Amount / Payables AmountOnDay.
(How many days are we late with payments by weighted average)
Average Overdue Days
Payables
Payables Overdue days * Amount / Payables AmountOnDay.
Average Payables Average payables balance in a given time period.
Purchase on Credit Purchase where document application (payment) date of is greater document of
posting date
Purchase on Credit (%) Purchase On Credit/Purchase
Payables Coefficient Vendor debit / Average payables
(Turn over coefficient. If Average payables is smaller than 1 or bigger than -1 is
null.)
Payables Turnover
(Days)
What is the turnover of payables expressed in days?
Number of days in specified interval divided by Payables coefficient (if we are
looking at year level then 365).
% of Total Payables
Balance
Payables balance in percentage, sensible on filter of dimension:
Date, Currency, Document Vendor, Buy From Vendor, Pay To Vendor, Due
Analysis, Salesperson-Purchaser
% of Total Purchase Purchase in percentage of all time purchase, sensible on filter of dimension:
Date, Currency, Document Vendor, Buy From Vendor, Pay To Vendor, Due
Analysis, Salesperson-Purchaser
% Payables Overdue Payables Overdue in percentage of Payables Balance.
Additional Currency
Payables Balance ACY
Purchase On Credit ACY
Purchase ACY
Vendor Credit ACY
Vendor Debit ACY
Vendor Discount ACY
Vendor Net Change ACY
Avg Payables ACY
Payables Coefficient
ACY
Payables Turnover
(Days) ACY
% Payables Overdue
ACY
% of Total Payables
Balance ACY
% of Total Purchase ACY
Avg Payables Payment
Terms ACY
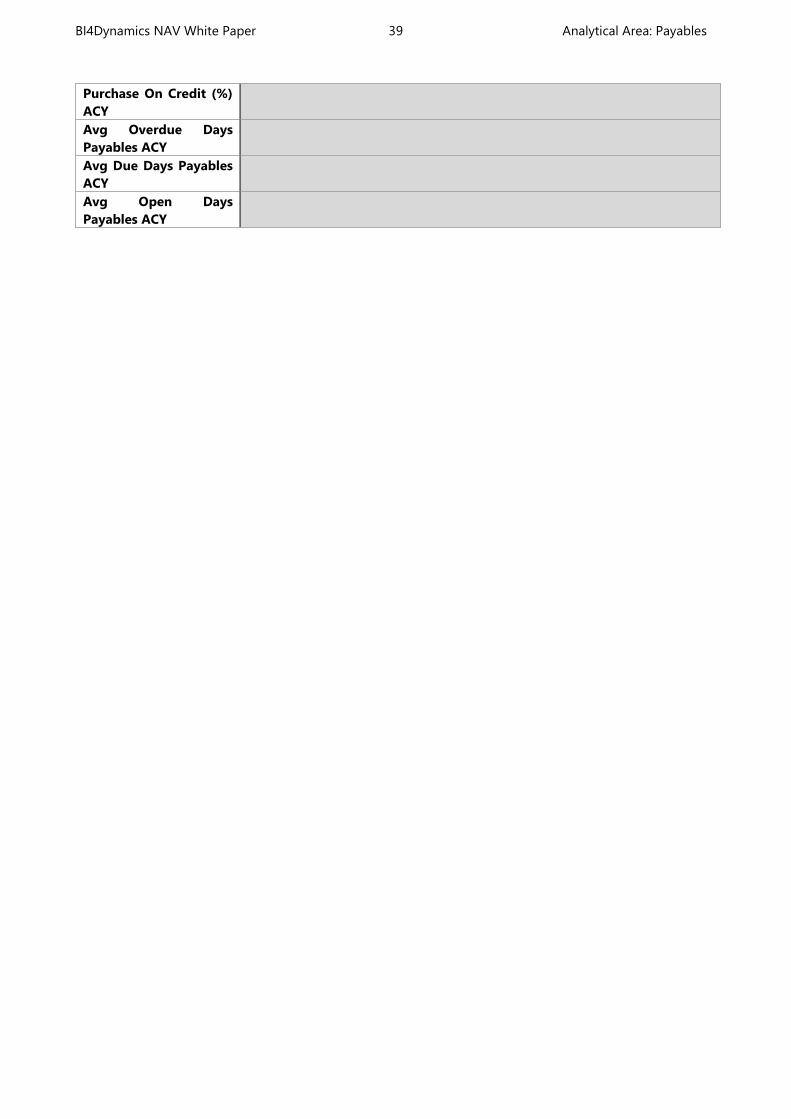
BI4Dynamics NAV White Paper 39 Analytical Area: Payables
Purchase On Credit (%)
ACY
Avg Overdue Days
Payables ACY
Avg Due Days Payables
ACY
Avg Open Days
Payables ACY
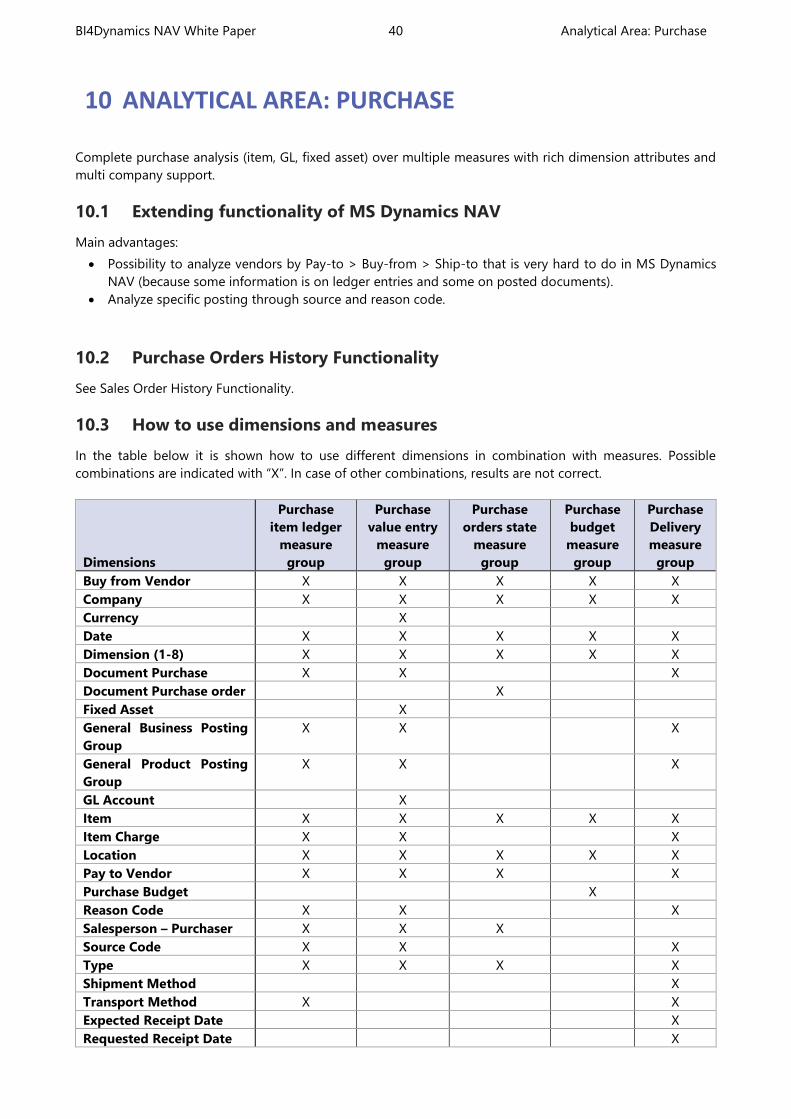
BI4Dynamics NAV White Paper 40 Analytical Area: Purchase
10 ANALYTICAL AREA: PURCHASE
Complete purchase analysis (item, GL, fixed asset) over multiple measures with rich dimension attributes and
multi company support.
10.1 Extending functionality of MS Dynamics NAV
Main advantages:
Possibility to analyze vendors by Pay-to > Buy-from > Ship-to that is very hard to do in MS Dynamics
NAV (because some information is on ledger entries and some on posted documents).
Analyze specific posting through source and reason code.
10.2 Purchase Orders History Functionality
See Sales Order History Functionality.
10.3 How to use dimensions and measures
In the table below it is shown how to use different dimensions in combination with measures. Possible
combinations are indicated with “X”. In case of other combinations, results are not correct.
Dimensions
Purchase
item ledger
measure
group
Purchase
value entry
measure
group
Purchase
orders state
measure
group
Purchase
budget
measure
group
Purchase
Delivery
measure
group
Buy from Vendor X X X X X
Company X X X X X
Currency X
Date X X X X X
Dimension (1-8) X X X X X
Document Purchase X X X
Document Purchase order X
Fixed Asset X
General Business Posting
Group
X X X
General Product Posting
Group
X X X
GL Account X
Item X X X X X
Item Charge X X X
Location X X X X X
Pay to Vendor X X X X
Purchase Budget X
Reason Code X X X
Salesperson – Purchaser X X X
Source Code X X X
Type X X X X
Shipment Method X
Transport Method X X
Expected Receipt Date X
Requested Receipt Date X

BI4Dynamics NAV White Paper 41 Analytical Area: Purchase
Promised Receipt Date X
Planned Receipt Date X
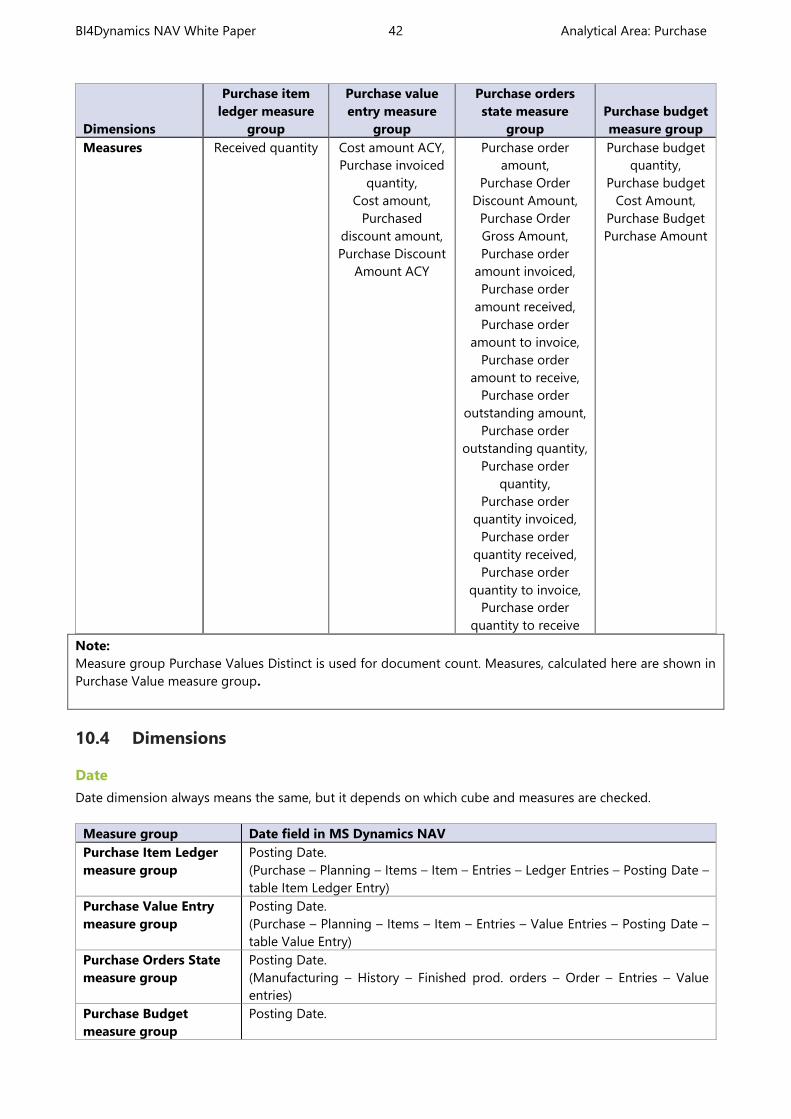
BI4Dynamics NAV White Paper 42 Analytical Area: Purchase
Dimensions
Purchase item
ledger measure
group
Purchase value
entry measure
group
Purchase orders
state measure
group
Purchase budget
measure group
Measures Received quantity Cost amount ACY,
Purchase invoiced
quantity,
Cost amount,
Purchased
discount amount,
Purchase Discount
Amount ACY
Purchase order
amount,
Purchase Order
Discount Amount,
Purchase Order
Gross Amount,
Purchase order
amount invoiced,
Purchase order
amount received,
Purchase order
amount to invoice,
Purchase order
amount to receive,
Purchase order
outstanding amount,
Purchase order
outstanding quantity,
Purchase order
quantity,
Purchase order
quantity invoiced,
Purchase order
quantity received,
Purchase order
quantity to invoice,
Purchase order
quantity to receive
Purchase budget
quantity,
Purchase budget
Cost Amount,
Purchase Budget
Purchase Amount
Note:
Measure group Purchase Values Distinct is used for document count. Measures, calculated here are shown in
Purchase Value measure group.
10.4 Dimensions
Date
Date dimension always means the same, but it depends on which cube and measures are checked.
Measure group Date field in MS Dynamics NAV
Purchase Item Ledger
measure group
Posting Date.
(Purchase – Planning – Items – Item – Entries – Ledger Entries – Posting Date –
table Item Ledger Entry)
Purchase Value Entry
measure group
Posting Date.
(Purchase – Planning – Items – Item – Entries – Value Entries – Posting Date –
table Value Entry)
Purchase Orders State
measure group
Posting Date.
(Manufacturing – History – Finished prod. orders – Order – Entries – Value
entries)
Purchase Budget
measure group
Posting Date.
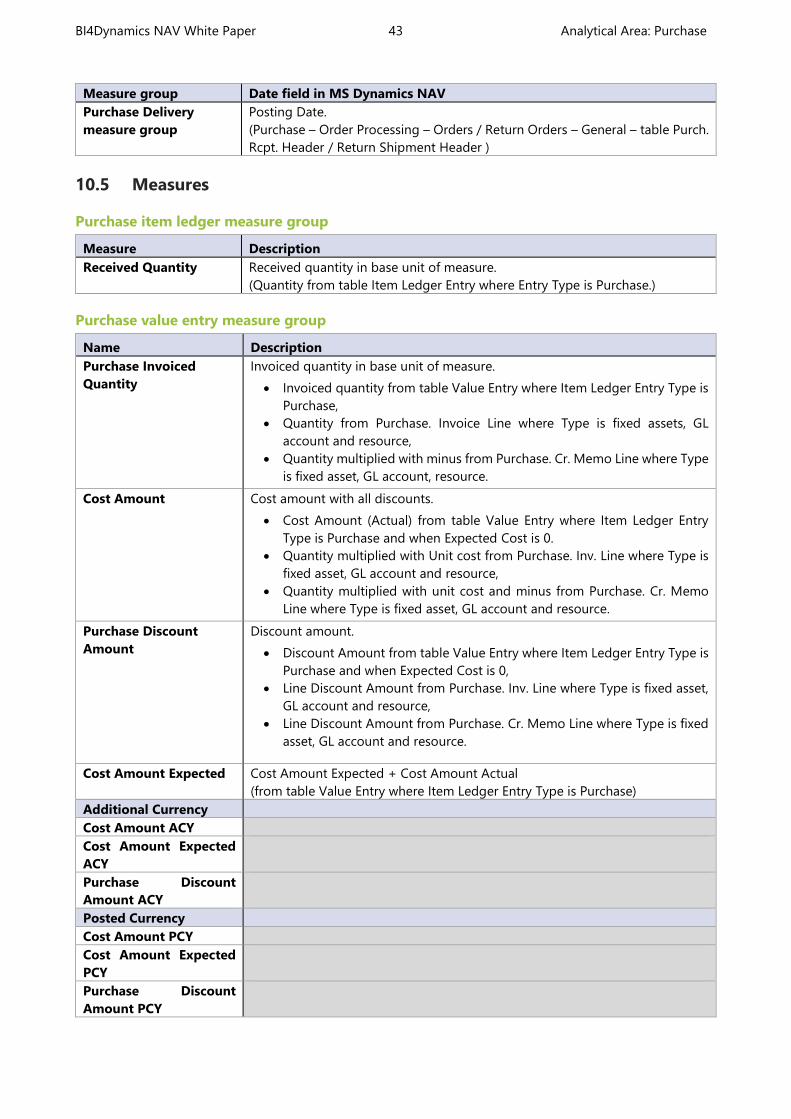
BI4Dynamics NAV White Paper 43 Analytical Area: Purchase
Measure group Date field in MS Dynamics NAV
Purchase Delivery
measure group
Posting Date.
(Purchase – Order Processing – Orders / Return Orders – General – table Purch.
Rcpt. Header / Return Shipment Header )
10.5 Measures
Purchase item ledger measure group
Measure Description
Received Quantity Received quantity in base unit of measure.
(Quantity from table Item Ledger Entry where Entry Type is Purchase.)
Purchase value entry measure group
Name Description
Purchase Invoiced
Quantity
Invoiced quantity in base unit of measure.
Invoiced quantity from table Value Entry where Item Ledger Entry Type is
Purchase,
Quantity from Purchase. Invoice Line where Type is fixed assets, GL
account and resource,
Quantity multiplied with minus from Purchase. Cr. Memo Line where Type
is fixed asset, GL account, resource.
Cost Amount Cost amount with all discounts.
Cost Amount (Actual) from table Value Entry where Item Ledger Entry
Type is Purchase and when Expected Cost is 0.
Quantity multiplied with Unit cost from Purchase. Inv. Line where Type is
fixed asset, GL account and resource,
Quantity multiplied with unit cost and minus from Purchase. Cr. Memo
Line where Type is fixed asset, GL account and resource.
Purchase Discount
Amount
Discount amount.
Discount Amount from table Value Entry where Item Ledger Entry Type is
Purchase and when Expected Cost is 0,
Line Discount Amount from Purchase. Inv. Line where Type is fixed asset,
GL account and resource,
Line Discount Amount from Purchase. Cr. Memo Line where Type is fixed
asset, GL account and resource.
Cost Amount Expected Cost Amount Expected + Cost Amount Actual
(from table Value Entry where Item Ledger Entry Type is Purchase)
Additional Currency
Cost Amount ACY
Cost Amount Expected
ACY
Purchase Discount
Amount ACY
Posted Currency
Cost Amount PCY
Cost Amount Expected
PCY
Purchase Discount
Amount PCY
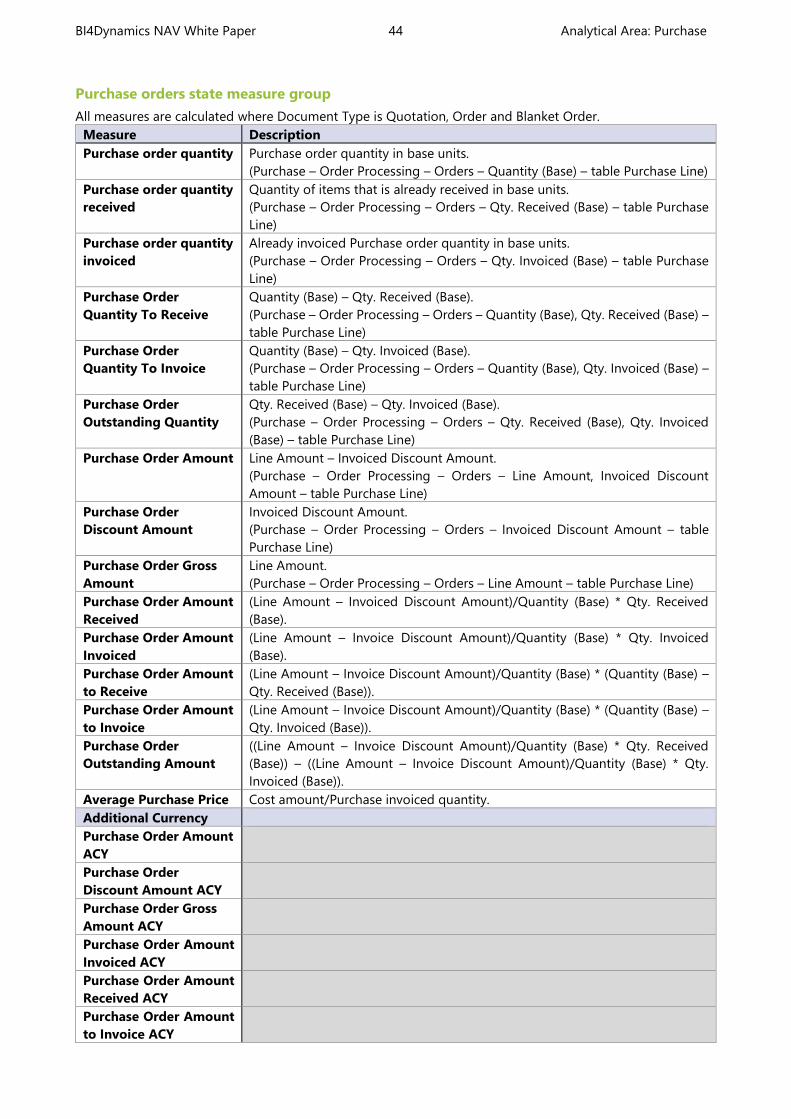
BI4Dynamics NAV White Paper 44 Analytical Area: Purchase
Purchase orders state measure group
All measures are calculated where Document Type is Quotation, Order and Blanket Order.
Measure Description
Purchase order quantity Purchase order quantity in base units.
(Purchase – Order Processing – Orders – Quantity (Base) – table Purchase Line)
Purchase order quantity
received
Quantity of items that is already received in base units.
(Purchase – Order Processing – Orders – Qty. Received (Base) – table Purchase
Line)
Purchase order quantity
invoiced
Already invoiced Purchase order quantity in base units.
(Purchase – Order Processing – Orders – Qty. Invoiced (Base) – table Purchase
Line)
Purchase Order
Quantity To Receive
Quantity (Base) – Qty. Received (Base).
(Purchase – Order Processing – Orders – Quantity (Base), Qty. Received (Base) –
table Purchase Line)
Purchase Order
Quantity To Invoice
Quantity (Base) – Qty. Invoiced (Base).
(Purchase – Order Processing – Orders – Quantity (Base), Qty. Invoiced (Base) –
table Purchase Line)
Purchase Order
Outstanding Quantity
Qty. Received (Base) – Qty. Invoiced (Base).
(Purchase – Order Processing – Orders – Qty. Received (Base), Qty. Invoiced
(Base) – table Purchase Line)
Purchase Order Amount Line Amount – Invoiced Discount Amount.
(Purchase – Order Processing – Orders – Line Amount, Invoiced Discount
Amount – table Purchase Line)
Purchase Order
Discount Amount
Invoiced Discount Amount.
(Purchase – Order Processing – Orders – Invoiced Discount Amount – table
Purchase Line)
Purchase Order Gross
Amount
Line Amount.
(Purchase – Order Processing – Orders – Line Amount – table Purchase Line)
Purchase Order Amount
Received
(Line Amount – Invoiced Discount Amount)/Quantity (Base) * Qty. Received
(Base).
Purchase Order Amount
Invoiced
(Line Amount – Invoice Discount Amount)/Quantity (Base) * Qty. Invoiced
(Base).
Purchase Order Amount
to Receive
(Line Amount – Invoice Discount Amount)/Quantity (Base) * (Quantity (Base) –
Qty. Received (Base)).
Purchase Order Amount
to Invoice
(Line Amount – Invoice Discount Amount)/Quantity (Base) * (Quantity (Base) –
Qty. Invoiced (Base)).
Purchase Order
Outstanding Amount
((Line Amount – Invoice Discount Amount)/Quantity (Base) * Qty. Received
(Base)) – ((Line Amount – Invoice Discount Amount)/Quantity (Base) * Qty.
Invoiced (Base)).
Average Purchase Price Cost amount/Purchase invoiced quantity.
Additional Currency
Purchase Order Amount
ACY
Purchase Order
Discount Amount ACY
Purchase Order Gross
Amount ACY
Purchase Order Amount
Invoiced ACY
Purchase Order Amount
Received ACY
Purchase Order Amount
to Invoice ACY
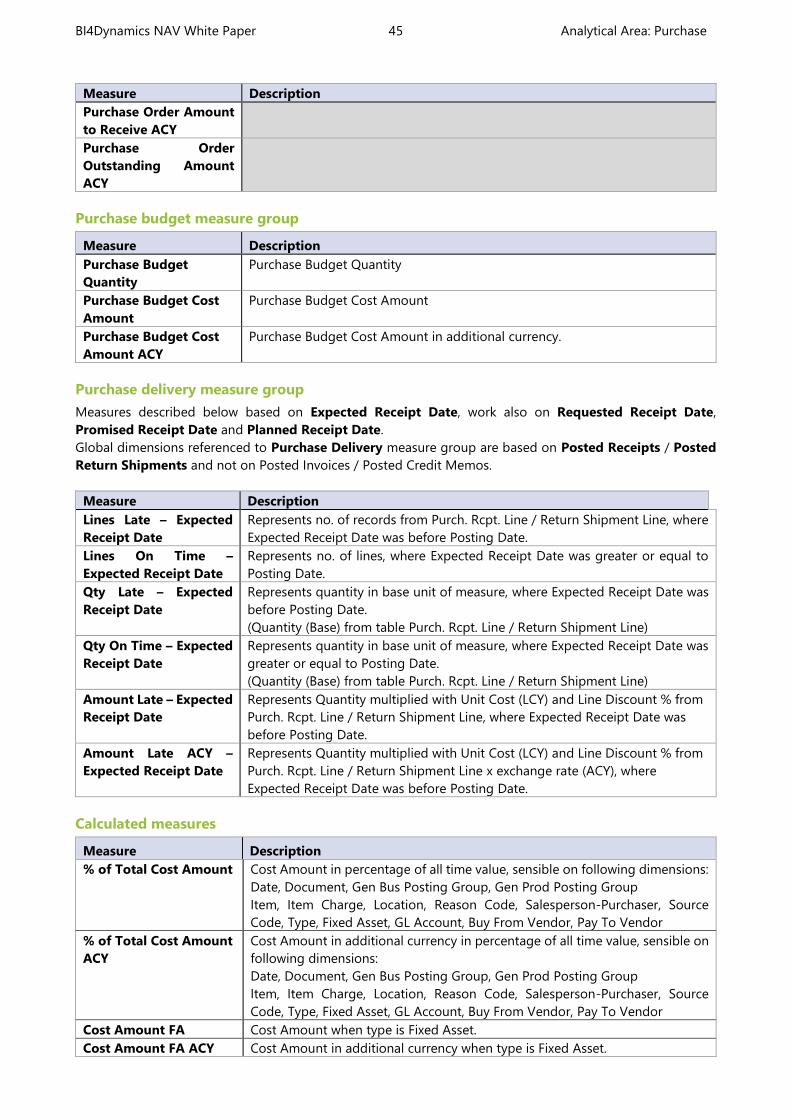
BI4Dynamics NAV White Paper 45 Analytical Area: Purchase
Measure Description
Purchase Order Amount
to Receive ACY
Purchase Order
Outstanding Amount
ACY
Purchase budget measure group
Measure Description
Purchase Budget
Quantity
Purchase Budget Quantity
Purchase Budget Cost
Amount
Purchase Budget Cost Amount
Purchase Budget Cost
Amount ACY
Purchase Budget Cost Amount in additional currency.
Purchase delivery measure group
Measures described below based on Expected Receipt Date, work also on Requested Receipt Date,
Promised Receipt Date and Planned Receipt Date.
Global dimensions referenced to Purchase Delivery measure group are based on Posted Receipts / Posted
Return Shipments and not on Posted Invoices / Posted Credit Memos.
Measure Description
Lines Late – Expected
Receipt Date
Represents no. of records from Purch. Rcpt. Line / Return Shipment Line, where
Expected Receipt Date was before Posting Date.
Lines On Time –
Expected Receipt Date
Represents no. of lines, where Expected Receipt Date was greater or equal to
Posting Date.
Qty Late – Expected
Receipt Date
Represents quantity in base unit of measure, where Expected Receipt Date was
before Posting Date.
(Quantity (Base) from table Purch. Rcpt. Line / Return Shipment Line)
Qty On Time – Expected
Receipt Date
Represents quantity in base unit of measure, where Expected Receipt Date was
greater or equal to Posting Date.
(Quantity (Base) from table Purch. Rcpt. Line / Return Shipment Line)
Amount Late – Expected
Receipt Date
Represents Quantity multiplied with Unit Cost (LCY) and Line Discount % from
Purch. Rcpt. Line / Return Shipment Line, where Expected Receipt Date was
before Posting Date.
Amount Late ACY –
Expected Receipt Date
Represents Quantity multiplied with Unit Cost (LCY) and Line Discount % from
Purch. Rcpt. Line / Return Shipment Line x exchange rate (ACY), where
Expected Receipt Date was before Posting Date.
Calculated measures
Measure Description
% of Total Cost Amount Cost Amount in percentage of all time value, sensible on following dimensions:
Date, Document, Gen Bus Posting Group, Gen Prod Posting Group
Item, Item Charge, Location, Reason Code, Salesperson-Purchaser, Source
Code, Type, Fixed Asset, GL Account, Buy From Vendor, Pay To Vendor
% of Total Cost Amount
ACY
Cost Amount in additional currency in percentage of all time value, sensible on
following dimensions:
Date, Document, Gen Bus Posting Group, Gen Prod Posting Group
Item, Item Charge, Location, Reason Code, Salesperson-Purchaser, Source
Code, Type, Fixed Asset, GL Account, Buy From Vendor, Pay To Vendor
Cost Amount FA Cost Amount when type is Fixed Asset.
Cost Amount FA ACY Cost Amount in additional currency when type is Fixed Asset.
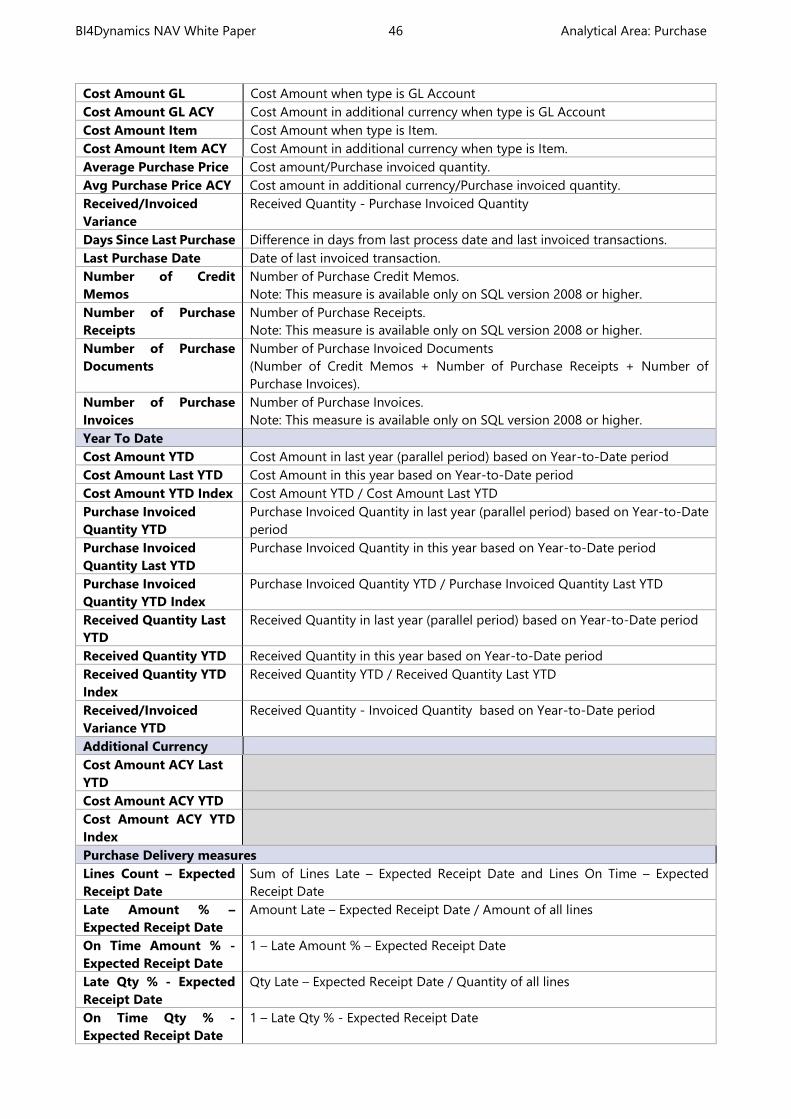
BI4Dynamics NAV White Paper 46 Analytical Area: Purchase
Cost Amount GL Cost Amount when type is GL Account
Cost Amount GL ACY Cost Amount in additional currency when type is GL Account
Cost Amount Item Cost Amount when type is Item.
Cost Amount Item ACY Cost Amount in additional currency when type is Item.
Average Purchase Price Cost amount/Purchase invoiced quantity.
Avg Purchase Price ACY Cost amount in additional currency/Purchase invoiced quantity.
Received/Invoiced
Variance
Received Quantity - Purchase Invoiced Quantity
Days Since Last Purchase Difference in days from last process date and last invoiced transactions.
Last Purchase Date Date of last invoiced transaction.
Number of Credit
Memos
Number of Purchase Credit Memos.
Note: This measure is available only on SQL version 2008 or higher.
Number of Purchase
Receipts
Number of Purchase Receipts.
Note: This measure is available only on SQL version 2008 or higher.
Number of Purchase
Documents
Number of Purchase Invoiced Documents
(Number of Credit Memos + Number of Purchase Receipts + Number of
Purchase Invoices).
Number of Purchase
Invoices
Number of Purchase Invoices.
Note: This measure is available only on SQL version 2008 or higher.
Year To Date
Cost Amount YTD Cost Amount in last year (parallel period) based on Year-to-Date period
Cost Amount Last YTD Cost Amount in this year based on Year-to-Date period
Cost Amount YTD Index Cost Amount YTD / Cost Amount Last YTD
Purchase Invoiced
Quantity YTD
Purchase Invoiced Quantity in last year (parallel period) based on Year-to-Date
period
Purchase Invoiced
Quantity Last YTD
Purchase Invoiced Quantity in this year based on Year-to-Date period
Purchase Invoiced
Quantity YTD Index
Purchase Invoiced Quantity YTD / Purchase Invoiced Quantity Last YTD
Received Quantity Last
YTD
Received Quantity in last year (parallel period) based on Year-to-Date period
Received Quantity YTD Received Quantity in this year based on Year-to-Date period
Received Quantity YTD
Index
Received Quantity YTD / Received Quantity Last YTD
Received/Invoiced
Variance YTD
Received Quantity - Invoiced Quantity based on Year-to-Date period
Additional Currency
Cost Amount ACY Last
YTD
Cost Amount ACY YTD
Cost Amount ACY YTD
Index
Purchase Delivery measures
Lines Count – Expected
Receipt Date
Sum of Lines Late – Expected Receipt Date and Lines On Time – Expected
Receipt Date
Late Amount % –
Expected Receipt Date
Amount Late – Expected Receipt Date / Amount of all lines
On Time Amount % -
Expected Receipt Date
1 – Late Amount % – Expected Receipt Date
Late Qty % - Expected
Receipt Date
Qty Late – Expected Receipt Date / Quantity of all lines
On Time Qty % -
Expected Receipt Date
1 – Late Qty % - Expected Receipt Date

BI4Dynamics NAV White Paper 47 Analytical Area: Purchase
Late Lines % - Expected
Receipt Date
Lines Late - Expected Receipt Date / Lines Count - Expected Receipt Date
On Time Lines % -
Expected Receipt Date
Lines On Time - Expected Receipt Date / Lines Count - Expected Receipt Date
Average Days Late -
Expected Receipt Date
(Number of days difference between Expected Receipt Date and Posting Date
multiplied by Amount) / Amount Late - Expected Receipt Date
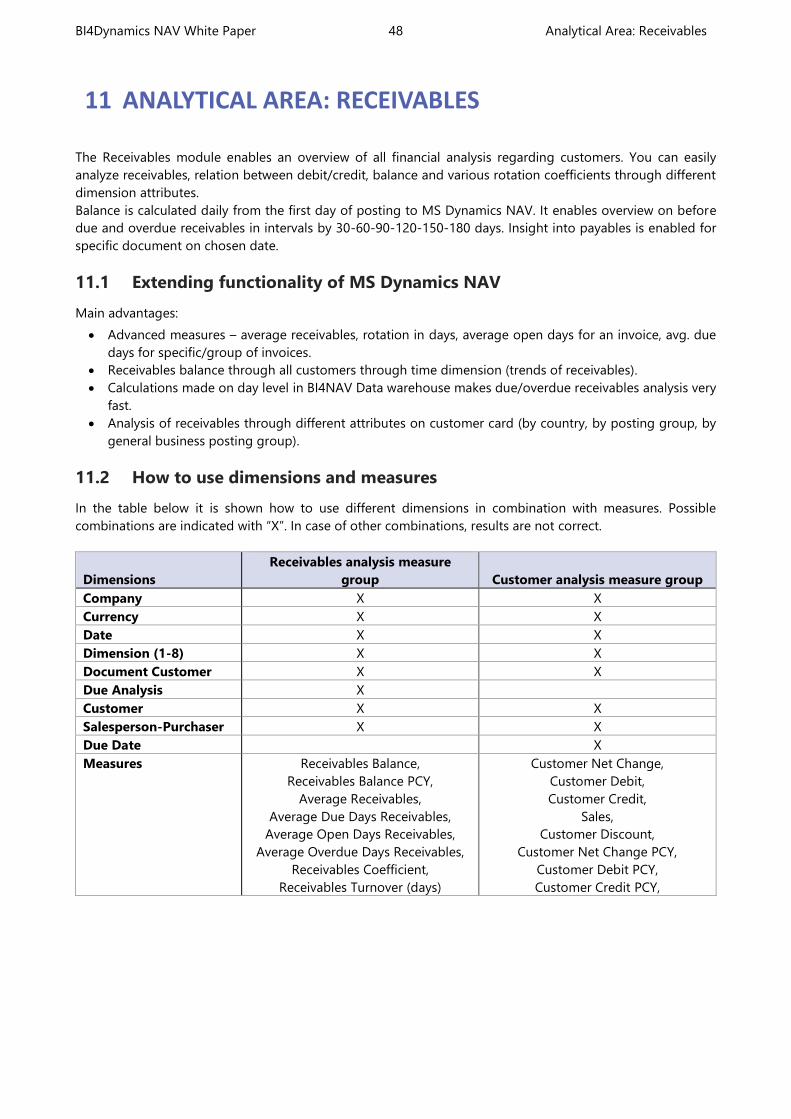
BI4Dynamics NAV White Paper 48 Analytical Area: Receivables
11 ANALYTICAL AREA: RECEIVABLES
The Receivables module enables an overview of all financial analysis regarding customers. You can easily
analyze receivables, relation between debit/credit, balance and various rotation coefficients through different
dimension attributes.
Balance is calculated daily from the first day of posting to MS Dynamics NAV. It enables overview on before
due and overdue receivables in intervals by 30-60-90-120-150-180 days. Insight into payables is enabled for
specific document on chosen date.
11.1 Extending functionality of MS Dynamics NAV
Main advantages:
Advanced measures – average receivables, rotation in days, average open days for an invoice, avg. due
days for specific/group of invoices.
Receivables balance through all customers through time dimension (trends of receivables).
Calculations made on day level in BI4NAV Data warehouse makes due/overdue receivables analysis very
fast.
Analysis of receivables through different attributes on customer card (by country, by posting group, by
general business posting group).
11.2 How to use dimensions and measures
In the table below it is shown how to use different dimensions in combination with measures. Possible
combinations are indicated with “X”. In case of other combinations, results are not correct.
Dimensions
Receivables analysis measure
group Customer analysis measure group
Company X X
Currency X X
Date X X
Dimension (1-8) X X
Document Customer X X
Due Analysis X
Customer X X
Salesperson-Purchaser X X
Due Date X
Measures Receivables Balance,
Receivables Balance PCY,
Average Receivables,
Average Due Days Receivables,
Average Open Days Receivables,
Average Overdue Days Receivables,
Receivables Coefficient,
Receivables Turnover (days)
Customer Net Change,
Customer Debit,
Customer Credit,
Sales,
Customer Discount,
Customer Net Change PCY,
Customer Debit PCY,
Customer Credit PCY,
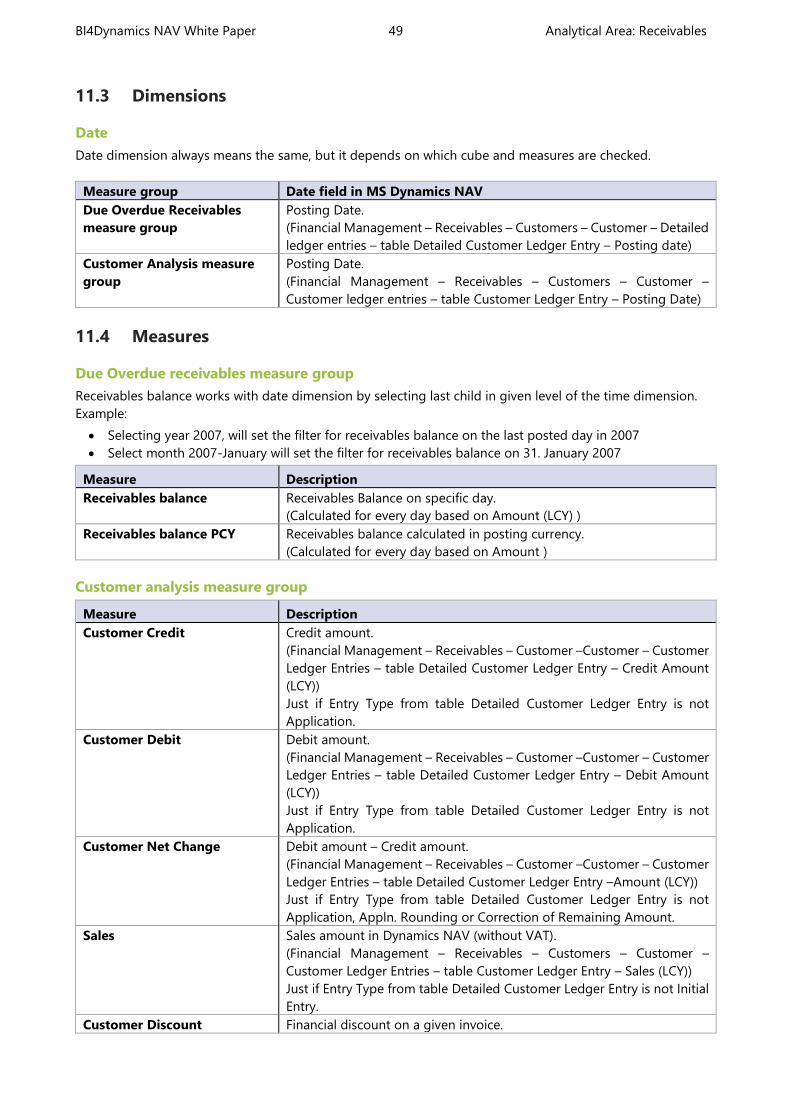
BI4Dynamics NAV White Paper 49 Analytical Area: Receivables
11.3 Dimensions
Date
Date dimension always means the same, but it depends on which cube and measures are checked.
Measure group Date field in MS Dynamics NAV
Due Overdue Receivables
measure group
Posting Date.
(Financial Management – Receivables – Customers – Customer – Detailed
ledger entries – table Detailed Customer Ledger Entry – Posting date)
Customer Analysis measure
group
Posting Date.
(Financial Management – Receivables – Customers – Customer –
Customer ledger entries – table Customer Ledger Entry – Posting Date)
11.4 Measures
Due Overdue receivables measure group
Receivables balance works with date dimension by selecting last child in given level of the time dimension.
Example:
Selecting year 2007, will set the filter for receivables balance on the last posted day in 2007
Select month 2007-January will set the filter for receivables balance on 31. January 2007
Measure Description
Receivables balance Receivables Balance on specific day.
(Calculated for every day based on Amount (LCY) )
Receivables balance PCY Receivables balance calculated in posting currency.
(Calculated for every day based on Amount )
Customer analysis measure group
Measure Description
Customer Credit Credit amount.
(Financial Management – Receivables – Customer –Customer – Customer
Ledger Entries – table Detailed Customer Ledger Entry – Credit Amount
(LCY))
Just if Entry Type from table Detailed Customer Ledger Entry is not
Application.
Customer Debit Debit amount.
(Financial Management – Receivables – Customer –Customer – Customer
Ledger Entries – table Detailed Customer Ledger Entry – Debit Amount
(LCY))
Just if Entry Type from table Detailed Customer Ledger Entry is not
Application.
Customer Net Change Debit amount – Credit amount.
(Financial Management – Receivables – Customer –Customer – Customer
Ledger Entries – table Detailed Customer Ledger Entry –Amount (LCY))
Just if Entry Type from table Detailed Customer Ledger Entry is not
Application, Appln. Rounding or Correction of Remaining Amount.
Sales Sales amount in Dynamics NAV (without VAT).
(Financial Management – Receivables – Customers – Customer –
Customer Ledger Entries – table Customer Ledger Entry – Sales (LCY))
Just if Entry Type from table Detailed Customer Ledger Entry is not Initial
Entry.
Customer Discount Financial discount on a given invoice.
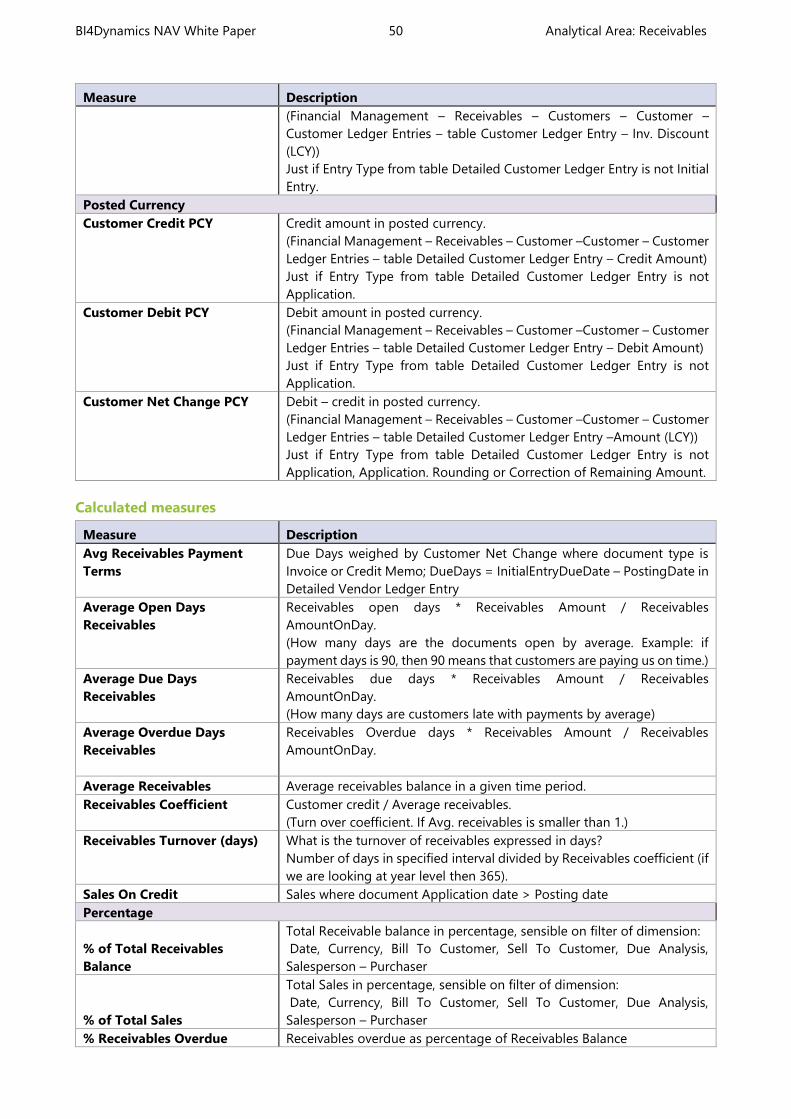
BI4Dynamics NAV White Paper 50 Analytical Area: Receivables
Measure Description
(Financial Management – Receivables – Customers – Customer –
Customer Ledger Entries – table Customer Ledger Entry – Inv. Discount
(LCY))
Just if Entry Type from table Detailed Customer Ledger Entry is not Initial
Entry.
Posted Currency
Customer Credit PCY Credit amount in posted currency.
(Financial Management – Receivables – Customer –Customer – Customer
Ledger Entries – table Detailed Customer Ledger Entry – Credit Amount)
Just if Entry Type from table Detailed Customer Ledger Entry is not
Application.
Customer Debit PCY Debit amount in posted currency.
(Financial Management – Receivables – Customer –Customer – Customer
Ledger Entries – table Detailed Customer Ledger Entry – Debit Amount)
Just if Entry Type from table Detailed Customer Ledger Entry is not
Application.
Customer Net Change PCY Debit – credit in posted currency.
(Financial Management – Receivables – Customer –Customer – Customer
Ledger Entries – table Detailed Customer Ledger Entry –Amount (LCY))
Just if Entry Type from table Detailed Customer Ledger Entry is not
Application, Application. Rounding or Correction of Remaining Amount.
Calculated measures
Measure Description
Avg Receivables Payment
Terms
Due Days weighed by Customer Net Change where document type is
Invoice or Credit Memo; DueDays = InitialEntryDueDate – PostingDate in
Detailed Vendor Ledger Entry
Average Open Days
Receivables
Receivables open days * Receivables Amount / Receivables
AmountOnDay.
(How many days are the documents open by average. Example: if
payment days is 90, then 90 means that customers are paying us on time.)
Average Due Days
Receivables
Receivables due days * Receivables Amount / Receivables
AmountOnDay.
(How many days are customers late with payments by average)
Average Overdue Days
Receivables
Receivables Overdue days * Receivables Amount / Receivables
AmountOnDay.
Average Receivables Average receivables balance in a given time period.
Receivables Coefficient Customer credit / Average receivables.
(Turn over coefficient. If Avg. receivables is smaller than 1.)
Receivables Turnover (days) What is the turnover of receivables expressed in days?
Number of days in specified interval divided by Receivables coefficient (if
we are looking at year level then 365).
Sales On Credit Sales where document Application date > Posting date
Percentage
% of Total Receivables
Balance
Total Receivable balance in percentage, sensible on filter of dimension:
Date, Currency, Bill To Customer, Sell To Customer, Due Analysis,
Salesperson – Purchaser
% of Total Sales
Total Sales in percentage, sensible on filter of dimension:
Date, Currency, Bill To Customer, Sell To Customer, Due Analysis,
Salesperson – Purchaser
% Receivables Overdue Receivables overdue as percentage of Receivables Balance

BI4Dynamics NAV White Paper 51 Analytical Area: Receivables
Sales On Credit (%) Sales On Credit as percentage of Sales
Additional Currency
Customer Credit ACY
Customer Debit ACY
Customer Discount ACY
Customer Net Change ACY
Sales ACY
Sales On Credit ACY
Avg Receivables Payment
Terms ACY
Avg Receivables ACY
Receivables Coefficient ACY
Receivables Turnover (Days)
ACY
% Receivables Overdue ACY
% of Total Receivables
Balance ACY
% of Total Sales ACY
Sales on Credit (%) ACY
Avg Overdue Days
Receivables ACY
Avg Due Days Receivables
ACY
Avg Open Days Receivables
ACY
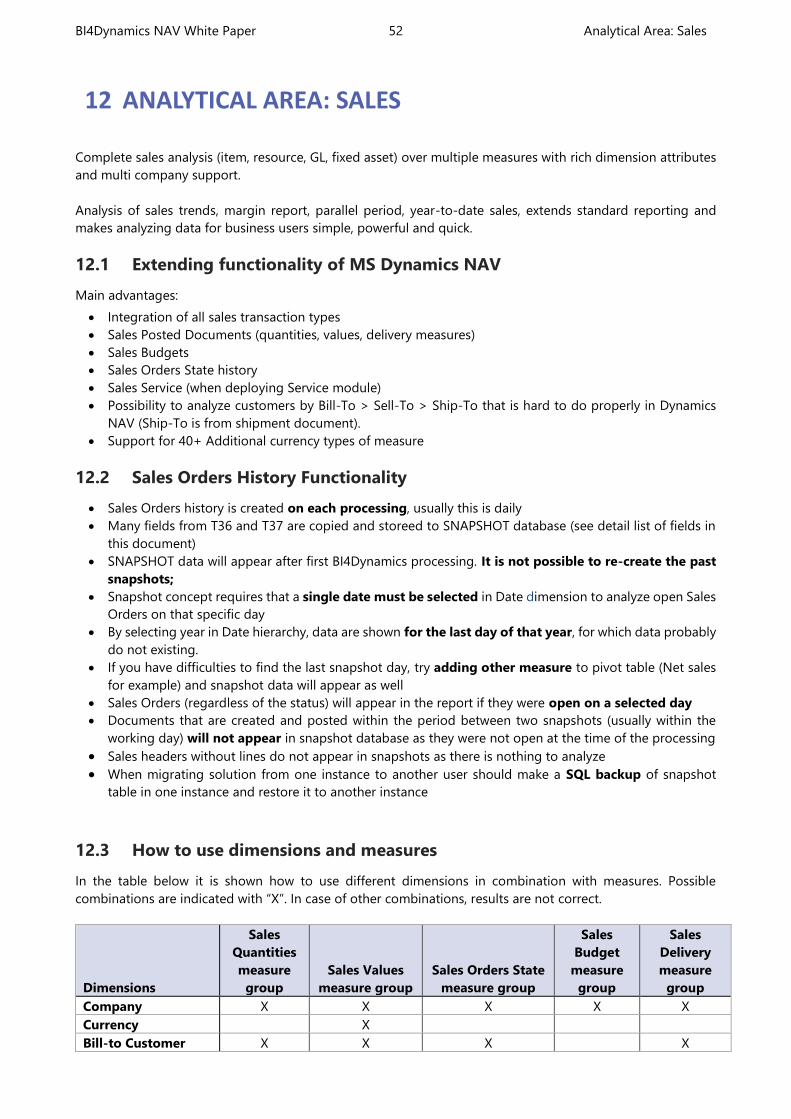
BI4Dynamics NAV White Paper 52 Analytical Area: Sales
12 ANALYTICAL AREA: SALES
Complete sales analysis (item, resource, GL, fixed asset) over multiple measures with rich dimension attributes
and multi company support.
Analysis of sales trends, margin report, parallel period, year-to-date sales, extends standard reporting and
makes analyzing data for business users simple, powerful and quick.
12.1 Extending functionality of MS Dynamics NAV
Main advantages:
Integration of all sales transaction types
Sales Posted Documents (quantities, values, delivery measures)
Sales Budgets
Sales Orders State history
Sales Service (when deploying Service module)
Possibility to analyze customers by Bill-To > Sell-To > Ship-To that is hard to do properly in Dynamics
NAV (Ship-To is from shipment document).
Support for 40+ Additional currency types of measure
12.2 Sales Orders History Functionality
Sales Orders history is created on each processing, usually this is daily
Many fields from T36 and T37 are copied and storeed to SNAPSHOT database (see detail list of fields in
this document)
SNAPSHOT data will appear after first BI4Dynamics processing. It is not possible to re-create the past
snapshots;
Snapshot concept requires that a single date must be selected in Date dimension to analyze open Sales
Orders on that specific day
By selecting year in Date hierarchy, data are shown for the last day of that year, for which data probably
do not existing.
If you have difficulties to find the last snapshot day, try adding other measure to pivot table (Net sales
for example) and snapshot data will appear as well
Sales Orders (regardless of the status) will appear in the report if they were open on a selected day
Documents that are created and posted within the period between two snapshots (usually within the
working day) will not appear in snapshot database as they were not open at the time of the processing
Sales headers without lines do not appear in snapshots as there is nothing to analyze
When migrating solution from one instance to another user should make a SQL backup of snapshot
table in one instance and restore it to another instance
12.3 How to use dimensions and measures
In the table below it is shown how to use different dimensions in combination with measures. Possible
combinations are indicated with “X”. In case of other combinations, results are not correct.
Dimensions
Sales
Quantities
measure
group
Sales Values
measure group
Sales Orders State
measure group
Sales
Budget
measure
group
Sales
Delivery
measure
group
Company X X X X X
Currency X
Bill-to Customer X X X X
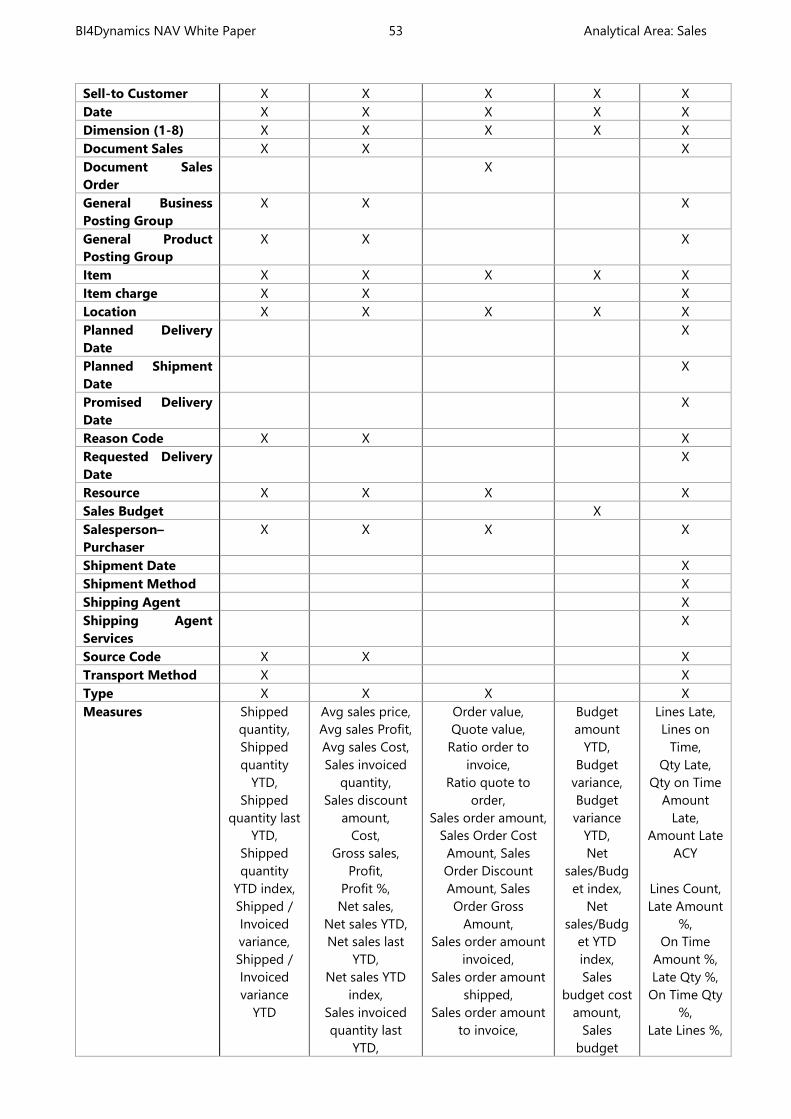
BI4Dynamics NAV White Paper 53 Analytical Area: Sales
Sell-to Customer X X X X X
Date X X X X X
Dimension (1-8) X X X X X
Document Sales X X X
Document Sales
Order
X
General Business
Posting Group
X X X
General Product
Posting Group
X X X
Item X X X X X
Item charge X X X
Location X X X X X
Planned Delivery
Date
X
Planned Shipment
Date
X
Promised Delivery
Date
X
Reason Code X X X
Requested Delivery
Date
X
Resource X X X X
Sales Budget X
Salesperson–
Purchaser
X X X X
Shipment Date X
Shipment Method X
Shipping Agent X
Shipping Agent
Services
X
Source Code X X X
Transport Method X X
Type X X X X
Measures Shipped
quantity,
Shipped
quantity
YTD,
Shipped
quantity last
YTD,
Shipped
quantity
YTD index,
Shipped /
Invoiced
variance,
Shipped /
Invoiced
variance
YTD
Avg sales price,
Avg sales Profit,
Avg sales Cost,
Sales invoiced
quantity,
Sales discount
amount,
Cost,
Gross sales,
Profit,
Profit %,
Net sales,
Net sales YTD,
Net sales last
YTD,
Net sales YTD
index,
Sales invoiced
quantity last
YTD,
Order value,
Quote value,
Ratio order to
invoice,
Ratio quote to
order,
Sales order amount,
Sales Order Cost
Amount, Sales
Order Discount
Amount, Sales
Order Gross
Amount,
Sales order amount
invoiced,
Sales order amount
shipped,
Sales order amount
to invoice,
Budget
amount
YTD,
Budget
variance,
Budget
variance
YTD,
Net
sales/Budg
et index,
Net
sales/Budg
et YTD
index,
Sales
budget cost
amount,
Sales
budget
Lines Late,
Lines on
Time,
Qty Late,
Qty on Time
Amount
Late,
Amount Late
ACY
Lines Count,
Late Amount
%,
On Time
Amount %,
Late Qty %,
On Time Qty
%,
Late Lines %,
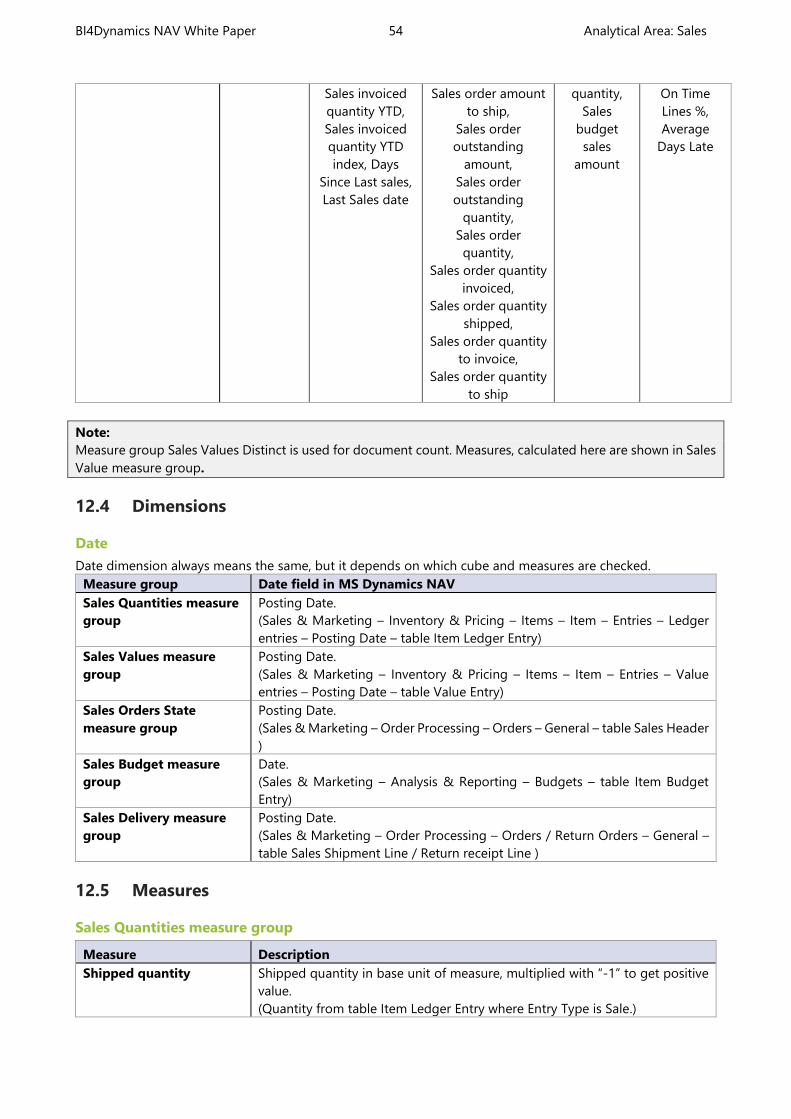
BI4Dynamics NAV White Paper 54 Analytical Area: Sales
Sales invoiced
quantity YTD,
Sales invoiced
quantity YTD
index, Days
Since Last sales,
Last Sales date
Sales order amount
to ship,
Sales order
outstanding
amount,
Sales order
outstanding
quantity,
Sales order
quantity,
Sales order quantity
invoiced,
Sales order quantity
shipped,
Sales order quantity
to invoice,
Sales order quantity
to ship
quantity,
Sales
budget
sales
amount
On Time
Lines %,
Average
Days Late
Note:
Measure group Sales Values Distinct is used for document count. Measures, calculated here are shown in Sales
Value measure group.
12.4 Dimensions
Date
Date dimension always means the same, but it depends on which cube and measures are checked.
Measure group Date field in MS Dynamics NAV
Sales Quantities measure
group
Posting Date.
(Sales & Marketing – Inventory & Pricing – Items – Item – Entries – Ledger
entries – Posting Date – table Item Ledger Entry)
Sales Values measure
group
Posting Date.
(Sales & Marketing – Inventory & Pricing – Items – Item – Entries – Value
entries – Posting Date – table Value Entry)
Sales Orders State
measure group
Posting Date.
(Sales & Marketing – Order Processing – Orders – General – table Sales Header
)
Sales Budget measure
group
Date.
(Sales & Marketing – Analysis & Reporting – Budgets – table Item Budget
Entry)
Sales Delivery measure
group
Posting Date.
(Sales & Marketing – Order Processing – Orders / Return Orders – General –
table Sales Shipment Line / Return receipt Line )
12.5 Measures
Sales Quantities measure group
Measure Description
Shipped quantity Shipped quantity in base unit of measure, multiplied with “-1” to get positive
value.
(Quantity from table Item Ledger Entry where Entry Type is Sale.)
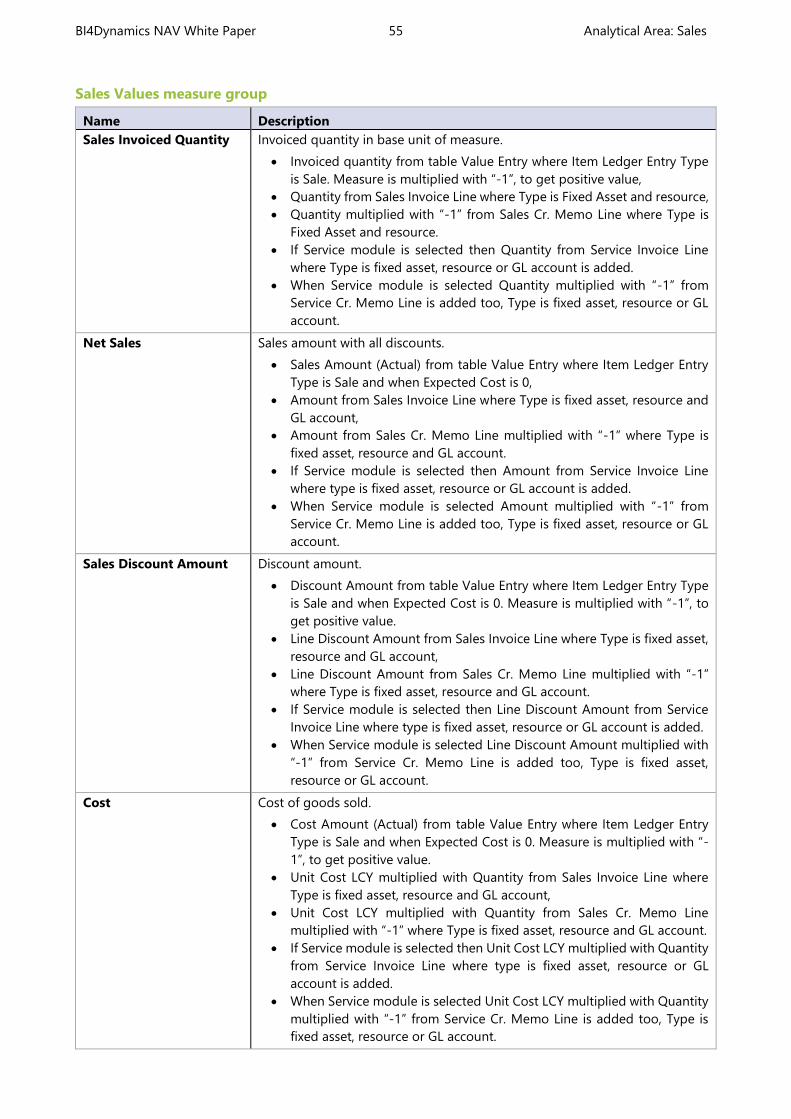
BI4Dynamics NAV White Paper 55 Analytical Area: Sales
Sales Values measure group
Name Description
Sales Invoiced Quantity Invoiced quantity in base unit of measure.
Invoiced quantity from table Value Entry where Item Ledger Entry Type
is Sale. Measure is multiplied with “-1”, to get positive value,
Quantity from Sales Invoice Line where Type is Fixed Asset and resource,
Quantity multiplied with “-1” from Sales Cr. Memo Line where Type is
Fixed Asset and resource.
If Service module is selected then Quantity from Service Invoice Line
where Type is fixed asset, resource or GL account is added.
When Service module is selected Quantity multiplied with “-1” from
Service Cr. Memo Line is added too, Type is fixed asset, resource or GL
account.
Net Sales Sales amount with all discounts.
Sales Amount (Actual) from table Value Entry where Item Ledger Entry
Type is Sale and when Expected Cost is 0,
Amount from Sales Invoice Line where Type is fixed asset, resource and
GL account,
Amount from Sales Cr. Memo Line multiplied with “-1” where Type is
fixed asset, resource and GL account.
If Service module is selected then Amount from Service Invoice Line
where type is fixed asset, resource or GL account is added.
When Service module is selected Amount multiplied with “-1” from
Service Cr. Memo Line is added too, Type is fixed asset, resource or GL
account.
Sales Discount Amount Discount amount.
Discount Amount from table Value Entry where Item Ledger Entry Type
is Sale and when Expected Cost is 0. Measure is multiplied with “-1”, to
get positive value.
Line Discount Amount from Sales Invoice Line where Type is fixed asset,
resource and GL account,
Line Discount Amount from Sales Cr. Memo Line multiplied with “-1”
where Type is fixed asset, resource and GL account.
If Service module is selected then Line Discount Amount from Service
Invoice Line where type is fixed asset, resource or GL account is added.
When Service module is selected Line Discount Amount multiplied with
“-1” from Service Cr. Memo Line is added too, Type is fixed asset,
resource or GL account.
Cost Cost of goods sold.
Cost Amount (Actual) from table Value Entry where Item Ledger Entry
Type is Sale and when Expected Cost is 0. Measure is multiplied with “-
1”, to get positive value.
Unit Cost LCY multiplied with Quantity from Sales Invoice Line where
Type is fixed asset, resource and GL account,
Unit Cost LCY multiplied with Quantity from Sales Cr. Memo Line
multiplied with “-1” where Type is fixed asset, resource and GL account.
If Service module is selected then Unit Cost LCY multiplied with Quantity
from Service Invoice Line where type is fixed asset, resource or GL
account is added.
When Service module is selected Unit Cost LCY multiplied with Quantity
multiplied with “-1” from Service Cr. Memo Line is added too, Type is
fixed asset, resource or GL account.

BI4Dynamics NAV White Paper 56 Analytical Area: Sales
Name Description
Cost Amount Non-
adjusted Cost Amount Non-adjusted from table Customer Ledger Entry (Sales –
Profit) where Item Ledger Entry Type in Value Entry table is Sale and
when Expected Cost is 0 and Adjustment is 1.
Original Profit Profit LCY from table Customer Ledger Entry.
Sales orders state measure group
Measure Description
Sales Order Amount Sales order value – Sales order discount value.
(Sales & Marketing – Order Processing – Orders – Sales Line)
Sales Order Cost Amount Sales order unit cost x Sales order quantity in base units.
(Sales & Marketing – Order Processing – Orders – table Sales Line –
Unit Cost) x
(Sales & Marketing – Order Processing – Orders – table Sales Line –
Quantity (Base))
Sales Order Discount Amount Sales order discount value.
(Sales & Marketing – Order Processing – Orders – Sales Line)
Sales Order Gross Amount Sales order value.
(Sales & Marketing – Order Processing – Orders – Sales Line)
Sales Order Amount Invoiced (Line Amount - Inv. Discount Amount) / Quantity (Base) * Qty.
Invoiced (Base).
( Sales & Marketing – Order Processing – Orders – table Sales Line)
Sales Order Amount Shipped (Line Amount - Inv. Discount Amount) / Quantity (Base) * Qty. Shipped
(Base).
( Sales & Marketing – Order Processing – Orders – table Sales Line)
Sales Order Amount to Invoice (Line Amount - Inv. Discount Amount) / Quantity (Base) * (Quantity
(Base) - Qty. Invoiced (Base)).
( Sales & Marketing – Order Processing – Orders – table Sales Line)
Sales Order Amount To Ship (Line Amount - Inv. Discount Amount) / Quantity (Base) * ((Quantity
(Base) - Qty. Shipped (Base)).
(Sales & Marketing – Order Processing – Orders – table Sales Line)
Sales Order Amount Variance (LineAmount - InvoiceDiscountAmount) / QuantityBase) *
QtyShippedBase) - (((LineAmount - InvoiceDiscountAmount) /
QuantityBase) * QtyInvoicedBase)
Sales Order Outstanding Amount (((Line Amount – Invoice Discount Amount) / Quantity Base) * Qty.
Shipped Base) - (((Line Amount – Invoice Discount Amount) / Quantity
Base) * Qty. Invoiced Base).
( Sales & Marketing – Order Processing – Orders – table Sales Line)
Sales Order Outstanding Quantity Quantity (Base) – Qty. Shipped (Base)
( Sales & Marketing – Order Processing – Orders – table Sales Line)
Sales Order Quantity Sales order quantity in base units.
(Sales & Marketing – Order Processing – Orders – table Sales Line)
Sales Order Quantity Invoiced Already invoiced Sales order quantity in base units.
(Sales & Marketing – Order Processing – Orders – table Sales Line)
Sales Order Quantity Shipped Already shipped Sales order quantity in base units.
(Sales & Marketing – Order Processing – Orders – table Sales Line)
Sales Order Quantity to Invoice Quantity (Base) - Qty. Invoiced (Base).
(Sales & Marketing – Order Processing – Orders – table Sales Line)
Sales Order Quantity to Ship Sales orders quantity in base units, yet to be shipped.
(Sales & Marketing – Order Processing – Orders – table Sales Line)
Sales Order Quantity Variance Quantity Shipped Base – Quantity Invoiced Base
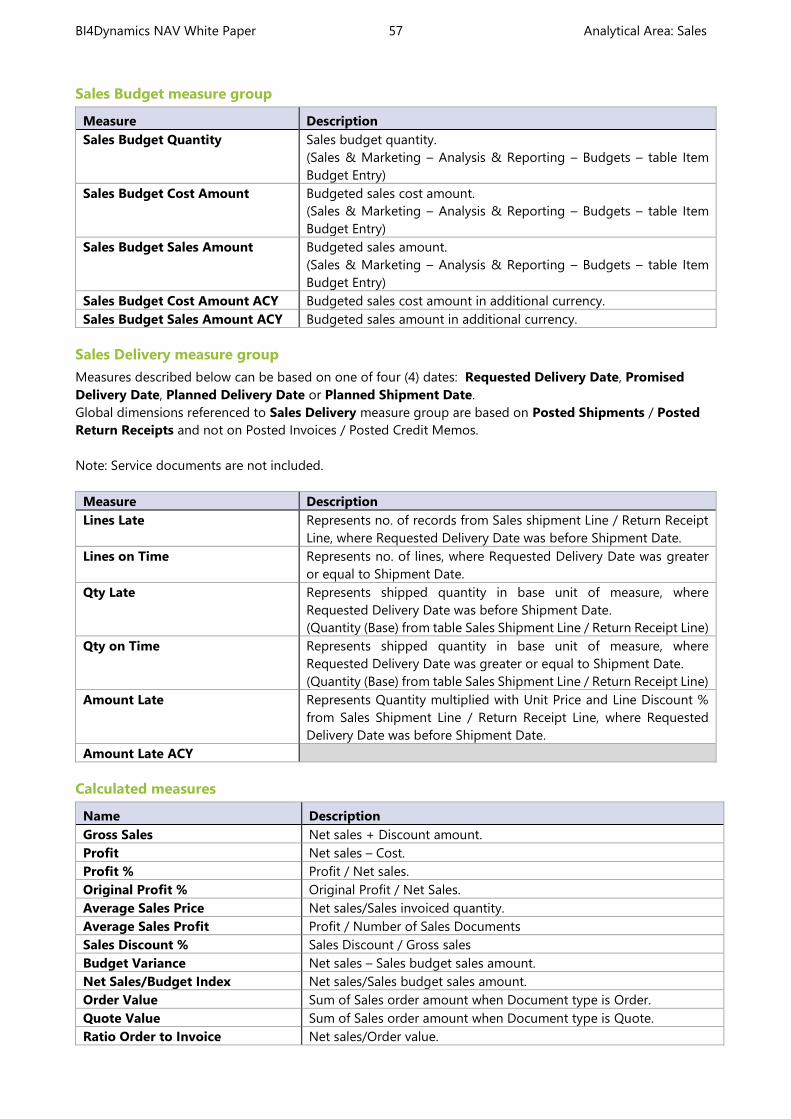
BI4Dynamics NAV White Paper 57 Analytical Area: Sales
Sales Budget measure group
Measure Description
Sales Budget Quantity Sales budget quantity.
(Sales & Marketing – Analysis & Reporting – Budgets – table Item
Budget Entry)
Sales Budget Cost Amount Budgeted sales cost amount.
(Sales & Marketing – Analysis & Reporting – Budgets – table Item
Budget Entry)
Sales Budget Sales Amount Budgeted sales amount.
(Sales & Marketing – Analysis & Reporting – Budgets – table Item
Budget Entry)
Sales Budget Cost Amount ACY Budgeted sales cost amount in additional currency.
Sales Budget Sales Amount ACY Budgeted sales amount in additional currency.
Sales Delivery measure group
Measures described below can be based on one of four (4) dates: Requested Delivery Date, Promised
Delivery Date, Planned Delivery Date or Planned Shipment Date.
Global dimensions referenced to Sales Delivery measure group are based on Posted Shipments / Posted
Return Receipts and not on Posted Invoices / Posted Credit Memos.
Note: Service documents are not included.
Measure Description
Lines Late Represents no. of records from Sales shipment Line / Return Receipt
Line, where Requested Delivery Date was before Shipment Date.
Lines on Time Represents no. of lines, where Requested Delivery Date was greater
or equal to Shipment Date.
Qty Late Represents shipped quantity in base unit of measure, where
Requested Delivery Date was before Shipment Date.
(Quantity (Base) from table Sales Shipment Line / Return Receipt Line)
Qty on Time Represents shipped quantity in base unit of measure, where
Requested Delivery Date was greater or equal to Shipment Date.
(Quantity (Base) from table Sales Shipment Line / Return Receipt Line)
Amount Late Represents Quantity multiplied with Unit Price and Line Discount %
from Sales Shipment Line / Return Receipt Line, where Requested
Delivery Date was before Shipment Date.
Amount Late ACY
Calculated measures
Name Description
Gross Sales Net sales + Discount amount.
Profit Net sales – Cost.
Profit % Profit / Net sales.
Original Profit % Original Profit / Net Sales.
Average Sales Price Net sales/Sales invoiced quantity.
Average Sales Profit Profit / Number of Sales Documents
Sales Discount % Sales Discount / Gross sales
Budget Variance Net sales – Sales budget sales amount.
Net Sales/Budget Index Net sales/Sales budget sales amount.
Order Value Sum of Sales order amount when Document type is Order.
Quote Value Sum of Sales order amount when Document type is Quote.
Ratio Order to Invoice Net sales/Order value.
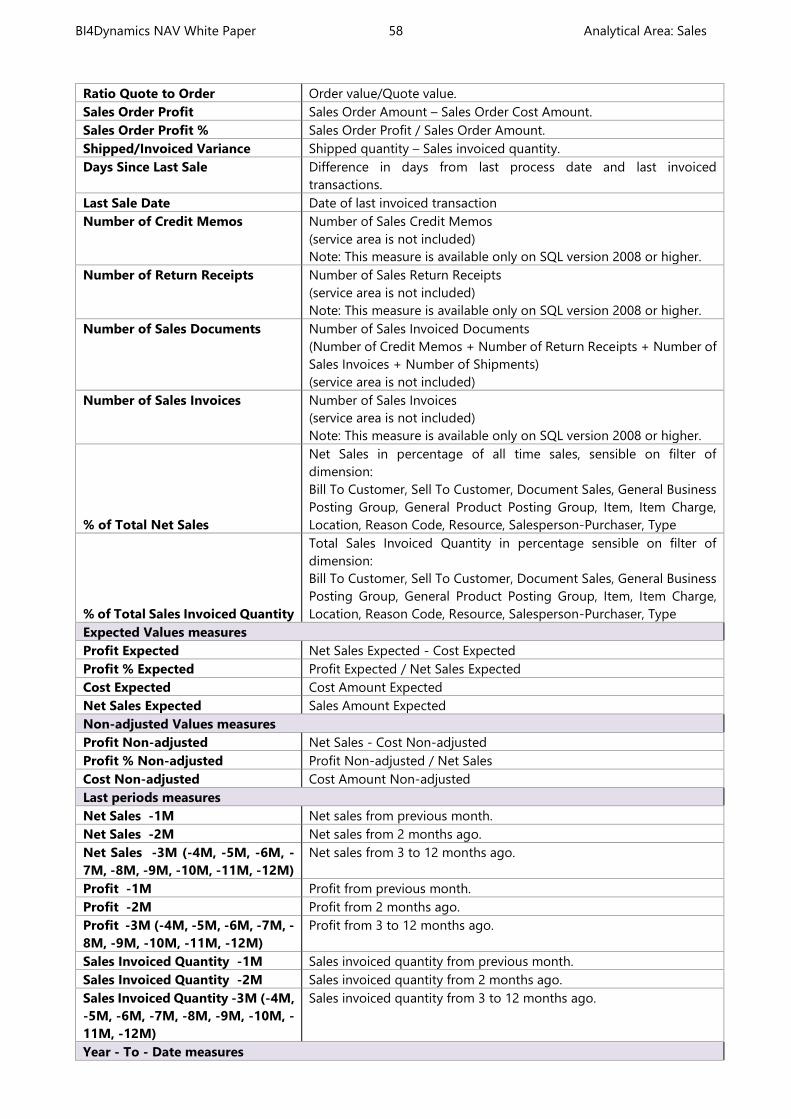
BI4Dynamics NAV White Paper 58 Analytical Area: Sales
Ratio Quote to Order Order value/Quote value.
Sales Order Profit Sales Order Amount – Sales Order Cost Amount.
Sales Order Profit % Sales Order Profit / Sales Order Amount.
Shipped/Invoiced Variance Shipped quantity – Sales invoiced quantity.
Days Since Last Sale Difference in days from last process date and last invoiced
transactions.
Last Sale Date Date of last invoiced transaction
Number of Credit Memos Number of Sales Credit Memos
(service area is not included)
Note: This measure is available only on SQL version 2008 or higher.
Number of Return Receipts Number of Sales Return Receipts
(service area is not included)
Note: This measure is available only on SQL version 2008 or higher.
Number of Sales Documents Number of Sales Invoiced Documents
(Number of Credit Memos + Number of Return Receipts + Number of
Sales Invoices + Number of Shipments)
(service area is not included)
Number of Sales Invoices Number of Sales Invoices
(service area is not included)
Note: This measure is available only on SQL version 2008 or higher.
% of Total Net Sales
Net Sales in percentage of all time sales, sensible on filter of
dimension:
Bill To Customer, Sell To Customer, Document Sales, General Business
Posting Group, General Product Posting Group, Item, Item Charge,
Location, Reason Code, Resource, Salesperson-Purchaser, Type
% of Total Sales Invoiced Quantity
Total Sales Invoiced Quantity in percentage sensible on filter of
dimension:
Bill To Customer, Sell To Customer, Document Sales, General Business
Posting Group, General Product Posting Group, Item, Item Charge,
Location, Reason Code, Resource, Salesperson-Purchaser, Type
Expected Values measures
Profit Expected Net Sales Expected - Cost Expected
Profit % Expected Profit Expected / Net Sales Expected
Cost Expected Cost Amount Expected
Net Sales Expected Sales Amount Expected
Non-adjusted Values measures
Profit Non-adjusted Net Sales - Cost Non-adjusted
Profit % Non-adjusted Profit Non-adjusted / Net Sales
Cost Non-adjusted Cost Amount Non-adjusted
Last periods measures
Net Sales -1M Net sales from previous month.
Net Sales -2M Net sales from 2 months ago.
Net Sales -3M (-4M, -5M, -6M, -
7M, -8M, -9M, -10M, -11M, -12M)
Net sales from 3 to 12 months ago.
Profit -1M Profit from previous month.
Profit -2M Profit from 2 months ago.
Profit -3M (-4M, -5M, -6M, -7M, -
8M, -9M, -10M, -11M, -12M)
Profit from 3 to 12 months ago.
Sales Invoiced Quantity -1M Sales invoiced quantity from previous month.
Sales Invoiced Quantity -2M Sales invoiced quantity from 2 months ago.
Sales Invoiced Quantity -3M (-4M,
-5M, -6M, -7M, -8M, -9M, -10M, -
11M, -12M)
Sales invoiced quantity from 3 to 12 months ago.
Year - To - Date measures
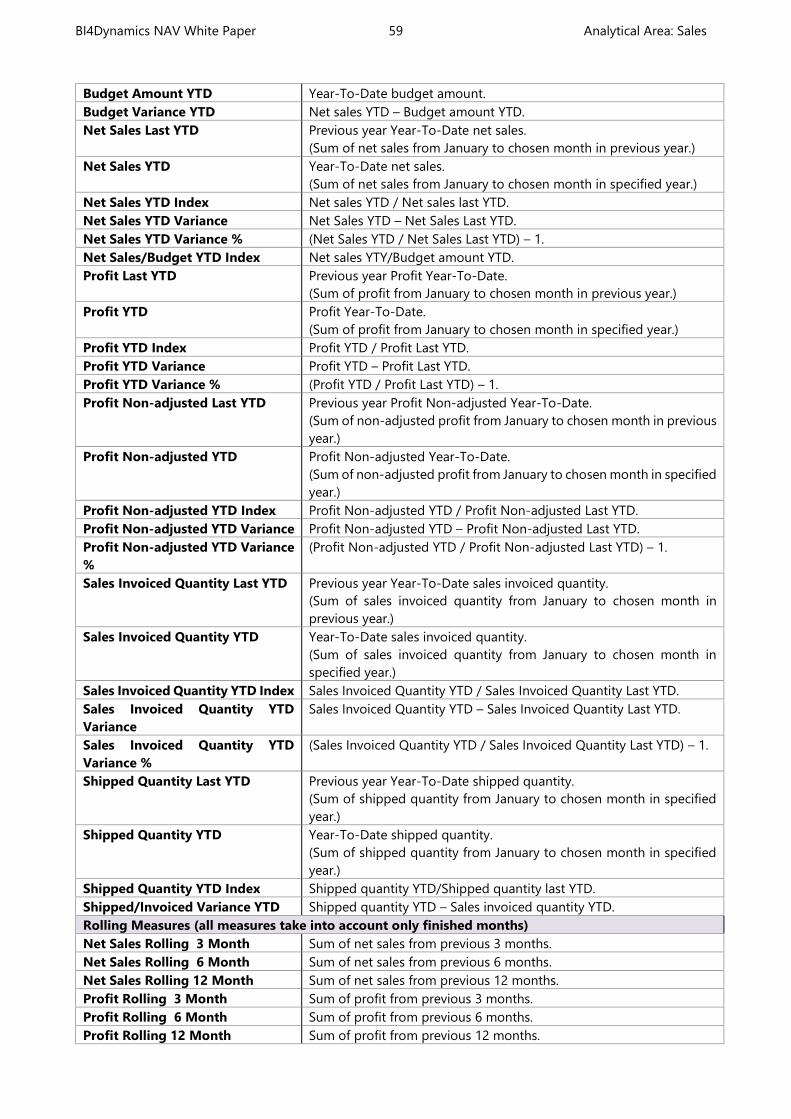
BI4Dynamics NAV White Paper 59 Analytical Area: Sales
Budget Amount YTD Year-To-Date budget amount.
Budget Variance YTD Net sales YTD – Budget amount YTD.
Net Sales Last YTD Previous year Year-To-Date net sales.
(Sum of net sales from January to chosen month in previous year.)
Net Sales YTD Year-To-Date net sales.
(Sum of net sales from January to chosen month in specified year.)
Net Sales YTD Index Net sales YTD / Net sales last YTD.
Net Sales YTD Variance Net Sales YTD – Net Sales Last YTD.
Net Sales YTD Variance % (Net Sales YTD / Net Sales Last YTD) – 1.
Net Sales/Budget YTD Index Net sales YTY/Budget amount YTD.
Profit Last YTD Previous year Profit Year-To-Date.
(Sum of profit from January to chosen month in previous year.)
Profit YTD Profit Year-To-Date.
(Sum of profit from January to chosen month in specified year.)
Profit YTD Index Profit YTD / Profit Last YTD.
Profit YTD Variance Profit YTD – Profit Last YTD.
Profit YTD Variance % (Profit YTD / Profit Last YTD) – 1.
Profit Non-adjusted Last YTD Previous year Profit Non-adjusted Year-To-Date.
(Sum of non-adjusted profit from January to chosen month in previous
year.)
Profit Non-adjusted YTD Profit Non-adjusted Year-To-Date.
(Sum of non-adjusted profit from January to chosen month in specified
year.)
Profit Non-adjusted YTD Index Profit Non-adjusted YTD / Profit Non-adjusted Last YTD.
Profit Non-adjusted YTD Variance Profit Non-adjusted YTD – Profit Non-adjusted Last YTD.
Profit Non-adjusted YTD Variance
%
(Profit Non-adjusted YTD / Profit Non-adjusted Last YTD) – 1.
Sales Invoiced Quantity Last YTD Previous year Year-To-Date sales invoiced quantity.
(Sum of sales invoiced quantity from January to chosen month in
previous year.)
Sales Invoiced Quantity YTD Year-To-Date sales invoiced quantity.
(Sum of sales invoiced quantity from January to chosen month in
specified year.)
Sales Invoiced Quantity YTD Index Sales Invoiced Quantity YTD / Sales Invoiced Quantity Last YTD.
Sales Invoiced Quantity YTD
Variance
Sales Invoiced Quantity YTD – Sales Invoiced Quantity Last YTD.
Sales Invoiced Quantity YTD
Variance %
(Sales Invoiced Quantity YTD / Sales Invoiced Quantity Last YTD) – 1.
Shipped Quantity Last YTD Previous year Year-To-Date shipped quantity.
(Sum of shipped quantity from January to chosen month in specified
year.)
Shipped Quantity YTD Year-To-Date shipped quantity.
(Sum of shipped quantity from January to chosen month in specified
year.)
Shipped Quantity YTD Index Shipped quantity YTD/Shipped quantity last YTD.
Shipped/Invoiced Variance YTD Shipped quantity YTD – Sales invoiced quantity YTD.
Rolling Measures (all measures take into account only finished months)
Net Sales Rolling 3 Month Sum of net sales from previous 3 months.
Net Sales Rolling 6 Month Sum of net sales from previous 6 months.
Net Sales Rolling 12 Month Sum of net sales from previous 12 months.
Profit Rolling 3 Month Sum of profit from previous 3 months.
Profit Rolling 6 Month Sum of profit from previous 6 months.
Profit Rolling 12 Month Sum of profit from previous 12 months.
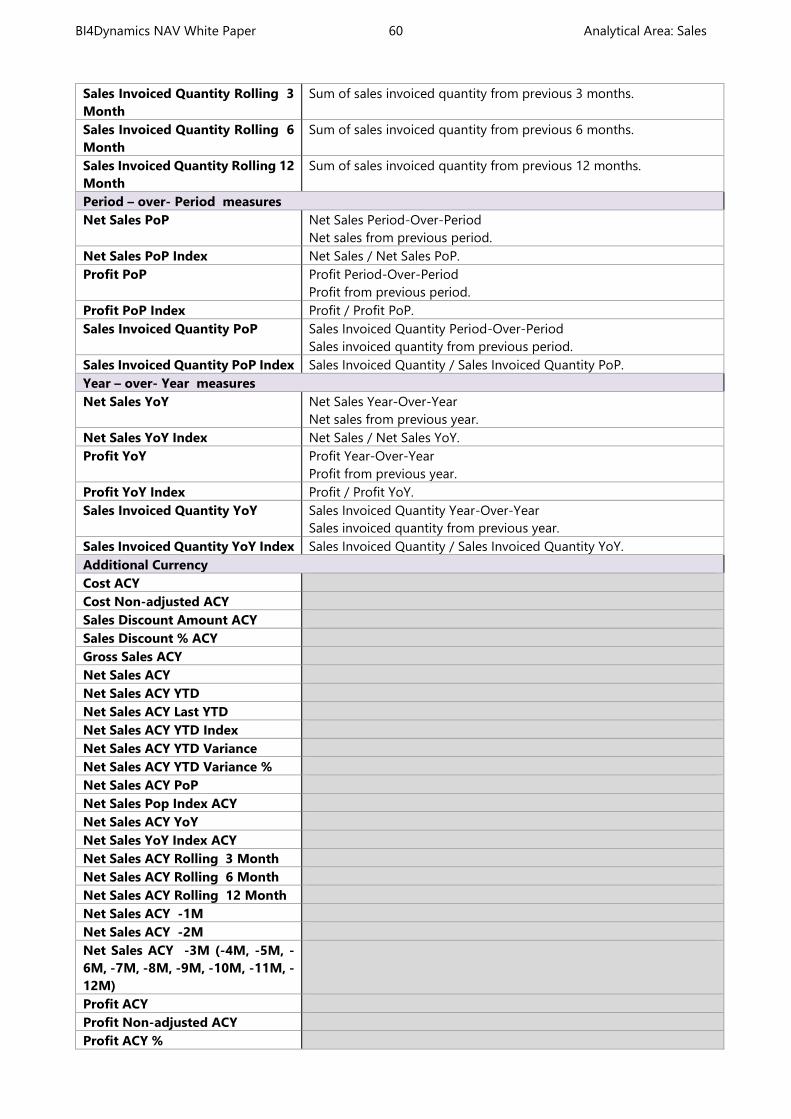
BI4Dynamics NAV White Paper 60 Analytical Area: Sales
Sales Invoiced Quantity Rolling 3
Month
Sum of sales invoiced quantity from previous 3 months.
Sales Invoiced Quantity Rolling 6
Month
Sum of sales invoiced quantity from previous 6 months.
Sales Invoiced Quantity Rolling 12
Month
Sum of sales invoiced quantity from previous 12 months.
Period – over- Period measures
Net Sales PoP Net Sales Period-Over-Period
Net sales from previous period.
Net Sales PoP Index Net Sales / Net Sales PoP.
Profit PoP Profit Period-Over-Period
Profit from previous period.
Profit PoP Index Profit / Profit PoP.
Sales Invoiced Quantity PoP Sales Invoiced Quantity Period-Over-Period
Sales invoiced quantity from previous period.
Sales Invoiced Quantity PoP Index Sales Invoiced Quantity / Sales Invoiced Quantity PoP.
Year – over- Year measures
Net Sales YoY Net Sales Year-Over-Year
Net sales from previous year.
Net Sales YoY Index Net Sales / Net Sales YoY.
Profit YoY Profit Year-Over-Year
Profit from previous year.
Profit YoY Index Profit / Profit YoY.
Sales Invoiced Quantity YoY Sales Invoiced Quantity Year-Over-Year
Sales invoiced quantity from previous year.
Sales Invoiced Quantity YoY Index Sales Invoiced Quantity / Sales Invoiced Quantity YoY.
Additional Currency
Cost ACY
Cost Non-adjusted ACY
Sales Discount Amount ACY
Sales Discount % ACY
Gross Sales ACY
Net Sales ACY
Net Sales ACY YTD
Net Sales ACY Last YTD
Net Sales ACY YTD Index
Net Sales ACY YTD Variance
Net Sales ACY YTD Variance %
Net Sales ACY PoP
Net Sales Pop Index ACY
Net Sales ACY YoY
Net Sales YoY Index ACY
Net Sales ACY Rolling 3 Month
Net Sales ACY Rolling 6 Month
Net Sales ACY Rolling 12 Month
Net Sales ACY -1M
Net Sales ACY -2M
Net Sales ACY -3M (-4M, -5M, -
6M, -7M, -8M, -9M, -10M, -11M, -
12M)
Profit ACY
Profit Non-adjusted ACY
Profit ACY %

BI4Dynamics NAV White Paper 61 Analytical Area: Sales
Profit % Non-adjusted ACY
Profit Expected ACY
Profit % Expected ACY
Profit ACY YTD
Profit ACY Last YTD
Profit ACY YTD Index
Profit ACY YTD Variance
Profit ACY YTD Variance %
Profit ACY PoP
Profit PoP Index ACY
Profit ACY YoY
Profit YoY Index ACY
Profit ACY Rolling 3 Month
Profit ACY Rolling 6 Month
Profit ACY Rolling 12 Month
Profit ACY -1M
Profit ACY -2M
Profit ACY -3M (-4M, -5M, -6M, -
7M, -8M, -9M, -10M, -11M, -12M)
Net Sales ACY FA
Net Sales ACY GL
Net Sales ACY Item
Net Sales ACY Item Charge
Net Sales ACY Resource
Sales Order Amount ACY
Sales Order Discount Amount
ACY
Sales Order Gross Amount ACY
Sales Order Amount Invoiced ACY
Sales Order Amount Shipped ACY
Sales Order Amount To Invoice
ACY
Sales Order Amount To Ship ACY
Sales Order Amount Variance ACY
Sales Order Outstanding Amount
ACY
Avg Sales Price ACY
Avg Sales Cost ACY
Avg Sales Profit ACY
Sales Budget Amount YTD ACY
Sales Budget Variance ACY
Sales Budget Variance YTD ACY
Net Sales ACY/Budget Index
Net Sales ACY/Budget YTD Index
Original Profit ACY
Posted Currency
Net Sales PCY
Gross Sales PCY
Cost PCY
Cost Non-adjusted PCY
Sales Discount Amount PCY
Profit PCY
Profit Non-adjusted PCY
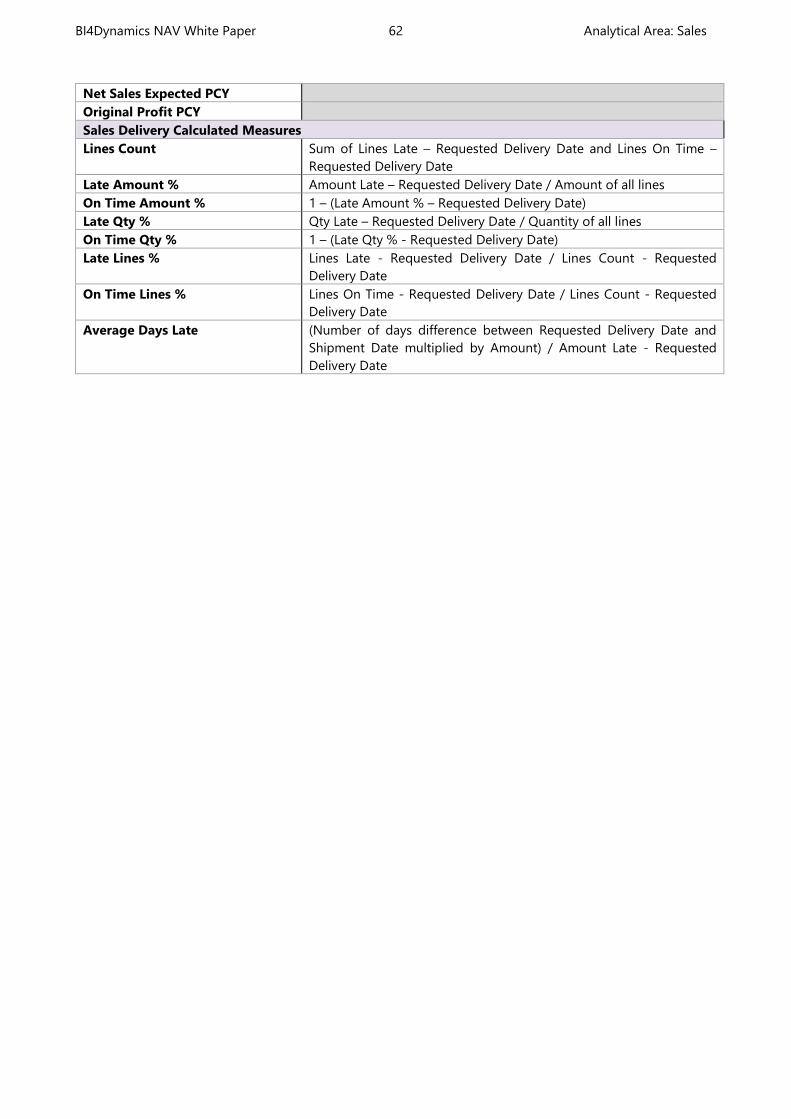
BI4Dynamics NAV White Paper 62 Analytical Area: Sales
Net Sales Expected PCY
Original Profit PCY
Sales Delivery Calculated Measures
Lines Count Sum of Lines Late – Requested Delivery Date and Lines On Time –
Requested Delivery Date
Late Amount % Amount Late – Requested Delivery Date / Amount of all lines
On Time Amount % 1 – (Late Amount % – Requested Delivery Date)
Late Qty % Qty Late – Requested Delivery Date / Quantity of all lines
On Time Qty % 1 – (Late Qty % - Requested Delivery Date)
Late Lines % Lines Late - Requested Delivery Date / Lines Count - Requested
Delivery Date
On Time Lines % Lines On Time - Requested Delivery Date / Lines Count - Requested
Delivery Date
Average Days Late (Number of days difference between Requested Delivery Date and
Shipment Date multiplied by Amount) / Amount Late - Requested
Delivery Date
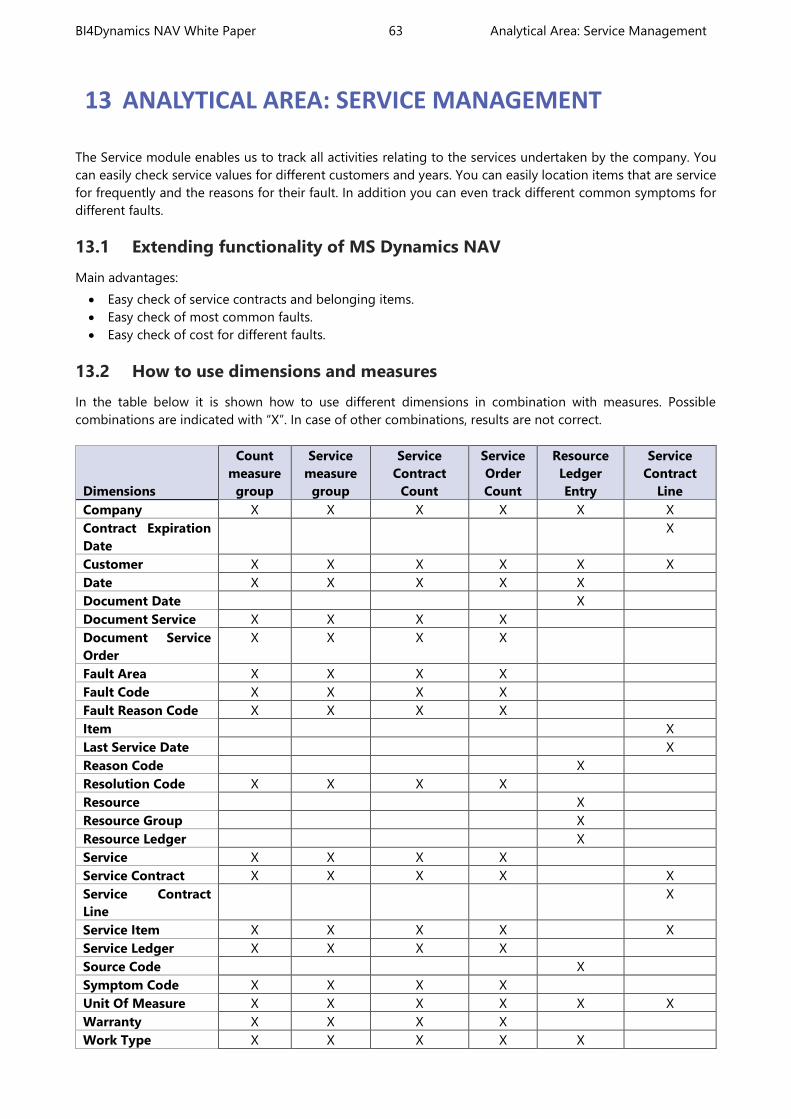
BI4Dynamics NAV White Paper 63 Analytical Area: Service Management
13 ANALYTICAL AREA: SERVICE MANAGEMENT
The Service module enables us to track all activities relating to the services undertaken by the company. You
can easily check service values for different customers and years. You can easily location items that are service
for frequently and the reasons for their fault. In addition you can even track different common symptoms for
different faults.
13.1 Extending functionality of MS Dynamics NAV
Main advantages:
Easy check of service contracts and belonging items.
Easy check of most common faults.
Easy check of cost for different faults.
13.2 How to use dimensions and measures
In the table below it is shown how to use different dimensions in combination with measures. Possible
combinations are indicated with “X”. In case of other combinations, results are not correct.
Dimensions
Count
measure
group
Service
measure
group
Service
Contract
Count
Service
Order
Count
Resource
Ledger
Entry
Service
Contract
Line
Company X X X X X X
Contract Expiration
Date
X
Customer X X X X X X
Date X X X X X
Document Date X
Document Service X X X X
Document Service
Order
X X X X
Fault Area X X X X
Fault Code X X X X
Fault Reason Code X X X X
Item X
Last Service Date X
Reason Code X
Resolution Code X X X X
Resource X
Resource Group X
Resource Ledger X
Service X X X X
Service Contract X X X X X
Service Contract
Line
X
Service Item X X X X X
Service Ledger X X X X
Source Code X
Symptom Code X X X X
Unit Of Measure X X X X X X
Warranty X X X X
Work Type X X X X X
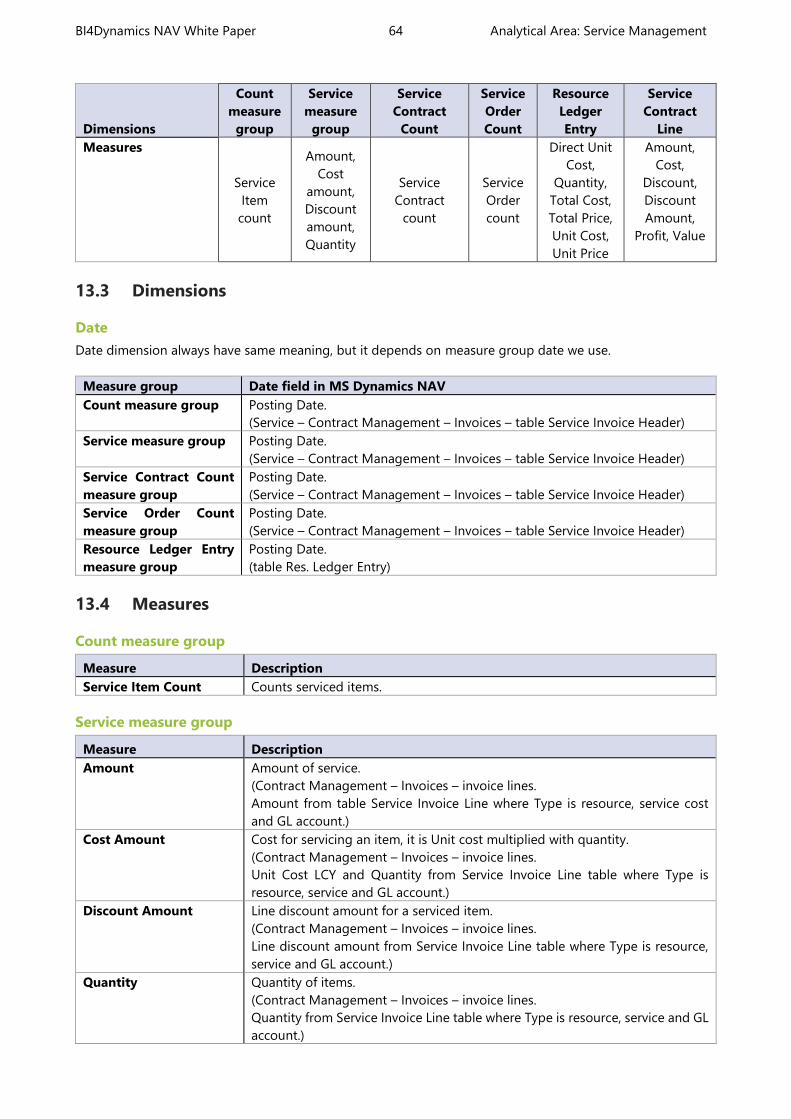
BI4Dynamics NAV White Paper 64 Analytical Area: Service Management
Dimensions
Count
measure
group
Service
measure
group
Service
Contract
Count
Service
Order
Count
Resource
Ledger
Entry
Service
Contract
Line
Measures
Service
Item
count
Amount,
Cost
amount,
Discount
amount,
Quantity
Service
Contract
count
Service
Order
count
Direct Unit
Cost,
Quantity,
Total Cost,
Total Price,
Unit Cost,
Unit Price
Amount,
Cost,
Discount,
Discount
Amount,
Profit, Value
13.3 Dimensions
Date
Date dimension always have same meaning, but it depends on measure group date we use.
Measure group Date field in MS Dynamics NAV
Count measure group Posting Date.
(Service – Contract Management – Invoices – table Service Invoice Header)
Service measure group Posting Date.
(Service – Contract Management – Invoices – table Service Invoice Header)
Service Contract Count
measure group
Posting Date.
(Service – Contract Management – Invoices – table Service Invoice Header)
Service Order Count
measure group
Posting Date.
(Service – Contract Management – Invoices – table Service Invoice Header)
Resource Ledger Entry
measure group
Posting Date.
(table Res. Ledger Entry)
13.4 Measures
Count measure group
Measure Description
Service Item Count Counts serviced items.
Service measure group
Measure Description
Amount Amount of service.
(Contract Management – Invoices – invoice lines.
Amount from table Service Invoice Line where Type is resource, service cost
and GL account.)
Cost Amount Cost for servicing an item, it is Unit cost multiplied with quantity.
(Contract Management – Invoices – invoice lines.
Unit Cost LCY and Quantity from Service Invoice Line table where Type is
resource, service and GL account.)
Discount Amount Line discount amount for a serviced item.
(Contract Management – Invoices – invoice lines.
Line discount amount from Service Invoice Line table where Type is resource,
service and GL account.)
Quantity Quantity of items.
(Contract Management – Invoices – invoice lines.
Quantity from Service Invoice Line table where Type is resource, service and GL
account.)
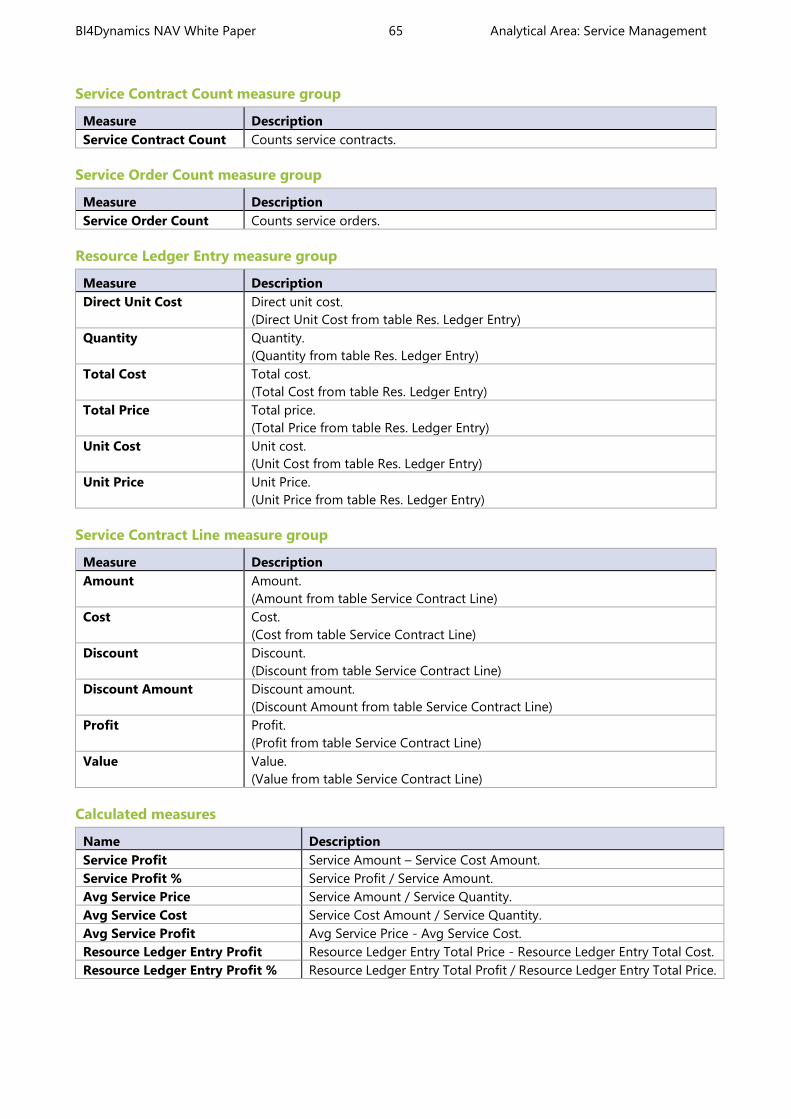
BI4Dynamics NAV White Paper 65 Analytical Area: Service Management
Service Contract Count measure group
Measure Description
Service Contract Count Counts service contracts.
Service Order Count measure group
Measure Description
Service Order Count Counts service orders.
Resource Ledger Entry measure group
Measure Description
Direct Unit Cost Direct unit cost.
(Direct Unit Cost from table Res. Ledger Entry)
Quantity Quantity.
(Quantity from table Res. Ledger Entry)
Total Cost Total cost.
(Total Cost from table Res. Ledger Entry)
Total Price Total price.
(Total Price from table Res. Ledger Entry)
Unit Cost Unit cost.
(Unit Cost from table Res. Ledger Entry)
Unit Price Unit Price.
(Unit Price from table Res. Ledger Entry)
Service Contract Line measure group
Measure Description
Amount Amount.
(Amount from table Service Contract Line)
Cost Cost.
(Cost from table Service Contract Line)
Discount Discount.
(Discount from table Service Contract Line)
Discount Amount Discount amount.
(Discount Amount from table Service Contract Line)
Profit Profit.
(Profit from table Service Contract Line)
Value Value.
(Value from table Service Contract Line)
Calculated measures
Name Description
Service Profit Service Amount – Service Cost Amount.
Service Profit % Service Profit / Service Amount.
Avg Service Price Service Amount / Service Quantity.
Avg Service Cost Service Cost Amount / Service Quantity.
Avg Service Profit Avg Service Price - Avg Service Cost.
Resource Ledger Entry Profit Resource Ledger Entry Total Price - Resource Ledger Entry Total Cost.
Resource Ledger Entry Profit % Resource Ledger Entry Total Profit / Resource Ledger Entry Total Price.
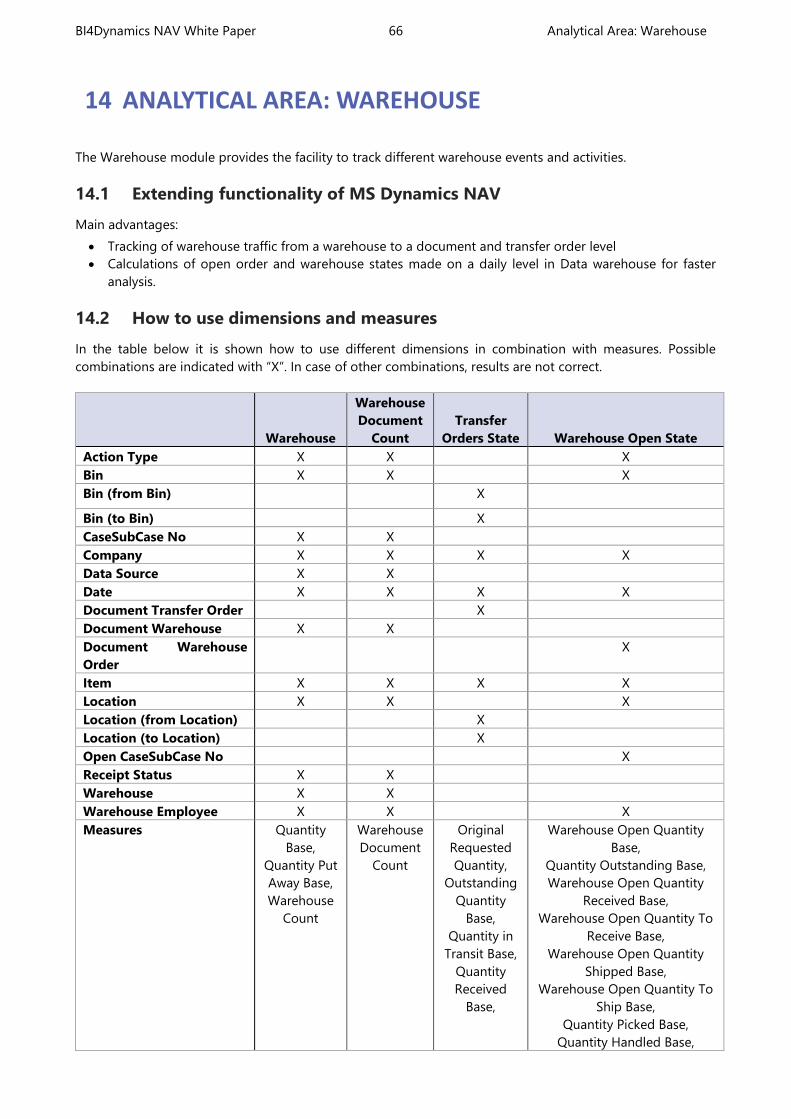
BI4Dynamics NAV White Paper 66 Analytical Area: Warehouse
14 ANALYTICAL AREA: WAREHOUSE
The Warehouse module provides the facility to track different warehouse events and activities.
14.1 Extending functionality of MS Dynamics NAV
Main advantages:
Tracking of warehouse traffic from a warehouse to a document and transfer order level
Calculations of open order and warehouse states made on a daily level in Data warehouse for faster
analysis.
14.2 How to use dimensions and measures
In the table below it is shown how to use different dimensions in combination with measures. Possible
combinations are indicated with “X”. In case of other combinations, results are not correct.
Warehouse
Warehouse
Document
Count
Transfer
Orders State Warehouse Open State
Action Type X X X
Bin X X X
Bin (from Bin) X
Bin (to Bin) X
CaseSubCase No X X
Company X X X X
Data Source X X
Date X X X X
Document Transfer Order X
Document Warehouse X X
Document Warehouse
Order
X
Item X X X X
Location X X X
Location (from Location) X
Location (to Location) X
Open CaseSubCase No X
Receipt Status X X
Warehouse X X
Warehouse Employee X X X
Measures Quantity
Base,
Quantity Put
Away Base,
Warehouse
Count
Warehouse
Document
Count
Original
Requested
Quantity,
Outstanding
Quantity
Base,
Quantity in
Transit Base,
Quantity
Received
Base,
Warehouse Open Quantity
Base,
Quantity Outstanding Base,
Warehouse Open Quantity
Received Base,
Warehouse Open Quantity To
Receive Base,
Warehouse Open Quantity
Shipped Base,
Warehouse Open Quantity To
Ship Base,
Quantity Picked Base,
Quantity Handled Base,
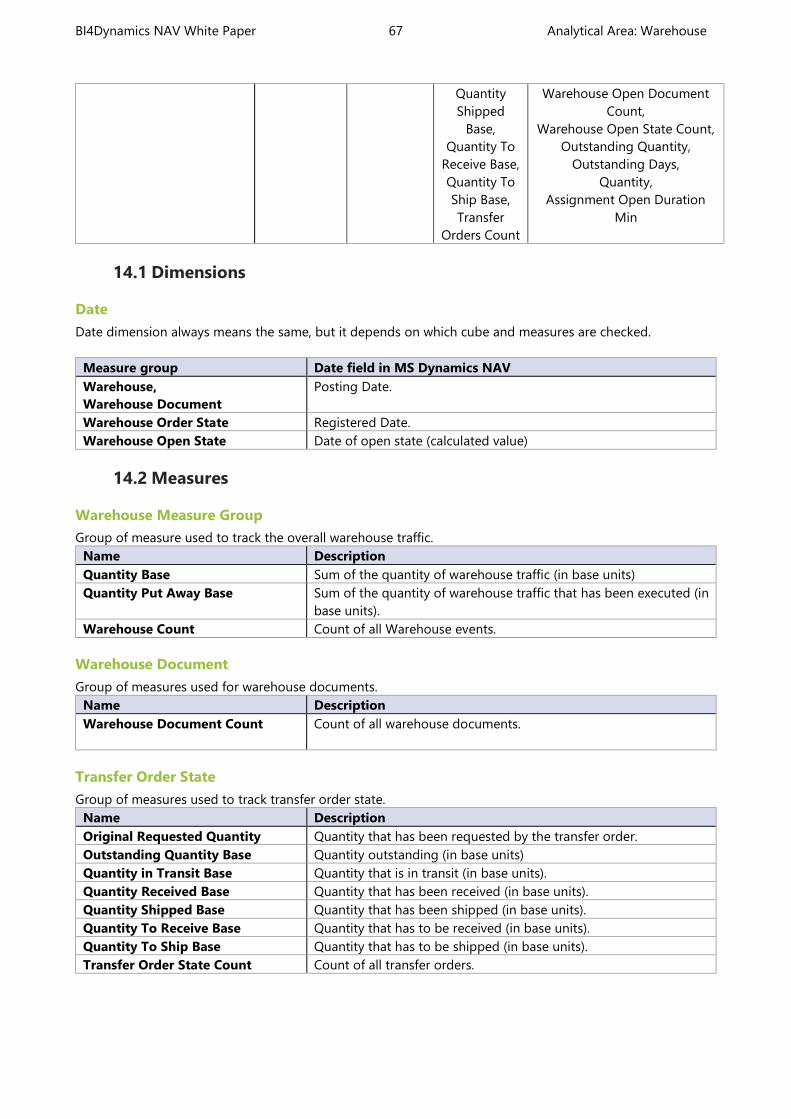
BI4Dynamics NAV White Paper 67 Analytical Area: Warehouse
14.1 Dimensions
Date
Date dimension always means the same, but it depends on which cube and measures are checked.
Measure group Date field in MS Dynamics NAV
Warehouse,
Warehouse Document
Posting Date.
Warehouse Order State Registered Date.
Warehouse Open State Date of open state (calculated value)
14.2 Measures
Warehouse Measure Group
Group of measure used to track the overall warehouse traffic.
Name Description
Quantity Base Sum of the quantity of warehouse traffic (in base units)
Quantity Put Away Base Sum of the quantity of warehouse traffic that has been executed (in
base units).
Warehouse Count Count of all Warehouse events.
Warehouse Document
Group of measures used for warehouse documents.
Name Description
Warehouse Document Count Count of all warehouse documents.
Transfer Order State
Group of measures used to track transfer order state.
Name Description
Original Requested Quantity Quantity that has been requested by the transfer order.
Outstanding Quantity Base Quantity outstanding (in base units)
Quantity in Transit Base Quantity that is in transit (in base units).
Quantity Received Base Quantity that has been received (in base units).
Quantity Shipped Base Quantity that has been shipped (in base units).
Quantity To Receive Base Quantity that has to be received (in base units).
Quantity To Ship Base Quantity that has to be shipped (in base units).
Transfer Order State Count Count of all transfer orders.
Quantity
Shipped
Base,
Quantity To
Receive Base,
Quantity To
Ship Base,
Transfer
Orders Count
Warehouse Open Document
Count,
Warehouse Open State Count,
Outstanding Quantity,
Outstanding Days,
Quantity,
Assignment Open Duration
Min
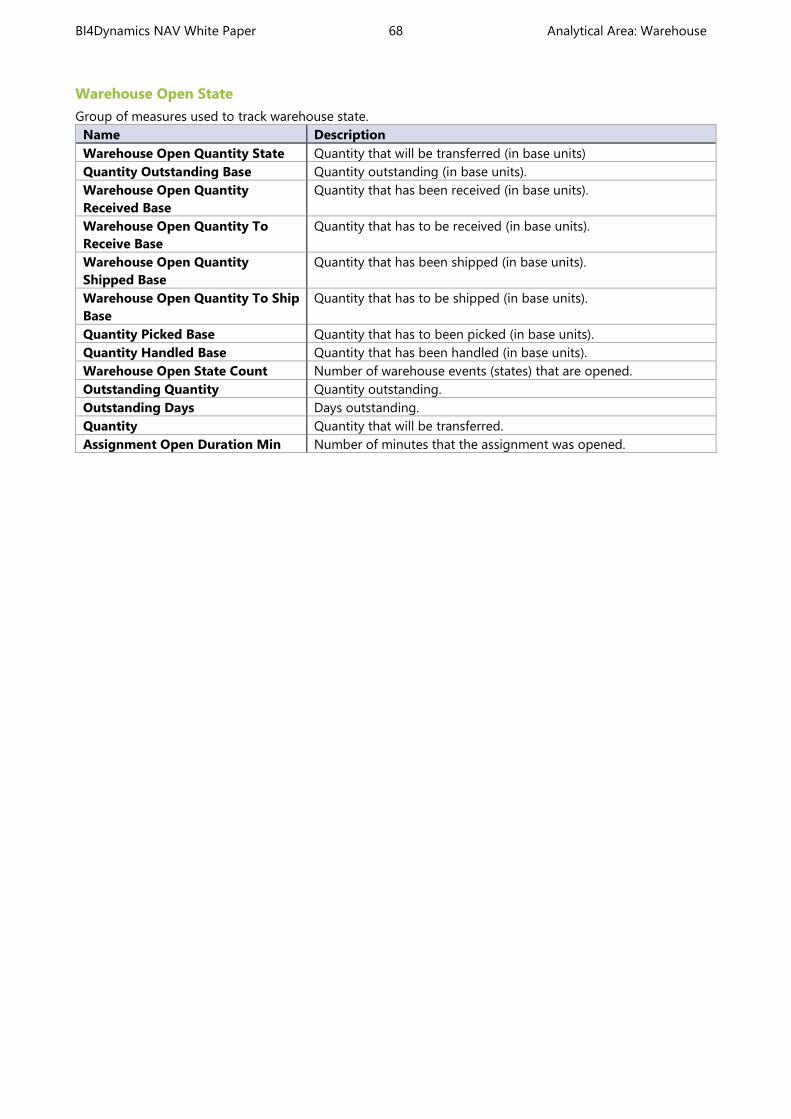
BI4Dynamics NAV White Paper 68 Analytical Area: Warehouse
Warehouse Open State
Group of measures used to track warehouse state.
Name Description
Warehouse Open Quantity State Quantity that will be transferred (in base units)
Quantity Outstanding Base Quantity outstanding (in base units).
Warehouse Open Quantity
Received Base
Quantity that has been received (in base units).
Warehouse Open Quantity To
Receive Base
Quantity that has to be received (in base units).
Warehouse Open Quantity
Shipped Base
Quantity that has been shipped (in base units).
Warehouse Open Quantity To Ship
Base
Quantity that has to be shipped (in base units).
Quantity Picked Base Quantity that has to been picked (in base units).
Quantity Handled Base Quantity that has been handled (in base units).
Warehouse Open State Count Number of warehouse events (states) that are opened.
Outstanding Quantity Quantity outstanding.
Outstanding Days Days outstanding.
Quantity Quantity that will be transferred.
Assignment Open Duration Min Number of minutes that the assignment was opened.
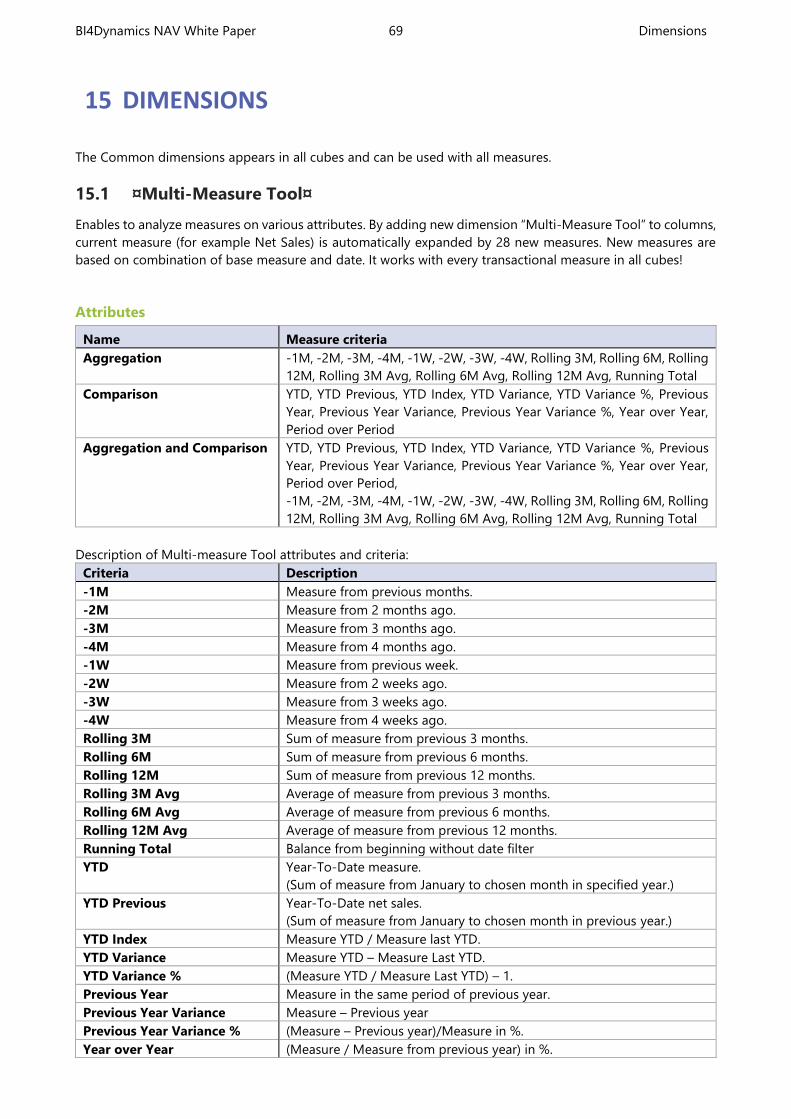
BI4Dynamics NAV White Paper 69 Dimensions
15 DIMENSIONS
The Common dimensions appears in all cubes and can be used with all measures.
15.1 ¤Multi-Measure Tool¤
Enables to analyze measures on various attributes. By adding new dimension “Multi-Measure Tool” to columns,
current measure (for example Net Sales) is automatically expanded by 28 new measures. New measures are
based on combination of base measure and date. It works with every transactional measure in all cubes!
Attributes
Name Measure criteria
Aggregation -1M, -2M, -3M, -4M, -1W, -2W, -3W, -4W, Rolling 3M, Rolling 6M, Rolling
12M, Rolling 3M Avg, Rolling 6M Avg, Rolling 12M Avg, Running Total
Comparison YTD, YTD Previous, YTD Index, YTD Variance, YTD Variance %, Previous
Year, Previous Year Variance, Previous Year Variance %, Year over Year,
Period over Period
Aggregation and Comparison YTD, YTD Previous, YTD Index, YTD Variance, YTD Variance %, Previous
Year, Previous Year Variance, Previous Year Variance %, Year over Year,
Period over Period,
-1M, -2M, -3M, -4M, -1W, -2W, -3W, -4W, Rolling 3M, Rolling 6M, Rolling
12M, Rolling 3M Avg, Rolling 6M Avg, Rolling 12M Avg, Running Total
Description of Multi-measure Tool attributes and criteria:
Criteria Description
-1M Measure from previous months.
-2M Measure from 2 months ago.
-3M Measure from 3 months ago.
-4M Measure from 4 months ago.
-1W Measure from previous week.
-2W Measure from 2 weeks ago.
-3W Measure from 3 weeks ago.
-4W Measure from 4 weeks ago.
Rolling 3M Sum of measure from previous 3 months.
Rolling 6M Sum of measure from previous 6 months.
Rolling 12M Sum of measure from previous 12 months.
Rolling 3M Avg Average of measure from previous 3 months.
Rolling 6M Avg Average of measure from previous 6 months.
Rolling 12M Avg Average of measure from previous 12 months.
Running Total Balance from beginning without date filter
YTD Year-To-Date measure.
(Sum of measure from January to chosen month in specified year.)
YTD Previous Year-To-Date net sales.
(Sum of measure from January to chosen month in previous year.)
YTD Index Measure YTD / Measure last YTD.
YTD Variance Measure YTD – Measure Last YTD.
YTD Variance % (Measure YTD / Measure Last YTD) – 1.
Previous Year Measure in the same period of previous year.
Previous Year Variance Measure – Previous year
Previous Year Variance % (Measure – Previous year)/Measure in %.
Year over Year (Measure / Measure from previous year) in %.

BI4Dynamics NAV White Paper 70 Dimensions
Period is Y.
Period over Period (Measure / Measure from previous period) in %.
Period can be Y, Q, M, W – any date hierarchy.
15.2 Account schedule
Enables to analyze figures in G/L accounts.
Attributes
Name Description
Schedule Name The name of specific schedule.
(Financial Management – General Ledger – Analysis & Reporting –
Account schedules – Name – table Acc. Schedule Name)
No Name Description Number, name, description of selected account schedule.
(Financial management – General ledger – Analysis & Reporting –
Account schedules – Line No, Schedule Name, Description – table Acc.
Schedule Line.)
For proper working of Account Schedule Dimension please refer to these notes:
Row No. must be unique: in every Account Schedule this field must be unique. It is clear that Microsoft
Dynamics NAV allows same Row No to be used multiple times and has no problem presenting
calculations for Account Schedule. Unfortunately SQL calculations require unique primary key and if SQL
finds same attribute again and it will skip this Account Schedule. Such Account Schedule will not appear
in GL cube.
Using Account Schedules -
Multi Company Module
requires the same setup
across Account schedules that
need to be shown across more
companies:
Line No.
Row No.
Totaling
Show Opposite Sign,
These fields must be the same in all companies. This is achieved in NAV by copy/paste Account Schedule
to empty (new) lines, so that every Line No. has value 10000 higher than the previous one.
Do not use following characters in Totaling: |, -, *, /, <>, <, >, “,” (comma), =, <=, >=, ~=, !=, ^=, ( and
).These signs should be avoided due to SQL language. BI4Dynamics are aware that this feature is
supported by Microsoft Dynamics NAV.
Currently supported Totaling Types:
o 0: Posting Account
o 1: Total Account
o 2: Formula
Standard solution supports 8 global dimension but it does not support Dimension 1 Filter or Dimension
2 Filter. Account schedules is one of few areas that use relation many-to-many that brings few unique
features to this area. This also means when we add more dimensions (members) to fact it multiplies
number of records: #GL Account x #Dim1 x #Dim2 … x Dim8. We have removed dimension filters as
standard feature as it may work too slowly in situation when customers have many dimensions and many
dimension records. In past versions 4, we had 4 dimensions as standard. In version 5 it is not there
anymore. Still, scripts are available on request free of charge from [email protected]; If
processing is slow after applying, scrips should be removed.
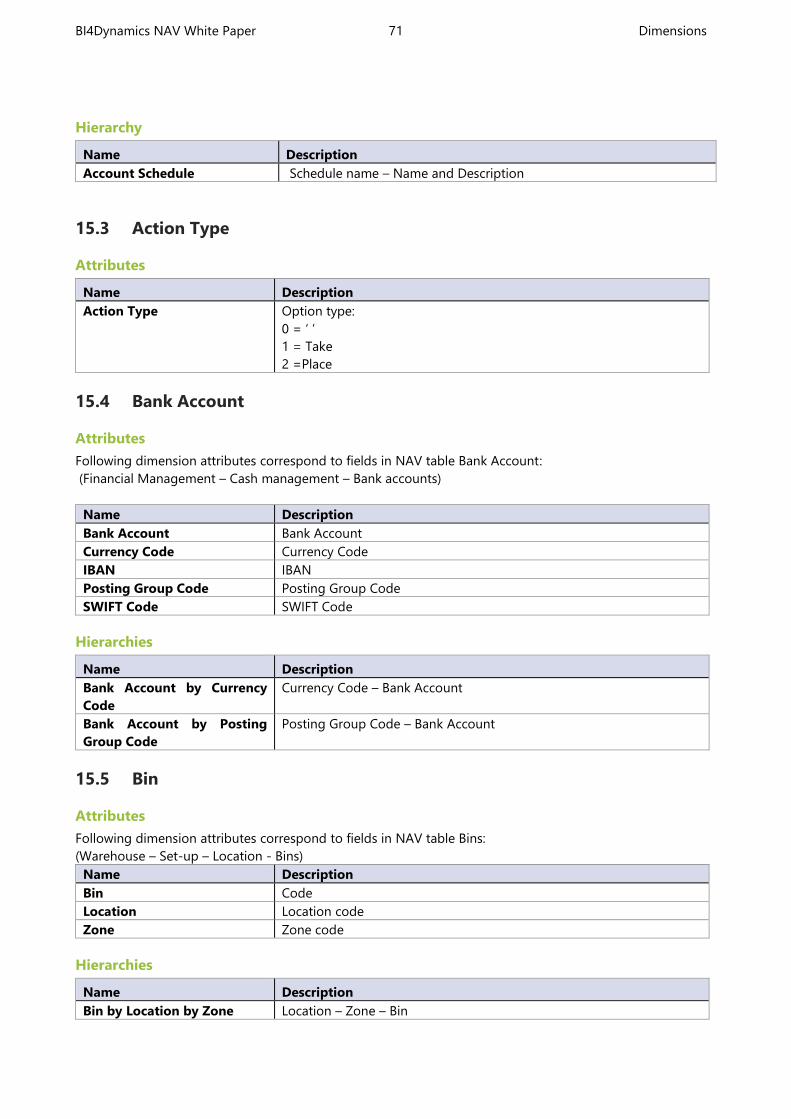
BI4Dynamics NAV White Paper 71 Dimensions
Hierarchy
Name Description
Account Schedule Schedule name – Name and Description
15.3 Action Type
Attributes
Name Description
Action Type Option type:
0 = ‘ ’
1 = Take
2 =Place
15.4 Bank Account
Attributes
Following dimension attributes correspond to fields in NAV table Bank Account:
(Financial Management – Cash management – Bank accounts)
Name Description
Bank Account Bank Account
Currency Code Currency Code
IBAN IBAN
Posting Group Code Posting Group Code
SWIFT Code SWIFT Code
Hierarchies
Name Description
Bank Account by Currency
Code
Currency Code – Bank Account
Bank Account by Posting
Group Code
Posting Group Code – Bank Account
15.5 Bin
Attributes
Following dimension attributes correspond to fields in NAV table Bins:
(Warehouse – Set-up – Location - Bins)
Name Description
Bin Code
Location Location code
Zone Zone code
Hierarchies
Name Description
Bin by Location by Zone Location – Zone – Bin
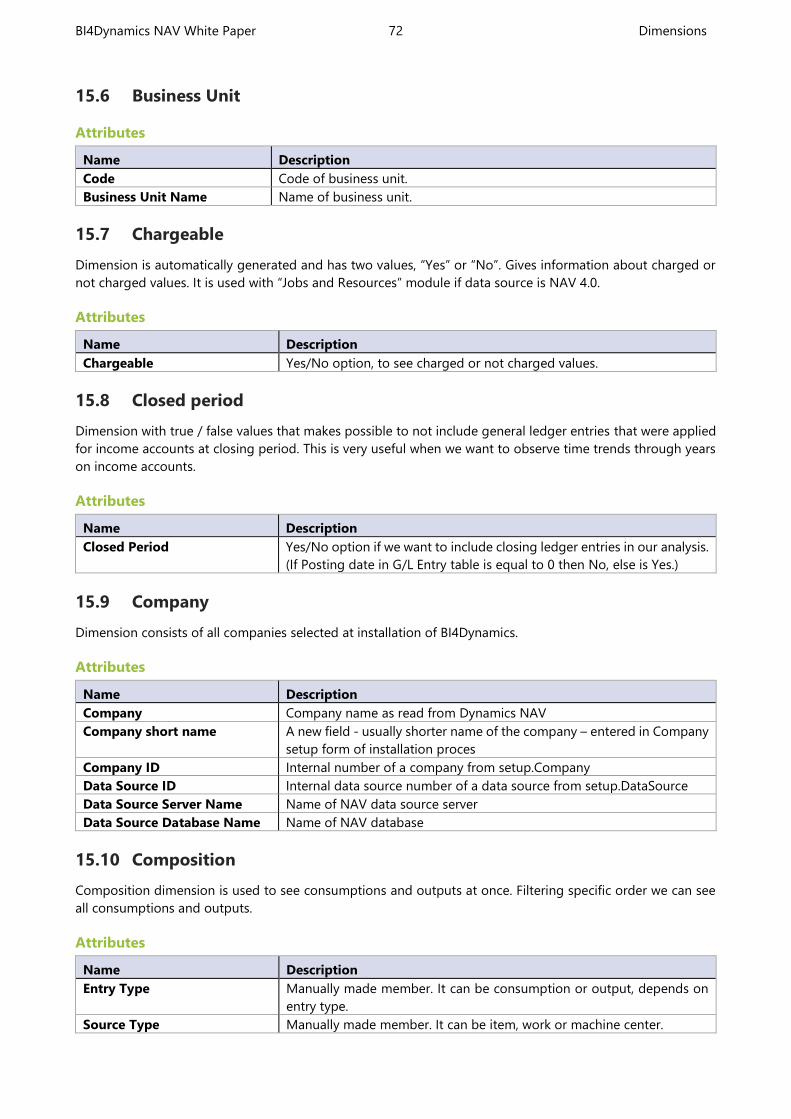
BI4Dynamics NAV White Paper 72 Dimensions
15.6 Business Unit
Attributes
Name Description
Code Code of business unit.
Business Unit Name Name of business unit.
15.7 Chargeable
Dimension is automatically generated and has two values, “Yes” or “No”. Gives information about charged or
not charged values. It is used with “Jobs and Resources” module if data source is NAV 4.0.
Attributes
Name Description
Chargeable Yes/No option, to see charged or not charged values.
15.8 Closed period
Dimension with true / false values that makes possible to not include general ledger entries that were applied
for income accounts at closing period. This is very useful when we want to observe time trends through years
on income accounts.
Attributes
Name Description
Closed Period Yes/No option if we want to include closing ledger entries in our analysis.
(If Posting date in G/L Entry table is equal to 0 then No, else is Yes.)
15.9 Company
Dimension consists of all companies selected at installation of BI4Dynamics.
Attributes
Name Description
Company Company name as read from Dynamics NAV
Company short name A new field - usually shorter name of the company – entered in Company
setup form of installation proces
Company ID Internal number of a company from setup.Company
Data Source ID Internal data source number of a data source from setup.DataSource
Data Source Server Name Name of NAV data source server
Data Source Database Name Name of NAV database
15.10 Composition
Composition dimension is used to see consumptions and outputs at once. Filtering specific order we can see
all consumptions and outputs.
Attributes
Name Description
Entry Type Manually made member. It can be consumption or output, depends on
entry type.
Source Type Manually made member. It can be item, work or machine center.
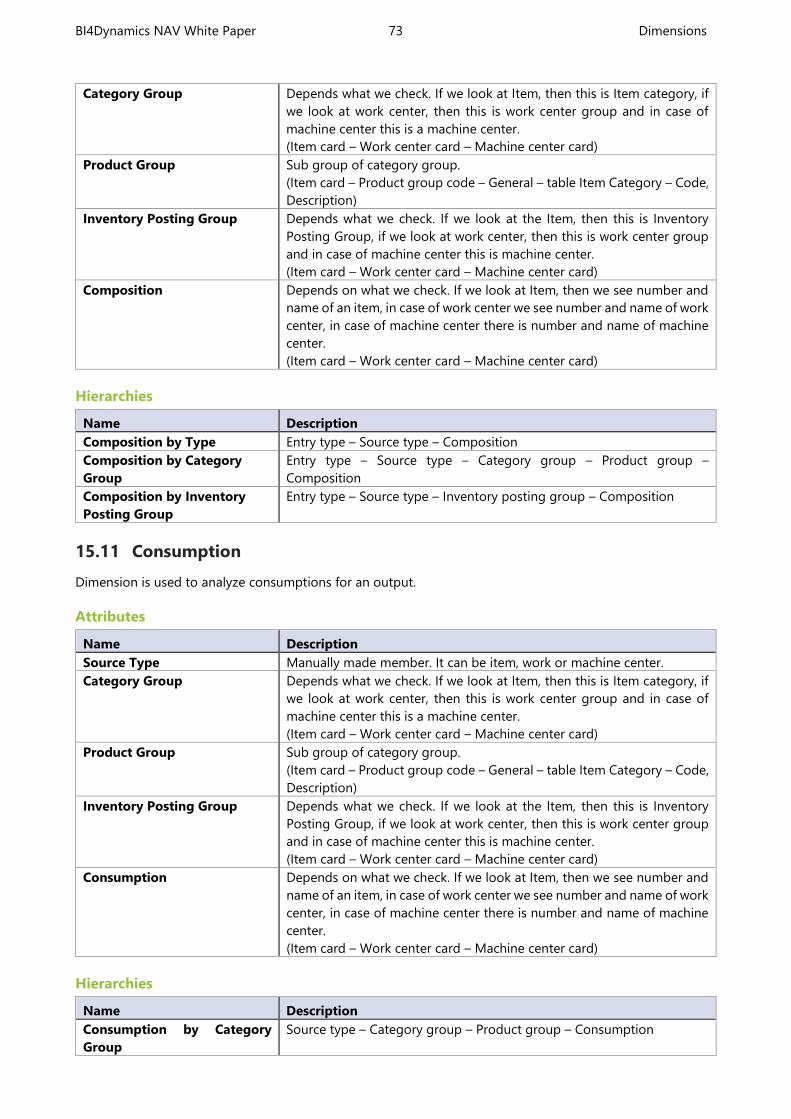
BI4Dynamics NAV White Paper 73 Dimensions
Category Group Depends what we check. If we look at Item, then this is Item category, if
we look at work center, then this is work center group and in case of
machine center this is a machine center.
(Item card – Work center card – Machine center card)
Product Group Sub group of category group.
(Item card – Product group code – General – table Item Category – Code,
Description)
Inventory Posting Group Depends what we check. If we look at the Item, then this is Inventory
Posting Group, if we look at work center, then this is work center group
and in case of machine center this is machine center.
(Item card – Work center card – Machine center card)
Composition Depends on what we check. If we look at Item, then we see number and
name of an item, in case of work center we see number and name of work
center, in case of machine center there is number and name of machine
center.
(Item card – Work center card – Machine center card)
Hierarchies
Name Description
Composition by Type Entry type – Source type – Composition
Composition by Category
Group
Entry type – Source type – Category group – Product group –
Composition
Composition by Inventory
Posting Group
Entry type – Source type – Inventory posting group – Composition
15.11 Consumption
Dimension is used to analyze consumptions for an output.
Attributes
Name Description
Source Type Manually made member. It can be item, work or machine center.
Category Group Depends what we check. If we look at Item, then this is Item category, if
we look at work center, then this is work center group and in case of
machine center this is a machine center.
(Item card – Work center card – Machine center card)
Product Group Sub group of category group.
(Item card – Product group code – General – table Item Category – Code,
Description)
Inventory Posting Group Depends what we check. If we look at the Item, then this is Inventory
Posting Group, if we look at work center, then this is work center group
and in case of machine center this is machine center.
(Item card – Work center card – Machine center card)
Consumption Depends on what we check. If we look at Item, then we see number and
name of an item, in case of work center we see number and name of work
center, in case of machine center there is number and name of machine
center.
(Item card – Work center card – Machine center card)
Hierarchies
Name Description
Consumption by Category
Group
Source type – Category group – Product group – Consumption
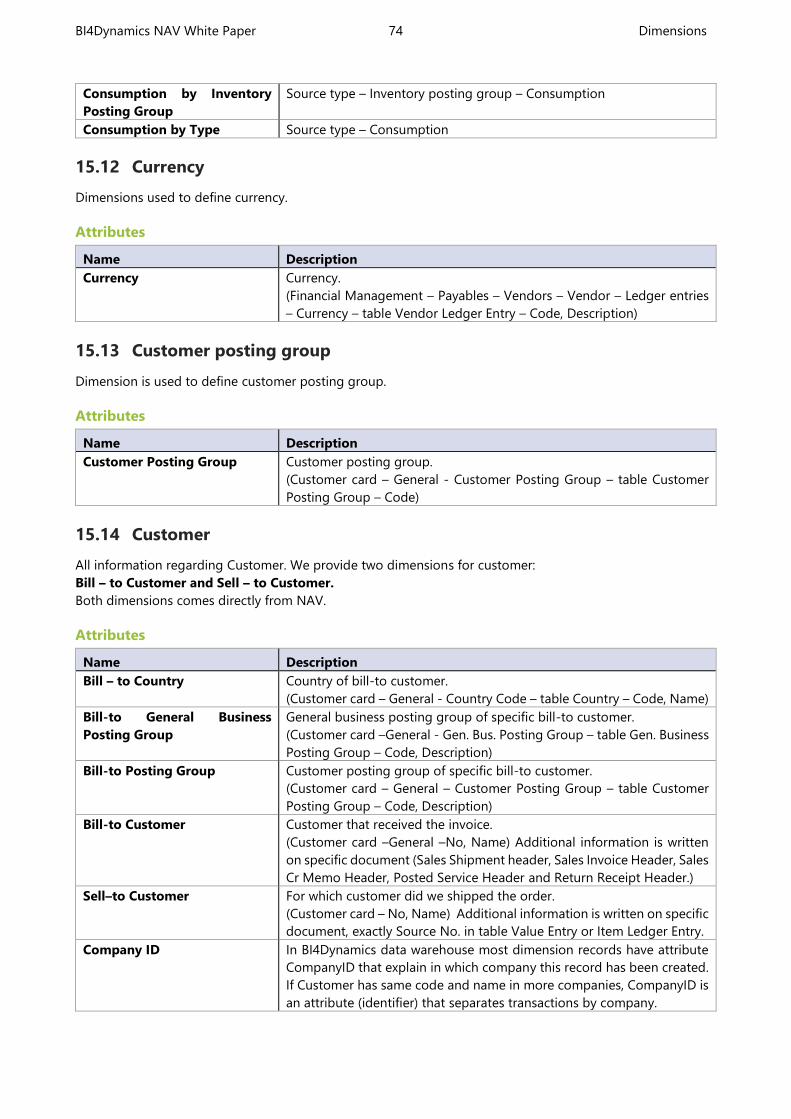
BI4Dynamics NAV White Paper 74 Dimensions
Consumption by Inventory
Posting Group
Source type – Inventory posting group – Consumption
Consumption by Type Source type – Consumption
15.12 Currency
Dimensions used to define currency.
Attributes
Name Description
Currency Currency.
(Financial Management – Payables – Vendors – Vendor – Ledger entries
– Currency – table Vendor Ledger Entry – Code, Description)
15.13 Customer posting group
Dimension is used to define customer posting group.
Attributes
Name Description
Customer Posting Group Customer posting group.
(Customer card – General - Customer Posting Group – table Customer
Posting Group – Code)
15.14 Customer
All information regarding Customer. We provide two dimensions for customer:
Bill – to Customer and Sell – to Customer.
Both dimensions comes directly from NAV.
Attributes
Name Description
Bill – to Country Country of bill-to customer.
(Customer card – General - Country Code – table Country – Code, Name)
Bill-to General Business
Posting Group
General business posting group of specific bill-to customer.
(Customer card –General - Gen. Bus. Posting Group – table Gen. Business
Posting Group – Code, Description)
Bill-to Posting Group Customer posting group of specific bill-to customer.
(Customer card – General – Customer Posting Group – table Customer
Posting Group – Code, Description)
Bill-to Customer Customer that received the invoice.
(Customer card –General –No, Name) Additional information is written
on specific document (Sales Shipment header, Sales Invoice Header, Sales
Cr Memo Header, Posted Service Header and Return Receipt Header.)
Sell–to Customer For which customer did we shipped the order.
(Customer card – No, Name) Additional information is written on specific
document, exactly Source No. in table Value Entry or Item Ledger Entry.
Company ID In BI4Dynamics data warehouse most dimension records have attribute
CompanyID that explain in which company this record has been created.
If Customer has same code and name in more companies, CompanyID is
an attribute (identifier) that separates transactions by company.
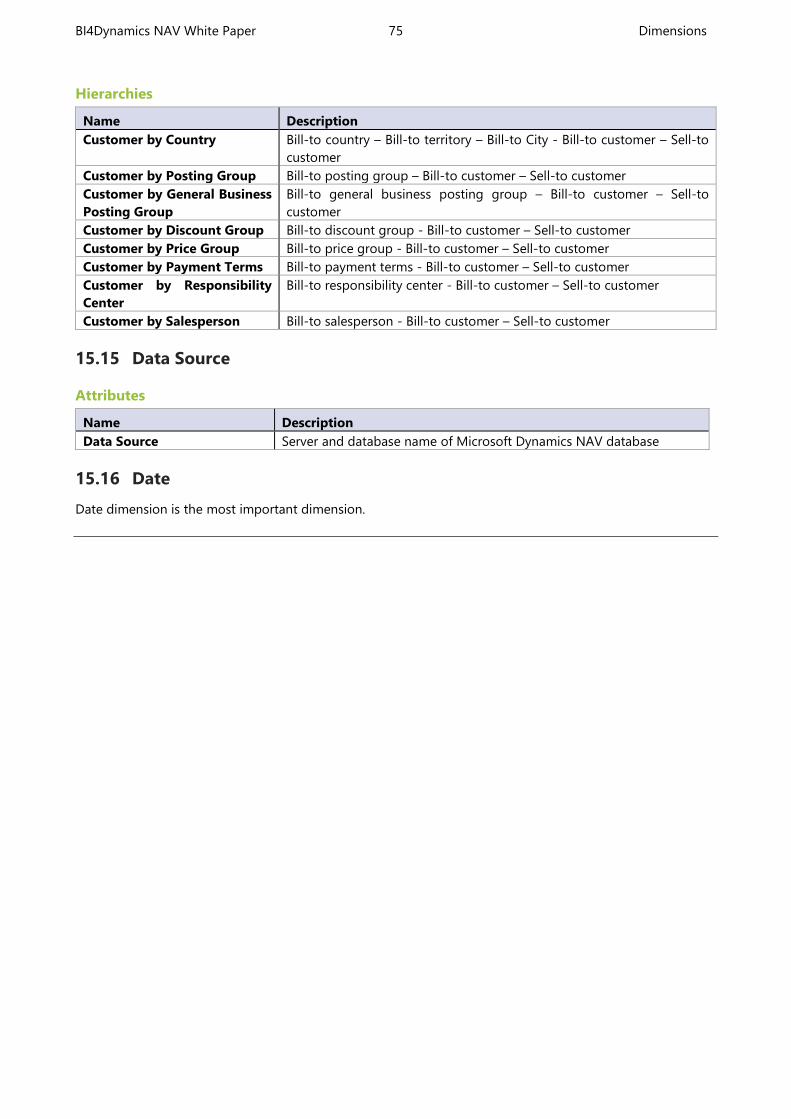
BI4Dynamics NAV White Paper 75 Dimensions
Hierarchies
Name Description
Customer by Country Bill-to country – Bill-to territory – Bill-to City - Bill-to customer – Sell-to
customer
Customer by Posting Group Bill-to posting group – Bill-to customer – Sell-to customer
Customer by General Business
Posting Group
Bill-to general business posting group – Bill-to customer – Sell-to
customer
Customer by Discount Group Bill-to discount group - Bill-to customer – Sell-to customer
Customer by Price Group Bill-to price group - Bill-to customer – Sell-to customer
Customer by Payment Terms Bill-to payment terms - Bill-to customer – Sell-to customer
Customer by Responsibility
Center
Bill-to responsibility center - Bill-to customer – Sell-to customer
Customer by Salesperson Bill-to salesperson - Bill-to customer – Sell-to customer
15.15 Data Source
Attributes
Name Description
Data Source Server and database name of Microsoft Dynamics NAV database
15.16 Date
Date dimension is the most important dimension.
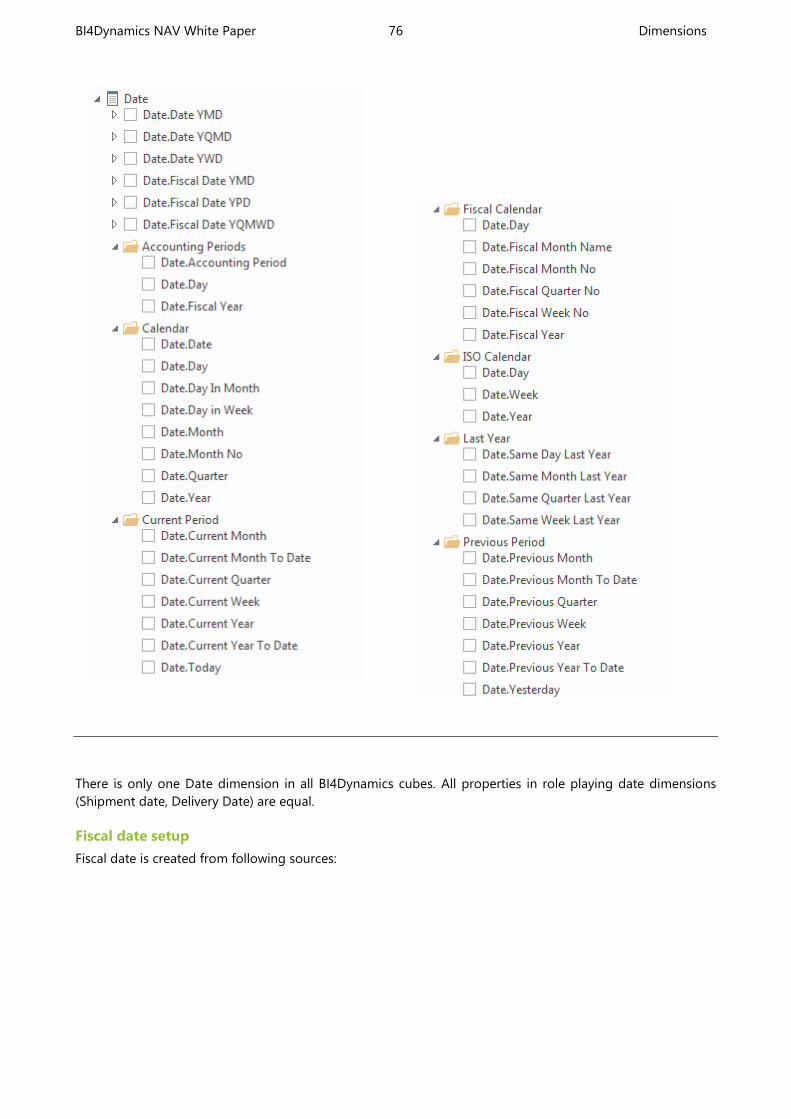
BI4Dynamics NAV White Paper 76 Dimensions
There is only one Date dimension in all BI4Dynamics cubes. All properties in role playing date dimensions
(Shipment date, Delivery Date) are equal.
Fiscal date setup
Fiscal date is created from following sources:
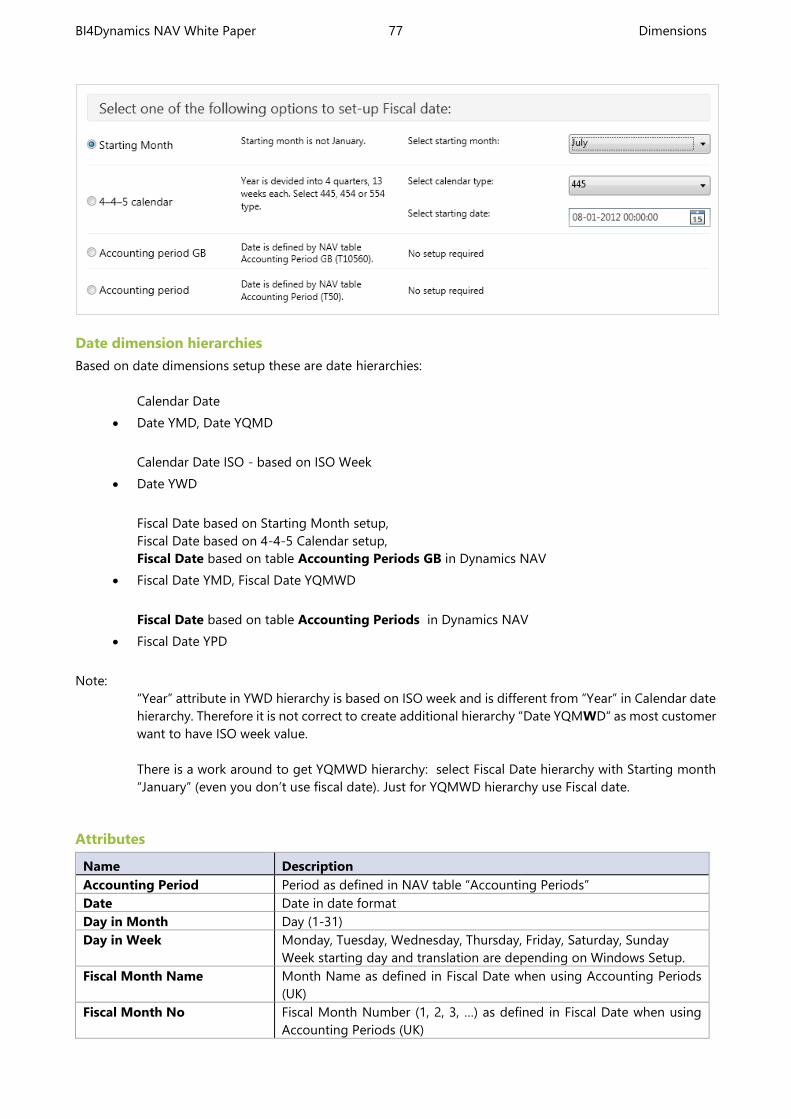
BI4Dynamics NAV White Paper 77 Dimensions
Date dimension hierarchies
Based on date dimensions setup these are date hierarchies:
Calendar Date
Date YMD, Date YQMD
Calendar Date ISO - based on ISO Week
Date YWD
Fiscal Date based on Starting Month setup,
Fiscal Date based on 4-4-5 Calendar setup,
Fiscal Date based on table Accounting Periods GB in Dynamics NAV
Fiscal Date YMD, Fiscal Date YQMWD
Fiscal Date based on table Accounting Periods in Dynamics NAV
Fiscal Date YPD
Note:
“Year” attribute in YWD hierarchy is based on ISO week and is different from “Year” in Calendar date
hierarchy. Therefore it is not correct to create additional hierarchy “Date YQMWD“ as most customer
want to have ISO week value.
There is a work around to get YQMWD hierarchy: select Fiscal Date hierarchy with Starting month
“January” (even you don’t use fiscal date). Just for YQMWD hierarchy use Fiscal date.
Attributes
Name Description
Accounting Period Period as defined in NAV table “Accounting Periods”
Date Date in date format
Day in Month Day (1-31)
Day in Week Monday, Tuesday, Wednesday, Thursday, Friday, Saturday, Sunday
Week starting day and translation are depending on Windows Setup.
Fiscal Month Name Month Name as defined in Fiscal Date when using Accounting Periods
(UK)
Fiscal Month No Fiscal Month Number (1, 2, 3, …) as defined in Fiscal Date when using
Accounting Periods (UK)
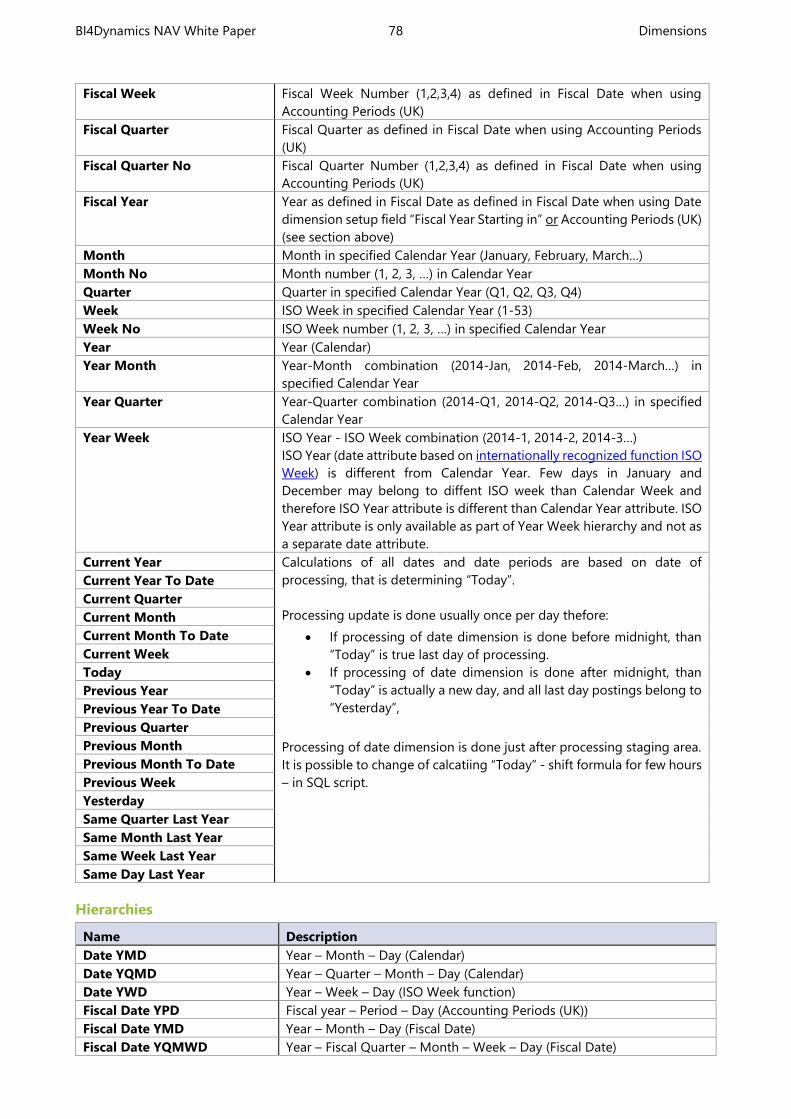
BI4Dynamics NAV White Paper 78 Dimensions
Fiscal Week Fiscal Week Number (1,2,3,4) as defined in Fiscal Date when using
Accounting Periods (UK)
Fiscal Quarter Fiscal Quarter as defined in Fiscal Date when using Accounting Periods
(UK)
Fiscal Quarter No Fiscal Quarter Number (1,2,3,4) as defined in Fiscal Date when using
Accounting Periods (UK)
Fiscal Year Year as defined in Fiscal Date as defined in Fiscal Date when using Date
dimension setup field “Fiscal Year Starting in” or Accounting Periods (UK)
(see section above)
Month Month in specified Calendar Year (January, February, March…)
Month No Month number (1, 2, 3, …) in Calendar Year
Quarter Quarter in specified Calendar Year (Q1, Q2, Q3, Q4)
Week ISO Week in specified Calendar Year (1-53)
Week No ISO Week number (1, 2, 3, …) in specified Calendar Year
Year Year (Calendar)
Year Month Year-Month combination (2014-Jan, 2014-Feb, 2014-March…) in
specified Calendar Year
Year Quarter Year-Quarter combination (2014-Q1, 2014-Q2, 2014-Q3…) in specified
Calendar Year
Year Week ISO Year - ISO Week combination (2014-1, 2014-2, 2014-3…)
ISO Year (date attribute based on internationally recognized function ISO
Week) is different from Calendar Year. Few days in January and
December may belong to diffent ISO week than Calendar Week and
therefore ISO Year attribute is different than Calendar Year attribute. ISO
Year attribute is only available as part of Year Week hierarchy and not as
a separate date attribute.
Current Year Calculations of all dates and date periods are based on date of
processing, that is determining “Today”.
Processing update is done usually once per day thefore:
If processing of date dimension is done before midnight, than
“Today” is true last day of processing.
If processing of date dimension is done after midnight, than
“Today” is actually a new day, and all last day postings belong to
“Yesterday”,
Processing of date dimension is done just after processing staging area.
It is possible to change of calcatiing “Today” - shift formula for few hours
– in SQL script.
Current Year To Date
Current Quarter
Current Month
Current Month To Date
Current Week
Today
Previous Year
Previous Year To Date
Previous Quarter
Previous Month
Previous Month To Date
Previous Week
Yesterday
Same Quarter Last Year
Same Month Last Year
Same Week Last Year
Same Day Last Year
Hierarchies
Name Description
Date YMD Year – Month – Day (Calendar)
Date YQMD Year – Quarter – Month – Day (Calendar)
Date YWD Year – Week – Day (ISO Week function)
Fiscal Date YPD Fiscal year – Period – Day (Accounting Periods (UK))
Fiscal Date YMD Year – Month – Day (Fiscal Date)
Fiscal Date YQMWD Year – Fiscal Quarter – Month – Week – Day (Fiscal Date)
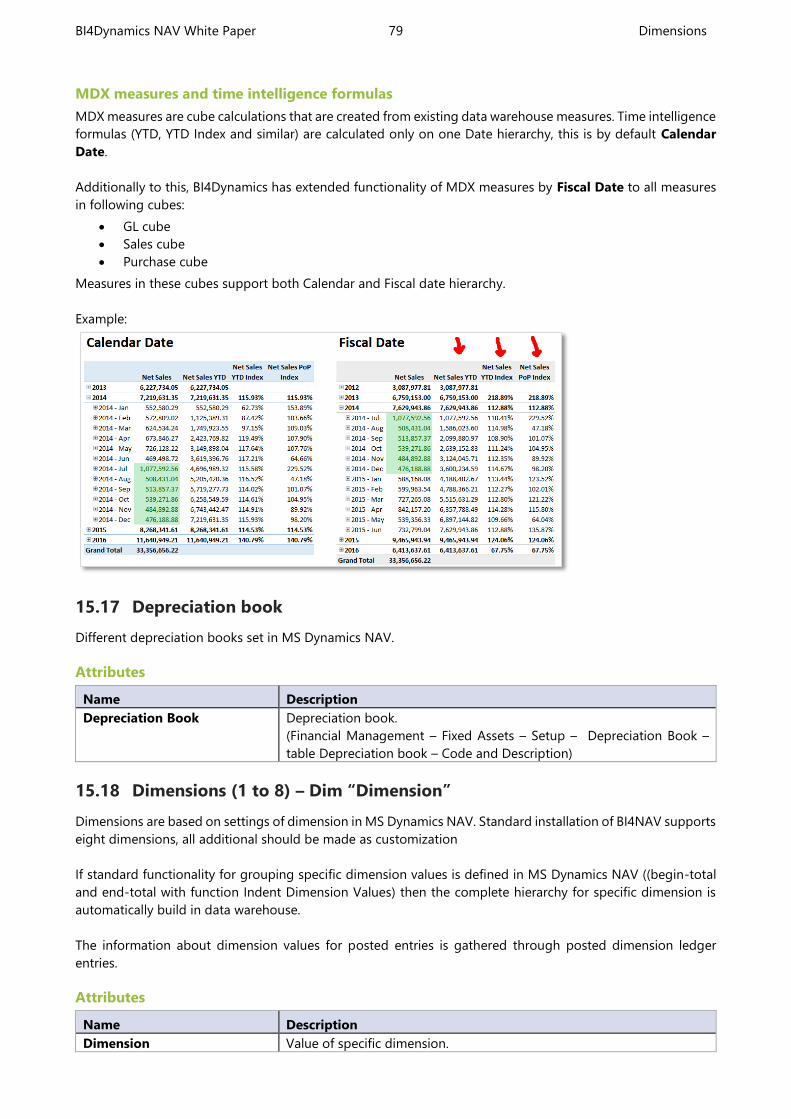
BI4Dynamics NAV White Paper 79 Dimensions
MDX measures and time intelligence formulas
MDX measures are cube calculations that are created from existing data warehouse measures. Time intelligence
formulas (YTD, YTD Index and similar) are calculated only on one Date hierarchy, this is by default Calendar
Date.
Additionally to this, BI4Dynamics has extended functionality of MDX measures by Fiscal Date to all measures
in following cubes:
GL cube
Sales cube
Purchase cube
Measures in these cubes support both Calendar and Fiscal date hierarchy.
Example:
15.17 Depreciation book
Different depreciation books set in MS Dynamics NAV.
Attributes
Name Description
Depreciation Book Depreciation book.
(Financial Management – Fixed Assets – Setup – Depreciation Book –
table Depreciation book – Code and Description)
15.18 Dimensions (1 to 8) – Dim “Dimension”
Dimensions are based on settings of dimension in MS Dynamics NAV. Standard installation of BI4NAV supports
eight dimensions, all additional should be made as customization
If standard functionality for grouping specific dimension values is defined in MS Dynamics NAV ((begin-total
and end-total with function Indent Dimension Values) then the complete hierarchy for specific dimension is
automatically build in data warehouse.
The information about dimension values for posted entries is gathered through posted dimension ledger
entries.
Attributes
Name Description
Dimension Value of specific dimension.
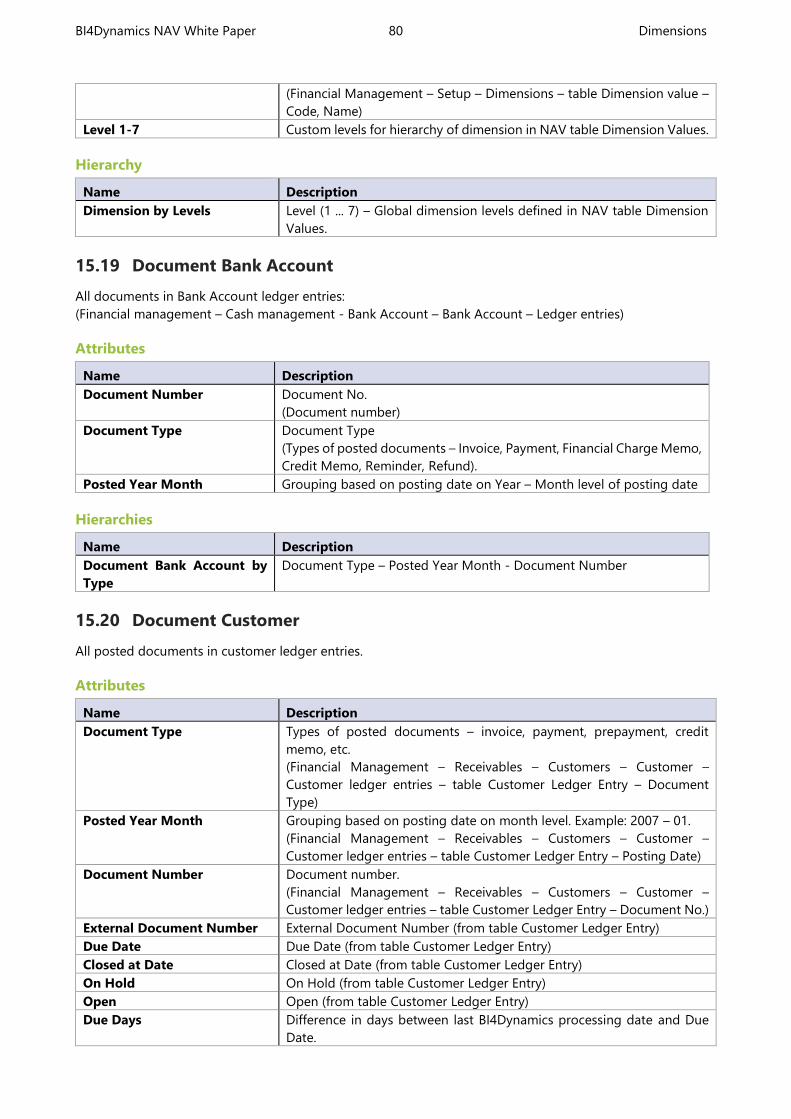
BI4Dynamics NAV White Paper 80 Dimensions
(Financial Management – Setup – Dimensions – table Dimension value –
Code, Name)
Level 1-7 Custom levels for hierarchy of dimension in NAV table Dimension Values.
Hierarchy
Name Description
Dimension by Levels Level (1 ... 7) – Global dimension levels defined in NAV table Dimension
Values.
15.19 Document Bank Account
All documents in Bank Account ledger entries:
(Financial management – Cash management - Bank Account – Bank Account – Ledger entries)
Attributes
Name Description
Document Number Document No.
(Document number)
Document Type Document Type
(Types of posted documents – Invoice, Payment, Financial Charge Memo,
Credit Memo, Reminder, Refund).
Posted Year Month Grouping based on posting date on Year – Month level of posting date
Hierarchies
Name Description
Document Bank Account by
Type
Document Type – Posted Year Month - Document Number
15.20 Document Customer
All posted documents in customer ledger entries.
Attributes
Name Description
Document Type Types of posted documents – invoice, payment, prepayment, credit
memo, etc.
(Financial Management – Receivables – Customers – Customer –
Customer ledger entries – table Customer Ledger Entry – Document
Type)
Posted Year Month Grouping based on posting date on month level. Example: 2007 – 01.
(Financial Management – Receivables – Customers – Customer –
Customer ledger entries – table Customer Ledger Entry – Posting Date)
Document Number Document number.
(Financial Management – Receivables – Customers – Customer –
Customer ledger entries – table Customer Ledger Entry – Document No.)
External Document Number External Document Number (from table Customer Ledger Entry)
Due Date Due Date (from table Customer Ledger Entry)
Closed at Date Closed at Date (from table Customer Ledger Entry)
On Hold On Hold (from table Customer Ledger Entry)
Open Open (from table Customer Ledger Entry)
Due Days Difference in days between last BI4Dynamics processing date and Due
Date.
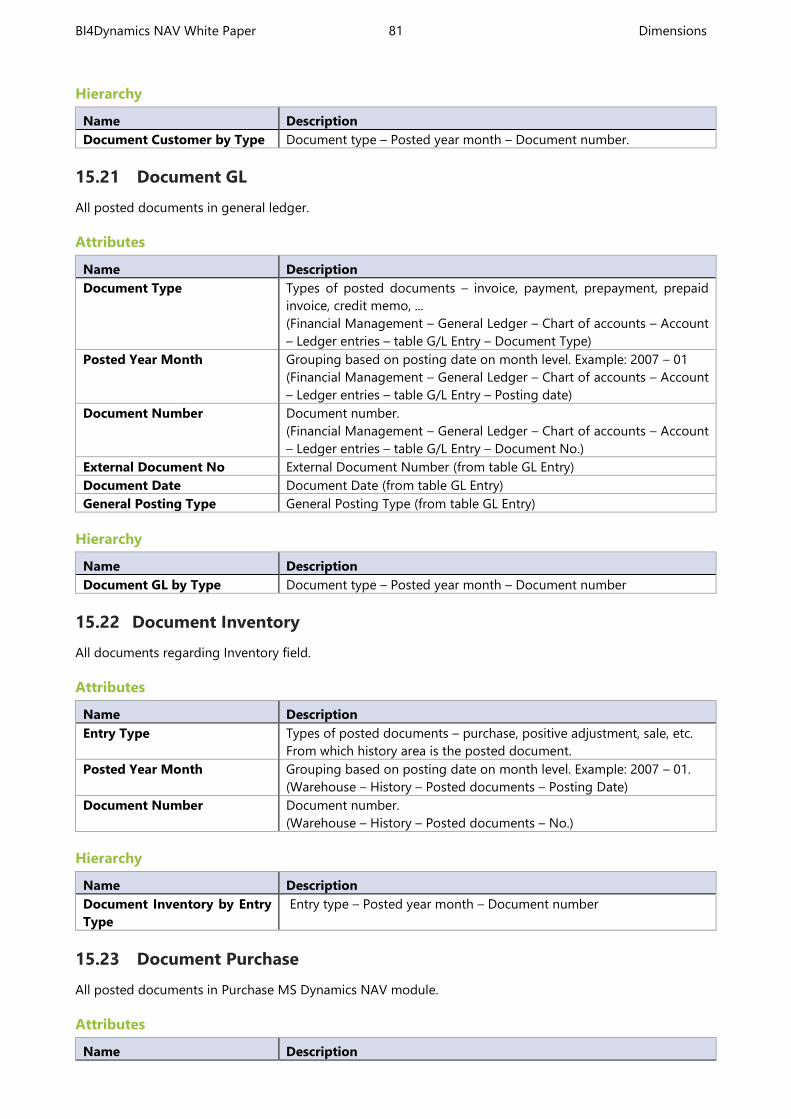
BI4Dynamics NAV White Paper 81 Dimensions
Hierarchy
Name Description
Document Customer by Type Document type – Posted year month – Document number.
15.21 Document GL
All posted documents in general ledger.
Attributes
Name Description
Document Type Types of posted documents – invoice, payment, prepayment, prepaid
invoice, credit memo, ...
(Financial Management – General Ledger – Chart of accounts – Account
– Ledger entries – table G/L Entry – Document Type)
Posted Year Month Grouping based on posting date on month level. Example: 2007 – 01
(Financial Management – General Ledger – Chart of accounts – Account
– Ledger entries – table G/L Entry – Posting date)
Document Number Document number.
(Financial Management – General Ledger – Chart of accounts – Account
– Ledger entries – table G/L Entry – Document No.)
External Document No External Document Number (from table GL Entry)
Document Date Document Date (from table GL Entry)
General Posting Type General Posting Type (from table GL Entry)
Hierarchy
Name Description
Document GL by Type Document type – Posted year month – Document number
15.22 Document Inventory
All documents regarding Inventory field.
Attributes
Name Description
Entry Type Types of posted documents – purchase, positive adjustment, sale, etc.
From which history area is the posted document.
Posted Year Month Grouping based on posting date on month level. Example: 2007 – 01.
(Warehouse – History – Posted documents – Posting Date)
Document Number Document number.
(Warehouse – History – Posted documents – No.)
Hierarchy
Name Description
Document Inventory by Entry
Type
Entry type – Posted year month – Document number
15.23 Document Purchase
All posted documents in Purchase MS Dynamics NAV module.
Attributes
Name Description
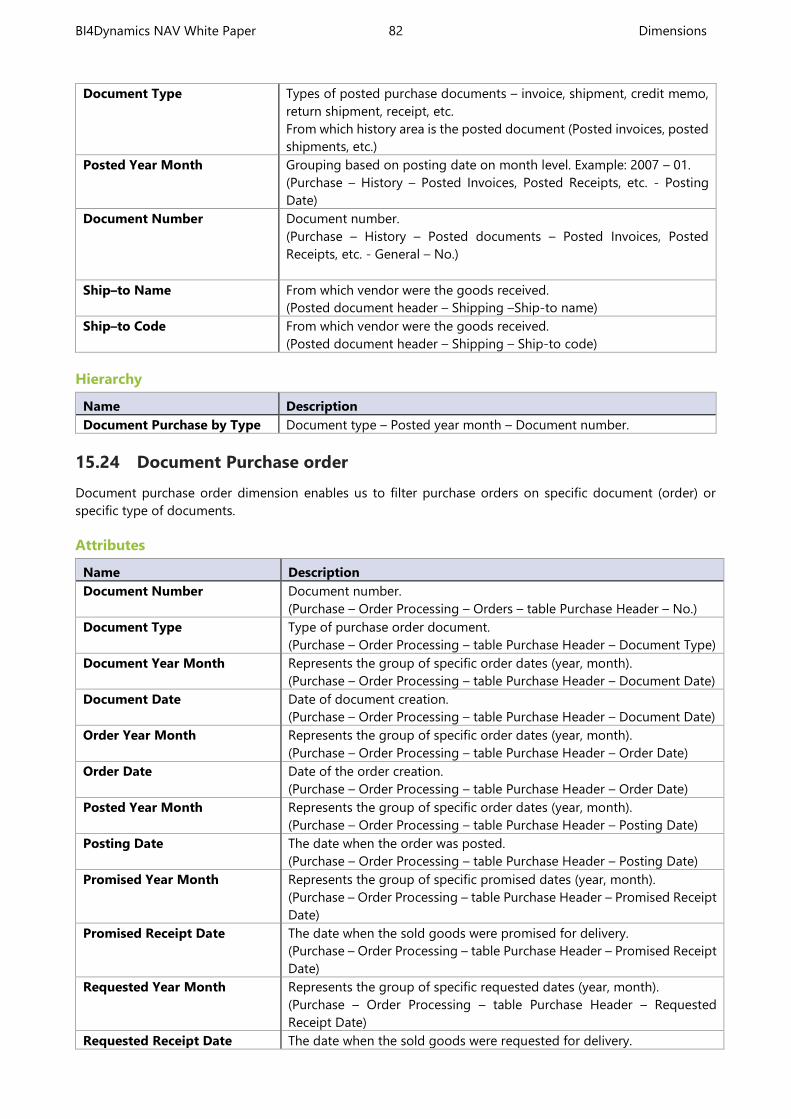
BI4Dynamics NAV White Paper 82 Dimensions
Document Type Types of posted purchase documents – invoice, shipment, credit memo,
return shipment, receipt, etc.
From which history area is the posted document (Posted invoices, posted
shipments, etc.)
Posted Year Month Grouping based on posting date on month level. Example: 2007 – 01.
(Purchase – History – Posted Invoices, Posted Receipts, etc. - Posting
Date)
Document Number Document number.
(Purchase – History – Posted documents – Posted Invoices, Posted
Receipts, etc. - General – No.)
Ship–to Name From which vendor were the goods received.
(Posted document header – Shipping –Ship-to name)
Ship–to Code From which vendor were the goods received.
(Posted document header – Shipping – Ship-to code)
Hierarchy
Name Description
Document Purchase by Type Document type – Posted year month – Document number.
15.24 Document Purchase order
Document purchase order dimension enables us to filter purchase orders on specific document (order) or
specific type of documents.
Attributes
Name Description
Document Number Document number.
(Purchase – Order Processing – Orders – table Purchase Header – No.)
Document Type Type of purchase order document.
(Purchase – Order Processing – table Purchase Header – Document Type)
Document Year Month Represents the group of specific order dates (year, month).
(Purchase – Order Processing – table Purchase Header – Document Date)
Document Date Date of document creation.
(Purchase – Order Processing – table Purchase Header – Document Date)
Order Year Month Represents the group of specific order dates (year, month).
(Purchase – Order Processing – table Purchase Header – Order Date)
Order Date Date of the order creation.
(Purchase – Order Processing – table Purchase Header – Order Date)
Posted Year Month Represents the group of specific order dates (year, month).
(Purchase – Order Processing – table Purchase Header – Posting Date)
Posting Date The date when the order was posted.
(Purchase – Order Processing – table Purchase Header – Posting Date)
Promised Year Month Represents the group of specific promised dates (year, month).
(Purchase – Order Processing – table Purchase Header – Promised Receipt
Date)
Promised Receipt Date The date when the sold goods were promised for delivery.
(Purchase – Order Processing – table Purchase Header – Promised Receipt
Date)
Requested Year Month Represents the group of specific requested dates (year, month).
(Purchase – Order Processing – table Purchase Header – Requested
Receipt Date)
Requested Receipt Date The date when the sold goods were requested for delivery.
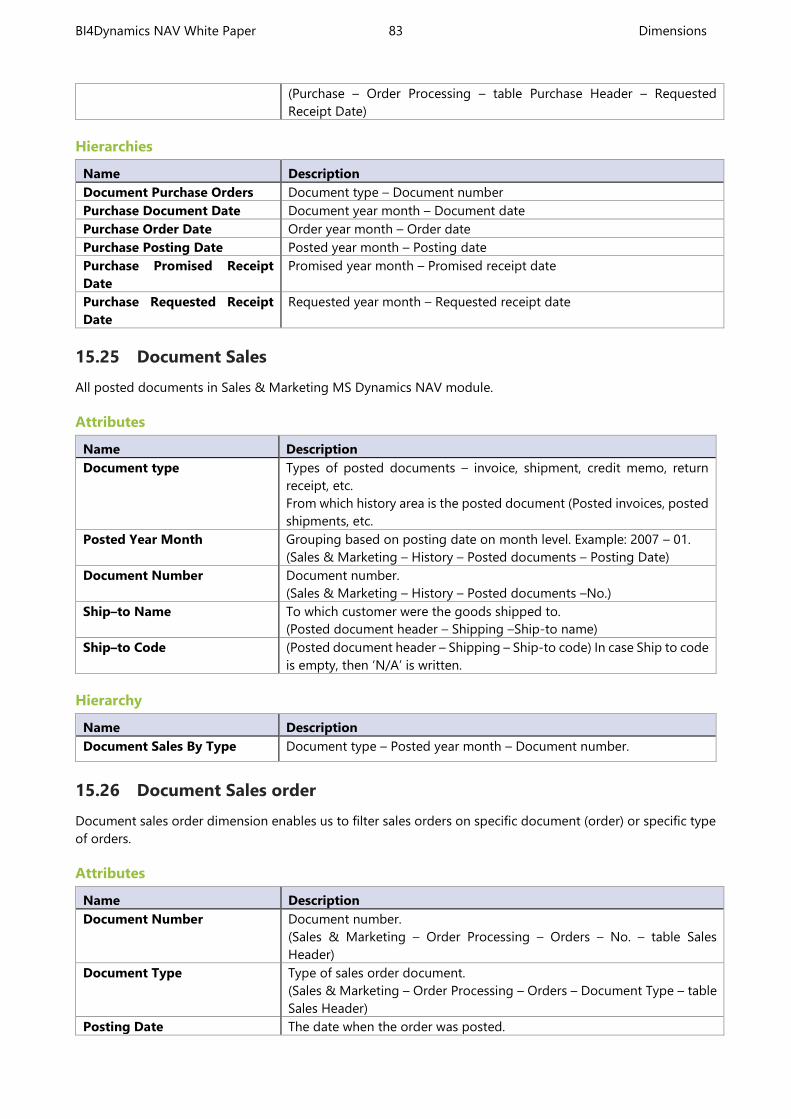
BI4Dynamics NAV White Paper 83 Dimensions
(Purchase – Order Processing – table Purchase Header – Requested
Receipt Date)
Hierarchies
Name Description
Document Purchase Orders Document type – Document number
Purchase Document Date Document year month – Document date
Purchase Order Date Order year month – Order date
Purchase Posting Date Posted year month – Posting date
Purchase Promised Receipt
Date
Promised year month – Promised receipt date
Purchase Requested Receipt
Date
Requested year month – Requested receipt date
15.25 Document Sales
All posted documents in Sales & Marketing MS Dynamics NAV module.
Attributes
Name Description
Document type Types of posted documents – invoice, shipment, credit memo, return
receipt, etc.
From which history area is the posted document (Posted invoices, posted
shipments, etc.
Posted Year Month Grouping based on posting date on month level. Example: 2007 – 01.
(Sales & Marketing – History – Posted documents – Posting Date)
Document Number Document number.
(Sales & Marketing – History – Posted documents –No.)
Ship–to Name To which customer were the goods shipped to.
(Posted document header – Shipping –Ship-to name)
Ship–to Code (Posted document header – Shipping – Ship-to code) In case Ship to code
is empty, then ‘N/A’ is written.
Hierarchy
Name Description
Document Sales By Type Document type – Posted year month – Document number.
15.26 Document Sales order
Document sales order dimension enables us to filter sales orders on specific document (order) or specific type
of orders.
Attributes
Name Description
Document Number Document number.
(Sales & Marketing – Order Processing – Orders – No. – table Sales
Header)
Document Type Type of sales order document.
(Sales & Marketing – Order Processing – Orders – Document Type – table
Sales Header)
Posting Date The date when the order was posted.

BI4Dynamics NAV White Paper 84 Dimensions
(Sales & Marketing – Order Processing – Orders – Posting Date – table
Sales Header)
Posted Year Month Represents the group of specific posted dates (year, month).
(Sales & Marketing – Order Processing – Orders – Posting Date – table
Sales Header)
Order Date Date of the order creation.
(Sales & Marketing – Order Processing – Orders – Order Date – table Sales
Header)
Order Year Month Represents the group of specific order dates (year, month).
( Sales & Marketing – Order Processing – Orders – Order Date – table Sales
Header)
Document Date Date of the document creation.
(Sales & Marketing – Order Processing – Orders – Document Date – table
Sales Header)
Document Year Month Represents the group of specific document dates (year, month).
(Sales & Marketing – Order Processing – Orders – Document Date – table
Sales Header)
Requested Delivery Date The date on which customer requests delivery.
(Sales & Marketing – Order Processing – Orders – Requested Delivery Date
– table Sales Header)
Requested Year Month Represents the group of specific requested dates (year, month).
(Sales & Marketing – Order Processing – Orders – Requested Delivery Date
– table Sales Header)
Promised Delivery Date The date when the sold goods were promised for delivery.
(Sales & Marketing – Order Processing – Orders – Promised Delivery Date
– table Sales Header)
Promised Year Month Represents the group of specific promised dates (year, month).
(Sales & Marketing – Order Processing – Orders – Promised Delivery Date
– table Sales Header)
Hierarchies
Name Description
Document Sales Orders Document type – Document number
Sales Document Date Document year month – Document date
Sales Order Date Order year month – Order date
Sales Posting Date Posted year month – Posting date
Sales Promised Delivery Date Promised year month – Promised delivery date
Sales Requested Delivery Date Requested year month – Requested delivery date
15.27 Document Service
All posted documents through service module. Dimension is available only if NAV data source is 5.0 or higher.
Attributes
Name Description
Document Type Types of posted documents – invoice, credit memo, shipment.
(Service – History – Posted Shipments/Invoices/Credit memos – table
Service shipment header, Service invoice header, Service cr. Memo header.
Posted Year Month Grouping based on posting date on month level. Example: 2007 – 01.
(Service – History – Posted Shipments/Invoices/Credit memos – table
Service shipment header, Service invoice header, Service cr. Memo header
– Posting Date)
Document Number Document number.
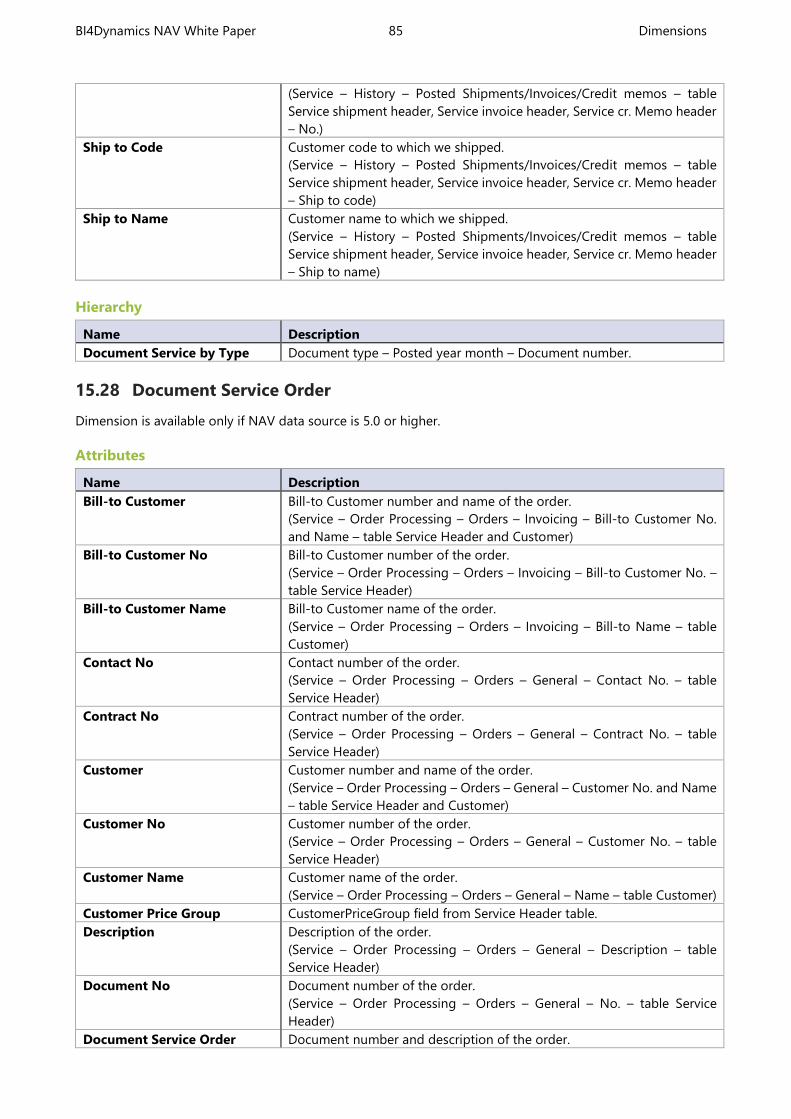
BI4Dynamics NAV White Paper 85 Dimensions
(Service – History – Posted Shipments/Invoices/Credit memos – table
Service shipment header, Service invoice header, Service cr. Memo header
– No.)
Ship to Code Customer code to which we shipped.
(Service – History – Posted Shipments/Invoices/Credit memos – table
Service shipment header, Service invoice header, Service cr. Memo header
– Ship to code)
Ship to Name Customer name to which we shipped.
(Service – History – Posted Shipments/Invoices/Credit memos – table
Service shipment header, Service invoice header, Service cr. Memo header
– Ship to name)
Hierarchy
Name Description
Document Service by Type Document type – Posted year month – Document number.
15.28 Document Service Order
Dimension is available only if NAV data source is 5.0 or higher.
Attributes
Name Description
Bill-to Customer Bill-to Customer number and name of the order.
(Service – Order Processing – Orders – Invoicing – Bill-to Customer No.
and Name – table Service Header and Customer)
Bill-to Customer No Bill-to Customer number of the order.
(Service – Order Processing – Orders – Invoicing – Bill-to Customer No. –
table Service Header)
Bill-to Customer Name Bill-to Customer name of the order.
(Service – Order Processing – Orders – Invoicing – Bill-to Name – table
Customer)
Contact No Contact number of the order.
(Service – Order Processing – Orders – General – Contact No. – table
Service Header)
Contract No Contract number of the order.
(Service – Order Processing – Orders – General – Contract No. – table
Service Header)
Customer Customer number and name of the order.
(Service – Order Processing – Orders – General – Customer No. and Name
– table Service Header and Customer)
Customer No Customer number of the order.
(Service – Order Processing – Orders – General – Customer No. – table
Service Header)
Customer Name Customer name of the order.
(Service – Order Processing – Orders – General – Name – table Customer)
Customer Price Group CustomerPriceGroup field from Service Header table.
Description Description of the order.
(Service – Order Processing – Orders – General – Description – table
Service Header)
Document No Document number of the order.
(Service – Order Processing – Orders – General – No. – table Service
Header)
Document Service Order Document number and description of the order.
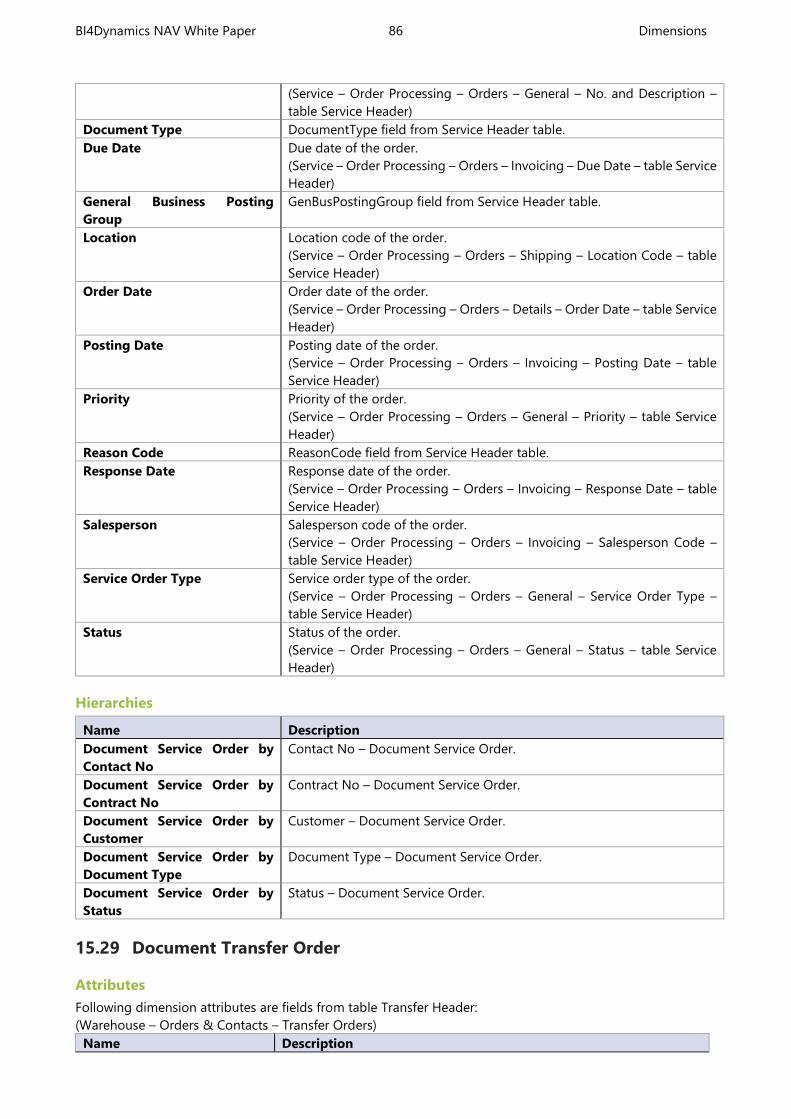
BI4Dynamics NAV White Paper 86 Dimensions
(Service – Order Processing – Orders – General – No. and Description –
table Service Header)
Document Type DocumentType field from Service Header table.
Due Date Due date of the order.
(Service – Order Processing – Orders – Invoicing – Due Date – table Service
Header)
General Business Posting
Group
GenBusPostingGroup field from Service Header table.
Location Location code of the order.
(Service – Order Processing – Orders – Shipping – Location Code – table
Service Header)
Order Date Order date of the order.
(Service – Order Processing – Orders – Details – Order Date – table Service
Header)
Posting Date Posting date of the order.
(Service – Order Processing – Orders – Invoicing – Posting Date – table
Service Header)
Priority Priority of the order.
(Service – Order Processing – Orders – General – Priority – table Service
Header)
Reason Code ReasonCode field from Service Header table.
Response Date Response date of the order.
(Service – Order Processing – Orders – Invoicing – Response Date – table
Service Header)
Salesperson Salesperson code of the order.
(Service – Order Processing – Orders – Invoicing – Salesperson Code –
table Service Header)
Service Order Type Service order type of the order.
(Service – Order Processing – Orders – General – Service Order Type –
table Service Header)
Status Status of the order.
(Service – Order Processing – Orders – General – Status – table Service
Header)
Hierarchies
Name Description
Document Service Order by
Contact No
Contact No – Document Service Order.
Document Service Order by
Contract No
Contract No – Document Service Order.
Document Service Order by
Customer
Customer – Document Service Order.
Document Service Order by
Document Type
Document Type – Document Service Order.
Document Service Order by
Status
Status – Document Service Order.
15.29 Document Transfer Order
Attributes
Following dimension attributes are fields from table Transfer Header:
(Warehouse – Orders & Contacts – Transfer Orders)
Name Description
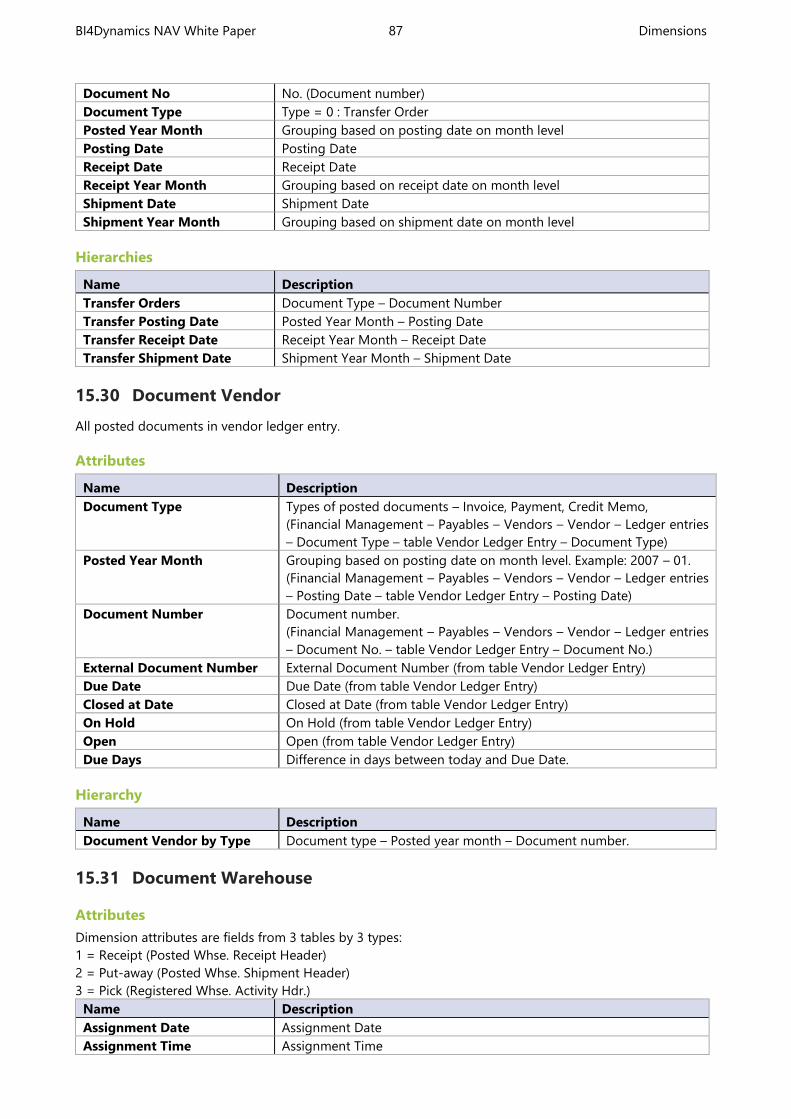
BI4Dynamics NAV White Paper 87 Dimensions
Document No No. (Document number)
Document Type Type = 0 : Transfer Order
Posted Year Month Grouping based on posting date on month level
Posting Date Posting Date
Receipt Date Receipt Date
Receipt Year Month Grouping based on receipt date on month level
Shipment Date Shipment Date
Shipment Year Month Grouping based on shipment date on month level
Hierarchies
Name Description
Transfer Orders Document Type – Document Number
Transfer Posting Date Posted Year Month – Posting Date
Transfer Receipt Date Receipt Year Month – Receipt Date
Transfer Shipment Date Shipment Year Month – Shipment Date
15.30 Document Vendor
All posted documents in vendor ledger entry.
Attributes
Name Description
Document Type Types of posted documents – Invoice, Payment, Credit Memo,
(Financial Management – Payables – Vendors – Vendor – Ledger entries
– Document Type – table Vendor Ledger Entry – Document Type)
Posted Year Month Grouping based on posting date on month level. Example: 2007 – 01.
(Financial Management – Payables – Vendors – Vendor – Ledger entries
– Posting Date – table Vendor Ledger Entry – Posting Date)
Document Number Document number.
(Financial Management – Payables – Vendors – Vendor – Ledger entries
– Document No. – table Vendor Ledger Entry – Document No.)
External Document Number External Document Number (from table Vendor Ledger Entry)
Due Date Due Date (from table Vendor Ledger Entry)
Closed at Date Closed at Date (from table Vendor Ledger Entry)
On Hold On Hold (from table Vendor Ledger Entry)
Open Open (from table Vendor Ledger Entry)
Due Days Difference in days between today and Due Date.
Hierarchy
Name Description
Document Vendor by Type Document type – Posted year month – Document number.
15.31 Document Warehouse
Attributes
Dimension attributes are fields from 3 tables by 3 types:
1 = Receipt (Posted Whse. Receipt Header)
2 = Put-away (Posted Whse. Shipment Header)
3 = Pick (Registered Whse. Activity Hdr.)
Name Description
Assignment Date Assignment Date
Assignment Time Assignment Time

BI4Dynamics NAV White Paper 88 Dimensions
Document No Document number from list of document types in Document Type
attribute.
Document Type 1 = Receipt (Posted Whse. Receipt Header)
2 = Put-away (Posted Whse. Shipment Header)
3 = Pick (Registered Whse. Activity Hdr.)
Posted Year Month Grouping based on posting date on year-month level
Vendor Shipment No Field “Vendor Shipment No.” from on document
(only for Type=Receipt)
Hierarchies
Name Description
Document Warehouse by
Type
Document Type – Posted Year Month – Document No
Document Warehouse by
Vendor
Vendor Shipment – Document No
15.32 Document Warehouse Open
Attributes
Dimension attributes are fields below listed tables that are created in Snapshot database functionality of
Warehouse module. It includes following snapshot tables that have been created by adequate header and lines
(list by Document Type):
1: Warehouse Receipt = Warehouse Receipt Header + Warehouse Receipt Line
2: Warehouse Shipment = Warehouse Shipment Header + Warehouse Shipment Line
3: Warehouse Activity = Warehouse Activity Header + Warehouse Activity Line
Name Description
Assignment Date Assignment Date
Assignment Time Assignment Time
Assignment Year Month Grouping based on Assignment date on year-month level
Document No Document number
Document Type Option type:
1: Warehouse Receipt
2: Warehouse Shipment
3: Warehouse Activity
Ending Date Ending Date
Ending Time Ending Time
Ending Year Month Ending Year Month
Last Print Date Time Last Print Date Time
(available for Warehouse Receipt)
Posted Year Month Grouping based on posting date on year-month level
Posting Date Posting Date
Shipment Date Shipment Date
(available for Warehouse Shipment and Warehouse Activity, N/A for
Warehouse Receipt)
Shipment Year Month Shipment Year Month
(available for Warehouse Shipment and Warehouse Activity, N/A for
Warehouse Receipt)
Source No “Source No” field on related Warehouse document is “Document
number” of source document: Sales Order, Sales Return Order, Purchase
Order, Purchase Return Order, Outbound Transfer
Starting Date Starting Date
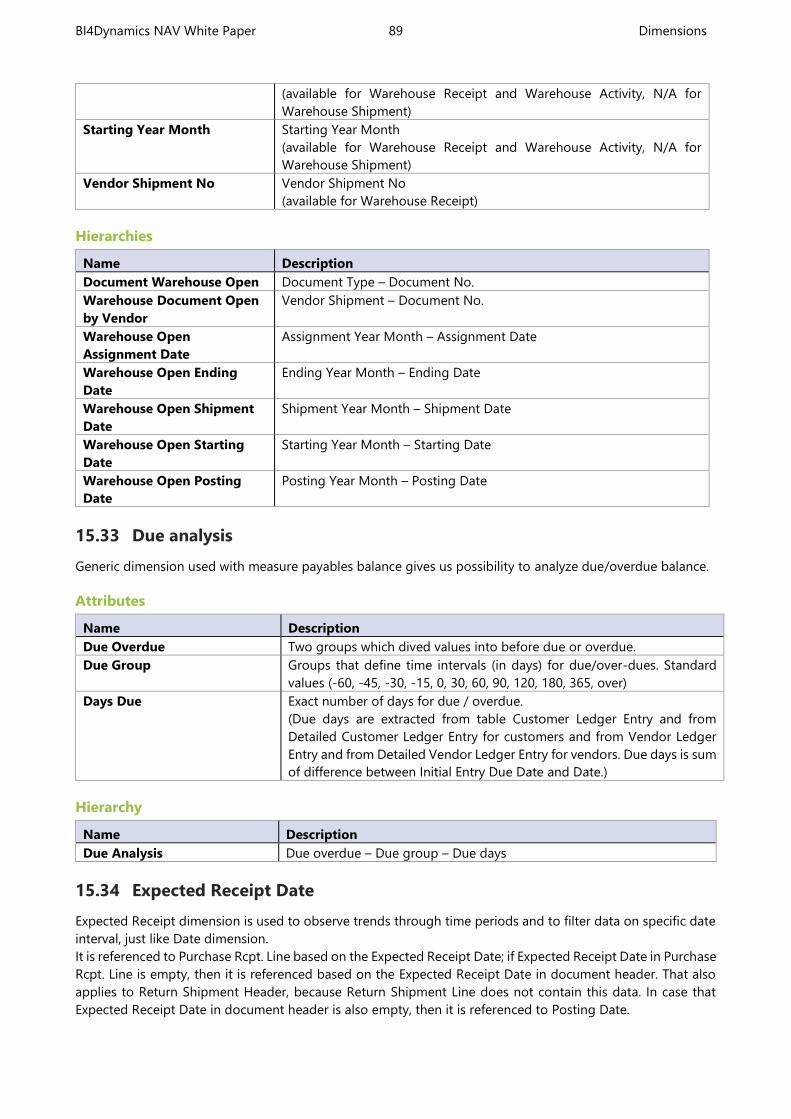
BI4Dynamics NAV White Paper 89 Dimensions
(available for Warehouse Receipt and Warehouse Activity, N/A for
Warehouse Shipment)
Starting Year Month Starting Year Month
(available for Warehouse Receipt and Warehouse Activity, N/A for
Warehouse Shipment)
Vendor Shipment No Vendor Shipment No
(available for Warehouse Receipt)
Hierarchies
Name Description
Document Warehouse Open Document Type – Document No.
Warehouse Document Open
by Vendor
Vendor Shipment – Document No.
Warehouse Open
Assignment Date
Assignment Year Month – Assignment Date
Warehouse Open Ending
Date
Ending Year Month – Ending Date
Warehouse Open Shipment
Date
Shipment Year Month – Shipment Date
Warehouse Open Starting
Date
Starting Year Month – Starting Date
Warehouse Open Posting
Date
Posting Year Month – Posting Date
15.33 Due analysis
Generic dimension used with measure payables balance gives us possibility to analyze due/overdue balance.
Attributes
Name Description
Due Overdue Two groups which dived values into before due or overdue.
Due Group Groups that define time intervals (in days) for due/over-dues. Standard
values (-60, -45, -30, -15, 0, 30, 60, 90, 120, 180, 365, over)
Days Due Exact number of days for due / overdue.
(Due days are extracted from table Customer Ledger Entry and from
Detailed Customer Ledger Entry for customers and from Vendor Ledger
Entry and from Detailed Vendor Ledger Entry for vendors. Due days is sum
of difference between Initial Entry Due Date and Date.)
Hierarchy
Name Description
Due Analysis Due overdue – Due group – Due days
15.34 Expected Receipt Date
Expected Receipt dimension is used to observe trends through time periods and to filter data on specific date
interval, just like Date dimension.
It is referenced to Purchase Rcpt. Line based on the Expected Receipt Date; if Expected Receipt Date in Purchase
Rcpt. Line is empty, then it is referenced based on the Expected Receipt Date in document header. That also
applies to Return Shipment Header, because Return Shipment Line does not contain this data. In case that
Expected Receipt Date in document header is also empty, then it is referenced to Posting Date.
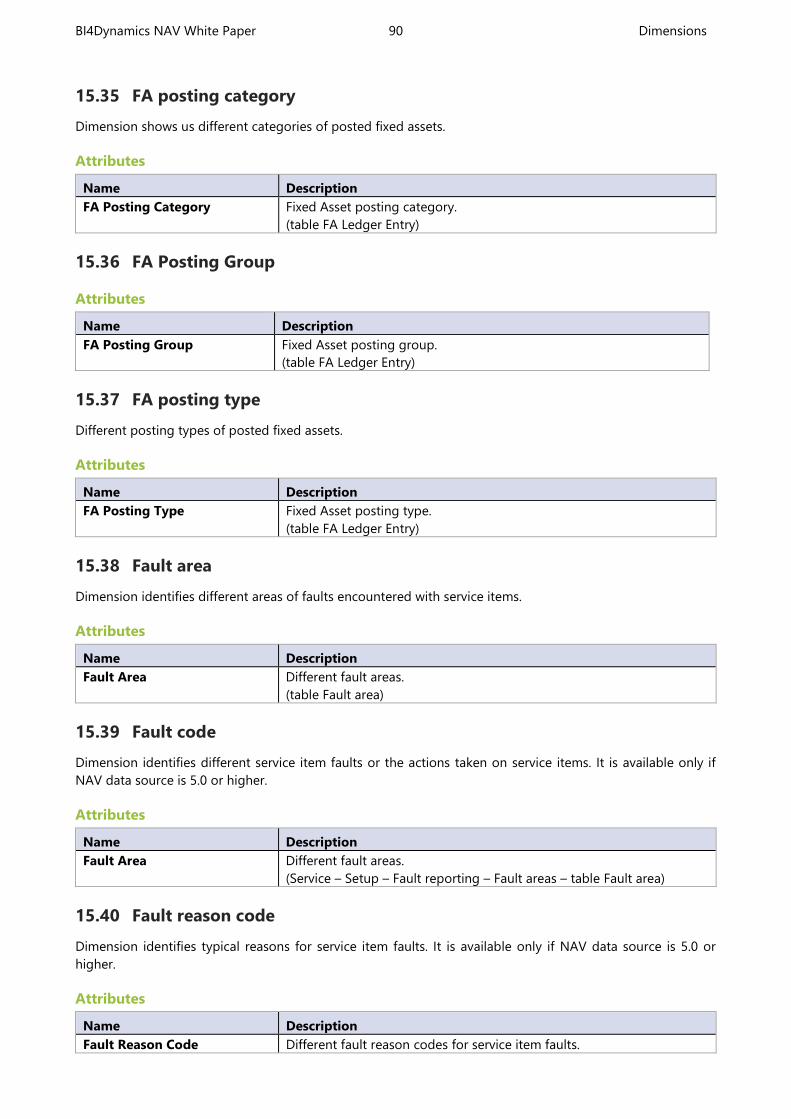
BI4Dynamics NAV White Paper 90 Dimensions
15.35 FA posting category
Dimension shows us different categories of posted fixed assets.
Attributes
Name Description
FA Posting Category Fixed Asset posting category.
(table FA Ledger Entry)
15.36 FA Posting Group
Attributes
Name Description
FA Posting Group Fixed Asset posting group.
(table FA Ledger Entry)
15.37 FA posting type
Different posting types of posted fixed assets.
Attributes
Name Description
FA Posting Type Fixed Asset posting type.
(table FA Ledger Entry)
15.38 Fault area
Dimension identifies different areas of faults encountered with service items.
Attributes
Name Description
Fault Area Different fault areas.
(table Fault area)
15.39 Fault code
Dimension identifies different service item faults or the actions taken on service items. It is available only if
NAV data source is 5.0 or higher.
Attributes
Name Description
Fault Area Different fault areas.
(Service – Setup – Fault reporting – Fault areas – table Fault area)
15.40 Fault reason code
Dimension identifies typical reasons for service item faults. It is available only if NAV data source is 5.0 or
higher.
Attributes
Name Description
Fault Reason Code Different fault reason codes for service item faults.
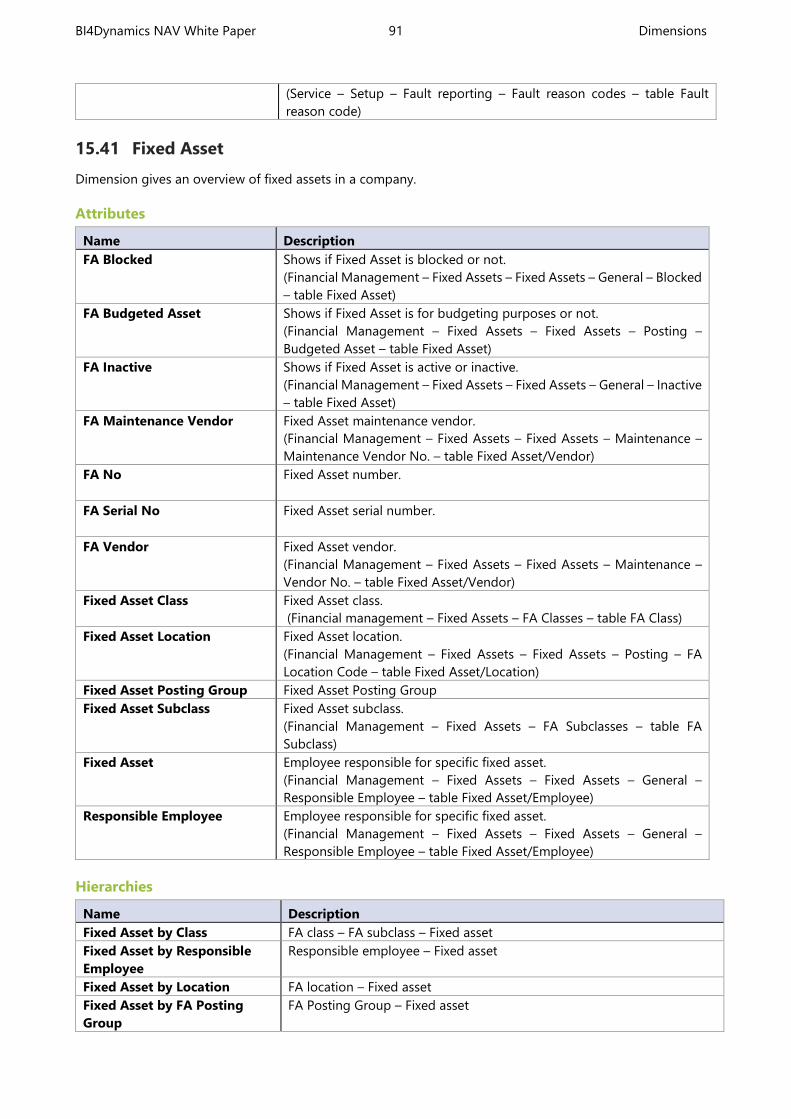
BI4Dynamics NAV White Paper 91 Dimensions
(Service – Setup – Fault reporting – Fault reason codes – table Fault
reason code)
15.41 Fixed Asset
Dimension gives an overview of fixed assets in a company.
Attributes
Name Description
FA Blocked Shows if Fixed Asset is blocked or not.
(Financial Management – Fixed Assets – Fixed Assets – General – Blocked
– table Fixed Asset)
FA Budgeted Asset Shows if Fixed Asset is for budgeting purposes or not.
(Financial Management – Fixed Assets – Fixed Assets – Posting –
Budgeted Asset – table Fixed Asset)
FA Inactive Shows if Fixed Asset is active or inactive.
(Financial Management – Fixed Assets – Fixed Assets – General – Inactive
– table Fixed Asset)
FA Maintenance Vendor Fixed Asset maintenance vendor.
(Financial Management – Fixed Assets – Fixed Assets – Maintenance –
Maintenance Vendor No. – table Fixed Asset/Vendor)
FA No Fixed Asset number.
FA Serial No Fixed Asset serial number.
FA Vendor Fixed Asset vendor.
(Financial Management – Fixed Assets – Fixed Assets – Maintenance –
Vendor No. – table Fixed Asset/Vendor)
Fixed Asset Class Fixed Asset class.
(Financial management – Fixed Assets – FA Classes – table FA Class)
Fixed Asset Location Fixed Asset location.
(Financial Management – Fixed Assets – Fixed Assets – Posting – FA
Location Code – table Fixed Asset/Location)
Fixed Asset Posting Group Fixed Asset Posting Group
Fixed Asset Subclass Fixed Asset subclass.
(Financial Management – Fixed Assets – FA Subclasses – table FA
Subclass)
Fixed Asset Employee responsible for specific fixed asset.
(Financial Management – Fixed Assets – Fixed Assets – General –
Responsible Employee – table Fixed Asset/Employee)
Responsible Employee Employee responsible for specific fixed asset.
(Financial Management – Fixed Assets – Fixed Assets – General –
Responsible Employee – table Fixed Asset/Employee)
Hierarchies
Name Description
Fixed Asset by Class FA class – FA subclass – Fixed asset
Fixed Asset by Responsible
Employee
Responsible employee – Fixed asset
Fixed Asset by Location FA location – Fixed asset
Fixed Asset by FA Posting
Group
FA Posting Group – Fixed asset
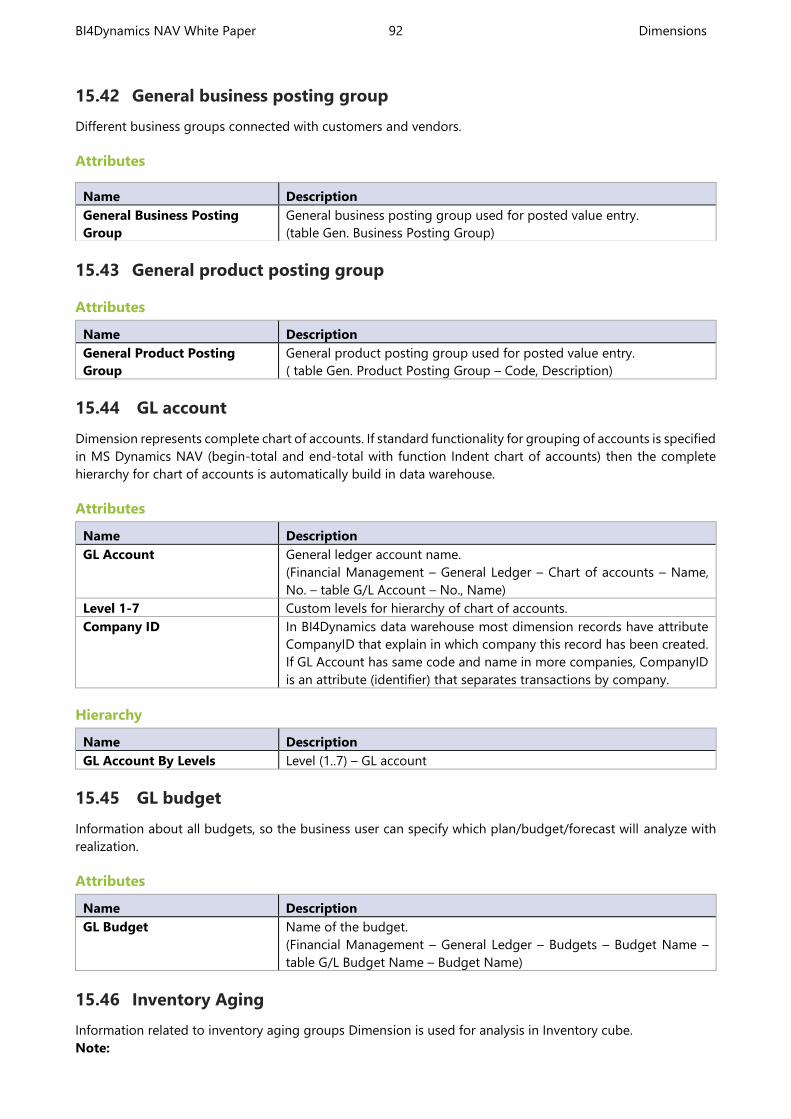
BI4Dynamics NAV White Paper 92 Dimensions
15.42 General business posting group
Different business groups connected with customers and vendors.
Attributes
15.43 General product posting group
Attributes
Name Description
General Product Posting
Group
General product posting group used for posted value entry.
( table Gen. Product Posting Group – Code, Description)
15.44 GL account
Dimension represents complete chart of accounts. If standard functionality for grouping of accounts is specified
in MS Dynamics NAV (begin-total and end-total with function Indent chart of accounts) then the complete
hierarchy for chart of accounts is automatically build in data warehouse.
Attributes
Name Description
GL Account General ledger account name.
(Financial Management – General Ledger – Chart of accounts – Name,
No. – table G/L Account – No., Name)
Level 1-7 Custom levels for hierarchy of chart of accounts.
Company ID In BI4Dynamics data warehouse most dimension records have attribute
CompanyID that explain in which company this record has been created.
If GL Account has same code and name in more companies, CompanyID
is an attribute (identifier) that separates transactions by company.
Hierarchy
Name Description
GL Account By Levels Level (1..7) – GL account
15.45 GL budget
Information about all budgets, so the business user can specify which plan/budget/forecast will analyze with
realization.
Attributes
Name Description
GL Budget Name of the budget.
(Financial Management – General Ledger – Budgets – Budget Name –
table G/L Budget Name – Budget Name)
15.46 Inventory Aging
Information related to inventory aging groups Dimension is used for analysis in Inventory cube.
Note:
Name Description
General Business Posting
Group
General business posting group used for posted value entry.
(table Gen. Business Posting Group)
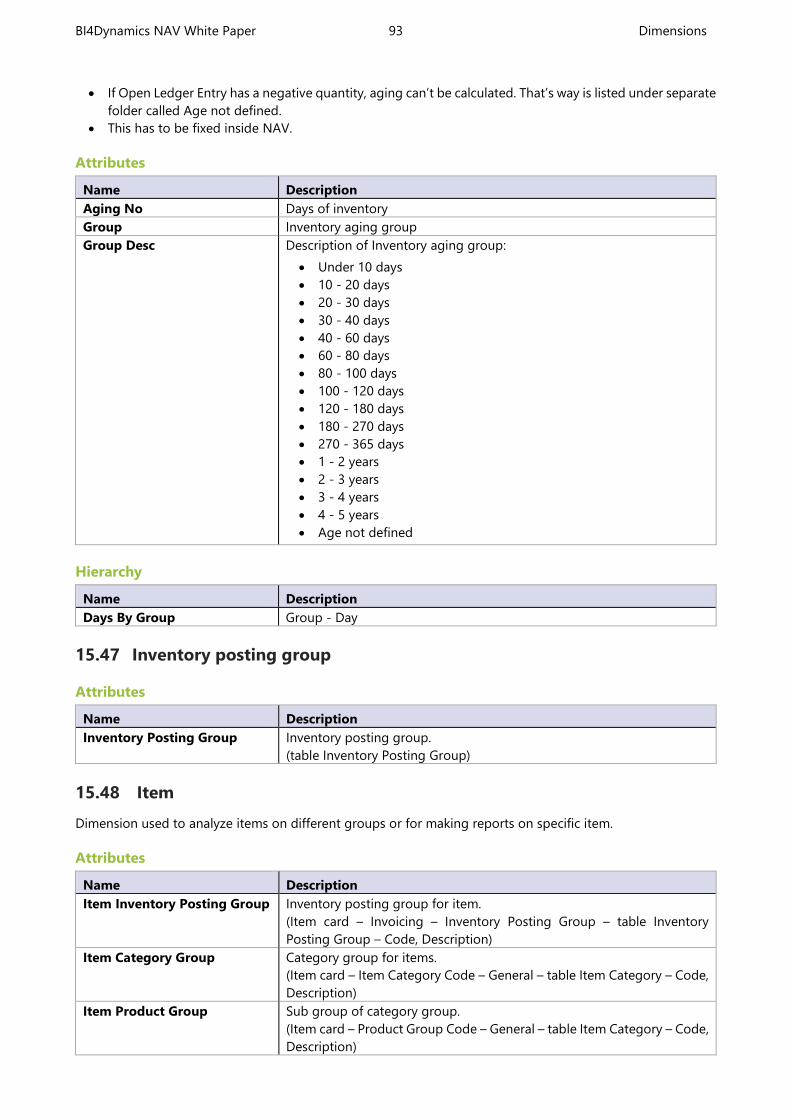
BI4Dynamics NAV White Paper 93 Dimensions
If Open Ledger Entry has a negative quantity, aging can’t be calculated. That’s way is listed under separate
folder called Age not defined.
This has to be fixed inside NAV.
Attributes
Name Description
Aging No Days of inventory
Group Inventory aging group
Group Desc Description of Inventory aging group:
Under 10 days
10 - 20 days
20 - 30 days
30 - 40 days
40 - 60 days
60 - 80 days
80 - 100 days
100 - 120 days
120 - 180 days
180 - 270 days
270 - 365 days
1 - 2 years
2 - 3 years
3 - 4 years
4 - 5 years
Age not defined
Hierarchy
Name Description
Days By Group Group - Day
15.47 Inventory posting group
Attributes
Name Description
Inventory Posting Group Inventory posting group.
(table Inventory Posting Group)
15.48 Item
Dimension used to analyze items on different groups or for making reports on specific item.
Attributes
Name Description
Item Inventory Posting Group Inventory posting group for item.
(Item card – Invoicing – Inventory Posting Group – table Inventory
Posting Group – Code, Description)
Item Category Group Category group for items.
(Item card – Item Category Code – General – table Item Category – Code,
Description)
Item Product Group Sub group of category group.
(Item card – Product Group Code – General – table Item Category – Code,
Description)
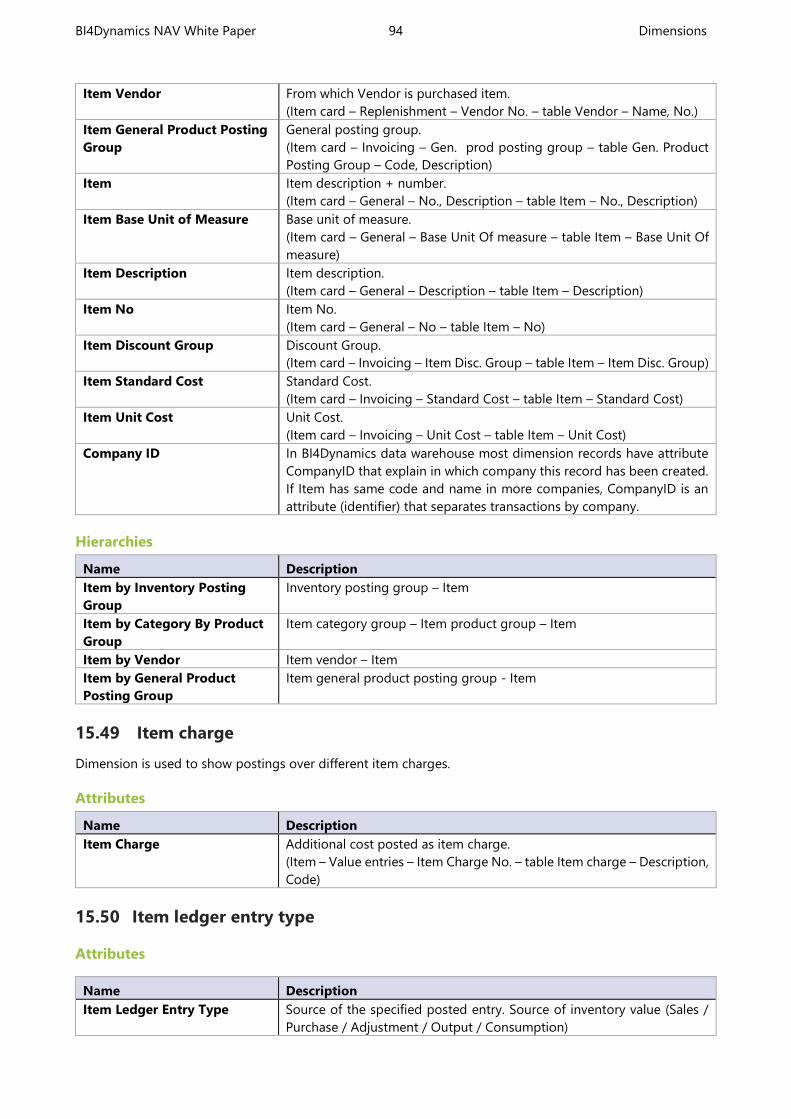
BI4Dynamics NAV White Paper 94 Dimensions
Item Vendor From which Vendor is purchased item.
(Item card – Replenishment – Vendor No. – table Vendor – Name, No.)
Item General Product Posting
Group
General posting group.
(Item card – Invoicing – Gen. prod posting group – table Gen. Product
Posting Group – Code, Description)
Item Item description + number.
(Item card – General – No., Description – table Item – No., Description)
Item Base Unit of Measure Base unit of measure.
(Item card – General – Base Unit Of measure – table Item – Base Unit Of
measure)
Item Description Item description.
(Item card – General – Description – table Item – Description)
Item No Item No.
(Item card – General – No – table Item – No)
Item Discount Group Discount Group.
(Item card – Invoicing – Item Disc. Group – table Item – Item Disc. Group)
Item Standard Cost Standard Cost.
(Item card – Invoicing – Standard Cost – table Item – Standard Cost)
Item Unit Cost Unit Cost.
(Item card – Invoicing – Unit Cost – table Item – Unit Cost)
Company ID In BI4Dynamics data warehouse most dimension records have attribute
CompanyID that explain in which company this record has been created.
If Item has same code and name in more companies, CompanyID is an
attribute (identifier) that separates transactions by company.
Hierarchies
Name Description
Item by Inventory Posting
Group
Inventory posting group – Item
Item by Category By Product
Group
Item category group – Item product group – Item
Item by Vendor Item vendor – Item
Item by General Product
Posting Group
Item general product posting group - Item
15.49 Item charge
Dimension is used to show postings over different item charges.
Attributes
Name Description
Item Charge Additional cost posted as item charge.
(Item – Value entries – Item Charge No. – table Item charge – Description,
Code)
15.50 Item ledger entry type
Attributes
Name Description
Item Ledger Entry Type Source of the specified posted entry. Source of inventory value (Sales /
Purchase / Adjustment / Output / Consumption)
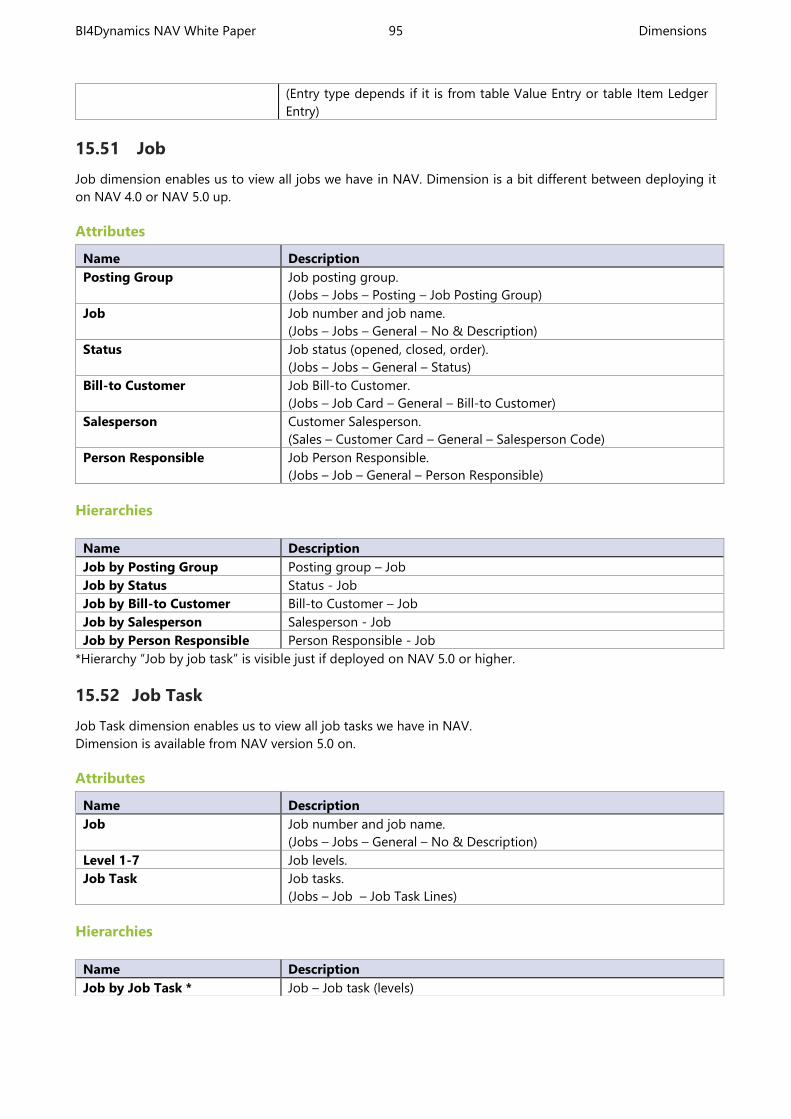
BI4Dynamics NAV White Paper 95 Dimensions
15.51 Job
Job dimension enables us to view all jobs we have in NAV. Dimension is a bit different between deploying it
on NAV 4.0 or NAV 5.0 up.
Attributes
Name Description
Posting Group Job posting group.
(Jobs – Jobs – Posting – Job Posting Group)
Job Job number and job name.
(Jobs – Jobs – General – No & Description)
Status Job status (opened, closed, order).
(Jobs – Jobs – General – Status)
Bill-to Customer Job Bill-to Customer.
(Jobs – Job Card – General – Bill-to Customer)
Salesperson Customer Salesperson.
(Sales – Customer Card – General – Salesperson Code)
Person Responsible Job Person Responsible.
(Jobs – Job – General – Person Responsible)
Hierarchies
*Hierarchy “Job by job task” is visible just if deployed on NAV 5.0 or higher.
15.52 Job Task
Job Task dimension enables us to view all job tasks we have in NAV.
Dimension is available from NAV version 5.0 on.
Attributes
Name Description
Job Job number and job name.
(Jobs – Jobs – General – No & Description)
Level 1-7 Job levels.
Job Task Job tasks.
(Jobs – Job – Job Task Lines)
Hierarchies
(Entry type depends if it is from table Value Entry or table Item Ledger
Entry)
Name Description
Job by Posting Group Posting group – Job
Job by Status Status - Job
Job by Bill-to Customer Bill-to Customer – Job
Job by Salesperson Salesperson - Job
Job by Person Responsible Person Responsible - Job
Name Description
Job by Job Task * Job – Job task (levels)
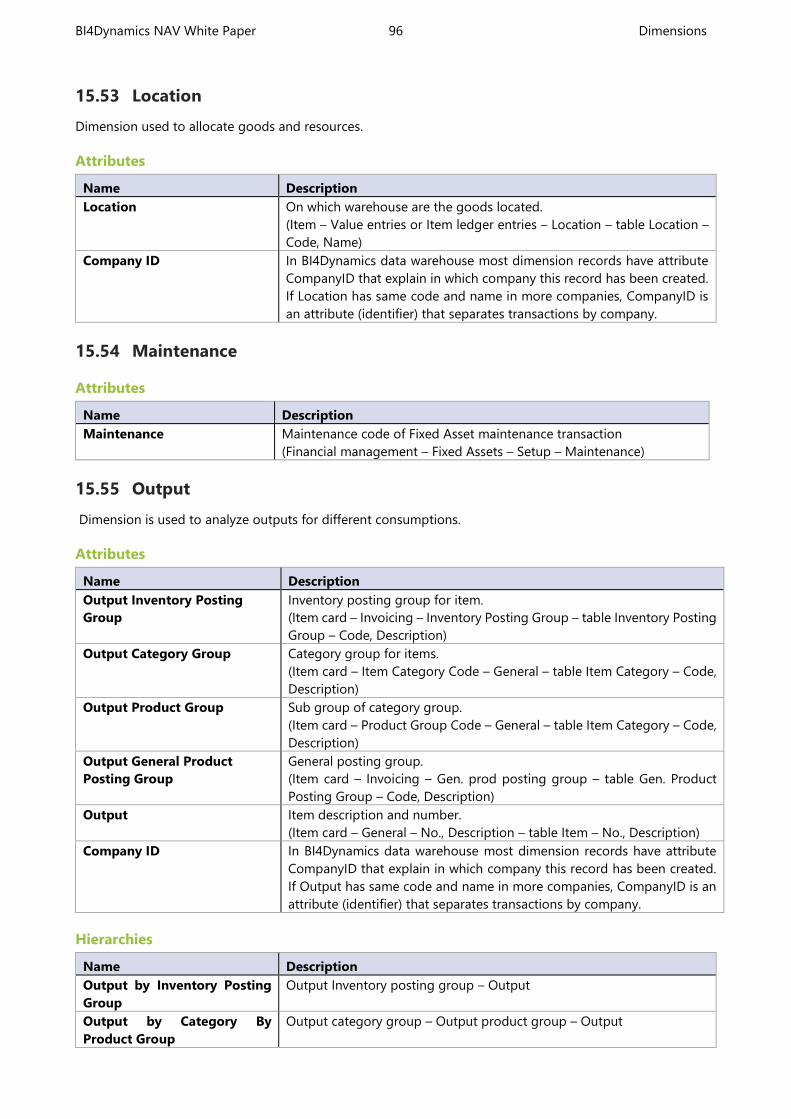
BI4Dynamics NAV White Paper 96 Dimensions
15.53 Location
Dimension used to allocate goods and resources.
Attributes
Name Description
Location On which warehouse are the goods located.
(Item – Value entries or Item ledger entries – Location – table Location –
Code, Name)
Company ID In BI4Dynamics data warehouse most dimension records have attribute
CompanyID that explain in which company this record has been created.
If Location has same code and name in more companies, CompanyID is
an attribute (identifier) that separates transactions by company.
15.54 Maintenance
Attributes
Name Description
Maintenance Maintenance code of Fixed Asset maintenance transaction
(Financial management – Fixed Assets – Setup – Maintenance)
15.55 Output
Dimension is used to analyze outputs for different consumptions.
Attributes
Name Description
Output Inventory Posting
Group
Inventory posting group for item.
(Item card – Invoicing – Inventory Posting Group – table Inventory Posting
Group – Code, Description)
Output Category Group Category group for items.
(Item card – Item Category Code – General – table Item Category – Code,
Description)
Output Product Group Sub group of category group.
(Item card – Product Group Code – General – table Item Category – Code,
Description)
Output General Product
Posting Group
General posting group.
(Item card – Invoicing – Gen. prod posting group – table Gen. Product
Posting Group – Code, Description)
Output Item description and number.
(Item card – General – No., Description – table Item – No., Description)
Company ID In BI4Dynamics data warehouse most dimension records have attribute
CompanyID that explain in which company this record has been created.
If Output has same code and name in more companies, CompanyID is an
attribute (identifier) that separates transactions by company.
Hierarchies
Name Description
Output by Inventory Posting
Group
Output Inventory posting group – Output
Output by Category By
Product Group
Output category group – Output product group – Output
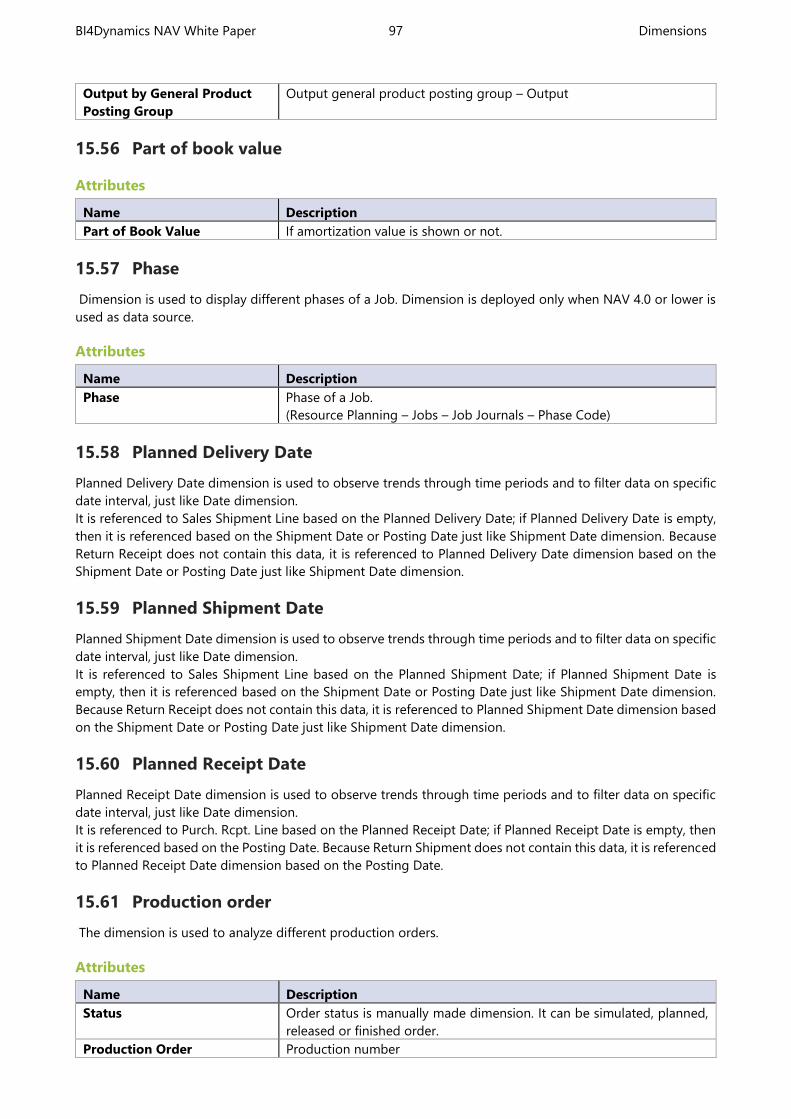
BI4Dynamics NAV White Paper 97 Dimensions
Output by General Product
Posting Group
Output general product posting group – Output
15.56 Part of book value
Attributes
Name Description
Part of Book Value If amortization value is shown or not.
15.57 Phase
Dimension is used to display different phases of a Job. Dimension is deployed only when NAV 4.0 or lower is
used as data source.
Attributes
Name Description
Phase Phase of a Job.
(Resource Planning – Jobs – Job Journals – Phase Code)
15.58 Planned Delivery Date
Planned Delivery Date dimension is used to observe trends through time periods and to filter data on specific
date interval, just like Date dimension.
It is referenced to Sales Shipment Line based on the Planned Delivery Date; if Planned Delivery Date is empty,
then it is referenced based on the Shipment Date or Posting Date just like Shipment Date dimension. Because
Return Receipt does not contain this data, it is referenced to Planned Delivery Date dimension based on the
Shipment Date or Posting Date just like Shipment Date dimension.
15.59 Planned Shipment Date
Planned Shipment Date dimension is used to observe trends through time periods and to filter data on specific
date interval, just like Date dimension.
It is referenced to Sales Shipment Line based on the Planned Shipment Date; if Planned Shipment Date is
empty, then it is referenced based on the Shipment Date or Posting Date just like Shipment Date dimension.
Because Return Receipt does not contain this data, it is referenced to Planned Shipment Date dimension based
on the Shipment Date or Posting Date just like Shipment Date dimension.
15.60 Planned Receipt Date
Planned Receipt Date dimension is used to observe trends through time periods and to filter data on specific
date interval, just like Date dimension.
It is referenced to Purch. Rcpt. Line based on the Planned Receipt Date; if Planned Receipt Date is empty, then
it is referenced based on the Posting Date. Because Return Shipment does not contain this data, it is referenced
to Planned Receipt Date dimension based on the Posting Date.
15.61 Production order
The dimension is used to analyze different production orders.
Attributes
Name Description
Status Order status is manually made dimension. It can be simulated, planned,
released or finished order.
Production Order Production number
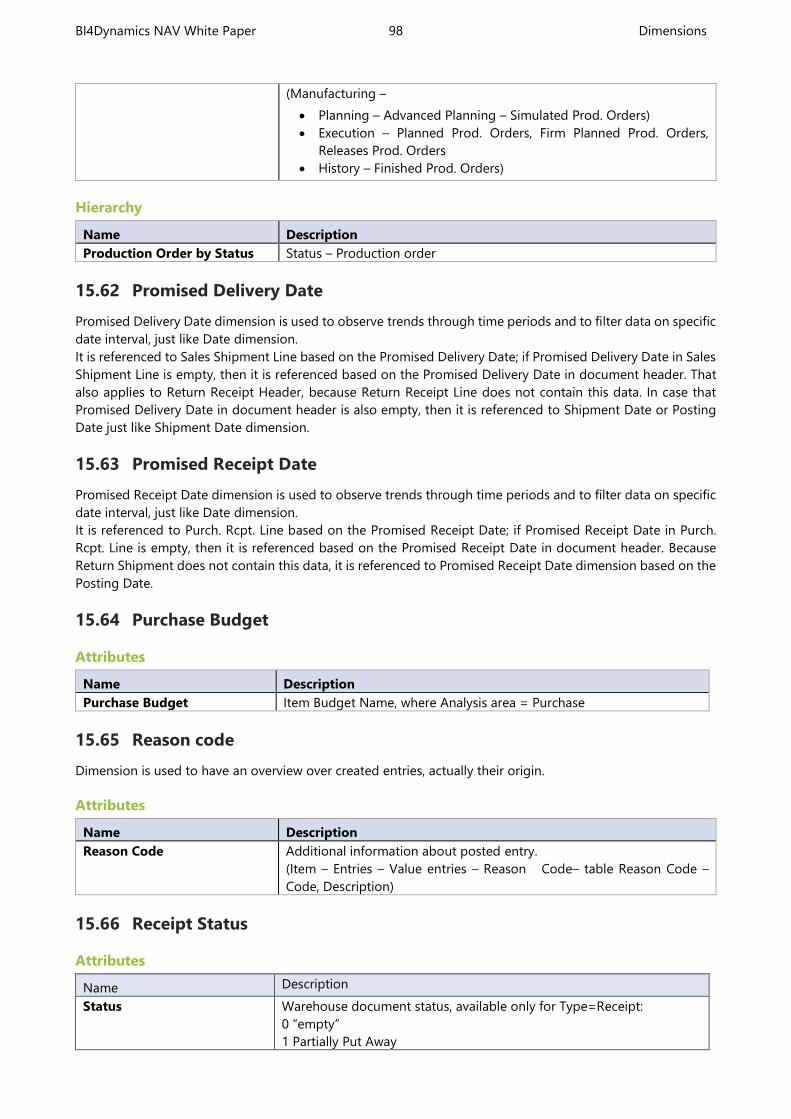
BI4Dynamics NAV White Paper 98 Dimensions
(Manufacturing –
Planning – Advanced Planning – Simulated Prod. Orders)
Execution – Planned Prod. Orders, Firm Planned Prod. Orders,
Releases Prod. Orders
History – Finished Prod. Orders)
Hierarchy
Name Description
Production Order by Status Status – Production order
15.62 Promised Delivery Date
Promised Delivery Date dimension is used to observe trends through time periods and to filter data on specific
date interval, just like Date dimension.
It is referenced to Sales Shipment Line based on the Promised Delivery Date; if Promised Delivery Date in Sales
Shipment Line is empty, then it is referenced based on the Promised Delivery Date in document header. That
also applies to Return Receipt Header, because Return Receipt Line does not contain this data. In case that
Promised Delivery Date in document header is also empty, then it is referenced to Shipment Date or Posting
Date just like Shipment Date dimension.
15.63 Promised Receipt Date
Promised Receipt Date dimension is used to observe trends through time periods and to filter data on specific
date interval, just like Date dimension.
It is referenced to Purch. Rcpt. Line based on the Promised Receipt Date; if Promised Receipt Date in Purch.
Rcpt. Line is empty, then it is referenced based on the Promised Receipt Date in document header. Because
Return Shipment does not contain this data, it is referenced to Promised Receipt Date dimension based on the
Posting Date.
15.64 Purchase Budget
Attributes
Name Description
Purchase Budget Item Budget Name, where Analysis area = Purchase
15.65 Reason code
Dimension is used to have an overview over created entries, actually their origin.
Attributes
Name Description
Reason Code Additional information about posted entry.
(Item – Entries – Value entries – Reason Code– table Reason Code –
Code, Description)
15.66 Receipt Status
Attributes
Name Description
Status Warehouse document status, available only for Type=Receipt:
0 “empty”
1 Partially Put Away
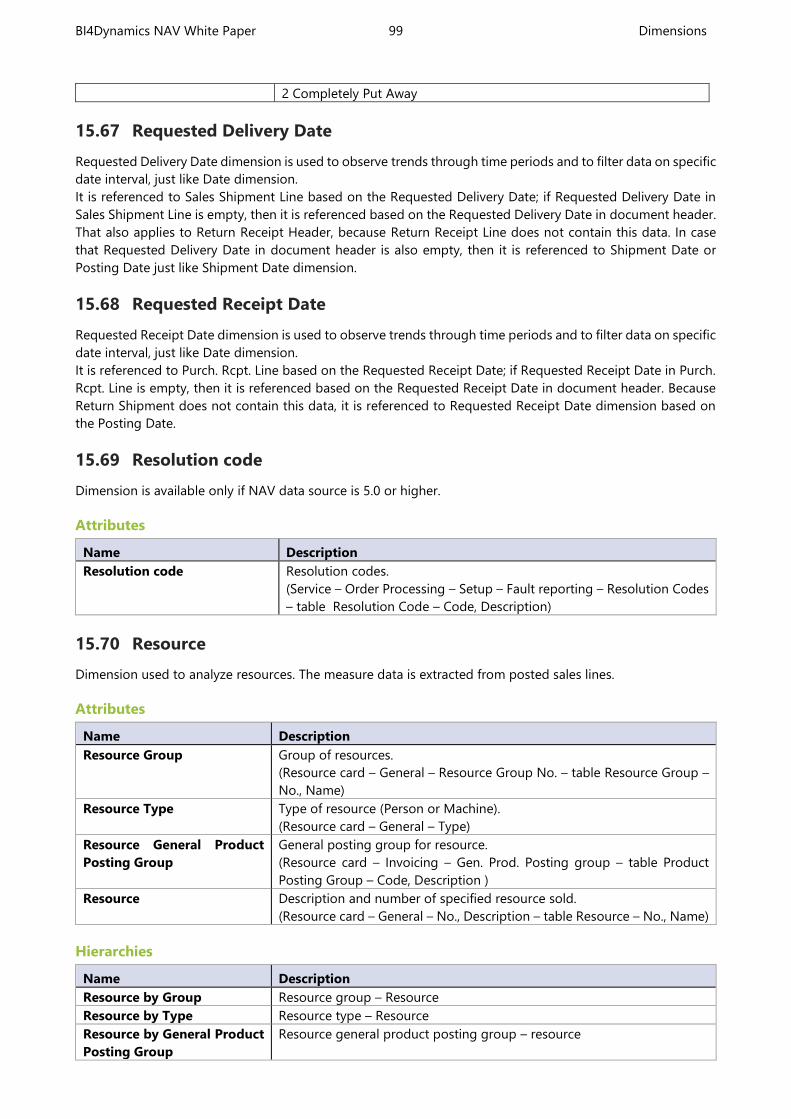
BI4Dynamics NAV White Paper 99 Dimensions
2 Completely Put Away
15.67 Requested Delivery Date
Requested Delivery Date dimension is used to observe trends through time periods and to filter data on specific
date interval, just like Date dimension.
It is referenced to Sales Shipment Line based on the Requested Delivery Date; if Requested Delivery Date in
Sales Shipment Line is empty, then it is referenced based on the Requested Delivery Date in document header.
That also applies to Return Receipt Header, because Return Receipt Line does not contain this data. In case
that Requested Delivery Date in document header is also empty, then it is referenced to Shipment Date or
Posting Date just like Shipment Date dimension.
15.68 Requested Receipt Date
Requested Receipt Date dimension is used to observe trends through time periods and to filter data on specific
date interval, just like Date dimension.
It is referenced to Purch. Rcpt. Line based on the Requested Receipt Date; if Requested Receipt Date in Purch.
Rcpt. Line is empty, then it is referenced based on the Requested Receipt Date in document header. Because
Return Shipment does not contain this data, it is referenced to Requested Receipt Date dimension based on
the Posting Date.
15.69 Resolution code
Dimension is available only if NAV data source is 5.0 or higher.
Attributes
Name Description
Resolution code Resolution codes.
(Service – Order Processing – Setup – Fault reporting – Resolution Codes
– table Resolution Code – Code, Description)
15.70 Resource
Dimension used to analyze resources. The measure data is extracted from posted sales lines.
Attributes
Name Description
Resource Group Group of resources.
(Resource card – General – Resource Group No. – table Resource Group –
No., Name)
Resource Type Type of resource (Person or Machine).
(Resource card – General – Type)
Resource General Product
Posting Group
General posting group for resource.
(Resource card – Invoicing – Gen. Prod. Posting group – table Product
Posting Group – Code, Description )
Resource Description and number of specified resource sold.
(Resource card – General – No., Description – table Resource – No., Name)
Hierarchies
Name Description
Resource by Group Resource group – Resource
Resource by Type Resource type – Resource
Resource by General Product
Posting Group
Resource general product posting group – resource
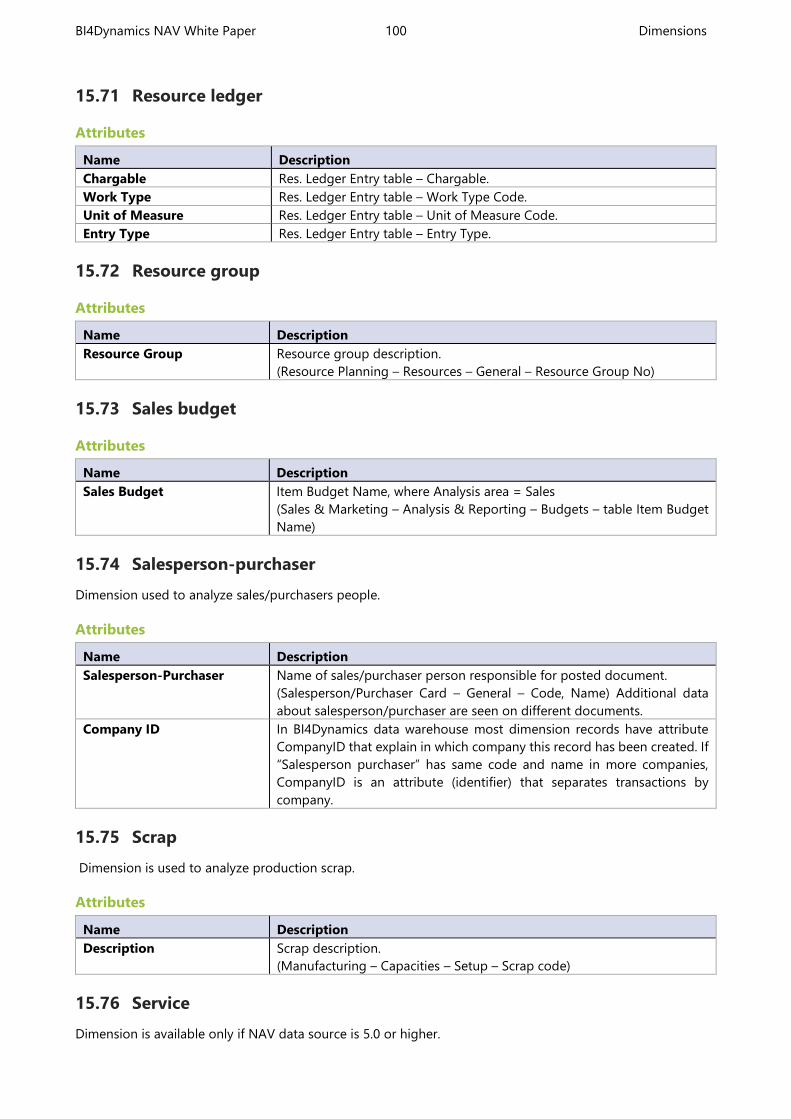
BI4Dynamics NAV White Paper 100 Dimensions
15.71 Resource ledger
Attributes
Name Description
Chargable Res. Ledger Entry table – Chargable.
Work Type Res. Ledger Entry table – Work Type Code.
Unit of Measure Res. Ledger Entry table – Unit of Measure Code.
Entry Type Res. Ledger Entry table – Entry Type.
15.72 Resource group
Attributes
Name Description
Resource Group Resource group description.
(Resource Planning – Resources – General – Resource Group No)
15.73 Sales budget
Attributes
Name Description
Sales Budget Item Budget Name, where Analysis area = Sales
(Sales & Marketing – Analysis & Reporting – Budgets – table Item Budget
Name)
15.74 Salesperson-purchaser
Dimension used to analyze sales/purchasers people.
Attributes
Name Description
Salesperson-Purchaser Name of sales/purchaser person responsible for posted document.
(Salesperson/Purchaser Card – General – Code, Name) Additional data
about salesperson/purchaser are seen on different documents.
Company ID In BI4Dynamics data warehouse most dimension records have attribute
CompanyID that explain in which company this record has been created. If
“Salesperson purchaser” has same code and name in more companies,
CompanyID is an attribute (identifier) that separates transactions by
company.
15.75 Scrap
Dimension is used to analyze production scrap.
Attributes
Name Description
Description Scrap description.
(Manufacturing – Capacities – Setup – Scrap code)
15.76 Service
Dimension is available only if NAV data source is 5.0 or higher.
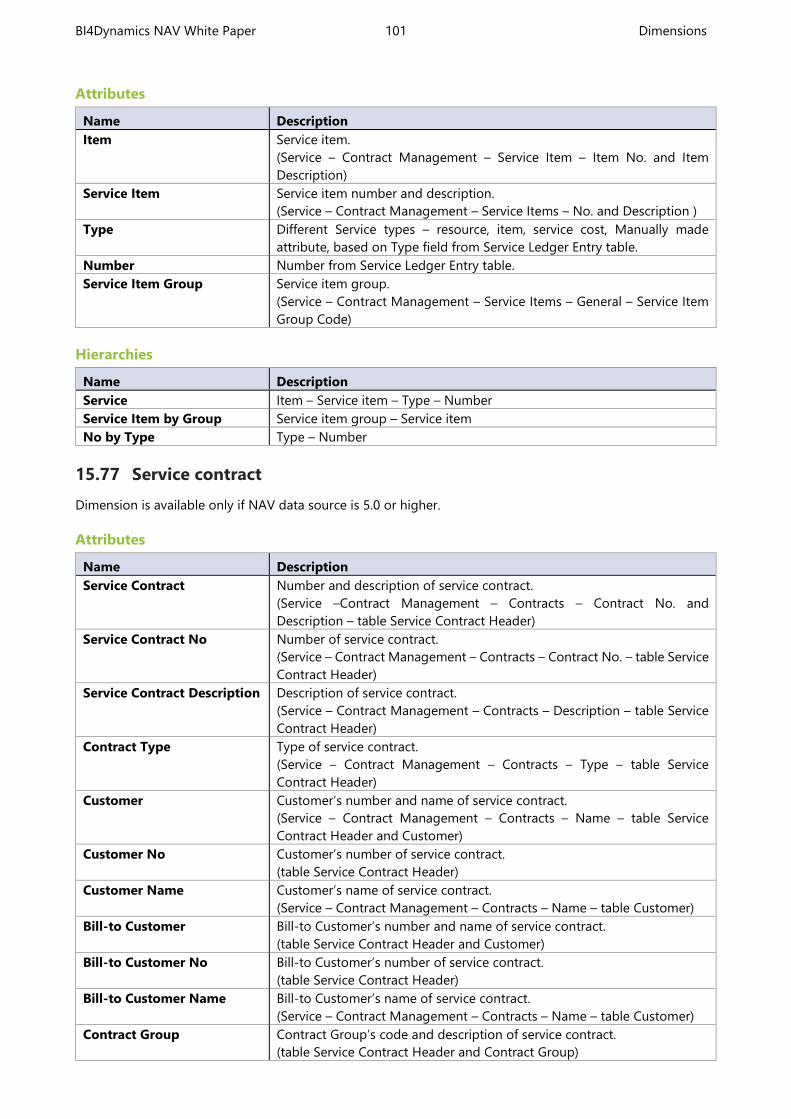
BI4Dynamics NAV White Paper 101 Dimensions
Attributes
Name Description
Item Service item.
(Service – Contract Management – Service Item – Item No. and Item
Description)
Service Item Service item number and description.
(Service – Contract Management – Service Items – No. and Description )
Type Different Service types – resource, item, service cost, Manually made
attribute, based on Type field from Service Ledger Entry table.
Number Number from Service Ledger Entry table.
Service Item Group Service item group.
(Service – Contract Management – Service Items – General – Service Item
Group Code)
Hierarchies
Name Description
Service Item – Service item – Type – Number
Service Item by Group Service item group – Service item
No by Type Type – Number
15.77 Service contract
Dimension is available only if NAV data source is 5.0 or higher.
Attributes
Name Description
Service Contract Number and description of service contract.
(Service –Contract Management – Contracts – Contract No. and
Description – table Service Contract Header)
Service Contract No Number of service contract.
(Service – Contract Management – Contracts – Contract No. – table Service
Contract Header)
Service Contract Description Description of service contract.
(Service – Contract Management – Contracts – Description – table Service
Contract Header)
Contract Type Type of service contract.
(Service – Contract Management – Contracts – Type – table Service
Contract Header)
Customer Customer’s number and name of service contract.
(Service – Contract Management – Contracts – Name – table Service
Contract Header and Customer)
Customer No Customer’s number of service contract.
(table Service Contract Header)
Customer Name Customer’s name of service contract.
(Service – Contract Management – Contracts – Name – table Customer)
Bill-to Customer Bill-to Customer’s number and name of service contract.
(table Service Contract Header and Customer)
Bill-to Customer No Bill-to Customer’s number of service contract.
(table Service Contract Header)
Bill-to Customer Name Bill-to Customer’s name of service contract.
(Service – Contract Management – Contracts – Name – table Customer)
Contract Group Contract Group’s code and description of service contract.
(table Service Contract Header and Contract Group)
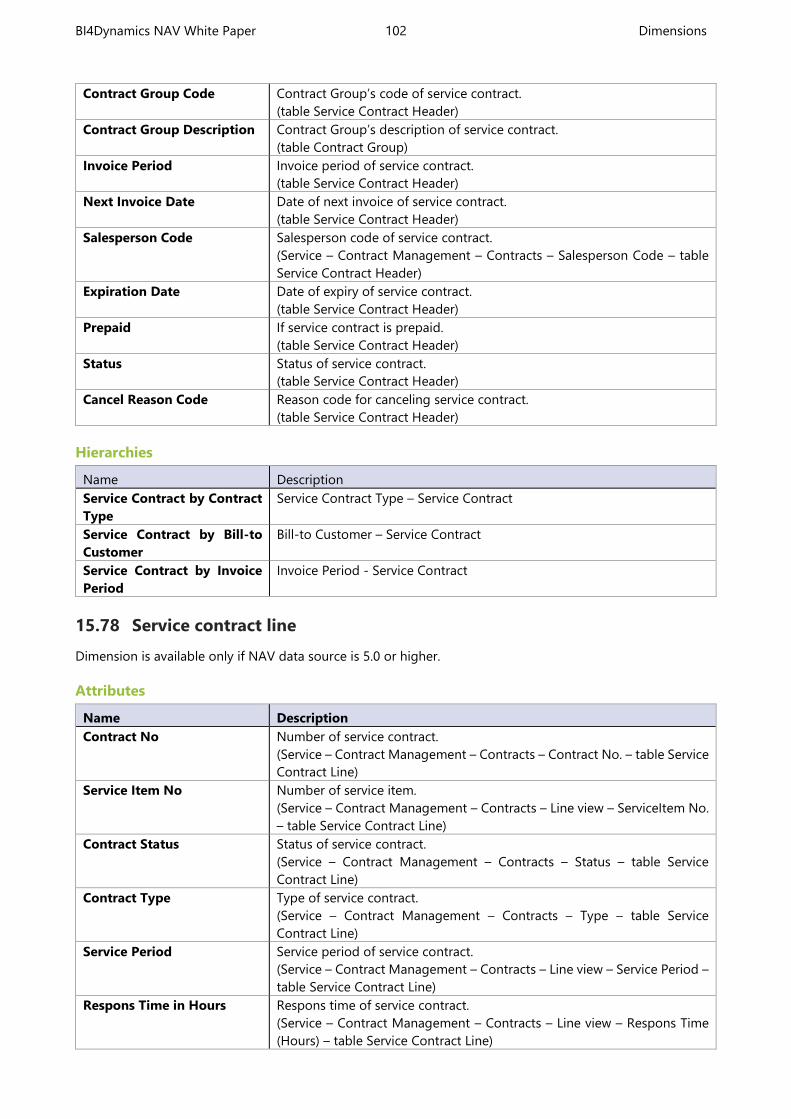
BI4Dynamics NAV White Paper 102 Dimensions
Contract Group Code Contract Group’s code of service contract.
(table Service Contract Header)
Contract Group Description Contract Group’s description of service contract.
(table Contract Group)
Invoice Period Invoice period of service contract.
(table Service Contract Header)
Next Invoice Date Date of next invoice of service contract.
(table Service Contract Header)
Salesperson Code Salesperson code of service contract.
(Service – Contract Management – Contracts – Salesperson Code – table
Service Contract Header)
Expiration Date Date of expiry of service contract.
(table Service Contract Header)
Prepaid If service contract is prepaid.
(table Service Contract Header)
Status Status of service contract.
(table Service Contract Header)
Cancel Reason Code Reason code for canceling service contract.
(table Service Contract Header)
Hierarchies
Name Description
Service Contract by Contract
Type
Service Contract Type – Service Contract
Service Contract by Bill-to
Customer
Bill-to Customer – Service Contract
Service Contract by Invoice
Period
Invoice Period - Service Contract
15.78 Service contract line
Dimension is available only if NAV data source is 5.0 or higher.
Attributes
Name Description
Contract No Number of service contract.
(Service – Contract Management – Contracts – Contract No. – table Service
Contract Line)
Service Item No Number of service item.
(Service – Contract Management – Contracts – Line view – ServiceItem No.
– table Service Contract Line)
Contract Status Status of service contract.
(Service – Contract Management – Contracts – Status – table Service
Contract Line)
Contract Type Type of service contract.
(Service – Contract Management – Contracts – Type – table Service
Contract Line)
Service Period Service period of service contract.
(Service – Contract Management – Contracts – Line view – Service Period –
table Service Contract Line)
Respons Time in Hours Respons time of service contract.
(Service – Contract Management – Contracts – Line view – Respons Time
(Hours) – table Service Contract Line)

BI4Dynamics NAV White Paper 103 Dimensions
15.79 Service item
Dimension is available only if NAV data source is 5.0 or higher.
Attributes
Name Description
Service Item Number and description of service item.
(Service – Contract Management – Service Items – No. and Description –
table Service Item)
Service Item No Number of service item.
(Service – Contract Management – Service Items – No. – table Service Item)
Service Item Description Description of service item.
(Service – Contract Management – Service Items – Description – table
Service Item)
Service Item Group Code Group code of service item.
(Service – Contract Management – Service Items – Service Item Group
Code – table Service Item)
Customer Customer number and name of service item.
(Service – Contract Management – Service Items – Customer No. and Name
– table Service Item and Customer)
Customer No Customer number of service item.
(Service – Contract Management – Service Items – Customer No. – table
Service Item)
Customer Name Customer name of service item.
(Service – Contract Management – Service Items – Name – table Customer)
Ship-to Code Ship-to code of service item.
(Service – Contract Management – Service Items – Ship-to Code – table
Service Item)
Customer Ship-to Customer number and ship-to code of service item.
(Service – Contract Management – Service Items – Customer No. and Ship-
to Code – table Service Item)
Item Item number and item description of service item.
(Service – Contract Management – Service Items – Item No. and Item
Description – table Service Item and Item)
Item No Item number of service item.
(Service – Contract Management – Service Items – Item No. – table Service
Item)
Item Name Item description of service item.
(Service – Contract Management – Service Items – Item Description – table
Item)
Serial No Serial number of service item.
(Service – Contract Management – Service Items – Serial No. – table Service
Item)
Status Status of service item.
(Service – Contract Management – Service Items – Status – table Service
Item)
Installation Date Installation date of service item.
(Service – Contract Management – Service Items – Installation Date – table
Service Item)
Hierarchies
Name Description
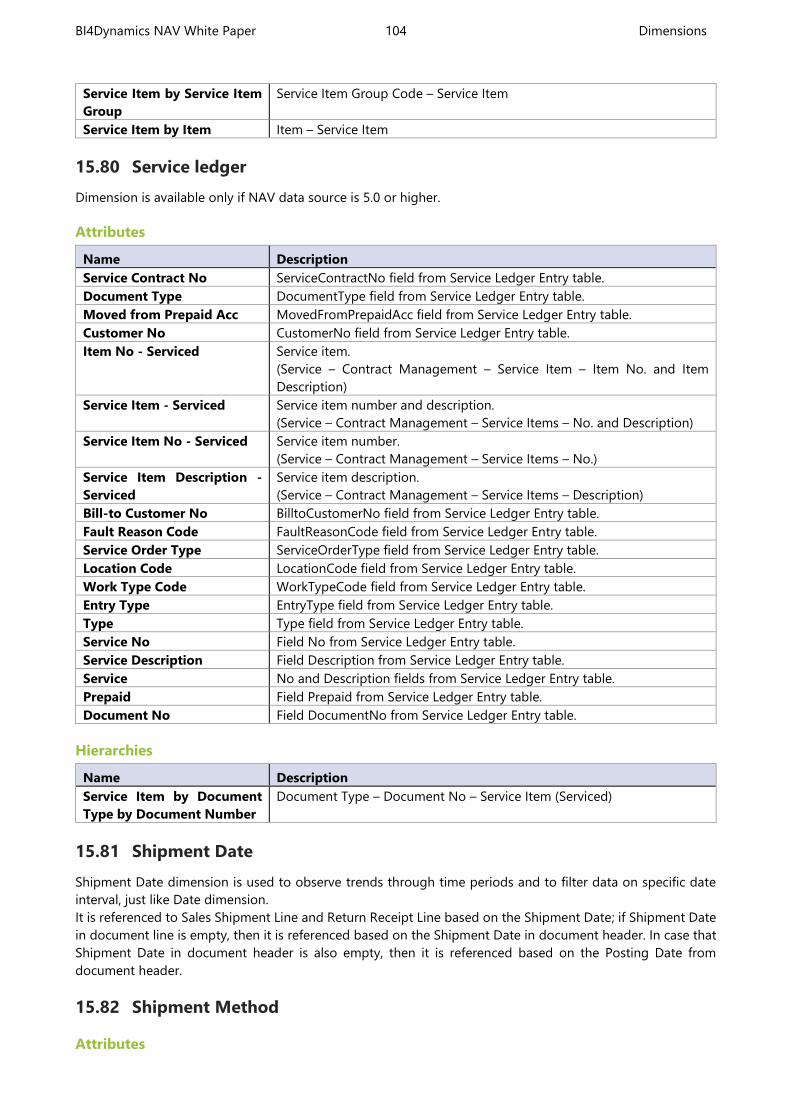
BI4Dynamics NAV White Paper 104 Dimensions
Service Item by Service Item
Group
Service Item Group Code – Service Item
Service Item by Item Item – Service Item
15.80 Service ledger
Dimension is available only if NAV data source is 5.0 or higher.
Attributes
Name Description
Service Contract No ServiceContractNo field from Service Ledger Entry table.
Document Type DocumentType field from Service Ledger Entry table.
Moved from Prepaid Acc MovedFromPrepaidAcc field from Service Ledger Entry table.
Customer No CustomerNo field from Service Ledger Entry table.
Item No - Serviced Service item.
(Service – Contract Management – Service Item – Item No. and Item
Description)
Service Item - Serviced Service item number and description.
(Service – Contract Management – Service Items – No. and Description)
Service Item No - Serviced Service item number.
(Service – Contract Management – Service Items – No.)
Service Item Description -
Serviced
Service item description.
(Service – Contract Management – Service Items – Description)
Bill-to Customer No BilltoCustomerNo field from Service Ledger Entry table.
Fault Reason Code FaultReasonCode field from Service Ledger Entry table.
Service Order Type ServiceOrderType field from Service Ledger Entry table.
Location Code LocationCode field from Service Ledger Entry table.
Work Type Code WorkTypeCode field from Service Ledger Entry table.
Entry Type EntryType field from Service Ledger Entry table.
Type Type field from Service Ledger Entry table.
Service No Field No from Service Ledger Entry table.
Service Description Field Description from Service Ledger Entry table.
Service No and Description fields from Service Ledger Entry table.
Prepaid Field Prepaid from Service Ledger Entry table.
Document No Field DocumentNo from Service Ledger Entry table.
Hierarchies
Name Description
Service Item by Document
Type by Document Number
Document Type – Document No – Service Item (Serviced)
15.81 Shipment Date
Shipment Date dimension is used to observe trends through time periods and to filter data on specific date
interval, just like Date dimension.
It is referenced to Sales Shipment Line and Return Receipt Line based on the Shipment Date; if Shipment Date
in document line is empty, then it is referenced based on the Shipment Date in document header. In case that
Shipment Date in document header is also empty, then it is referenced based on the Posting Date from
document header.
15.82 Shipment Method
Attributes
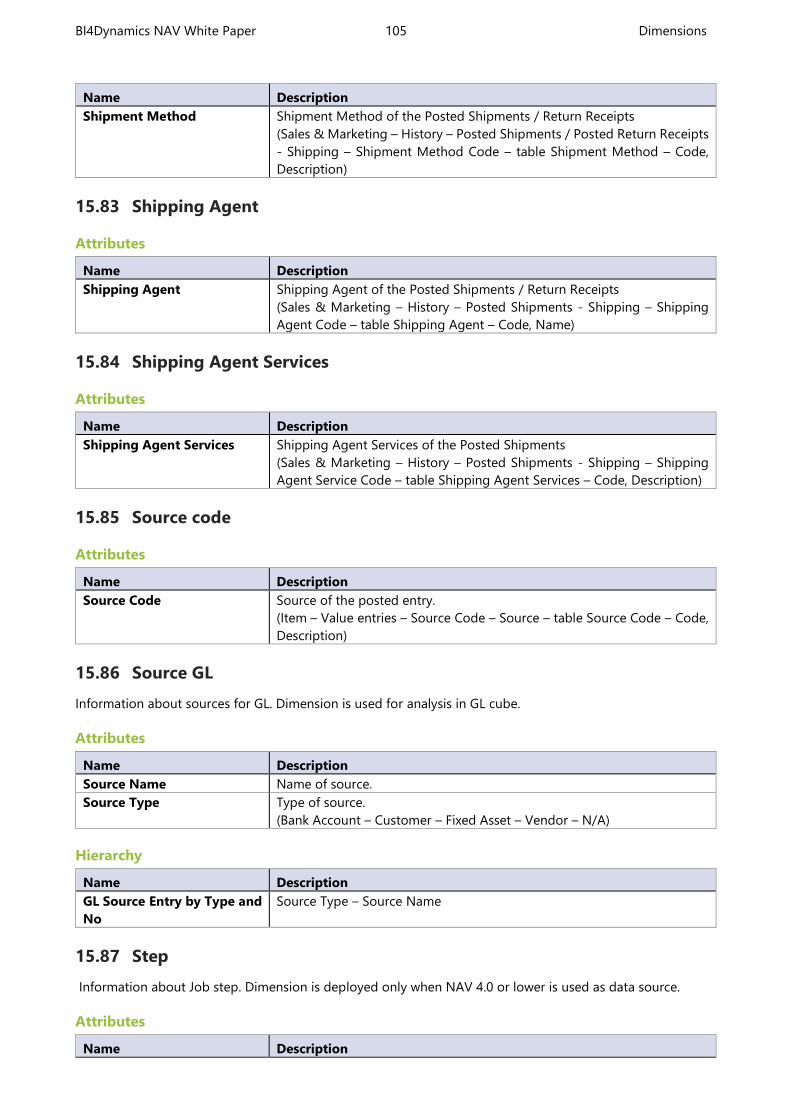
BI4Dynamics NAV White Paper 105 Dimensions
Name Description
Shipment Method Shipment Method of the Posted Shipments / Return Receipts
(Sales & Marketing – History – Posted Shipments / Posted Return Receipts
- Shipping – Shipment Method Code – table Shipment Method – Code,
Description)
15.83 Shipping Agent
Attributes
Name Description
Shipping Agent Shipping Agent of the Posted Shipments / Return Receipts
(Sales & Marketing – History – Posted Shipments - Shipping – Shipping
Agent Code – table Shipping Agent – Code, Name)
15.84 Shipping Agent Services
Attributes
Name Description
Shipping Agent Services Shipping Agent Services of the Posted Shipments
(Sales & Marketing – History – Posted Shipments - Shipping – Shipping
Agent Service Code – table Shipping Agent Services – Code, Description)
15.85 Source code
Attributes
Name Description
Source Code Source of the posted entry.
(Item – Value entries – Source Code – Source – table Source Code – Code,
Description)
15.86 Source GL
Information about sources for GL. Dimension is used for analysis in GL cube.
Attributes
Name Description
Source Name Name of source.
Source Type Type of source.
(Bank Account – Customer – Fixed Asset – Vendor – N/A)
Hierarchy
Name Description
GL Source Entry by Type and
No
Source Type – Source Name
15.87 Step
Information about Job step. Dimension is deployed only when NAV 4.0 or lower is used as data source.
Attributes
Name Description
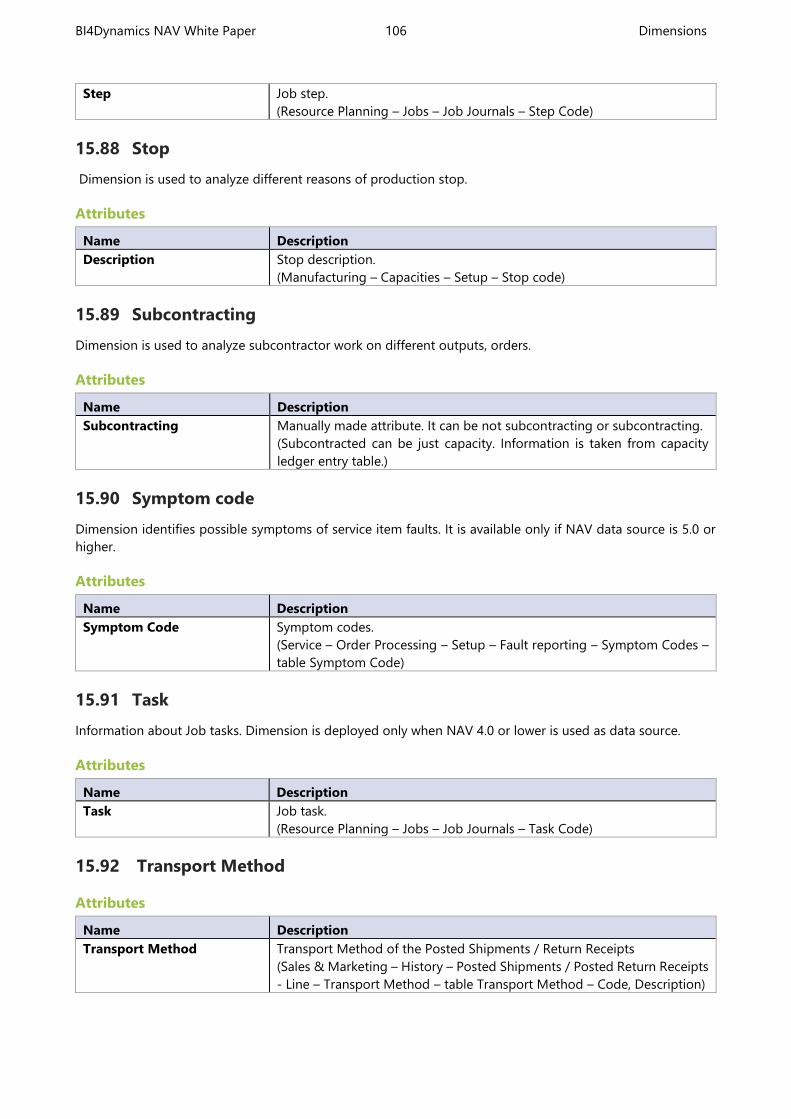
BI4Dynamics NAV White Paper 106 Dimensions
Step Job step.
(Resource Planning – Jobs – Job Journals – Step Code)
15.88 Stop
Dimension is used to analyze different reasons of production stop.
Attributes
Name Description
Description Stop description.
(Manufacturing – Capacities – Setup – Stop code)
15.89 Subcontracting
Dimension is used to analyze subcontractor work on different outputs, orders.
Attributes
Name Description
Subcontracting Manually made attribute. It can be not subcontracting or subcontracting.
(Subcontracted can be just capacity. Information is taken from capacity
ledger entry table.)
15.90 Symptom code
Dimension identifies possible symptoms of service item faults. It is available only if NAV data source is 5.0 or
higher.
Attributes
Name Description
Symptom Code Symptom codes.
(Service – Order Processing – Setup – Fault reporting – Symptom Codes –
table Symptom Code)
15.91 Task
Information about Job tasks. Dimension is deployed only when NAV 4.0 or lower is used as data source.
Attributes
Name Description
Task Job task.
(Resource Planning – Jobs – Job Journals – Task Code)
15.92 Transport Method
Attributes
Name Description
Transport Method Transport Method of the Posted Shipments / Return Receipts
(Sales & Marketing – History – Posted Shipments / Posted Return Receipts
- Line – Transport Method – table Transport Method – Code, Description)
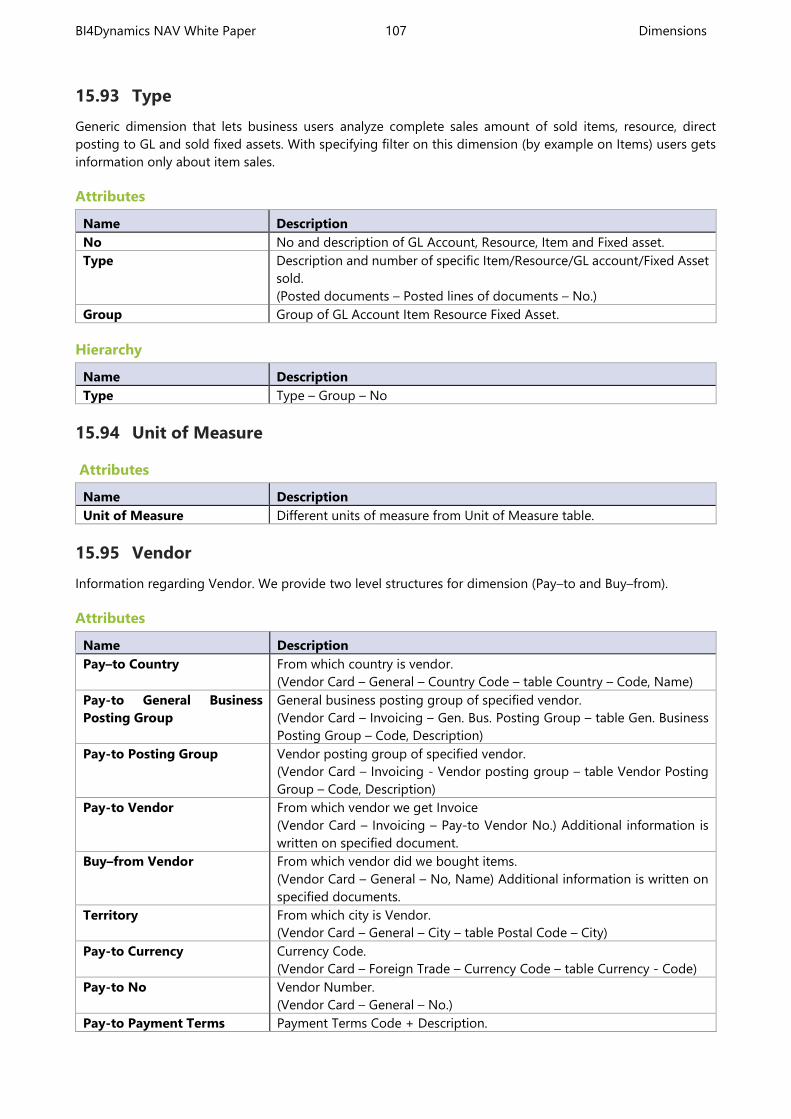
BI4Dynamics NAV White Paper 107 Dimensions
15.93 Type
Generic dimension that lets business users analyze complete sales amount of sold items, resource, direct
posting to GL and sold fixed assets. With specifying filter on this dimension (by example on Items) users gets
information only about item sales.
Attributes
Name Description
No No and description of GL Account, Resource, Item and Fixed asset.
Type Description and number of specific Item/Resource/GL account/Fixed Asset
sold.
(Posted documents – Posted lines of documents – No.)
Group Group of GL Account Item Resource Fixed Asset.
Hierarchy
Name Description
Type Type – Group – No
15.94 Unit of Measure
Attributes
Name Description
Unit of Measure Different units of measure from Unit of Measure table.
15.95 Vendor
Information regarding Vendor. We provide two level structures for dimension (Pay–to and Buy–from).
Attributes
Name Description
Pay–to Country From which country is vendor.
(Vendor Card – General – Country Code – table Country – Code, Name)
Pay-to General Business
Posting Group
General business posting group of specified vendor.
(Vendor Card – Invoicing – Gen. Bus. Posting Group – table Gen. Business
Posting Group – Code, Description)
Pay-to Posting Group Vendor posting group of specified vendor.
(Vendor Card – Invoicing - Vendor posting group – table Vendor Posting
Group – Code, Description)
Pay-to Vendor From which vendor we get Invoice
(Vendor Card – Invoicing – Pay-to Vendor No.) Additional information is
written on specified document.
Buy–from Vendor From which vendor did we bought items.
(Vendor Card – General – No, Name) Additional information is written on
specified documents.
Territory From which city is Vendor.
(Vendor Card – General – City – table Postal Code – City)
Pay-to Currency Currency Code.
(Vendor Card – Foreign Trade – Currency Code – table Currency - Code)
Pay-to No Vendor Number.
(Vendor Card – General – No.)
Pay-to Payment Terms Payment Terms Code + Description.
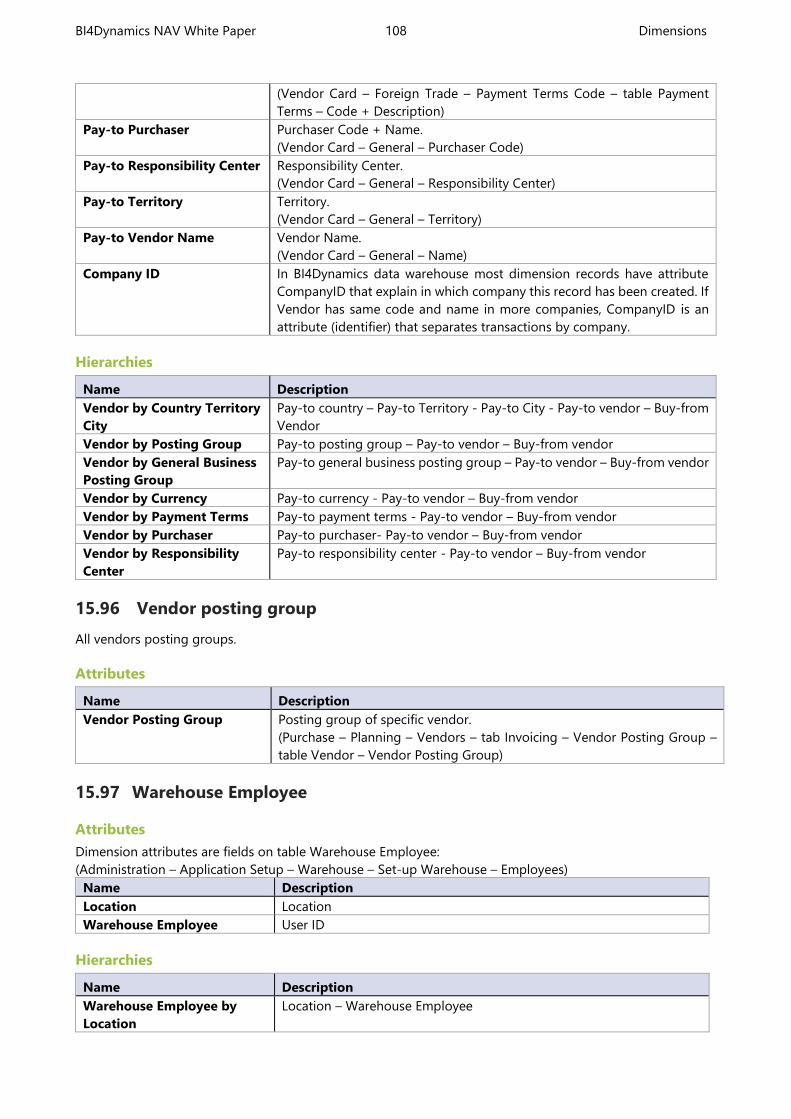
BI4Dynamics NAV White Paper 108 Dimensions
(Vendor Card – Foreign Trade – Payment Terms Code – table Payment
Terms – Code + Description)
Pay-to Purchaser Purchaser Code + Name.
(Vendor Card – General – Purchaser Code)
Pay-to Responsibility Center Responsibility Center.
(Vendor Card – General – Responsibility Center)
Pay-to Territory Territory.
(Vendor Card – General – Territory)
Pay-to Vendor Name Vendor Name.
(Vendor Card – General – Name)
Company ID In BI4Dynamics data warehouse most dimension records have attribute
CompanyID that explain in which company this record has been created. If
Vendor has same code and name in more companies, CompanyID is an
attribute (identifier) that separates transactions by company.
Hierarchies
Name Description
Vendor by Country Territory
City
Pay-to country – Pay-to Territory - Pay-to City - Pay-to vendor – Buy-from
Vendor
Vendor by Posting Group Pay-to posting group – Pay-to vendor – Buy-from vendor
Vendor by General Business
Posting Group
Pay-to general business posting group – Pay-to vendor – Buy-from vendor
Vendor by Currency Pay-to currency - Pay-to vendor – Buy-from vendor
Vendor by Payment Terms Pay-to payment terms - Pay-to vendor – Buy-from vendor
Vendor by Purchaser Pay-to purchaser- Pay-to vendor – Buy-from vendor
Vendor by Responsibility
Center
Pay-to responsibility center - Pay-to vendor – Buy-from vendor
15.96 Vendor posting group
All vendors posting groups.
Attributes
Name Description
Vendor Posting Group Posting group of specific vendor.
(Purchase – Planning – Vendors – tab Invoicing – Vendor Posting Group –
table Vendor – Vendor Posting Group)
15.97 Warehouse Employee
Attributes
Dimension attributes are fields on table Warehouse Employee:
(Administration – Application Setup – Warehouse – Set-up Warehouse – Employees)
Name Description
Location Location
Warehouse Employee User ID
Hierarchies
Name Description
Warehouse Employee by
Location
Location – Warehouse Employee
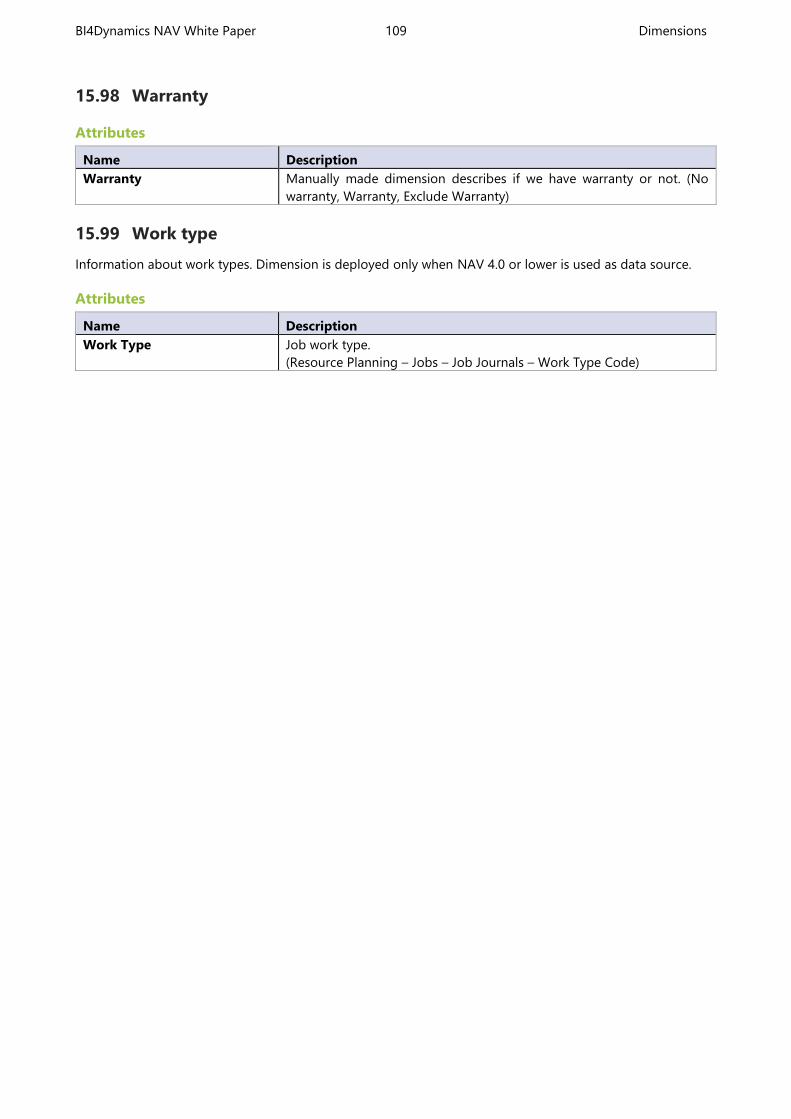
BI4Dynamics NAV White Paper 109 Dimensions
15.98 Warranty
Attributes
Name Description
Warranty Manually made dimension describes if we have warranty or not. (No
warranty, Warranty, Exclude Warranty)
15.99 Work type
Information about work types. Dimension is deployed only when NAV 4.0 or lower is used as data source.
Attributes
Name Description
Work Type Job work type.
(Resource Planning – Jobs – Job Journals – Work Type Code)
BI4Dynamics NAV White Paper 110 Important notes
16 IMPORTANT NOTES
16.1 Avoid deleting Microsoft Dynamics NAV data
BI4Dynamics functionality may be affected when some completely legal changes in Microsoft Dynamics NAV
are executed. Such changes are deletion of posted documents (that are printed) or deletion of data in source
tables (customer ledger entries for balanced customer in closed period). User should avoid such changes at all
times but if they have occurred user should contact BI4Dynamics to check if workaround is possible.
16.2 Avoid changing standard Microsoft Dynamics NAV functionality
BI4Dynamics functionality may be affected when some completely legal changes in Microsoft Dynamics NAV
are executed. If such changes have occurred user should contact BI4Dynamics to check if workaround is
possible. If changes in standard functionality are not done then BI4Dynamics will perform according to this
document.
16.3 Backup BI4Dynamics
User do not need to backup BI4Dynamics data warehouse or cubes as they can be generated each time.
Standard object can always be generated from BI4Dynamics installer, using the same BI4Dynamcsi version. If
any changes have been done to BI4Dynamics implementation than they should be saved to folder BI4Dynamics
NAV\”Instance Name”\. This folder has to be backup-ed each time some modifications are done. Scripts (files)
from this backup can restore the whole BI4Dynamics project functionality.
16.4 Backup CUBE roles
It is strongly advised that changes to Role area of cubes is saved and stored as files. These roles may be deleted
if they have been created in SQL management studio and cubes are deployed again. Backup or saving these
roles can be done through standard SQL server Analysis Services steps
16.5 Collation in source database and BI4Dynamics data warehouse
(incremental update)
When using incremental update mode, the LoadStage procedure must check if the records that exist at the
staging table of BI4NAV data warehouse have been deleted at the source DB. This is done by comparing both
tables (source table and BI4Dynamics NAV staging table) by columns that are defined as keys in NAV. These
columns are often of character data type (varchar, etc.) and the result of comparison when comparing character
fields depends on the collation defined in the BI4NAV database.
For example, if you have collation »Accent sensitive« defined in the BI4NAV data warehouse and the source
database has collation »Accent insensitive«, then this comparison might be incorrect, e.g. some records might
be incorrectly »identified« as deleted and therefore deleted from the staging table.