Embed Size (px)
Citation preview

Updated: Nov - 2017 www.solverglobal.com Copyright © 2017
BI360 for Financial Consolidations
A Solver White Paper
Multi-company Consolidations
Intercompany Eliminations
Minority Handling
Currency Conversion
IFRS to GAAP and Other Adjustments
Sarbanes Oxley
Reconciliation
Allocations
Workflow
Modeling Organizational Changes
Copyright Solver, Inc., 2017 Financial Consolidations | Page 1
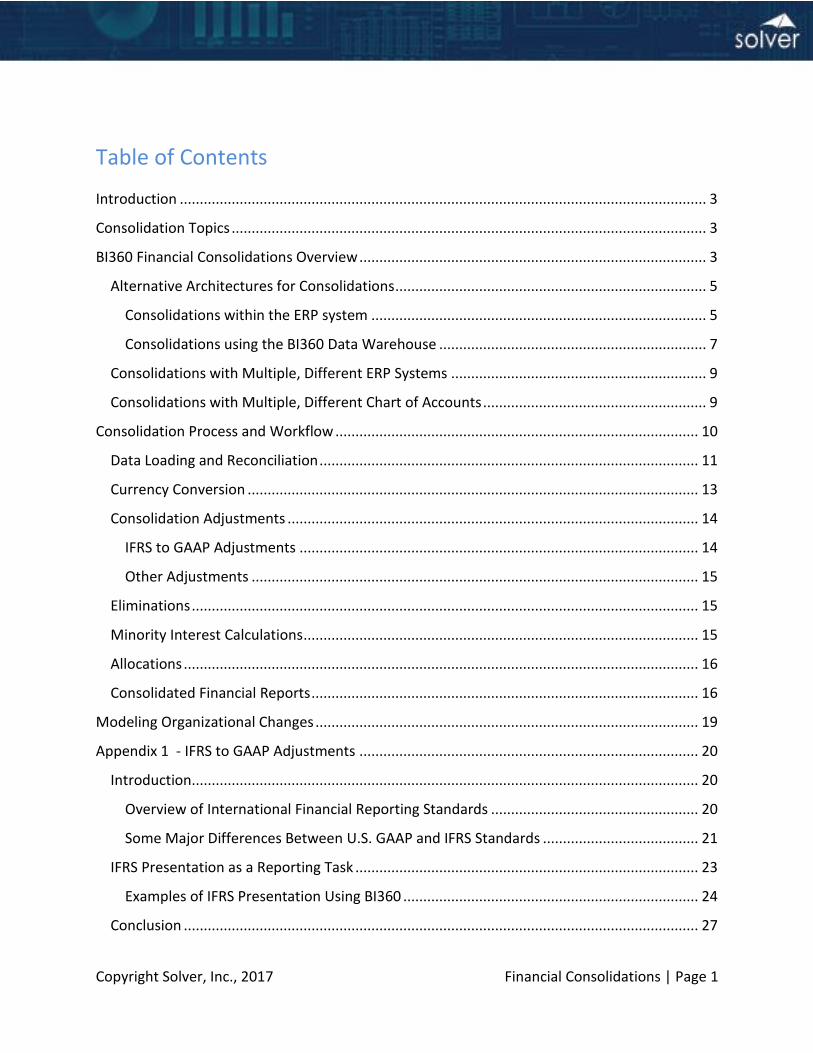
Table of Contents
Introduction .................................................................................................................................... 3
Consolidation Topics ....................................................................................................................... 3
BI360 Financial Consolidations Overview ....................................................................................... 3
Alternative Architectures for Consolidations .............................................................................. 5
Consolidations within the ERP system .................................................................................... 5
Consolidations using the BI360 Data Warehouse ................................................................... 7
Consolidations with Multiple, Different ERP Systems ................................................................ 9
Consolidations with Multiple, Different Chart of Accounts ........................................................ 9
Consolidation Process and Workflow ........................................................................................... 10
Data Loading and Reconciliation ............................................................................................... 11
Currency Conversion ................................................................................................................. 13
Consolidation Adjustments ....................................................................................................... 14
IFRS to GAAP Adjustments .................................................................................................... 14
Other Adjustments ................................................................................................................ 15
Eliminations ............................................................................................................................... 15
Minority Interest Calculations ................................................................................................... 15
Allocations ................................................................................................................................. 16
Consolidated Financial Reports ................................................................................................. 16
Modeling Organizational Changes ................................................................................................ 19
Appendix 1 - IFRS to GAAP Adjustments ..................................................................................... 20
Introduction............................................................................................................................... 20
Overview of International Financial Reporting Standards .................................................... 20
Some Major Differences Between U.S. GAAP and IFRS Standards ....................................... 21
IFRS Presentation as a Reporting Task ...................................................................................... 23
Examples of IFRS Presentation Using BI360 .......................................................................... 24
Conclusion ................................................................................................................................. 27
Copyright Solver, Inc., 2017 Financial Consolidations | Page 2
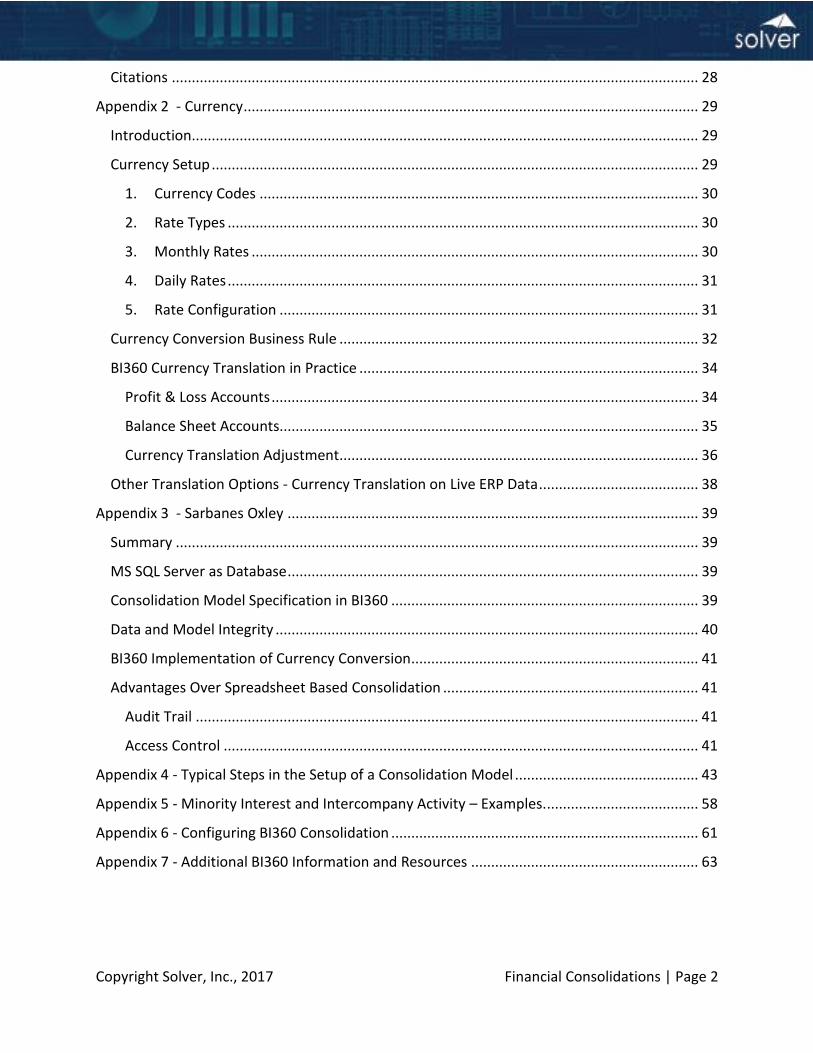
Citations .................................................................................................................................... 28
Appendix 2 - Currency .................................................................................................................. 29
Introduction............................................................................................................................... 29
Currency Setup .......................................................................................................................... 29
1. Currency Codes .............................................................................................................. 30
2. Rate Types ...................................................................................................................... 30
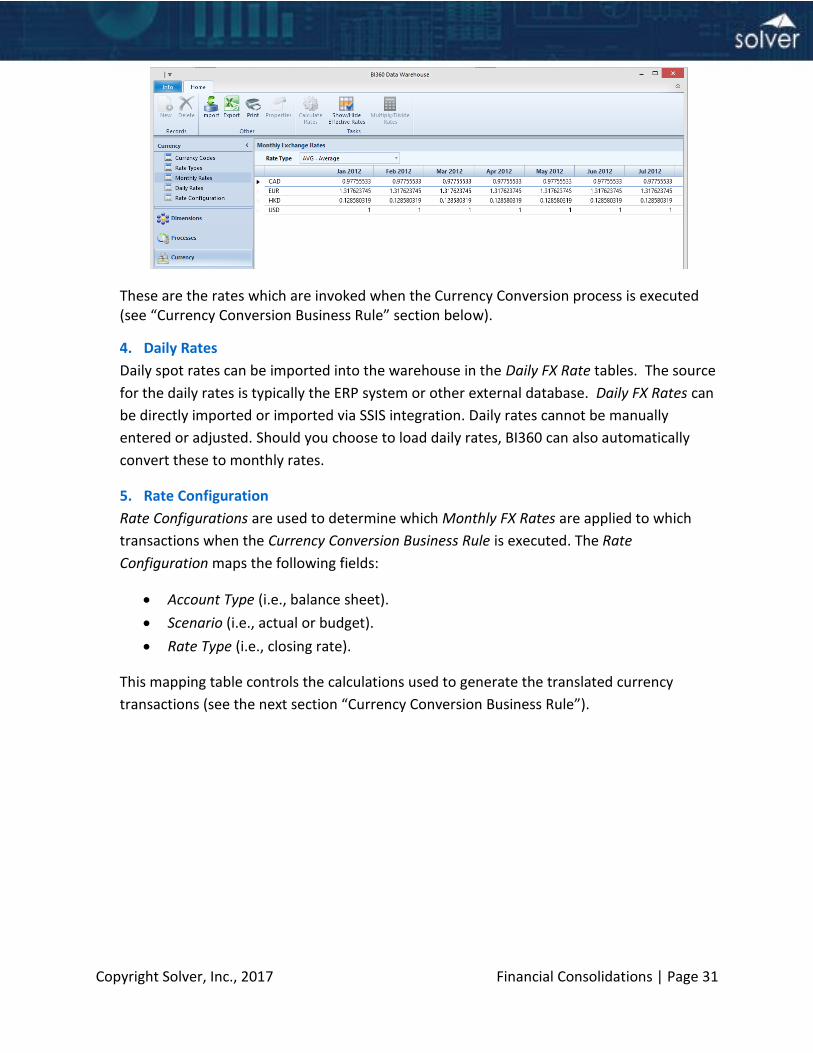
3. Monthly Rates ................................................................................................................ 30
4. Daily Rates ...................................................................................................................... 31
5. Rate Configuration ......................................................................................................... 31
Currency Conversion Business Rule .......................................................................................... 32
BI360 Currency Translation in Practice ..................................................................................... 34
Profit & Loss Accounts ........................................................................................................... 34
Balance Sheet Accounts......................................................................................................... 35
Currency Translation Adjustment.......................................................................................... 36
Other Translation Options - Currency Translation on Live ERP Data ........................................ 38
Appendix 3 - Sarbanes Oxley ....................................................................................................... 39
Summary ................................................................................................................................... 39
MS SQL Server as Database ....................................................................................................... 39
Consolidation Model Specification in BI360 ............................................................................. 39
Data and Model Integrity .......................................................................................................... 40
BI360 Implementation of Currency Conversion ........................................................................ 41
Advantages Over Spreadsheet Based Consolidation ................................................................ 41
Audit Trail .............................................................................................................................. 41
Access Control ....................................................................................................................... 41
Appendix 4 - Typical Steps in the Setup of a Consolidation Model .............................................. 43
Appendix 5 - Minority Interest and Intercompany Activity – Examples. ...................................... 58
Appendix 6 - Configuring BI360 Consolidation ............................................................................. 61
Appendix 7 - Additional BI360 Information and Resources ......................................................... 63
Copyright Solver, Inc., 2017 Financial Consolidations | Page 3
Introduction BI360 is the first full Corporate Performance Management (CPM) suite available for cloud and on-
premise deployment. It is powered by Microsoft Excel for report design and deployed and managed
in modern web portal. Another unique and important component of BI360 is that it sits on top of a
highly flexible, configurable business data warehouse. It has robust financial consolidations,
eliminations and multi-currency capabilities and the purpose of the white paper is to describe this
specific functionality available for BI360 Cloud and BI360 4.0 and later.
Consolidation Topics Depending on organizational complexity and business requirements, companies look to
consolidation software to provide one more of the following features (all of these areas are
covered in the rest of this white paper):
Mapping different Chart of Accounts
Consolidation process (Workflow)
Data loading
Reconciliation
Currency conversions
IFRS to GAAP adjustments
Other Consolidation adjustments
Eliminations of intercompany transactions
Minority calculations
Allocations
Consolidate financial statements
Consolidate sub-ledger or statistical data
Sarbanes Oxley (SOX) compliance
BI360 Financial Consolidations Overview
Companies look for modern, automated consolidations solutions for many reasons, such as:
Improve consolidation process and utilize workflow with automated alerts and
controls.
Eliminate manual spreadsheet consolidations.
Get away from older, legacy reporting & consolidation tools (such as Hyperion, TM1
and other IBM Cognos applications, FRx, etc.) that either are too complex and
expensive to maintain, or they don’t perform all the tasks expected from modern
tools in this area.
Implement a Sarbanes-Oxley compliant solution.
Copyright Solver, Inc., 2017 Financial Consolidations | Page 4
Implement a solution that can handle multi-national requirements such as GAAP to
IFRS adjustments and currency conversions.
Implement a modern, user-friendly solution that can be fully managed by the
finance team.
Implement a solution that is more scalable and versatile than traditional
consolidation solutions, so that is also can be used for all kinds of other reporting
such as operational reporting, statistical reporting, etc.
Implement a reporting and consolidation solution that is an integral part of a
Corporate Performance Management (CPM) suite that also include budgeting,
forecasting, modeling, ad-hoc reporting, dashboards (including integration to 3rd
party dashboards like Power BI, Tableau, Qlik, etc.) and data warehousing.
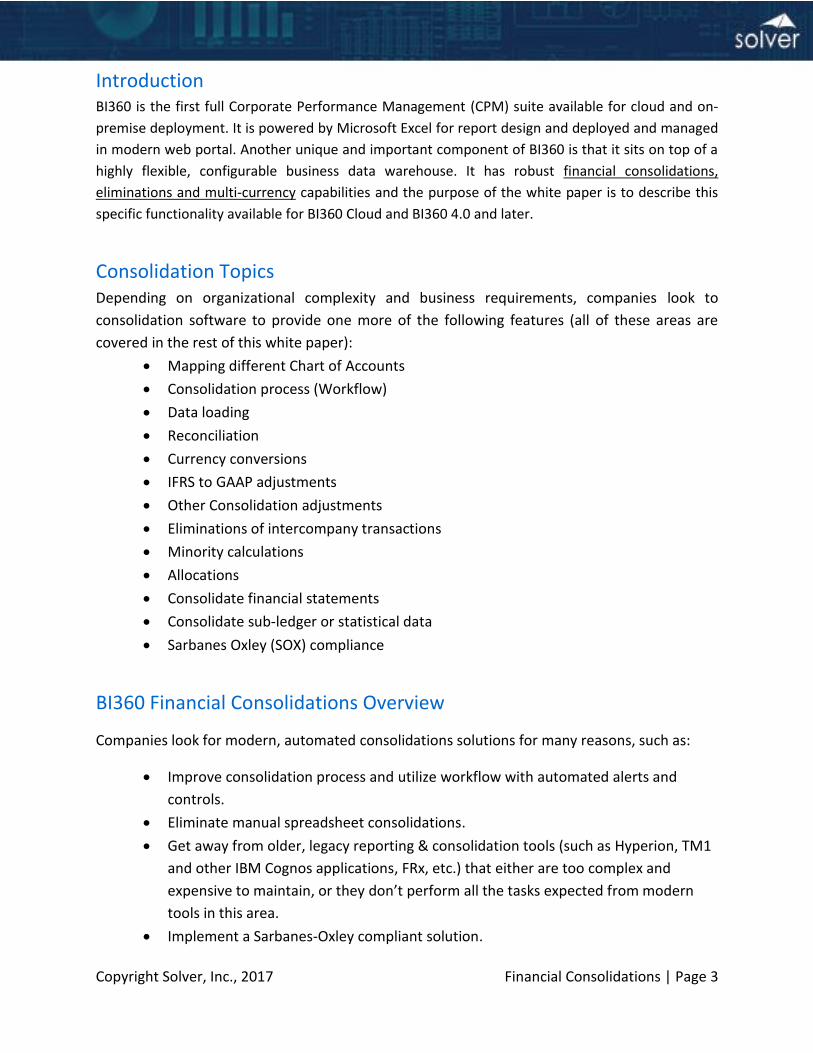
Launched in the Fall of 2009, and in the years that have passed since then, BI360 has become one
of the most complete and modern Corporate Performance Managment (CPM) suites on the
market. It allows the finance team to regain control of all aspects of the reporting and
consolidation process. Below is a sample architecture slide that shows all four main components
of the BI360 suite.
On the following pages you can read about BI360 and how it deals with the various areas that
often are part of a company’s consolidations needs. In some cases there are referrals to
additional white papers that cover specific topics in much more detail. If you are interested in
any of these white papers, please log into the Solver Support portal or send an e-mail to
[email protected]. See Appendix 7 for more resources.
Copyright Solver, Inc., 2017 Financial Consolidations | Page 5
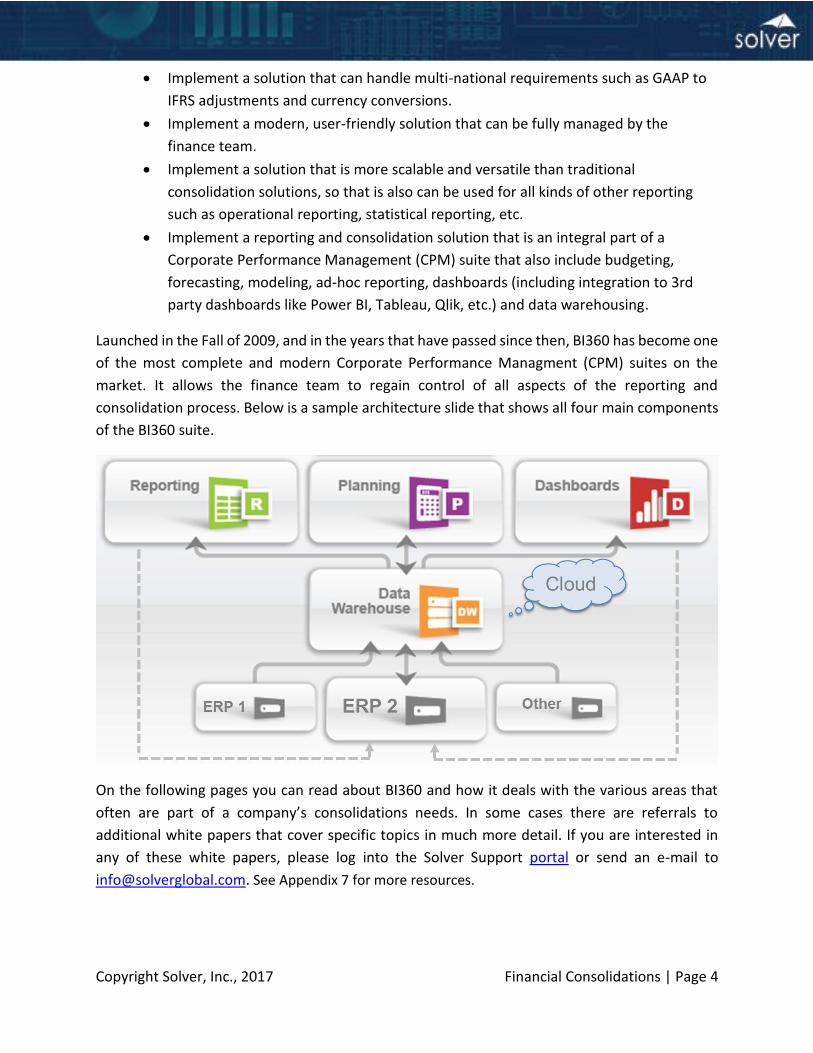
Alternative Architectures for Consolidations
BI360 can consolidate within the ERP system (available for ERPs where live BI360 integrations
exist) or by populating the BI360 Data Warehouse (DW) with data from the ERP system(s). The
latter is the way almost all consolidations software work. Below, both of these options are
described. With either method, BI360’s report writer will let you design dynamic, highly
formatted consolidated reports:
Consolidations within the ERP system
Using the BI360 Multi-Company (MC) module, you can perform basic consolidated reporting
directly from your ERP database. The BI360 MC module takes trial balances and/or journal entry
Copyright Solver, Inc., 2017 Financial Consolidations | Page 6
level detail from each company in the ERP system and automatically updates them into a special
BI360 MC table within the ERP database.
Then you can design cross-company reports with the BI360 report writer that accesses the MC
table.
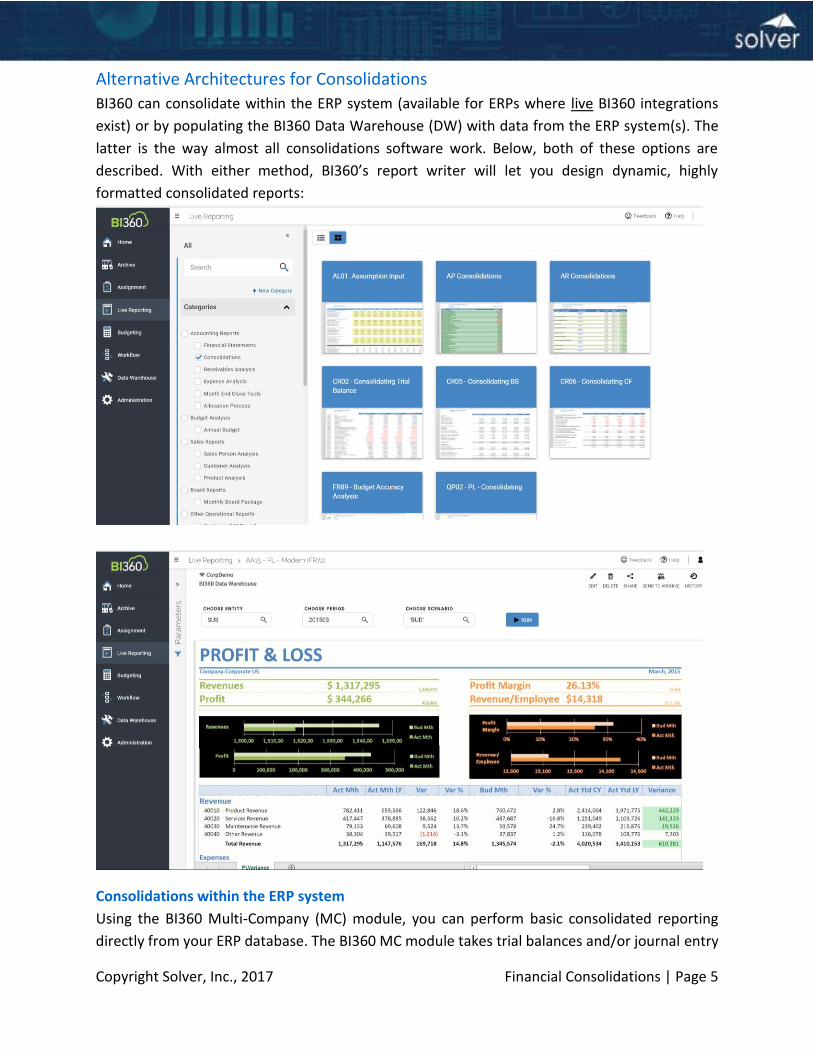
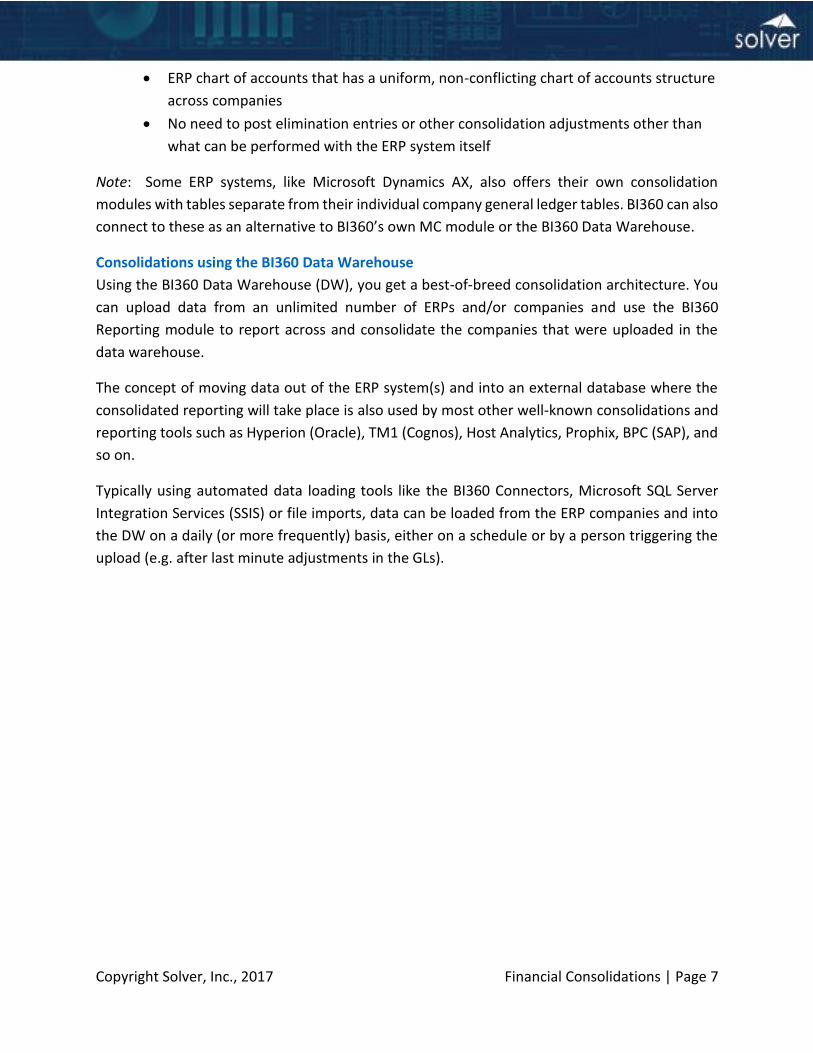
Below is a screenshot from the BI360 MC module’s simple, administrative interface where you
can select individual companies and when to update their data into the MC table in the ERP
database:
Consolidating within the ERP system is usually a good choice under one or more of the
following conditions:
No- or very basic currency conversion needed (beyond what is done by the ERP
system itself or as calculations in the BI360 report writer)
Low to medium number of companies to consolidate
No concerns around ERP system performance when heavy reports are being
executed
No interest in reports that bring in data from other data sources
Copyright Solver, Inc., 2017 Financial Consolidations | Page 7
ERP chart of accounts that has a uniform, non-conflicting chart of accounts structure
across companies
No need to post elimination entries or other consolidation adjustments other than
what can be performed with the ERP system itself
Note: Some ERP systems, like Microsoft Dynamics AX, also offers their own consolidation
modules with tables separate from their individual company general ledger tables. BI360 can also
connect to these as an alternative to BI360’s own MC module or the BI360 Data Warehouse.
Consolidations using the BI360 Data Warehouse
Using the BI360 Data Warehouse (DW), you get a best-of-breed consolidation architecture. You
can upload data from an unlimited number of ERPs and/or companies and use the BI360
Reporting module to report across and consolidate the companies that were uploaded in the
data warehouse.
The concept of moving data out of the ERP system(s) and into an external database where the
consolidated reporting will take place is also used by most other well-known consolidations and
reporting tools such as Hyperion (Oracle), TM1 (Cognos), Host Analytics, Prophix, BPC (SAP), and
so on.
Typically using automated data loading tools like the BI360 Connectors, Microsoft SQL Server
Integration Services (SSIS) or file imports, data can be loaded from the ERP companies and into
the DW on a daily (or more frequently) basis, either on a schedule or by a person triggering the
upload (e.g. after last minute adjustments in the GLs).
Copyright Solver, Inc., 2017 Financial Consolidations | Page 8
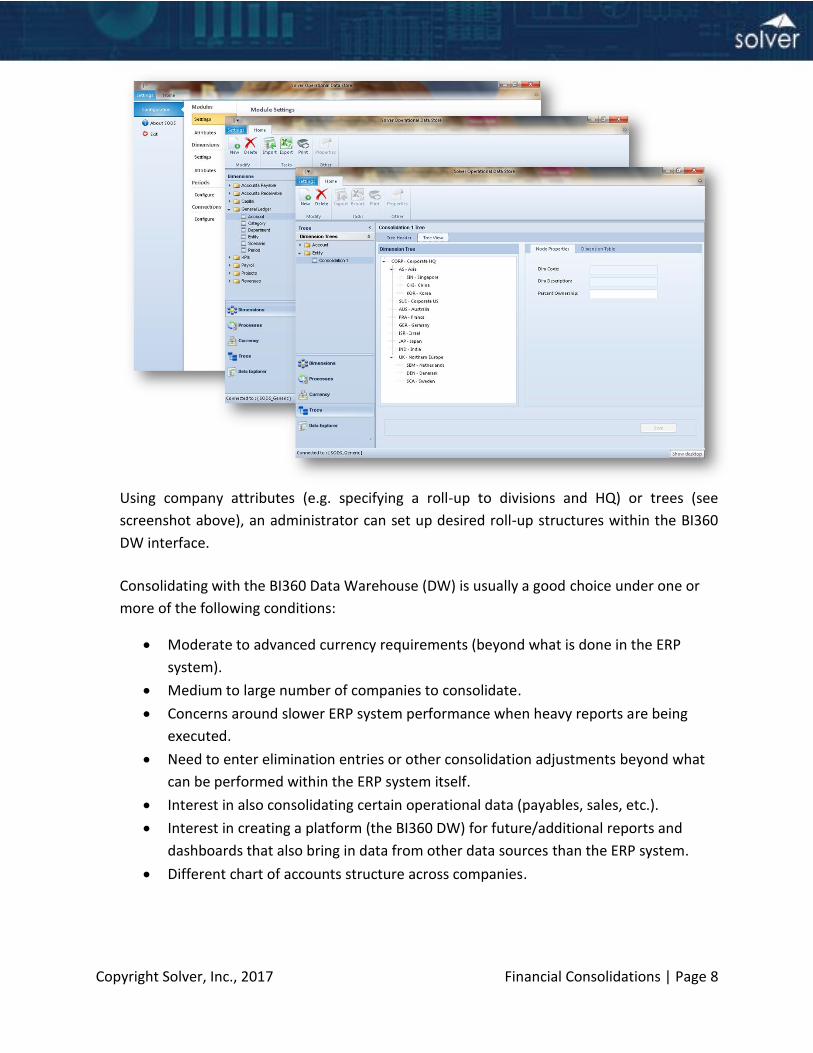
Using company attributes (e.g. specifying a roll-up to divisions and HQ) or trees (see
screenshot above), an administrator can set up desired roll-up structures within the BI360
DW interface.
Consolidating with the BI360 Data Warehouse (DW) is usually a good choice under one or
more of the following conditions:
Moderate to advanced currency requirements (beyond what is done in the ERP
system).
Medium to large number of companies to consolidate.
Concerns around slower ERP system performance when heavy reports are being
executed.
Need to enter elimination entries or other consolidation adjustments beyond what
can be performed within the ERP system itself.
Interest in also consolidating certain operational data (payables, sales, etc.).
Interest in creating a platform (the BI360 DW) for future/additional reports and
dashboards that also bring in data from other data sources than the ERP system.
Different chart of accounts structure across companies.
Copyright Solver, Inc., 2017 Financial Consolidations | Page 9
Consolidations with Multiple, Different ERP Systems
Some multi-entity companies have different accounting systems in their subsidiaries and this
tend to add some complexity to a consolidations process compared to a situation where all
subsidiaries reside within the same ERP system,
There are a couple of ways to enable consolidated reporting when there are multiple ERP
systems:
1. Upload data from a subsidiary ERP system into a corporate ERP system
This methodology is typical when there is a dominant ERP system within the organization and
frequently when there is a long term strategy to put all subsidiaries on the same ERP system. In
this case, there is not much work for BI360, as ultimately all the subsidiaries will reside within a
single ERP system and thus either of the two consolidation architectures described earlier in this
white paper can be utilized.
2. Upload data from each subsidiary ERP system into the BI360 Data Warehouse (DW)
This methodology leaves each ERP system as is and account mapping and loading is taken care
of as part of the transfer of data and dimensions into the BI360 DW. This is typical when
subsidiaries are autonomous; there are frequent acquisitions or other good reasons not to import
data from one ERP to another prior to consolidated reporting taking place. This consolidation
architecture is described in section #3, paragraph #2 above (“Consolidations using the BI360 Data
Warehouse”).
Consolidations with Multiple, Different Chart of Accounts
In situations where there are different Chart of Accounts across various subsidiaries, using the
BI360 Data Warehouse (DW) is typically the best way to go. The process could look like this:
1. Extract data and GL dimensions (account, division, etc.) from each ERP, for example using
an automated SQL Server Integration Services (SSIS) job.
2. Transform/Map the local ERP chart of accounts into a corporate/consolidated chart of
accounts.
3. Load the converted data (now mapped to the corporate chart of accounts) into the BI360
DW.
4. Run consolidation reports.
Alternatively, step#2 above (“Transform/Map…”) can be performed within the BI360 DW using
attributes in the DW account table to map individual account number so to a corporate chart of
accounts. See screenshot below. Another methodology is to do the account mapping within an
account tree in the DW and use the mapped summary nodes when writing reports.
Copyright Solver, Inc., 2017 Financial Consolidations | Page 10
Consolidation Process and Workflow Depending on how complex your consolidation process is, you have several options for how to
organize it.
1. Manage it yourself without any BI360 workflow functionality. This should be fine if you
have a fairly simple consolidation process.
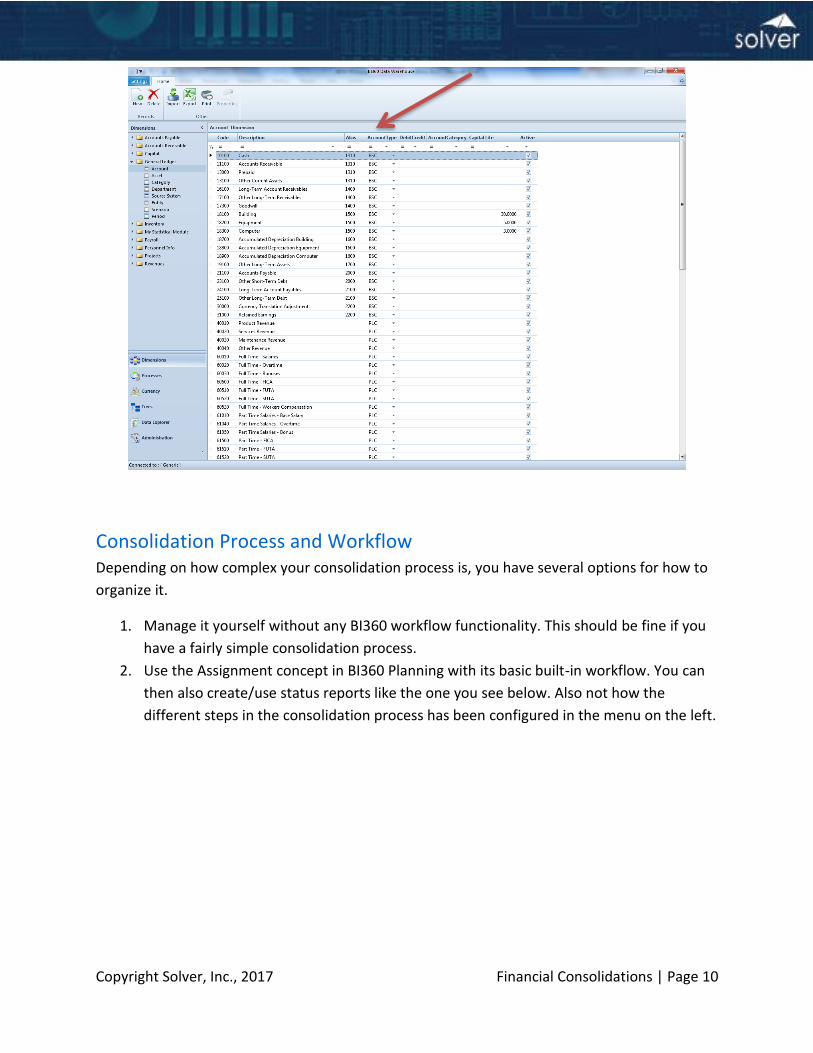
2. Use the Assignment concept in BI360 Planning with its basic built-in workflow. You can
then also create/use status reports like the one you see below. Also not how the
different steps in the consolidation process has been configured in the menu on the left.
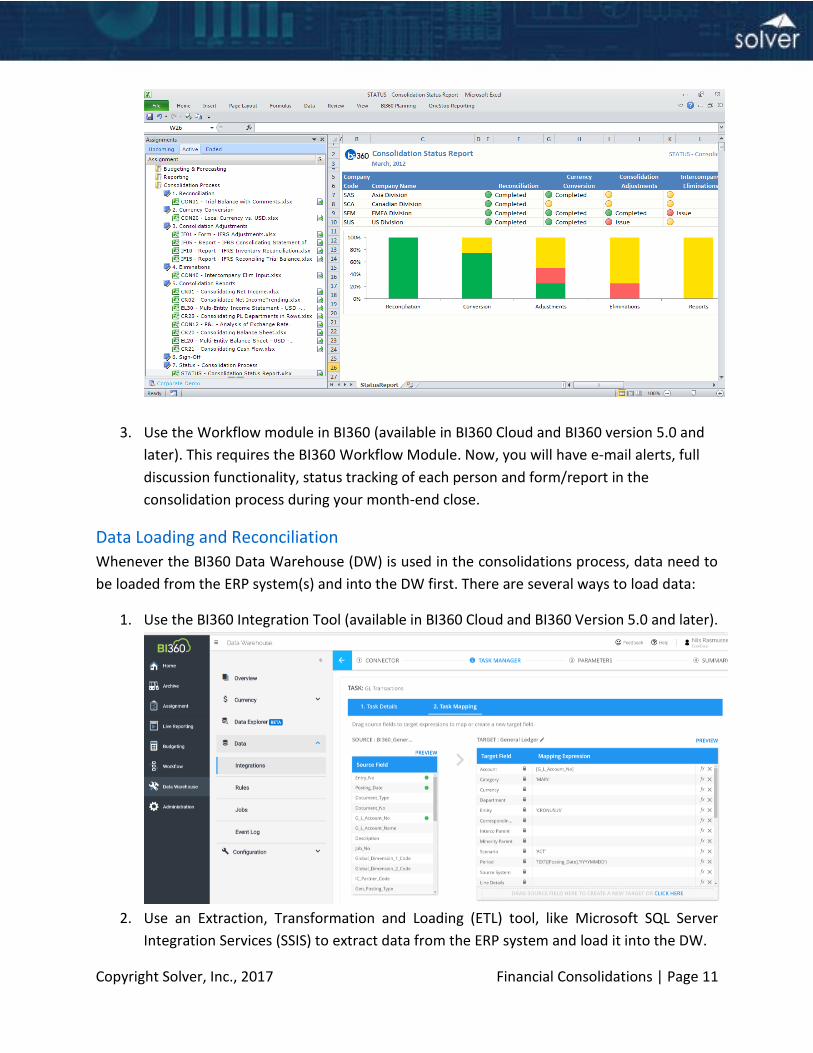
Copyright Solver, Inc., 2017 Financial Consolidations | Page 11
3. Use the Workflow module in BI360 (available in BI360 Cloud and BI360 version 5.0 and
later). This requires the BI360 Workflow Module. Now, you will have e-mail alerts, full
discussion functionality, status tracking of each person and form/report in the
consolidation process during your month-end close.
Data Loading and Reconciliation
Whenever the BI360 Data Warehouse (DW) is used in the consolidations process, data need to
be loaded from the ERP system(s) and into the DW first. There are several ways to load data:
1. Use the BI360 Integration Tool (available in BI360 Cloud and BI360 Version 5.0 and later).
2. Use an Extraction, Transformation and Loading (ETL) tool, like Microsoft SQL Server
Integration Services (SSIS) to extract data from the ERP system and load it into the DW.
Copyright Solver, Inc., 2017 Financial Consolidations | Page 12
3. Use the BI360 Integration Manager (embedded within the BI360 Data Warehouse
Manager from version 4.0 and later). This tool use pre-built integrations to load data into
the DW. Solver and development partners provide these integrations.
4. Import data from files using the file import wizards embedded within the BI360 Data
Warehouse Manager.
5. A more unconventional, but fully configurable method to load data into the DW is to use
the BI360 Planning module and design an input form. You can then either copy and paste
or enter data there and save it directly to the DW.
Once data has been loaded to the DW, many organizations like to either have subidiary staff or
headquarter staff reconcile the imported data to ensure everything is correct. There are several
ways to perform this reconciliation, including:
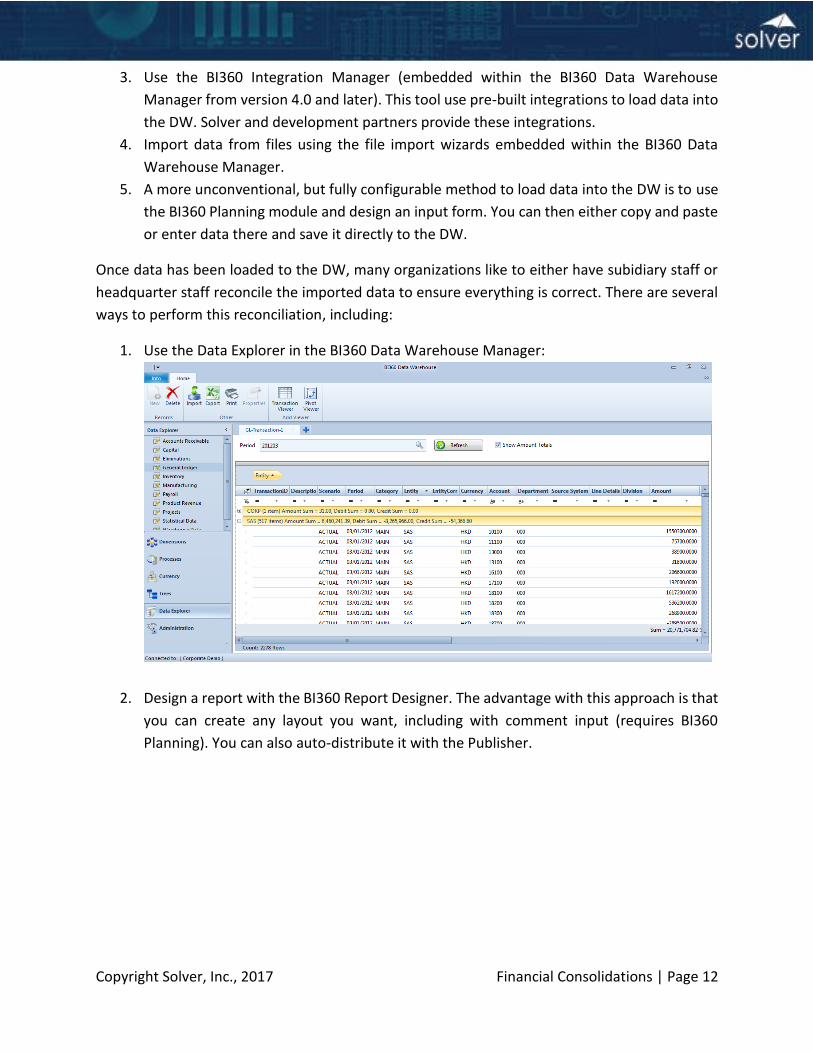
1. Use the Data Explorer in the BI360 Data Warehouse Manager:
2. Design a report with the BI360 Report Designer. The advantage with this approach is that
you can create any layout you want, including with comment input (requires BI360
Planning). You can also auto-distribute it with the Publisher.
Copyright Solver, Inc., 2017 Financial Consolidations | Page 13
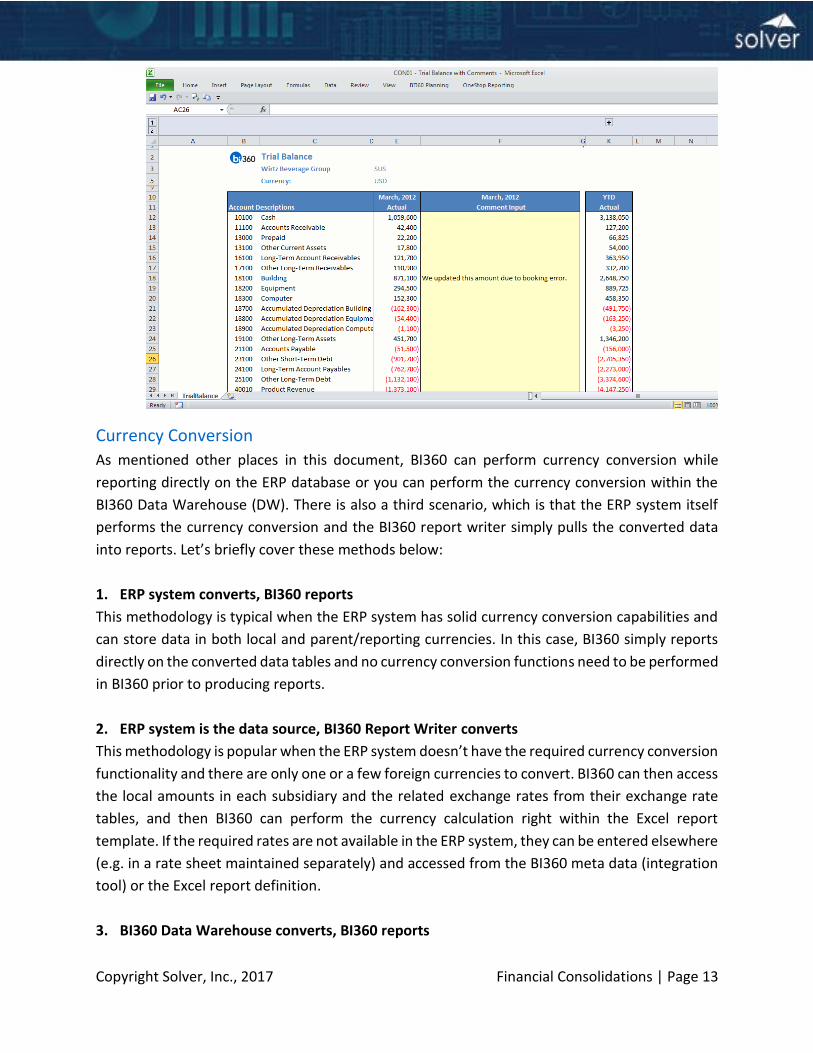
Currency Conversion
As mentioned other places in this document, BI360 can perform currency conversion while
reporting directly on the ERP database or you can perform the currency conversion within the
BI360 Data Warehouse (DW). There is also a third scenario, which is that the ERP system itself
performs the currency conversion and the BI360 report writer simply pulls the converted data
into reports. Let’s briefly cover these methods below:
1. ERP system converts, BI360 reports
This methodology is typical when the ERP system has solid currency conversion capabilities and
can store data in both local and parent/reporting currencies. In this case, BI360 simply reports
directly on the converted data tables and no currency conversion functions need to be performed
in BI360 prior to producing reports.
2. ERP system is the data source, BI360 Report Writer converts
This methodology is popular when the ERP system doesn’t have the required currency conversion
functionality and there are only one or a few foreign currencies to convert. BI360 can then access
the local amounts in each subsidiary and the related exchange rates from their exchange rate
tables, and then BI360 can perform the currency calculation right within the Excel report
template. If the required rates are not available in the ERP system, they can be entered elsewhere
(e.g. in a rate sheet maintained separately) and accessed from the BI360 meta data (integration
tool) or the Excel report definition.
3. BI360 Data Warehouse converts, BI360 reports
Copyright Solver, Inc., 2017 Financial Consolidations | Page 14
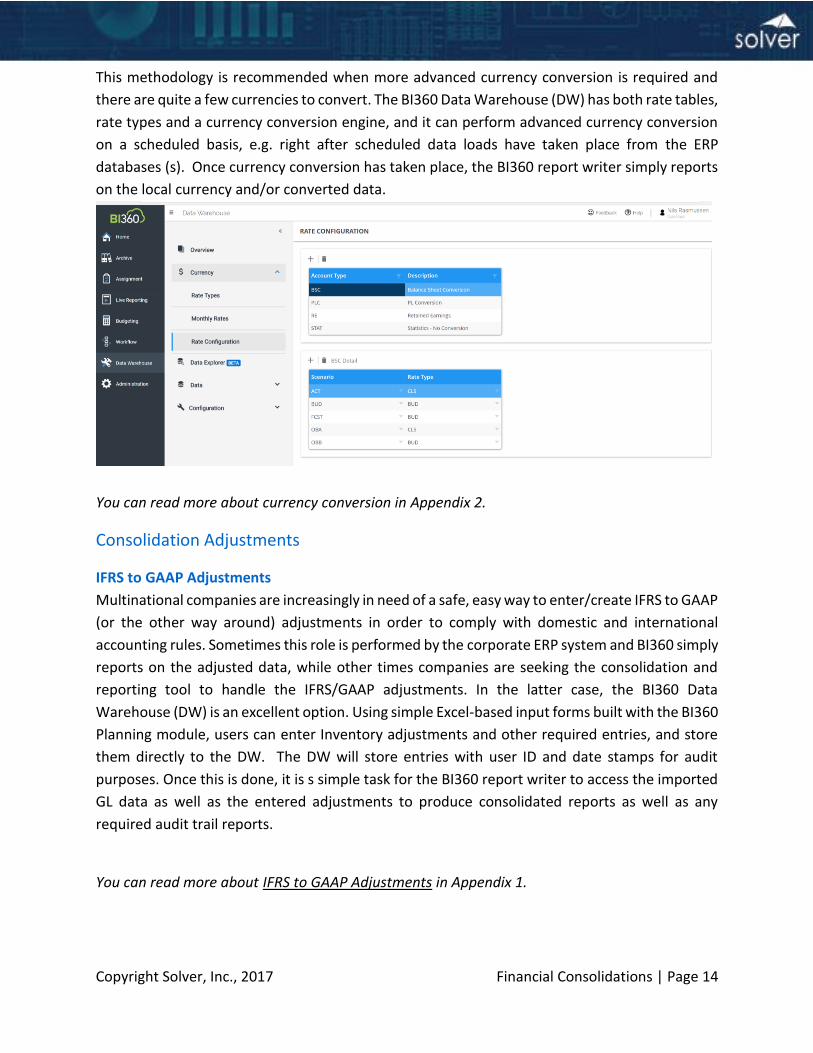
This methodology is recommended when more advanced currency conversion is required and
there are quite a few currencies to convert. The BI360 Data Warehouse (DW) has both rate tables,
rate types and a currency conversion engine, and it can perform advanced currency conversion
on a scheduled basis, e.g. right after scheduled data loads have taken place from the ERP
databases (s). Once currency conversion has taken place, the BI360 report writer simply reports
on the local currency and/or converted data.
You can read more about currency conversion in Appendix 2.
Consolidation Adjustments
IFRS to GAAP Adjustments
Multinational companies are increasingly in need of a safe, easy way to enter/create IFRS to GAAP
(or the other way around) adjustments in order to comply with domestic and international
accounting rules. Sometimes this role is performed by the corporate ERP system and BI360 simply
reports on the adjusted data, while other times companies are seeking the consolidation and
reporting tool to handle the IFRS/GAAP adjustments. In the latter case, the BI360 Data
Warehouse (DW) is an excellent option. Using simple Excel-based input forms built with the BI360
Planning module, users can enter Inventory adjustments and other required entries, and store
them directly to the DW. The DW will store entries with user ID and date stamps for audit
purposes. Once this is done, it is s simple task for the BI360 report writer to access the imported
GL data as well as the entered adjustments to produce consolidated reports as well as any
required audit trail reports.
You can read more about IFRS to GAAP Adjustments in Appendix 1.
Copyright Solver, Inc., 2017 Financial Consolidations | Page 15
Other Adjustments
Depending on the company and requirements, there can be several other situations where a
corporate controller needs to post consolidation-related adjustment entries. Including currency-
related adjustments, temporary correction of erroneous data from a subsidiary, etc. This can be
done rather elegantly by using BI360 Planning to design a user-friendly input form(s) where such
transactions can be entered and stored in the BI360 Data Warehouse. By default, entered
transactions will be tracked with user id and time/data stamps. You can also enter comments to
explain the reason for the adjustment entries.
Eliminations
There are several ways to perform eliminations of intercompany transactions:
1. ERP system offers elimination functionality
Many ERP systems either provide the facilities to enter elimination entries into elimination
companies and/or they provide functionality to perform auto-eliminations. In either case, the
BI360 report writer can report on this data and does not need any special intercompany
elimination functions beyond that.
2. Eliminations done by the BI360 Reports/Forms running on the BI360 Data Warehouse
The BI360 Planning module offers fully customizable Excel input forms that can be used for
manual elimination entries. Furthermore, BI360’s reporting module in combination with the
Planning module’s write-back functionality can perform automatic elimination calculations and
store these to the BI360 DW for use in consolidation reports.
3. Eliminations done within the BI360 Data Warehouse (DW)
The BI360 DW also offers an elimination process that can be run automatically after data has
been loaded from the ERP systems and into the DW. This functionality will automatically create
and post elimination entries in the DW based on inter-company transactions and roll-up trees
(hierarchies). These elimination transactions are then available for the BI360 report writer to be
used in consolidation reports, inter-company matching reports, etc.
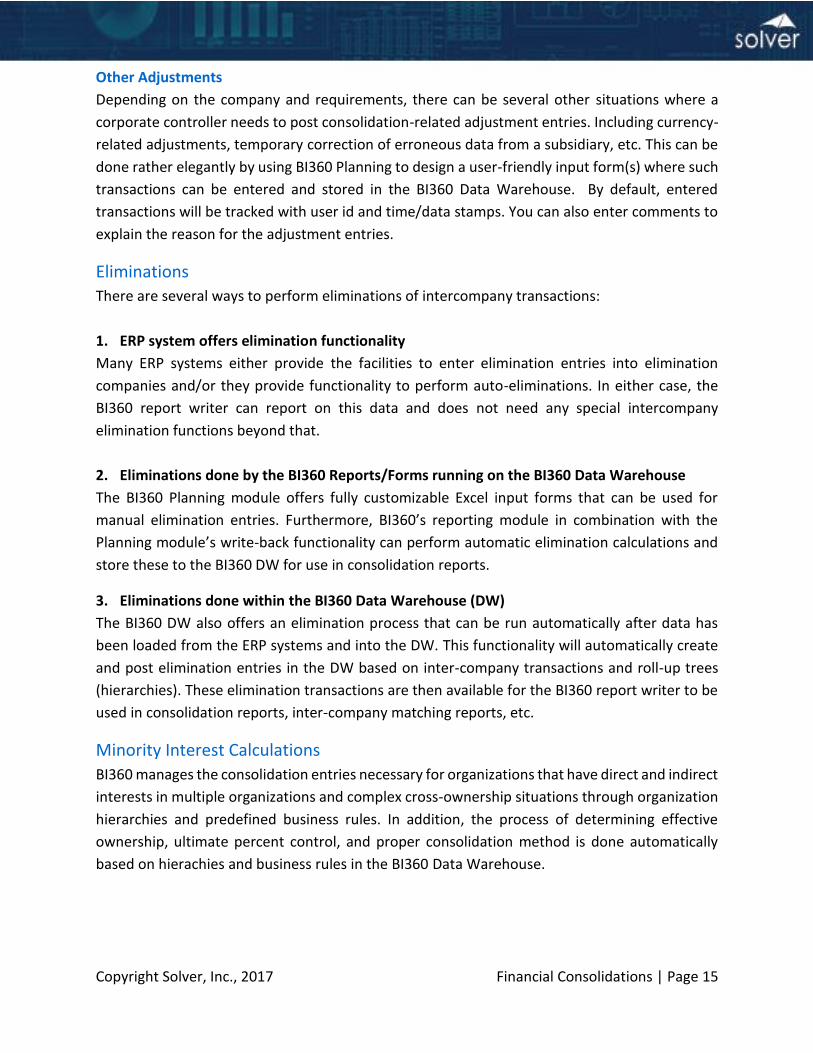
Minority Interest Calculations
BI360 manages the consolidation entries necessary for organizations that have direct and indirect
interests in multiple organizations and complex cross-ownership situations through organization
hierarchies and predefined business rules. In addition, the process of determining effective
ownership, ultimate percent control, and proper consolidation method is done automatically
based on hierachies and business rules in the BI360 Data Warehouse.
Copyright Solver, Inc., 2017 Financial Consolidations | Page 16
Allocations
Some corporations also need to perform allocations as part of their monthly consolidation
process. For example, allocating corporate overhead expenses down to divisions and/or
subsidiaries. Unless these allocations are already performed within the ERP system and is just
part of the ordinary data loading to BI360, you can design simple or highly sophisticated
allocation reports that calculates and saves allocations into the BI360 Data Warehouse (DW). This
requires BI360 Planning for the write-back of the allocations. Because the resulting allocations
become real transactions in the BI360 DW, if desirable, you can later export these back to the
ERP system as well. In essence, using BI360 as your allocation engine.
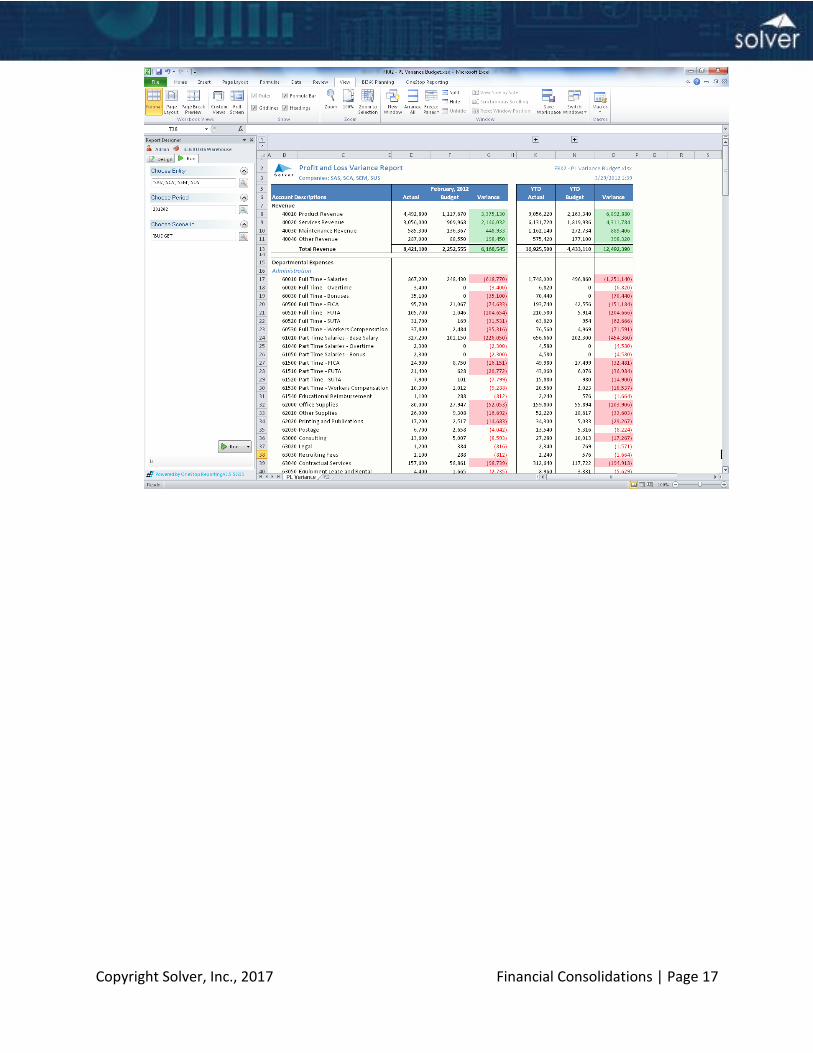
Consolidated Financial Reports
At the point when data loading, account mapping, reconciliation, currency conversion,
adjustments, and elimination processes have been completed (maybe you require only a few of
the above processes) you are ready to produce your consolidated reports with BI360’s report
writer. Reports can roll-up companies and display them in an almost unlimited number of report
layouts, such as:
- Consolidated reports (companies are consolidated into single columns of e.g. actual,
budget and variance figures):
Copyright Solver, Inc., 2017 Financial Consolidations | Page 17
Copyright Solver, Inc., 2017 Financial Consolidations | Page 18
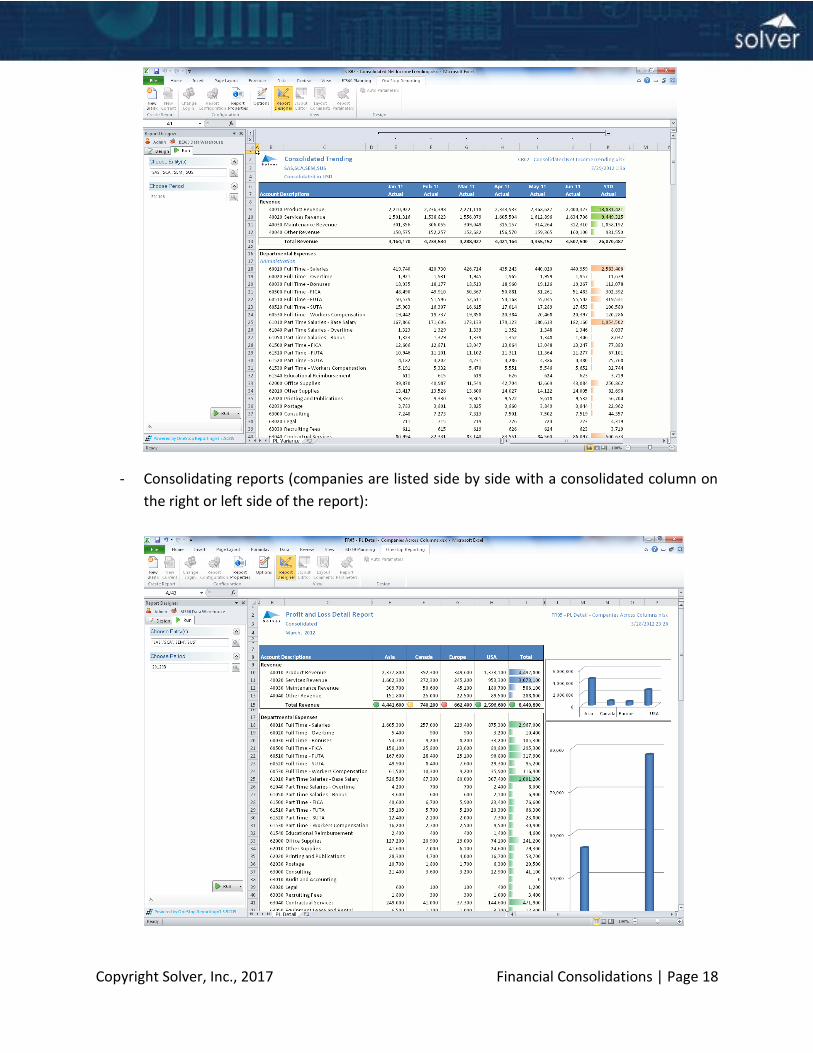
- Consolidating reports (companies are listed side by side with a consolidated column on
the right or left side of the report):
Copyright Solver, Inc., 2017 Financial Consolidations | Page 19
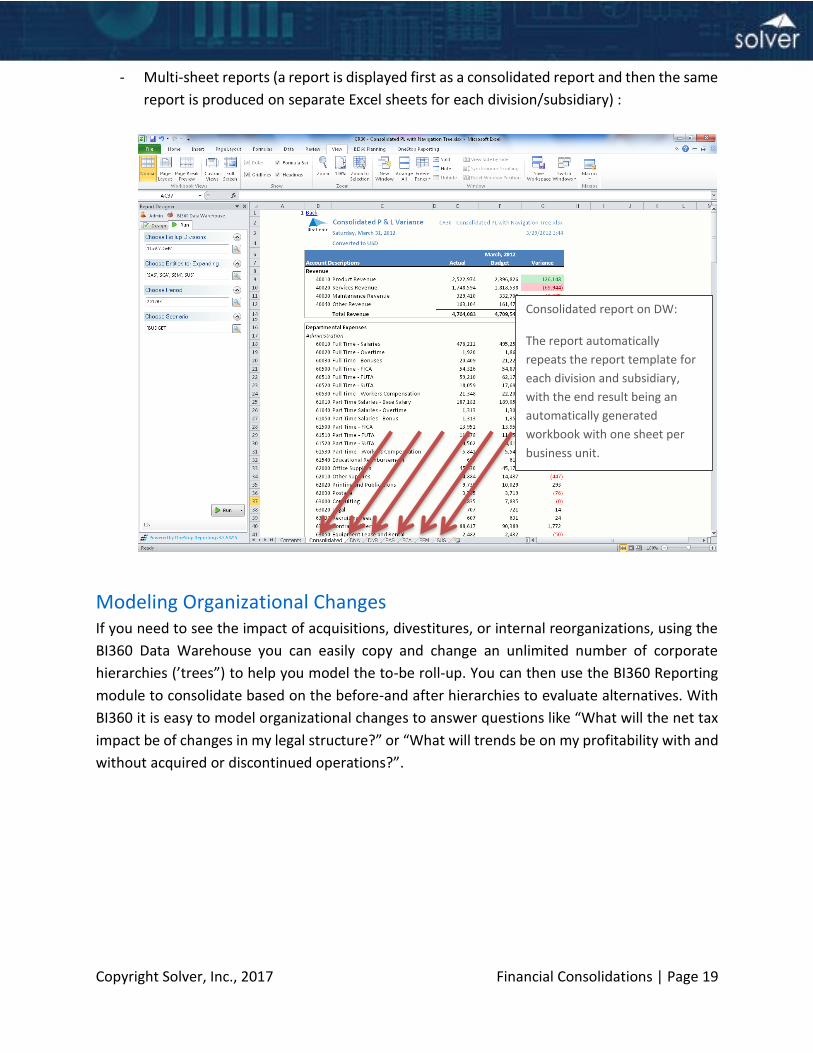
- Multi-sheet reports (a report is displayed first as a consolidated report and then the same
report is produced on separate Excel sheets for each division/subsidiary) :
Modeling Organizational Changes If you need to see the impact of acquisitions, divestitures, or internal reorganizations, using the
BI360 Data Warehouse you can easily copy and change an unlimited number of corporate
hierarchies (’trees”) to help you model the to-be roll-up. You can then use the BI360 Reporting
module to consolidate based on the before-and after hierarchies to evaluate alternatives. With
BI360 it is easy to model organizational changes to answer questions like “What will the net tax
impact be of changes in my legal structure?” or “What will trends be on my profitability with and
without acquired or discontinued operations?”.
Consolidated report on DW:
The report automatically
repeats the report template for
each division and subsidiary,
with the end result being an
automatically generated
workbook with one sheet per
business unit.
Copyright Solver, Inc., 2017 Financial Consolidations | Page 20
Appendix 1 - IFRS to GAAP Adjustments
Introduction
After reading this appendix, readers should:
Understand the basis for International Financial Reporting Standards (IFRS).
Have a basic acquaintance with the differences between IFRS and U.S. Generally Accepted Accounting Principles (US GAAP), as well as with some of the challenges resulting from multiple financial rule sets.
Appreciate how the BI360 corporate performance management suite can be employed to manage the presentation of simultaneous financial statements and supporting reports under IFRS and U.S. GAAP.
Overview of International Financial Reporting Standards
International Financial Reporting Standards (IFRS) are an integrated set of authoritative
accounting pronouncements promulgated by the International Accounting Standards Board
(IASB). The IASB is an independent standard-setting body organized to “develop a single set of
high quality, understandable, enforceable and globally accepted International Financial
Reporting Standards (IFRS).”1
Among the advantages of a globally-applied set of high-quality accounting standards are the
following:
Increased comparability of company results and transparency in financial reporting.
Improved access to capital, as investors are not required to be well-versed in varying local Generally Accepted Accounting Principles (GAAP) to evaluate investment candidates. Also financial statements will be acceptable to different national exchanges without restatement.
Simplified financial reporting for multinational organizations since subsidiary statements will no longer require restatement from local GAAP prior to consolidation.
Lowered cost of financial reporting as a worldwide accounting staff may be flexibly assigned.
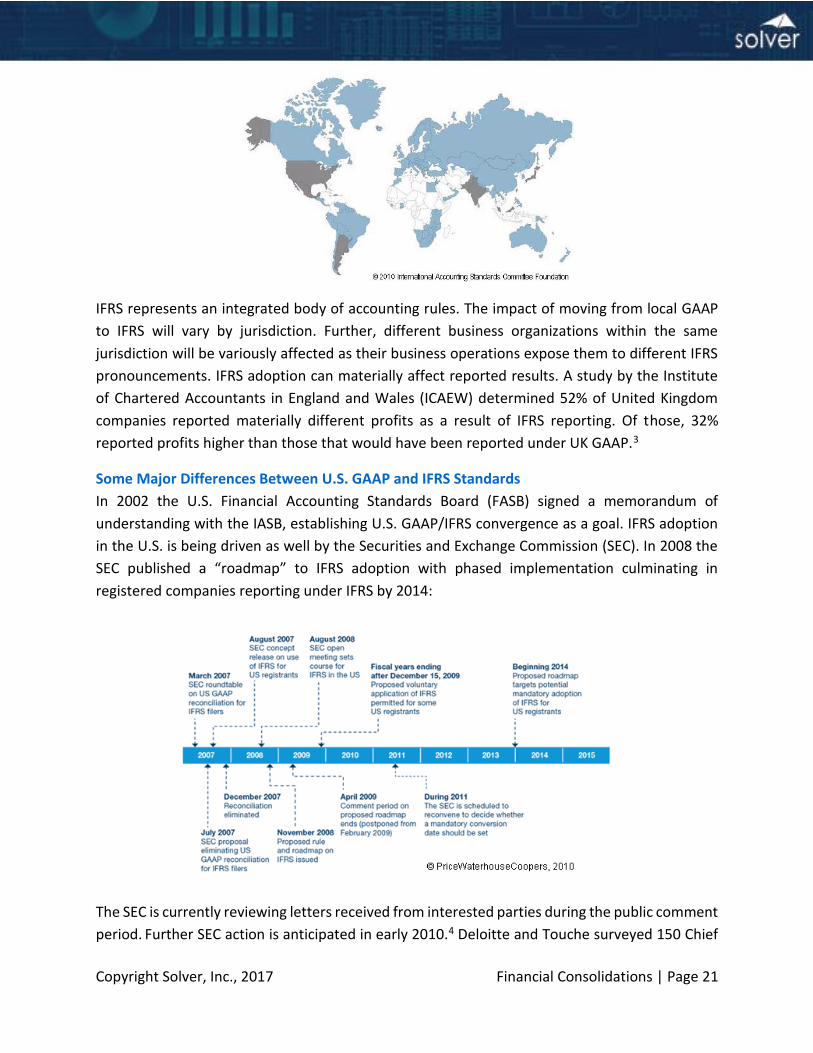
IFRS has substantial global momentum. Since 2001, almost 120 countries have required or
permitted the use of IFRS. In the figure below, blue areas indicate countries that require or permit
reporting under IFRS as of 2010; grey areas indicate countries seeking convergence with or
pursuing adoption of IFRS.2
Copyright Solver, Inc., 2017 Financial Consolidations | Page 21
IFRS represents an integrated body of accounting rules. The impact of moving from local GAAP
to IFRS will vary by jurisdiction. Further, different business organizations within the same
jurisdiction will be variously affected as their business operations expose them to different IFRS
pronouncements. IFRS adoption can materially affect reported results. A study by the Institute
of Chartered Accountants in England and Wales (ICAEW) determined 52% of United Kingdom
companies reported materially different profits as a result of IFRS reporting. Of those, 32%
reported profits higher than those that would have been reported under UK GAAP.3
Some Major Differences Between U.S. GAAP and IFRS Standards
In 2002 the U.S. Financial Accounting Standards Board (FASB) signed a memorandum of
understanding with the IASB, establishing U.S. GAAP/IFRS convergence as a goal. IFRS adoption
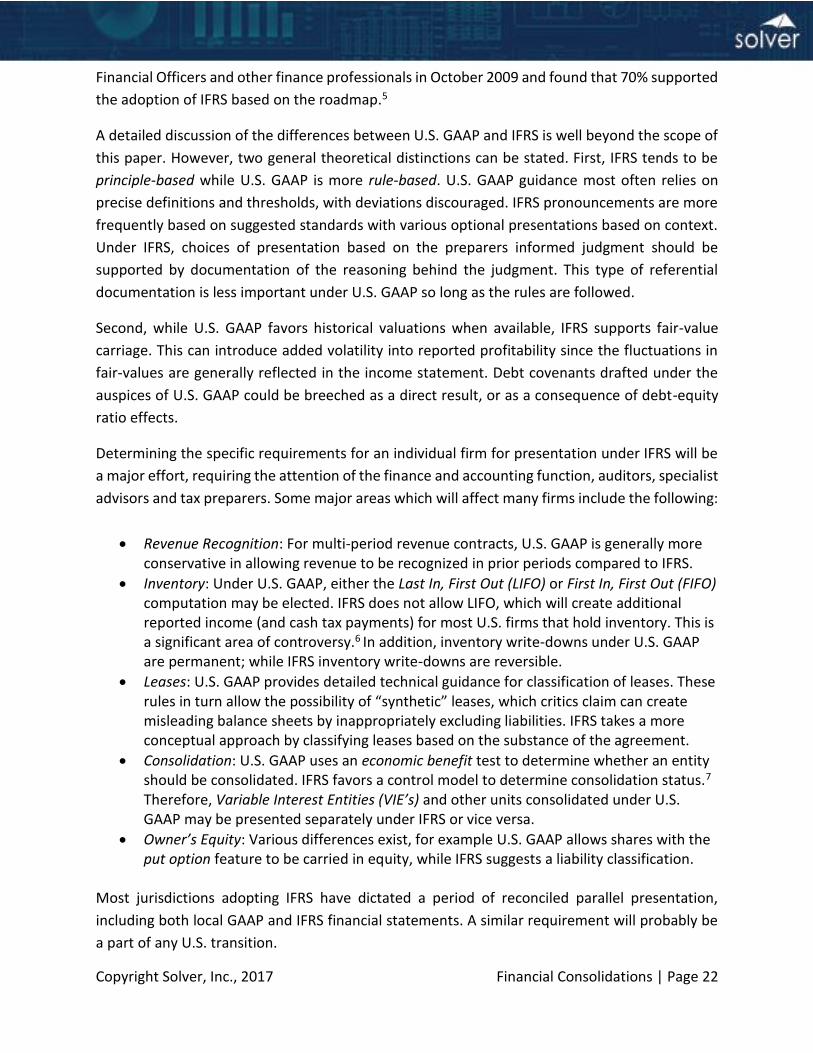
in the U.S. is being driven as well by the Securities and Exchange Commission (SEC). In 2008 the
SEC published a “roadmap” to IFRS adoption with phased implementation culminating in
registered companies reporting under IFRS by 2014:
The SEC is currently reviewing letters received from interested parties during the public comment
period. Further SEC action is anticipated in early 2010.4 Deloitte and Touche surveyed 150 Chief
Copyright Solver, Inc., 2017 Financial Consolidations | Page 22
Financial Officers and other finance professionals in October 2009 and found that 70% supported
the adoption of IFRS based on the roadmap.5
A detailed discussion of the differences between U.S. GAAP and IFRS is well beyond the scope of
this paper. However, two general theoretical distinctions can be stated. First, IFRS tends to be
principle-based while U.S. GAAP is more rule-based. U.S. GAAP guidance most often relies on
precise definitions and thresholds, with deviations discouraged. IFRS pronouncements are more
frequently based on suggested standards with various optional presentations based on context.
Under IFRS, choices of presentation based on the preparers informed judgment should be
supported by documentation of the reasoning behind the judgment. This type of referential
documentation is less important under U.S. GAAP so long as the rules are followed.
Second, while U.S. GAAP favors historical valuations when available, IFRS supports fair-value
carriage. This can introduce added volatility into reported profitability since the fluctuations in
fair-values are generally reflected in the income statement. Debt covenants drafted under the
auspices of U.S. GAAP could be breeched as a direct result, or as a consequence of debt-equity
ratio effects.
Determining the specific requirements for an individual firm for presentation under IFRS will be
a major effort, requiring the attention of the finance and accounting function, auditors, specialist
advisors and tax preparers. Some major areas which will affect many firms include the following:
Revenue Recognition: For multi-period revenue contracts, U.S. GAAP is generally more conservative in allowing revenue to be recognized in prior periods compared to IFRS.
Inventory: Under U.S. GAAP, either the Last In, First Out (LIFO) or First In, First Out (FIFO) computation may be elected. IFRS does not allow LIFO, which will create additional reported income (and cash tax payments) for most U.S. firms that hold inventory. This is a significant area of controversy.6 In addition, inventory write-downs under U.S. GAAP are permanent; while IFRS inventory write-downs are reversible.
Leases: U.S. GAAP provides detailed technical guidance for classification of leases. These rules in turn allow the possibility of “synthetic” leases, which critics claim can create misleading balance sheets by inappropriately excluding liabilities. IFRS takes a more conceptual approach by classifying leases based on the substance of the agreement.
Consolidation: U.S. GAAP uses an economic benefit test to determine whether an entity should be consolidated. IFRS favors a control model to determine consolidation status.7 Therefore, Variable Interest Entities (VIE’s) and other units consolidated under U.S. GAAP may be presented separately under IFRS or vice versa.
Owner’s Equity: Various differences exist, for example U.S. GAAP allows shares with the put option feature to be carried in equity, while IFRS suggests a liability classification.
Most jurisdictions adopting IFRS have dictated a period of reconciled parallel presentation,
including both local GAAP and IFRS financial statements. A similar requirement will probably be
a part of any U.S. transition.
Copyright Solver, Inc., 2017 Financial Consolidations | Page 23
IFRS Presentation as a Reporting Task
Generally speaking, IFRS presentation – or GAAP presentation for an entity whose books of
original entry are maintained in IFRS – is primarily a financial reporting challenge. Typically, the
books of original entry are maintained persistently using the local GAAP methods with
adjustments performed to produce IFRS statements. Eventually, when the requirements for IFRS
presentation have been completely digested and the necessity for comparative books has
passed, then the books of original entry are converted to IFRS and the adjustments are
discontinued. During the “dual book” period, reconciling reports are often a crucial requirement.
Three predominant methods are used to maintain parallel books:
1. Spreadsheet-based models,
2. Enterprise Resource Planning (ERP) systems with support for multiple financial ledgers
3. Dedicated financial reporting systems.
The first method, spreadsheet-based solutions, will tend to rapidly break down under the number
of adjustments needed. At a recent conference panel a consultant recalled a client who
discovered over 500 spreadsheets were required each period to produce IFRS financial
statements. Auditing and maintaining links between that many worksheets was quickly deemed
impractical for a critical function.8
The second method, multiple ledgers in the firm’s ERP systems, is a more viable option since all
entries are maintained within the system database; however, not all ERP systems include this
feature. An ERP system’s ability to produce complex rules-based entries in a secondary ledger
based on data from the primary ledger is an important consideration when evaluating this
method. Also, the capacity of the ERP’s reporting module to flexibly address both ledgers
simultaneously is important for reconciliation and comparative reports. This method may also be
impractical if not all business entities use the same ERP system.
The final method, the use of dedicated financial reporting software, will often provide the best
results. These systems are generally designed to provide flexible presentations based on an
optimized financial database. Thus these systems have the ability to maintain and address the
various adjustments required to present financial results based on multiple accounting
standards. Additionally, these products typically allow creation of forms which include data from
the base accounting methodology as well as input from users. This capability can both streamline
and standardize the adjustments required for the presentation of financial statements under the
alternative policies. However, the cost for this added functionality is that transactions in the ERP
system must be loaded into the reporting package’s database.
Although they are beyond the scope of this paper, other business functions in addition to
accounting and financial reporting will be affected by any transition between accounting
methodologies. For example, compliance systems based on superseded rules will require
Copyright Solver, Inc., 2017 Financial Consolidations | Page 24
adjustment or complete replacement. For example, consider compliance testing for leases. If a
system is based on definite specifications used with U.S. GAAP “bright line” rules, and these rules
are replaced by conceptual principles under IFRS, significant revisions will be needed.9 Many
business function revisions will require support from information technology staff, so always
consider the potential impact these revisions will have on other IT projects as well.
Examples of IFRS Presentation Using BI360
BI360 is a corporate performance management suite well suited to producing financial
statements in multiple accounting standards.9 BI360’s relevant features include:
Choice between cloud and on-premise deployment based on what fits the corporate consolidation process the best.
An Excel-based form and report writer which allows flexible implementation of required business logic.
Web portal for easy access and management of the overall BI360 application.
A dedicated relational Data Warehouse hosted on Microsoft’s SQL Server database. The Data Warehouse is preconfigured with separate modules including the general ledger.
A dimensional storage model for entries to the Data Warehouse fact table, including an unlimited number of transaction categories, which allows for different ways of classifying data. In addition to the preconfigured dimensions, the Data Warehouse supports up to 40 user-defined dimensions as well.
Automated currency and consolidation technology.
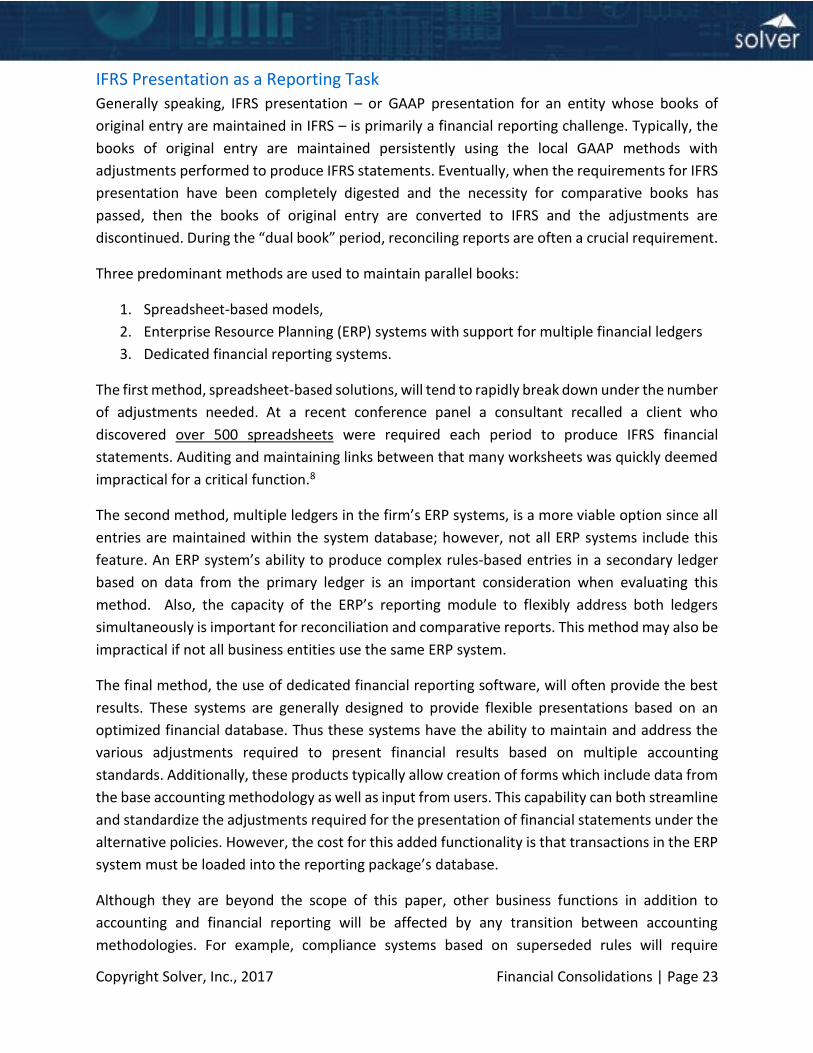
In the following example, a hypothetical organization requires two types of recurring
adjustments each period to restate U.S. GAAP results to IFRS. First, revenue recognition must be
adjusted to reflect the different principles under IFRS. This adjustment will affect a sales revenue
account, with an automated offsetting entry affecting accounts receivable. Second, inventory
must be adjusted to reflect differences between the two standards. This adjustment will affect a
specific inventory account, with the offsetting entry affecting cost of goods sold. Each adjustment
must include a supporting note to explain the reason for the adjustment. Here is an example of
a form which accomplishes these requirements, as it would appear to the user:
Copyright Solver, Inc., 2017 Financial Consolidations | Page 25
This form has been designed using a category dimension code “IFRS” for these adjustments. In
the example above, the form has been executed for company “Corporate US” for January 2011.
The adjustments entered will be consistently booked across the firm and across periods since the
same form definition is executed for any combination of entity and period. For the example
above the effective journal entries are:
Debit Entry Credit Entry
Accounts Receivable
5,000 Sales 5,000
Inventory
60,000 Cost of Sales 60,000
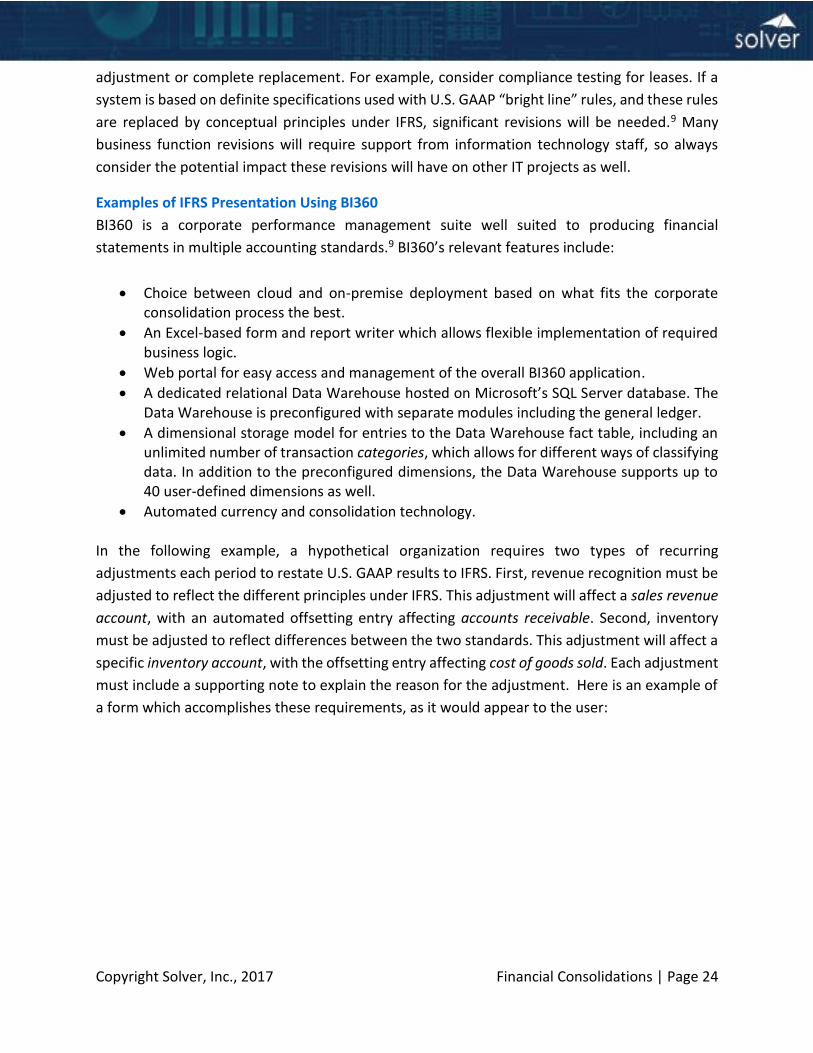
It is straightforward to write a trial balance format reconciling report that isolates these
adjustments as they have been entered in a specific transaction category (IFRS):
Copyright Solver, Inc., 2017 Financial Consolidations | Page 26
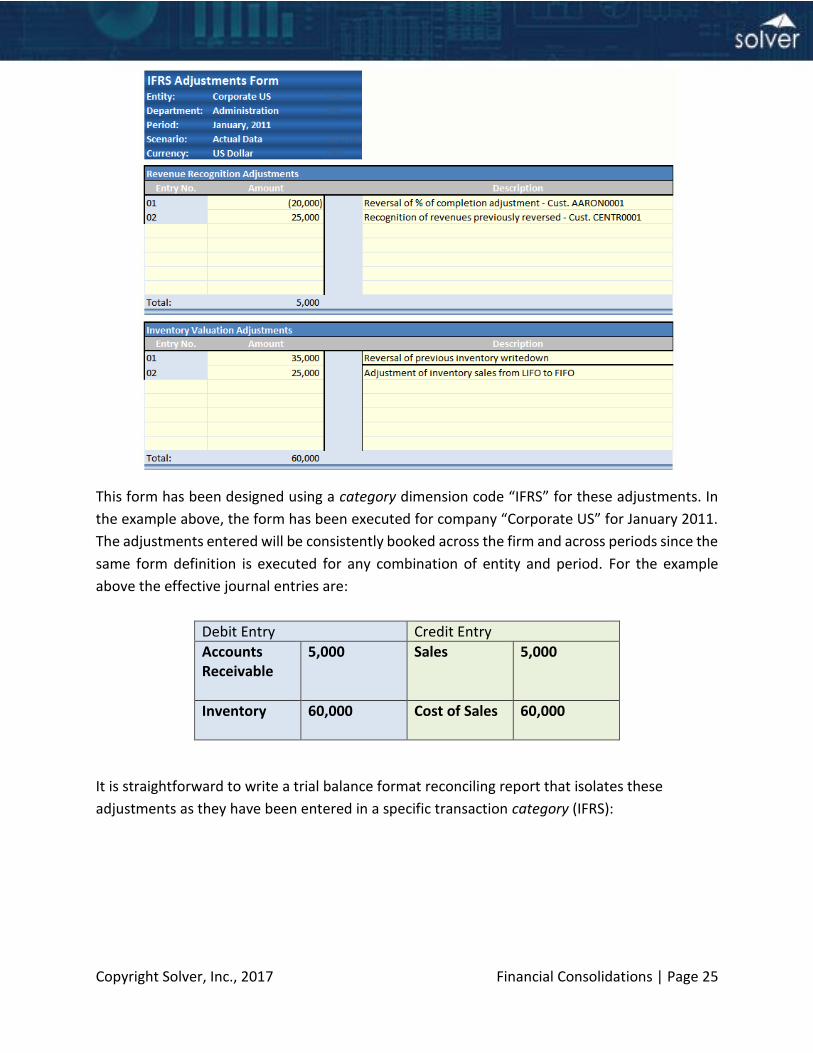
It is equally straightforward to write a consolidating statement of operations that separates these
adjustments into a separate column (in this example no USD-translated transactions have been
generated in either the Asia or EMEA entities, hence those columns have no amounts):
Copyright Solver, Inc., 2017 Financial Consolidations | Page 27
BI360 also allows entries in the database to be associated with user-defined dimensions. These
dimensions are available to identify transactions in the database in any way needed. In our
example of the IFRS adjustments form, a user-defined dimension has been used to specify the
revenue adjustments separately from the inventory adjustments. This simplifies definition of a
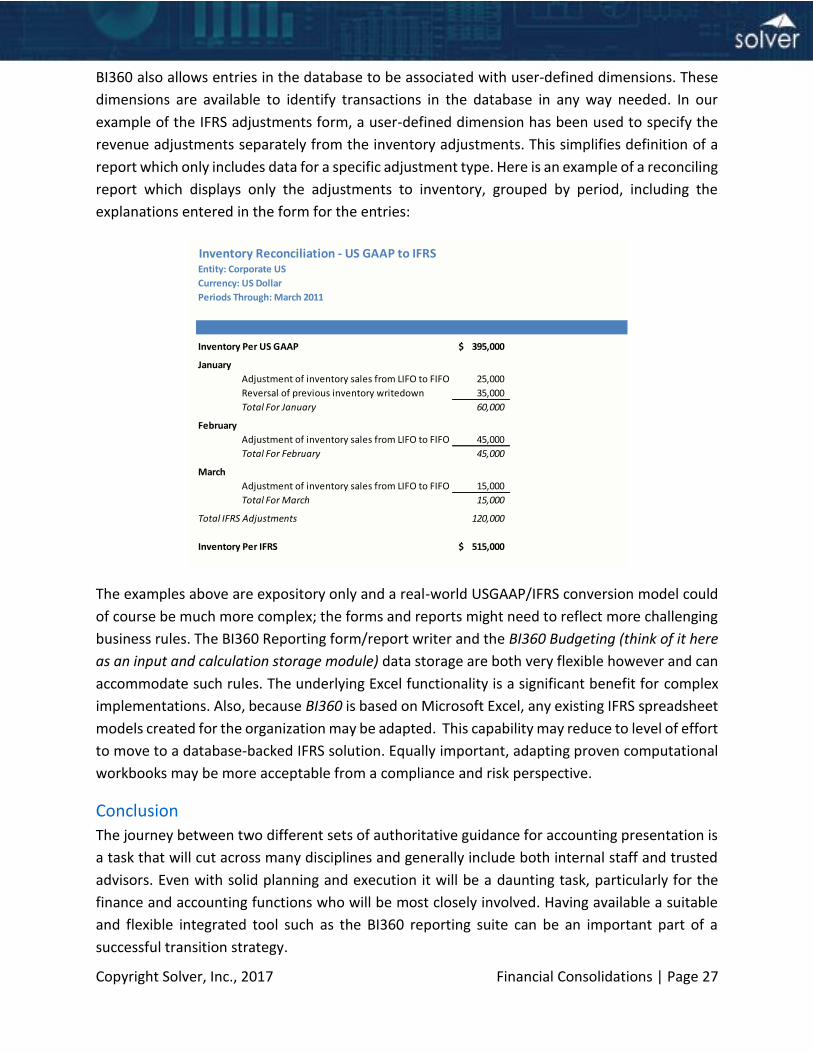
report which only includes data for a specific adjustment type. Here is an example of a reconciling
report which displays only the adjustments to inventory, grouped by period, including the
explanations entered in the form for the entries:
The examples above are expository only and a real-world USGAAP/IFRS conversion model could
of course be much more complex; the forms and reports might need to reflect more challenging
business rules. The BI360 Reporting form/report writer and the BI360 Budgeting (think of it here
as an input and calculation storage module) data storage are both very flexible however and can
accommodate such rules. The underlying Excel functionality is a significant benefit for complex
implementations. Also, because BI360 is based on Microsoft Excel, any existing IFRS spreadsheet
models created for the organization may be adapted. This capability may reduce to level of effort
to move to a database-backed IFRS solution. Equally important, adapting proven computational
workbooks may be more acceptable from a compliance and risk perspective.
Conclusion
The journey between two different sets of authoritative guidance for accounting presentation is
a task that will cut across many disciplines and generally include both internal staff and trusted
advisors. Even with solid planning and execution it will be a daunting task, particularly for the
finance and accounting functions who will be most closely involved. Having available a suitable
and flexible integrated tool such as the BI360 reporting suite can be an important part of a
successful transition strategy.
Currency: US Dollar
Periods Through: March 2011
Inventory Per US GAAP 395,000$
January
Adjustment of inventory sales from LIFO to FIFO 25,000
Reversal of previous inventory writedown 35,000
Total For January 60,000
February
Adjustment of inventory sales from LIFO to FIFO 45,000
Total For February 45,000
March
Adjustment of inventory sales from LIFO to FIFO 15,000
Total For March 15,000
Total IFRS Adjustments 120,000
Inventory Per IFRS 515,000$
Inventory Reconciliation - US GAAP to IFRS Entity: Corporate US
Copyright Solver, Inc., 2017 Financial Consolidations | Page 28
Citations
1 IASB Website. <http://www.iasb.org/The+organisation/IASCF+and+IASB.htm>, viewed
01/20/2010.
2 IASB Website. <http://www.iasb.org/Use+around+the+world/Use+around+the+world.htm>,
viewed 01/21/2010.
3 EU Implementation Of IFRS And The Fair Value Directive. Institute of Chartered Accountants
in English and Wales (October 2007)
4 Securities and Exchange Commission, “Roadmap For The Potential Use Of Financial
Statements Prepared In Accordance With International Financial Reporting Standards By U.S.
Issuers.” (November 14, 2008)
Johnson, Sarah. “IFRS: No Longer If, but When.” CFO 8 Feb., 2008
<http://www.cfo.com/article.cfm/14460972>, viewed 01/18/2010
Leone, Marie. “SEC: No IFRS Yet.” CFO 9 Dec., 2009
<http://www.cfo.com/article.cfm/14460972>, viewed 01/20/2010
Anonymous. “SEC Action on IFRS Could Come Early in 2010.” Journal of Accountancy (website)
9 Dec., 2009 <http://www.journalofaccountancy.com/Web/20092412.htm> viewed
01/21/2010
5 Bloom, Robert and Cenker, William J. “The Death of LIFO?” Journal of Accountancy January
2009 <http://www.journalofaccountancy.com/Issues/2009/Jan/DeathOfLIFO.htm> viewed
01/23/2010
6 WebCPA Staff. “Companies Want SEC to Approve IFRS Roadmap.”
<http://www.webcpa.com/news/Companies-Want-SEC-Approve-IFRS-Roadmap-51991-1.html>
viewed 01/23/2010
7 IFRS Accounting Website. “Combinations.” <http://www.ifrsaccounting.com/ifrs-
combinations.html> viewed 01/22/2010
8 “IFRS COMPLIANCE IN CANADA: Managing the Transition to 2011.” The Economist Group;
September 23rd, 2008; Toronto, Canada.
9 Kim, Jim. “Debate: The impact of IFRS on Sarbanes-Oxley.” FierceComplianceIT Website
<http://www.fiercecomplianceit.com/story/debate-impact-ifrs-sarbanes-oxley/2008-07-03>
viewed 01/20/2010.
Copyright Solver, Inc., 2017 Financial Consolidations | Page 29
Appendix 2 - Currency
Introduction
This Appendix mainly focuses on BI360 users deploying the BI360 Data Warehouse(DW). It will
also briefly cover currency conversion for companies only using BI360 as a live report writer on
their ERP database.
Users of BI360 DW requiring multiple currency reporting are supported in two fashions:
1) There is a complete currency translation process built into the BI360 Data Warehouse
user interface. This translation requires some initial setup and then it will use business
rules to automatically convert each foreign currency. The process generates new
transactions in the target currency and both original- and these converted transactions
can be used in reports.
2) For very simple currency needs, since the BI360 DW currency tables are exposed to the
BI360 report writer, reports can bring the native currency transaction data and the FX
rates into a report then perform the currency conversion in the report itself using Excel
formulas. See the end of this Appendix for more information.
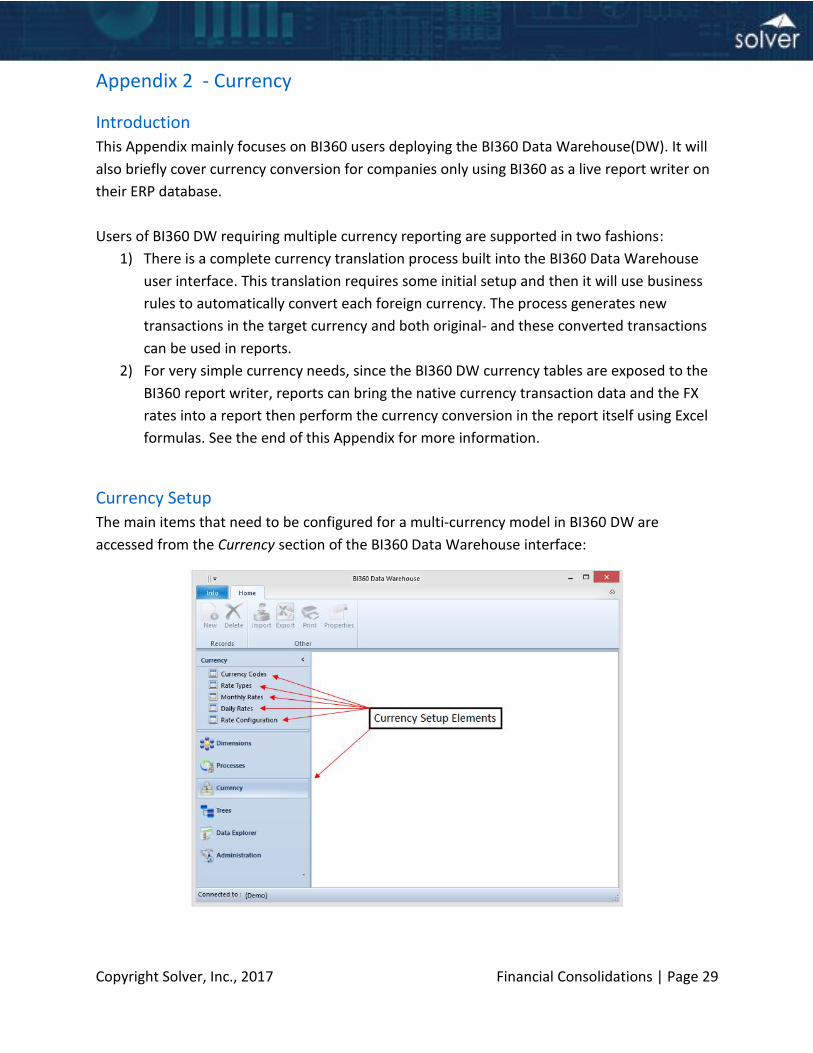
Currency Setup
The main items that need to be configured for a multi-currency model in BI360 DW are
accessed from the Currency section of the BI360 Data Warehouse interface:
Copyright Solver, Inc., 2017 Financial Consolidations | Page 30
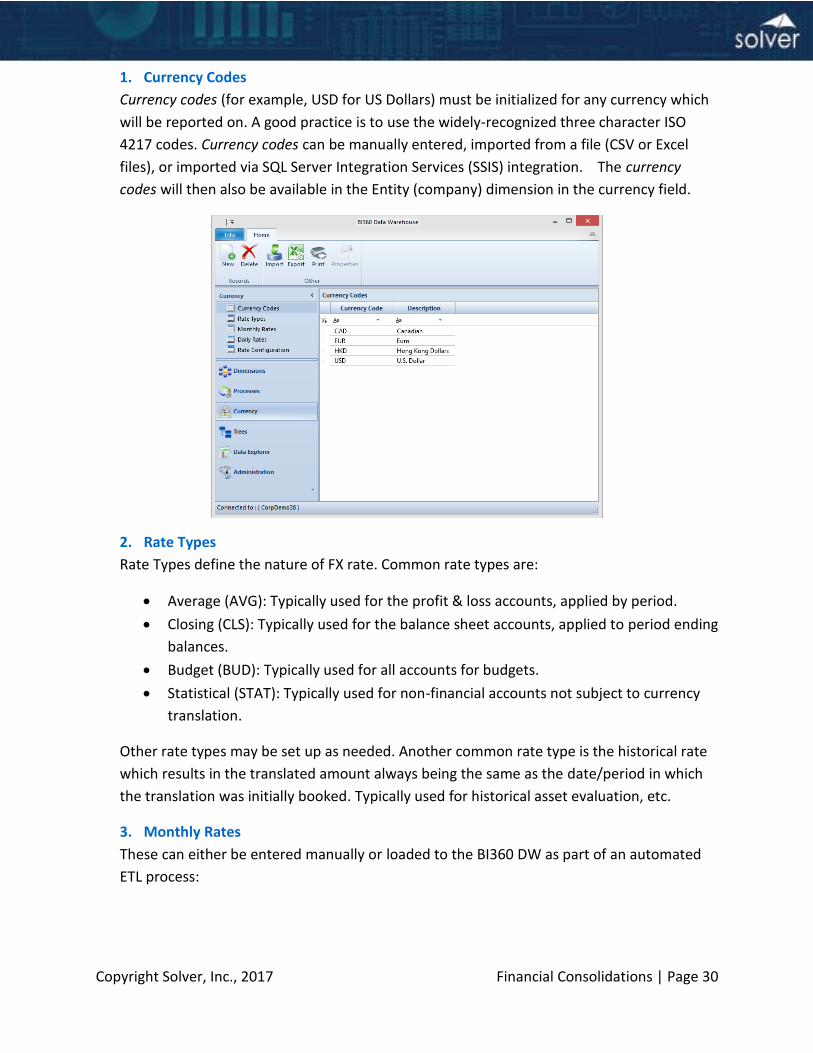
1. Currency Codes
Currency codes (for example, USD for US Dollars) must be initialized for any currency which
will be reported on. A good practice is to use the widely-recognized three character ISO
4217 codes. Currency codes can be manually entered, imported from a file (CSV or Excel
files), or imported via SQL Server Integration Services (SSIS) integration. The currency
codes will then also be available in the Entity (company) dimension in the currency field.
2. Rate Types
Rate Types define the nature of FX rate. Common rate types are:
Average (AVG): Typically used for the profit & loss accounts, applied by period.
Closing (CLS): Typically used for the balance sheet accounts, applied to period ending
balances.
Budget (BUD): Typically used for all accounts for budgets.
Statistical (STAT): Typically used for non-financial accounts not subject to currency
translation.
Other rate types may be set up as needed. Another common rate type is the historical rate
which results in the translated amount always being the same as the date/period in which
the translation was initially booked. Typically used for historical asset evaluation, etc.
3. Monthly Rates
These can either be entered manually or loaded to the BI360 DW as part of an automated
ETL process:
Copyright Solver, Inc., 2017 Financial Consolidations | Page 31
These are the rates which are invoked when the Currency Conversion process is executed (see “Currency Conversion Business Rule” section below).
4. Daily Rates
Daily spot rates can be imported into the warehouse in the Daily FX Rate tables. The source
for the daily rates is typically the ERP system or other external database. Daily FX Rates can
be directly imported or imported via SSIS integration. Daily rates cannot be manually
entered or adjusted. Should you choose to load daily rates, BI360 can also automatically
convert these to monthly rates.
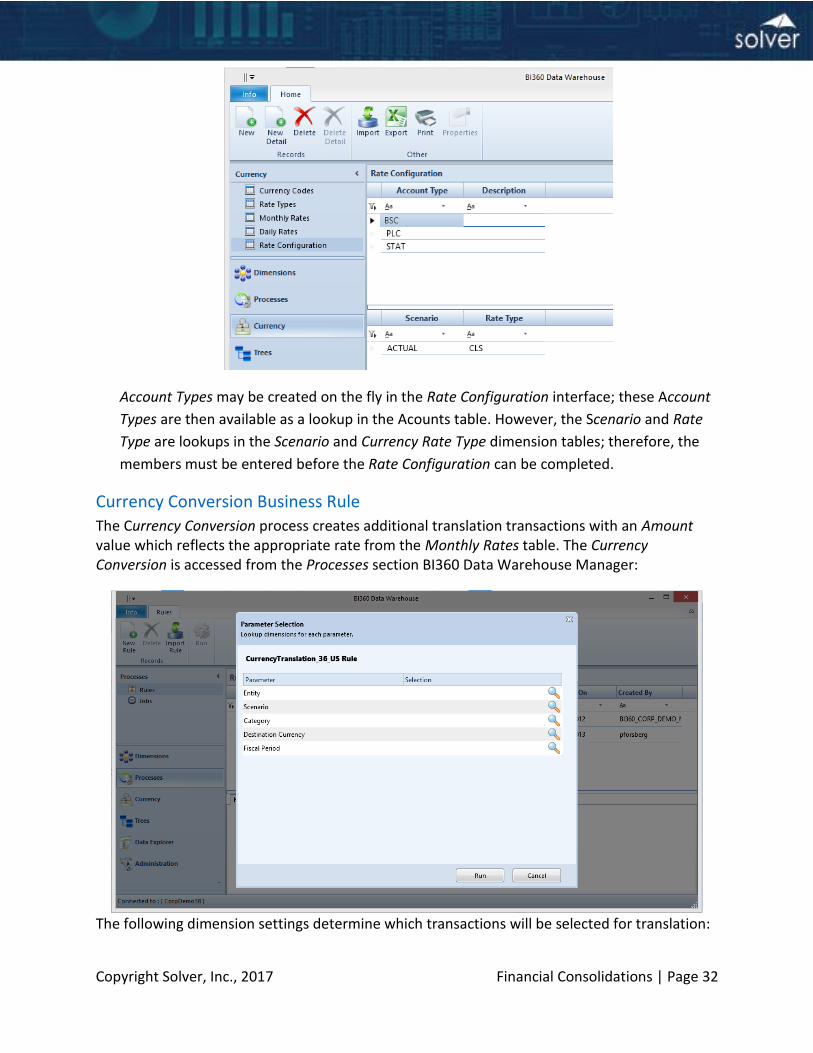
5. Rate Configuration
Rate Configurations are used to determine which Monthly FX Rates are applied to which
transactions when the Currency Conversion Business Rule is executed. The Rate
Configuration maps the following fields:
Account Type (i.e., balance sheet).
Scenario (i.e., actual or budget).
Rate Type (i.e., closing rate).
This mapping table controls the calculations used to generate the translated currency
transactions (see the next section “Currency Conversion Business Rule”).
Copyright Solver, Inc., 2017 Financial Consolidations | Page 32
Account Types may be created on the fly in the Rate Configuration interface; these Account
Types are then available as a lookup in the Acounts table. However, the Scenario and Rate
Type are lookups in the Scenario and Currency Rate Type dimension tables; therefore, the
members must be entered before the Rate Configuration can be completed.
Currency Conversion Business Rule
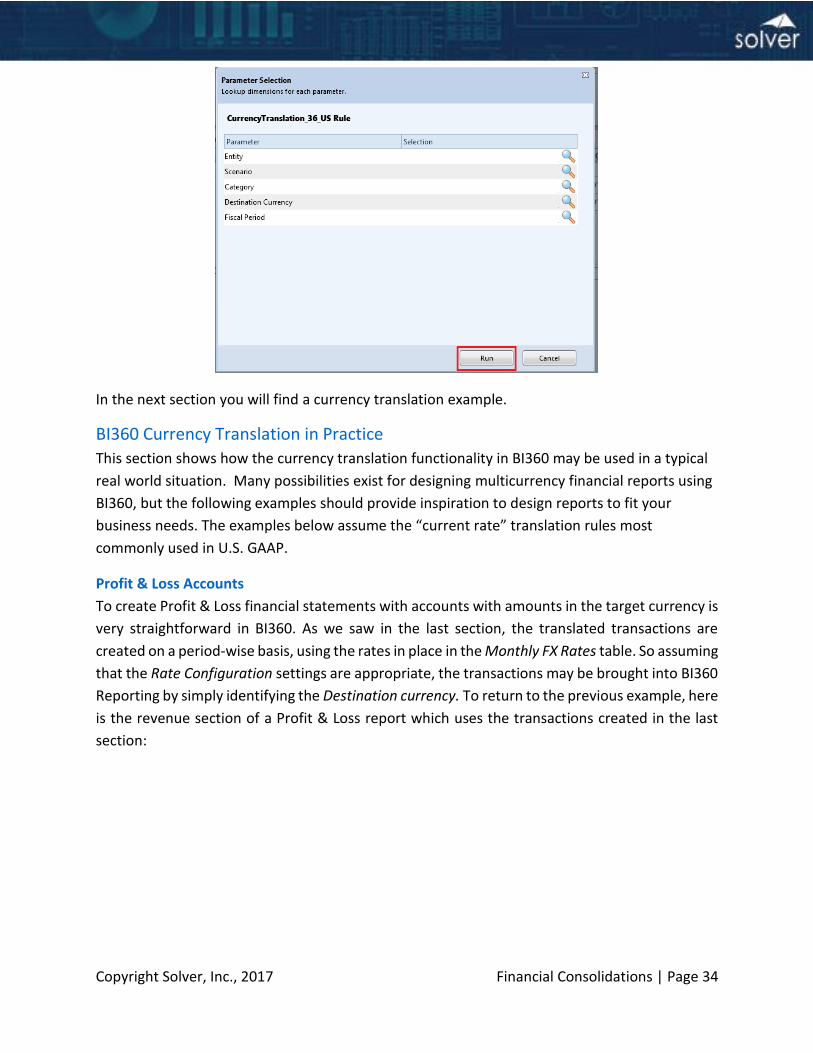
The Currency Conversion process creates additional translation transactions with an Amount value which reflects the appropriate rate from the Monthly Rates table. The Currency Conversion is accessed from the Processes section BI360 Data Warehouse Manager:
The following dimension settings determine which transactions will be selected for translation:
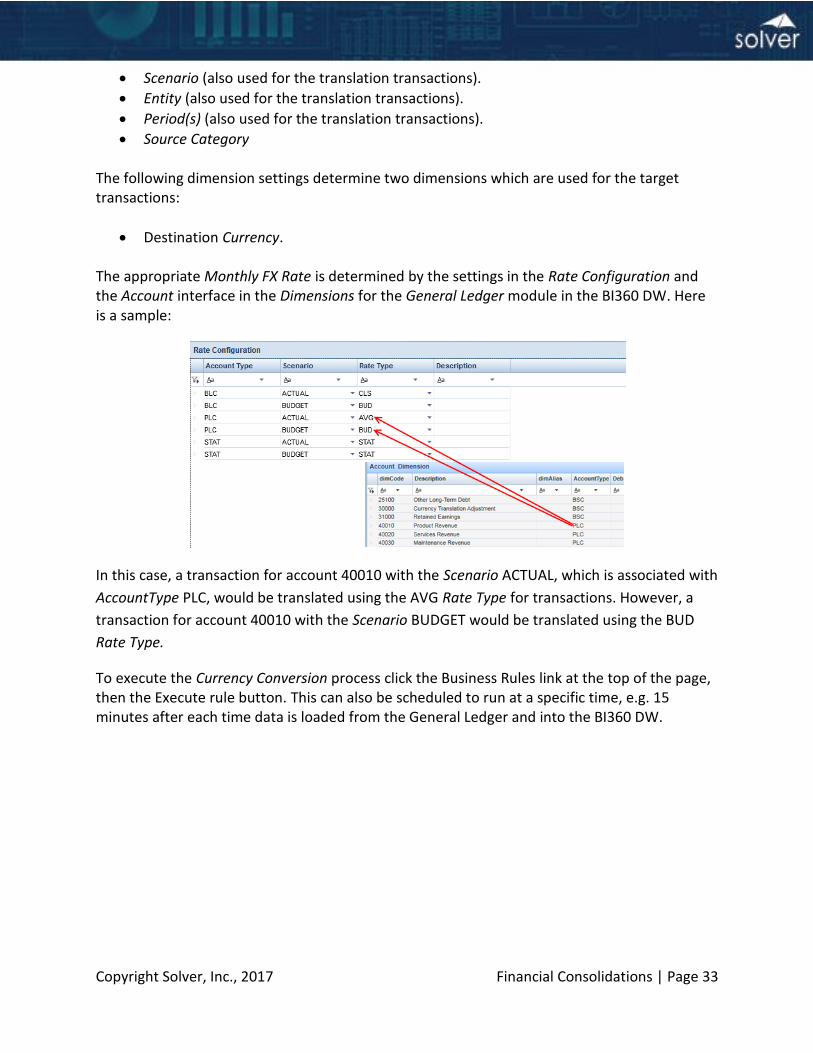
Copyright Solver, Inc., 2017 Financial Consolidations | Page 33
Scenario (also used for the translation transactions).
Entity (also used for the translation transactions).
Period(s) (also used for the translation transactions).
Source Category
The following dimension settings determine two dimensions which are used for the target transactions:
Destination Currency. The appropriate Monthly FX Rate is determined by the settings in the Rate Configuration and the Account interface in the Dimensions for the General Ledger module in the BI360 DW. Here is a sample:
In this case, a transaction for account 40010 with the Scenario ACTUAL, which is associated with
AccountType PLC, would be translated using the AVG Rate Type for transactions. However, a
transaction for account 40010 with the Scenario BUDGET would be translated using the BUD
Rate Type.
To execute the Currency Conversion process click the Business Rules link at the top of the page, then the Execute rule button. This can also be scheduled to run at a specific time, e.g. 15 minutes after each time data is loaded from the General Ledger and into the BI360 DW.
Copyright Solver, Inc., 2017 Financial Consolidations | Page 34
In the next section you will find a currency translation example.
BI360 Currency Translation in Practice
This section shows how the currency translation functionality in BI360 may be used in a typical
real world situation. Many possibilities exist for designing multicurrency financial reports using
BI360, but the following examples should provide inspiration to design reports to fit your
business needs. The examples below assume the “current rate” translation rules most
commonly used in U.S. GAAP.
Profit & Loss Accounts
To create Profit & Loss financial statements with accounts with amounts in the target currency is
very straightforward in BI360. As we saw in the last section, the translated transactions are
created on a period-wise basis, using the rates in place in the Monthly FX Rates table. So assuming
that the Rate Configuration settings are appropriate, the transactions may be brought into BI360
Reporting by simply identifying the Destination currency. To return to the previous example, here
is the revenue section of a Profit & Loss report which uses the transactions created in the last
section:
Copyright Solver, Inc., 2017 Financial Consolidations | Page 35
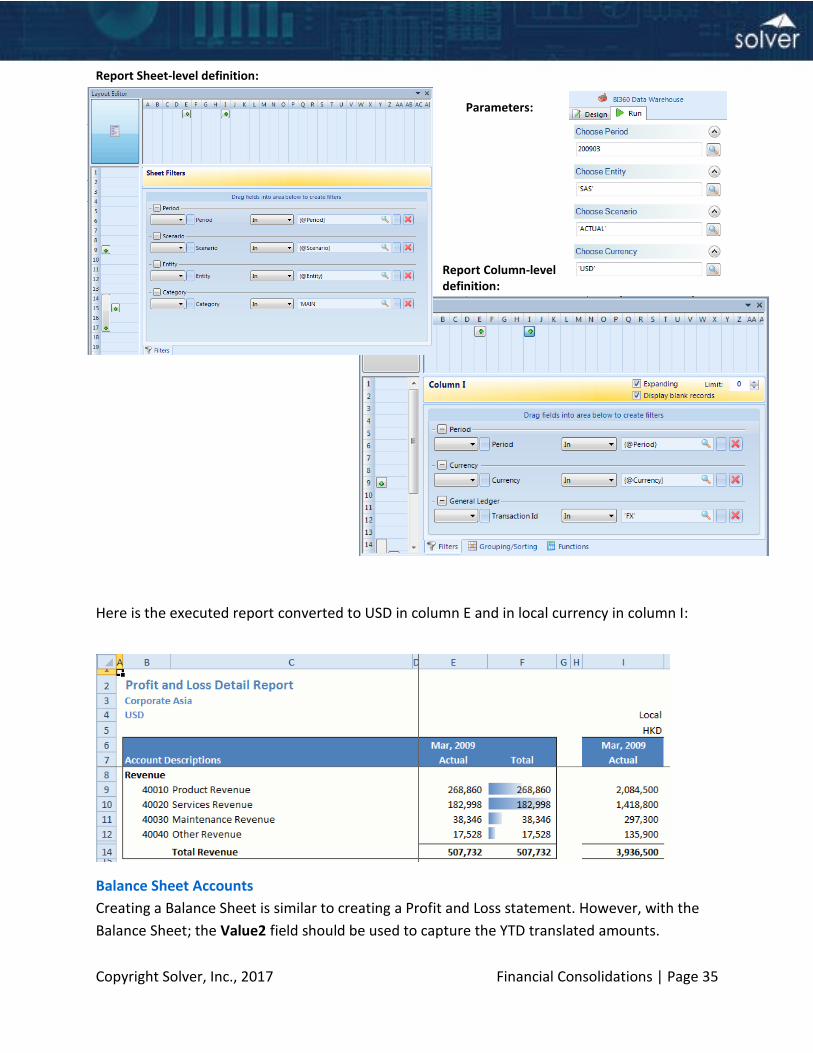
Report Sheet-level definition:
Parameters:
Report Column-level definition:
Here is the executed report converted to USD in column E and in local currency in column I:
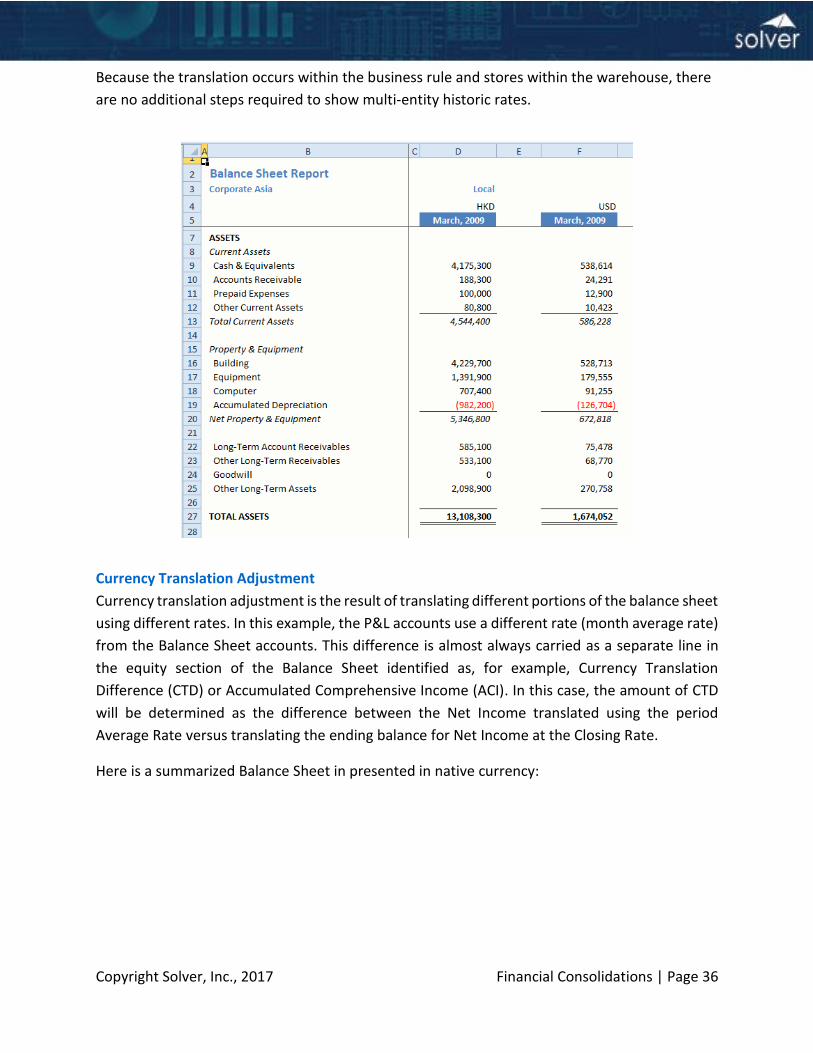
Balance Sheet Accounts
Creating a Balance Sheet is similar to creating a Profit and Loss statement. However, with the
Balance Sheet; the Value2 field should be used to capture the YTD translated amounts.
Copyright Solver, Inc., 2017 Financial Consolidations | Page 36
Because the translation occurs within the business rule and stores within the warehouse, there
are no additional steps required to show multi-entity historic rates.
Currency Translation Adjustment
Currency translation adjustment is the result of translating different portions of the balance sheet
using different rates. In this example, the P&L accounts use a different rate (month average rate)
from the Balance Sheet accounts. This difference is almost always carried as a separate line in
the equity section of the Balance Sheet identified as, for example, Currency Translation
Difference (CTD) or Accumulated Comprehensive Income (ACI). In this case, the amount of CTD
will be determined as the difference between the Net Income translated using the period
Average Rate versus translating the ending balance for Net Income at the Closing Rate.
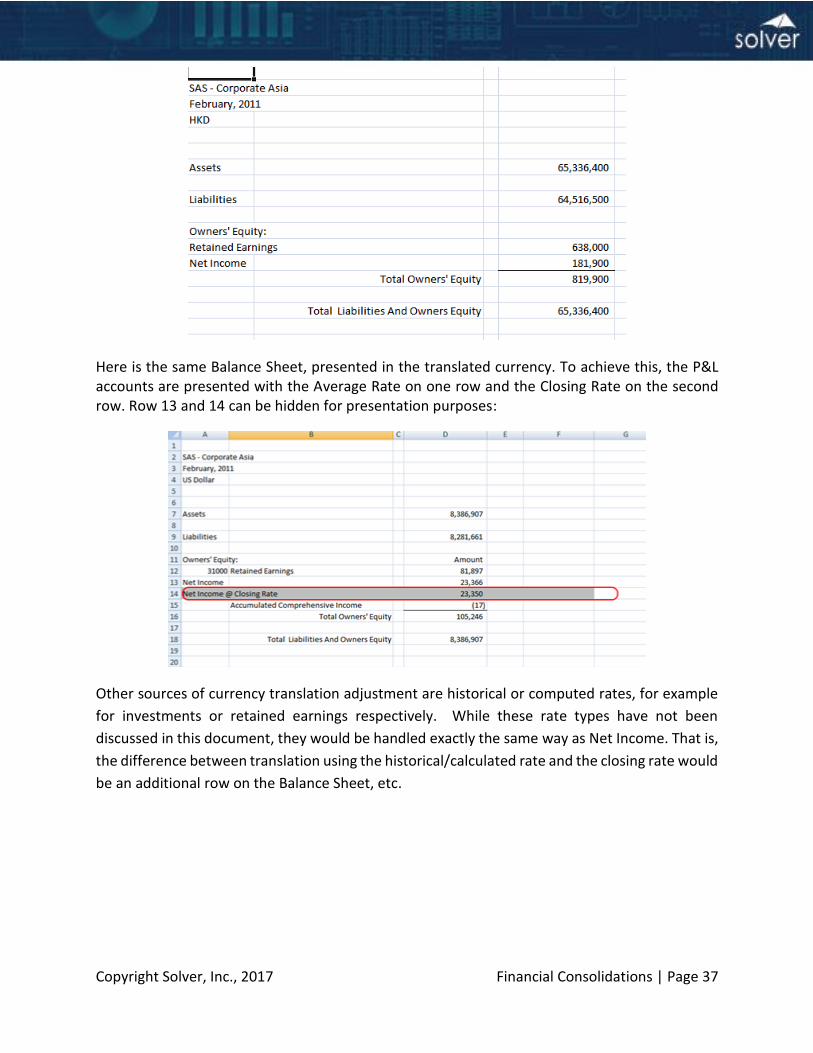
Here is a summarized Balance Sheet in presented in native currency:
Copyright Solver, Inc., 2017 Financial Consolidations | Page 37
Here is the same Balance Sheet, presented in the translated currency. To achieve this, the P&L accounts are presented with the Average Rate on one row and the Closing Rate on the second row. Row 13 and 14 can be hidden for presentation purposes:
Other sources of currency translation adjustment are historical or computed rates, for example
for investments or retained earnings respectively. While these rate types have not been
discussed in this document, they would be handled exactly the same way as Net Income. That is,
the difference between translation using the historical/calculated rate and the closing rate would
be an additional row on the Balance Sheet, etc.
Copyright Solver, Inc., 2017 Financial Consolidations | Page 38
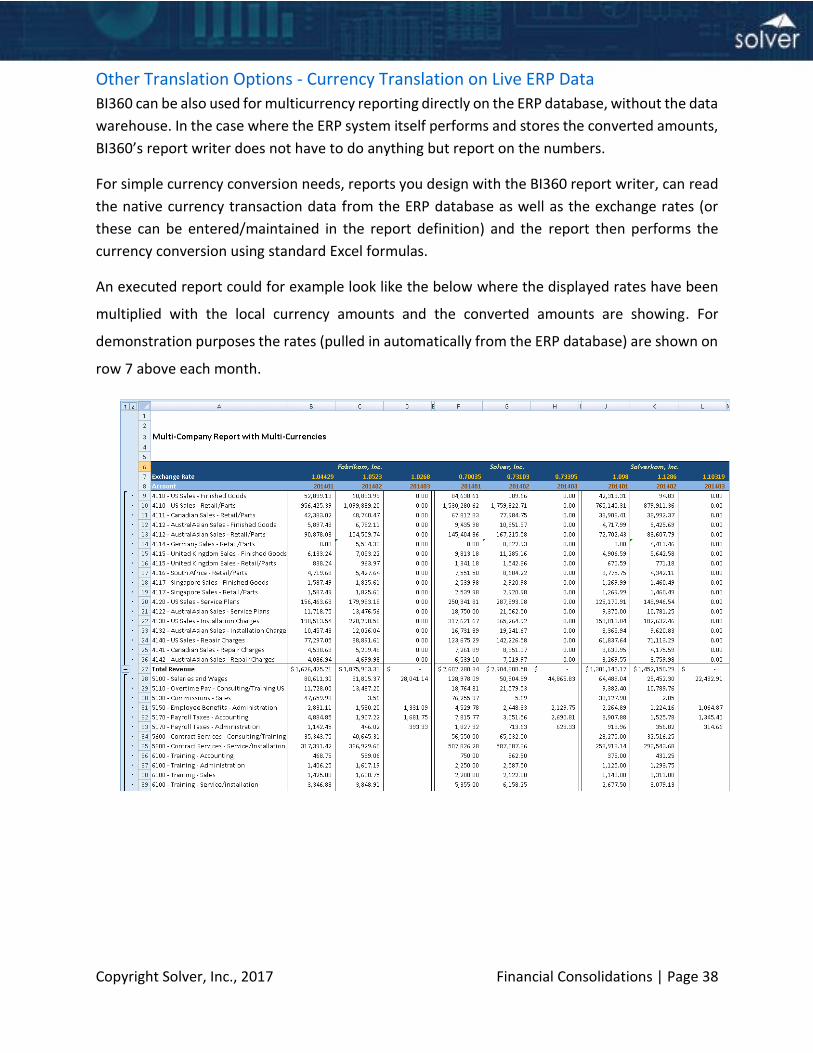
Other Translation Options - Currency Translation on Live ERP Data
BI360 can be also used for multicurrency reporting directly on the ERP database, without the data
warehouse. In the case where the ERP system itself performs and stores the converted amounts,
BI360’s report writer does not have to do anything but report on the numbers.
For simple currency conversion needs, reports you design with the BI360 report writer, can read
the native currency transaction data from the ERP database as well as the exchange rates (or
these can be entered/maintained in the report definition) and the report then performs the
currency conversion using standard Excel formulas.
An executed report could for example look like the below where the displayed rates have been
multiplied with the local currency amounts and the converted amounts are showing. For
demonstration purposes the rates (pulled in automatically from the ERP database) are shown on
row 7 above each month.
Copyright Solver, Inc., 2017 Financial Consolidations | Page 39
Appendix 3 - Sarbanes Oxley
Summary
BI360 provides a rigorous platform for the consolidation of financial statement information
originating from one or multiple ERP sources. BI360 relies on a multidimensional database model
to identify all reportable general ledger entries, based on Microsoft SQL Server (“MS SQL”) on-
premise and Microsoft Azure SQL in the cloud. BI360 separates the business logic for
consolidation models from the source data. Complete segregation is maintained between source
data, which cannot be overwritten after import, consolidation entries, and the consolidation
model, thus providing a transparent audit trail from the subsidiary books through final
consolidation. Additional strengths of BI360 include:
User access rights definable with complete granularity, enforced by the SQL Server database engine and the leading Microsoft Active Directory Standard.
Entries are explicitly identifiable by user and date/time.
Model specifications saved in SQL Server database tables as well as the data, promoting data integrity by allowing for a complete, seamless backup/restore regimen using standard technologies.
Explicit currency conversion rules definable by business unit and reporting period.
The advantages of BI360 as a tool for complex financial statement consolidation are especially
evident when compared to manual spreadsheet-based consolidation routines.
MS SQL Server as Database
The foundation of BI360’s capabilities as a tool for flexible and secure consolidations is the
Microsoft SQL Server (MS SQL) database (and Azure SQL in the cloud). MS SQL provides a robust
platform for transaction storage, as well as state-of-the-art security control. (The method by
which BI360 takes advantage of the MS SQL security framework is described further in the Data
Integrity section below.) Both the consolidation logic and data reside in MS SQL, allowing
standard backup and restore procedures to ensure high availability. BI360 stamps all entries into
the MS SQL database with time/date and user identification to further solidify the audit trail. The
date and user that created a transaction as well as date and user that changed a transaction is
tracked on every single transaction record and made available in audit reports.
Consolidation Model Specification in BI360
BI360 uses a multidimensional database model to store reportable transactions, with
transactions typically defined as trial balance level entries. Note: If desirable, journal Entry level
detail can also be loaded into the BI360 database. This technology results in a clear separation of
the individual entities’ data from the business logic required for the consolidation, and from the
resulting consolidated data. Transactions included in the BI360 database as reportable events are
Copyright Solver, Inc., 2017 Financial Consolidations | Page 40
identified on five mandatory dimensions:
Business Unit (“Entity”) Code
Reporting Period Code
Transaction Type (“Scenario”) Code. E.g.: Budget, Actual, etc.
Transaction (“Category”) Code. E.g. General Ledger entry, Consolidation Eliminating
entry, etc.
General Ledger Account Code.
Additionally, there are a large number of user defined dimensions and dimension attributes
which can be used (in addition to the five mandatory dimensions) to capture additional
characteristics of a transaction. Typical uses of user defined dimensions would be to capture
market segment, project data or product data.
Any consolidation model requires the use of all five mandatory dimensions to specify an entry to
be included; consolidating items are included whenever all five explicitly identifying codes within
the database are present (if user defined dimensions have been used to identify a transaction,
the appropriate values for these dimensions are required as well).
To reiterate: Since the business logic in consolidation models is defined and maintained
separately from any subsidiary data brought into the BI360 database, there results a transparent,
precisely delineated and auditable trail from the subsidiary data through to the final
consolidation.
Data and Model Integrity
Integrity of the data during the consolidation process begins with granular, precise control over
User Access Rights. BI360 password-restricts access to transactions, accounts and reports by
individual user or inherited Active Directory group membership. These restrictions are enforced
by the MS SQL database engine based on the security settings configured in BI360.
Integration of multiple data sources to be consolidated also protects data integrity. Subsidiary
entity data is integrated into the BI360 database either via direct data transfer (using SQL Server
Integration Services) or by manual upload. The data is locked once imported/uploaded, and
protected from subsequent modification; deletion of integrated or uploaded data may be
restricted subject to defined user access rules.
The integrity of the consolidation models, as well as the underlying data, is secured in BI360. The
business logic in the reports is only available to be altered by administrators/power users with
specific rights and a Report Designer license. Thus, the same access control and unified
backup/restore process which protect the data are available to secure the consolidation
framework as well.
Copyright Solver, Inc., 2017 Financial Consolidations | Page 41
BI360 Implementation of Currency Conversion
The data specification mechanism described above provides BI360 with a robust ability to apply
currency conversion rules in compliance with national or international generally acceptable
accounting principles. Moreover, different conversion rules may be defined and applied to the
same transaction, for example if native currency and consolidated currency statements, or
different levels of consolidation, are needed. The building blocks of currency conversion in BI360
are:
Currency identification specific to Business Units.
Translation rules specific to General Ledger Accounts.
Conversion rates specific to Reporting Period.
The default translation rules for a given Account may be overridden in specific consolidation
models. Taken together, these elements provide for both complete flexibility and a solid audit
trail in multiple currency environments.
Advantages Over Spreadsheet Based Consolidation
The strengths of BI360 as a tool for complex, multi-entity consolidations can be better
understood by comparison to consolidations based on manual spreadsheet models.
Audit Trail
Typically, data and business logic are combined in spreadsheet-based consolidation models.
Manipulations of the consolidation model can inadvertently affect the data, and vice-versa.
Attempts to prevent this possibility must rely on ad-hoc protection of ranges, which are
complicated and difficult to maintain. Moreover, these approaches are often poorly
documented, and thus tend to degrade over time. BI360, on the other hand, provides a rigorous,
auditable back trail to source data via an explicitly defined model.
Currency conversion with multiple international subsidiaries exemplifies the difficulties with
auditing spreadsheet-based consolidation models. A firm with multiple subsidiaries operating in
several currencies with different conversion rules for nominal and balance sheet accounts may
easily have thousands of cells with dependent relationships to periodic conversion rates. While
effectively tracing precedent and antecedent links on this scale is impractical, the currency
conversion regime in BI360 is based on transparent, explicit, data base-driven rules subject to
ready verification.
Access Control
It is usually difficult to audit who added data in complex consolidation spreadsheet models
maintained by multiple users. Spreadsheets are not by nature designed to support multiple users,
and access controls often represent a workaround at best. Because BI360 is designed as a multi-
user reporting environment, controls are executed using the same controls available in other
Copyright Solver, Inc., 2017 Financial Consolidations | Page 42
accounting software. In addition to enforced user access rights restrictions, BI360 stamps all
transactions in database with user identification. Thus, in the case where a control failure does
occur, the problem may be isolated and addressed in a timely fashion; a similar problem in a
spreadsheet model might be intractable due to an inability to pin down the source.
In summation, spreadsheet consolidation models rely on ad-hoc, difficult-to-audit controls and
relationships. BI360’s multidimensional, SQL Server-based model implements a control regime
using rules-based models which can minimize the control risks in complex consolidations.
Copyright Solver, Inc., 2017 Financial Consolidations | Page 43
Appendix 4 - Typical Steps in the Setup of a Consolidation Model The purpose of this appendix is to provide Power Users/Administrators with an idea of the major steps in setting up and managing BI360 for consolidations.
Note: This appendix is not meant as a “training manual” for any of the BI360 modules, but rather it is meant to describe specific activities related to Financial Consolidations. Before you begin, please download the BI360 Data Warehouse manual. Please visit support.solverusa.com for user manuals, white papers and training videos for the different BI360 modules.
Key BI360 Modules for Consolidations
For consolidation models, the key BI360 modules are:
1. BI360 Data Warehouse -Interface to manage database, transactions, rates, scripts, etc.
2. BI360 Reporting - For designing and running reports.
3. BI360 Budgeting - For input of data like adjustments, manual eliminations, comments, etc. This module is only needed if your consolidation process requires manual data entry or storing of data calculated in reports, such as allocations.
Getting ready to set up BI360 for Consolidations
Here are some tips for items you want to have ready before you start setting up BI360 as a Financial Consolidation solution:
1. Decide on Your Chart of Accounts:
a. Do you have a single chart of accounts for all companies?
b. Or…do you have different chart of accounts in your subsidiaries and require to map them into a Corporate (or “consolidated”) chart of accounts? If so, then prepare (e.g. in an Excel spreadsheet) the exact mapping of accounts from subsidiaries into Corporate chart of accounts you plan to use in BI360.
2. Review other Dimension Codes:
If you have other dimension codes that you do not consider to be part of your “Chart of Accounts” (such as departments, companies, etc.), will they remain the same in BI360 as in your ERP system or do they need mapping to “Corporate dimensions” used in your consolidation reports? If so, then prepare (e.g. in an Excel spreadsheet) the exact mapping of accounts from subsidiaries into Corporate chart of accounts you plan to use in BI360.
3. Document Your Consolidation Process:
a. Do you have CLEARLY defined consolidation process? If so, have this documented and ready.
Copyright Solver, Inc., 2017 Financial Consolidations | Page 44
b. If not, write it down in detail. If you plan to make changes to this process when you implement BI360, please describe your ideal process and consult with a BI360 expert if this process can be replicated in BI360 or it needs to be changed.
4. Data Integration:
a. Do you know exactly where your General Ledger data is coming from (database server and GL tables within that database) and if this data source(s) is available of direct integration to the BI360 Data Warehouse or it requires a file export/import process?
b. Will you only be bringing Monthly Trial Balances into the BI360 Data Warehouse or also GL Journal Entry level detail transactions?
5. User Security:
a. Make a list of all users that will be logging into BI360
b. For each user, write down what they will have access to. For example:
i. Which companies?
ii. Design reports or just run reports?
iii. Enter data (like manual eliminations)?
iv. Manage BI360 Data Warehouse (trees, exchange rates, elimination processes, etc.)?
6. Preparing for Report Design:
a. Make a list of all the reports required in your consolidation process
b. Group these reports into “must have” and “nice to have” reports
c. Gather examples or screenshots (or mock up in Excel) the desired report layouts
d. For each report layout, specify the business rule (i.e. account ranges or calculation) for each row in the report. Excel is excellent for this, if you already have your desired report layouts mocked up in Excel.
The purpose of the steps above is to make sure that, PRIOR TO THE BI360 IMPLEMENTATION START, you and your finance team have discussed, selected and documented the reports you need for consolidation in BI360, so that when you or your consultants start implementing BI360, you don’t have delays, confusion or re-work due to lack of good instructions/guidelines.
7. Write up a Project Plan
Copyright Solver, Inc., 2017 Financial Consolidations | Page 45
Depending on who is responsible for your BI360 implementation, write up a project plan so all involved personal know what the forthcoming activities are, who are responsible and related deadlines.
1. Configuring the BI360 Data Warehouse (BI360 DW)
Before you can put any type of data in the BI360 DW, you need to configure the DW. This is a completely non-technical task that you do using the BI360 DW user interface. In short, this is where you decide which DW modules to use (such as the GL module), which fiscal/calendar year concept to use for your consolidation, which dimensions to use in a module (i.e. in the GL module), which rate types (if you will use currency conversion) to use, etc. See the BI360 Data Warehouse user manual for more information.
2. Configuring the Consolidated Chart of Accounts
After BI360 has been installed, a typical first step in the actual implementation is to configure the Chart of Accounts in the BI360 Data Warehouse. There are several methodologies and options when it comes to the chart of accounts that companies use for consolidations (sometimes also referred to as the “Corporate chart of Accounts”):
Single chart of accounts used across all subsidiaries
This is the easiest situation. If all of your subsidiaries use the same chart of accounts, you will likely also want to use this same chart of accounts in the BI360 DW. In this case, you either include the chart of accounts as part of the automated data upload (ETL) to the BI360 DW or you import it from Excel or you enter it directly in the BI360 DW Manager interface. Different chart of accounts used by subsidiaries
If this is your situation, you have several options for how you want to handle this in BI360, all depending on what you think is easiest to manage by your staff:
a. Set up subsidiary to parent chart of accounts mapping inside the ETL tool i. Pros:
All mapping is in a single integration file/process. ii. Cons:
Most ETL tools (including Microsoft SSIS) are relatively technical and if there are new accounts in the subsidiaries that don’t fit any of the mapping rules that was set up in the ETL tool, then you need to have ETL expert update the ETL tool for you before data again can be correctly loaded to the BI360 DW
b. Set up subsidiary to parent chart of accounts mapping in Excel
With this option you set up a simple mapping schema in Excel (i.e. the first Excel column is the parent list of accounts and the next two columns list “From” and “To” accounts from the subsidiary. For example, in the parent column you list account 1010 and in the “From” and “To” columns you list account 00014 and 01150. This means that all accounts from 00014 to account 01150 should be aggregated into account
Copyright Solver, Inc., 2017 Financial Consolidations | Page 46
1010 in the BI360 DW and that will be the lowest level of detail for this item in your consolidated financial reports. The ETL tool (typically Microsoft SSIS) can then point to the Excel mapping file(s) as it loads a subsidiary’s GL data into the BI360 DW and handle the mapping as data is loaded into the BI360 DW.
i. Pros: Very easy for non-technical staff to manage account mapping since it is in
Excel. Also easy to push mapping process out to subsidiaries since they best know their own, local chart of accounts.
You keep the consolidated chart of accounts in the BI360 DW very simple and clean since you only will deal with one, single, chart of accounts in the DW, which also means that reports will be easier to write and faster than if you brought in all kinds of detailed accounts from each subsidiary.
ii. Cons: 1) You need to be aware of- and manage - the Excel files(s) so they are
always in the same location on the server and always updated.
c. Set up subsidiary to parent chart of accounts mapping inside the BI360 DW Manager
This means that you would load the chart of accounts from each of your subsidiaries into the BI360 DW, and manage the mapping inside BI360 using either attributes on the account dimension or Account Trees, where you drag drag and drop each subsidiary account up under each relevant consolidated account. In each case, whether you use account attributes or account trees for your mapping, you will be referring to these when you design BI360 reports. i. Pros:
2) Nice, non-technical interface (account attributes or trees) in the BI360 DW manager where a business user can configure the account mapping.
ii. Cons:
3) If you have a large number of different subsidiary chart of accounts, the account table in the BI360 can become very large (e.g. thousands of accounts) and thus the person responsible for the account mapping has to manage a large number of mappings (attributes or trees) and reports will run somewhat slower than if you had performed the mapping before (see two options for this above) the data is loaded into the BI360 DW.
3. Data Loading and Validation There are generally three types of data that is loaded to the BI360 DW:
a. Transactions
Copyright Solver, Inc., 2017 Financial Consolidations | Page 47
I. GL Summary (Trial balances) per department or per Subsidiary – this is obviously required data in order to create financial consolidation reports
II. GL Detail (Journal Entry level GL transactions) – this is optional and typically only done by companies that want drill down in reports to go all the way to journal entries.
b. Exchange rates
I. Monthly Average Rates
II. Month End rates
You can have as many rate types (Average, Closing, Budget, etc.) as you want in BI360. You can also load/enter monthly rates for the same currency that are different for different companies in that currency. Read the BI360 DW user manual for more information on this.
c. Dimensions
I. Dimension codes and descriptions (such as account codes/descriptions, company codes/descriptions).
II. Trees
i. These are usually not imported as it is usually quick and easy to design the trees inside the BI360 DW.
ii. However, imports from Excel are supported, and may be convenient in some cases. For example, large account trees which roll up multiple local charts of accounts into a single corporate chart of accounts may be easier to maintain in Excel then upload into BI360.
If you are loading rates form your ERP or other system that typically only stores DAILY rates, BI360 can automatically convert DAILY rates to MONTHLY rates and the BI360 DW Currency Module can store both daily and monthly rates. There are three different ways you can populate the BI360 DW with data:
1) Set up automated import using an ETL tool (like Microsoft SSIS, the BI360 ETL tool or the BI360 DW Connector wizards). If you are using SSIS and you need to understand the BI360 DW table schema, there is a BI360 Data Warehouse White Paper available on support.solverusa.com that describes the database structure.
2) Import data from Excel using the Import menus that exist in all the screens in the BI360 DW Manager. This method is sometimes the quickest and easiest, if some of your data only needs to be loaded once or such history from an old ERP system or budgets from a third party budget system that only is updated once per year. Other
Copyright Solver, Inc., 2017 Financial Consolidations | Page 48
reason to use file importing is if you are only creating a test or pilot model in the BI360 DW,
3) Enter data directly in the DW user interface (available for Dimensions, Exchange
Rates and Trees, while Transactions, such as GL data, has to be imported or you need to use the BI360 Budgeting module to set up Excel or Web input forms to enter data there).
4. Set up Account Dimension Attributes and Trees Once your dimension data (see prior paragraph) has been loaded into BI360, decide to use Account attributes or Account Trees (or both) to manage and simplify things like:
a. Mapping of subsidiary to parent accounts (discussed earlier in this document)
b. Grouping of accounts (e.g. grouping all Short Term asset accounts into a group called “Short Term Assets”). This will make reports faster to build, faster to run and require less or no maintenance in a report when you have new accounts in the future.
c. Creating consolidation trees for your companies (these will later be used in your consolidation reports. Entity trees must be configured if you are going to utilize BI360’s automated elimination or minority scripts. This is discussed in greater detail later in this document).
See the BI360 Data Warehouse User Manual for currency setup details and instructions on importing and running Process rules.
5. BI360 Consolidation Rules In BI360, rules are data handling procedures that are run from the Processes section of the Data Warehouse Manager. There are three BI360 consolidation rules: currency conversion, minority interest eliminations and intercompany activity eliminations. Running (or scheduling to run automatically) these rules in the BI360 DW Manager create transactions which can be used to create consolidated financial statements. These transactions are described in the following sections. To guarantee integrity in your BI360 Data Warehouse, the automated BI360 scripts must be executed in the following sequence:
1) Currency conversion. This script will delete any minority interest and intercompany activity transactions as well as any existing currency translation transactions in the selected periods.
2) Minority interest elimination calculation. This script will delete intercompany activity elimination transactions as well as any existing minority interest eliminations in the selected periods.
3) Intercompany activity elimination calculation.
Copyright Solver, Inc., 2017 Financial Consolidations | Page 49
This script will only delete any existing intercompany activity elimination transactions in the selected periods.
4) Additional information regarding setup of the consolidation rules is contained in Appendix 2: Enabling BI360 Consolidation.
6. Setup Currency Conversion This setup is only required if you need BI360 to perform currency conversion. There are five steps to currency conversion setup:
1) Set up the Rate Types in the Currency section of the BI360 DW user interface.
2) Set up the Account Types and assign them to account codes in the account dimension in the BI360 DW user interface. As many Account Types as required may be created to map to the various types of accounts requiring translation (e.g., income statement accounts, balance sheet accounts, retained earnings accounts, historical rate accounts).
3) Map Rate Types and Scenarios in the Currency section of the BI360 DW user interface.
4) Loading or entering exchange rates (discussed earlier in this document) into the Currency section of the BI360 DW user interface.
5) Import the appropriate currency translation rule(s) into the Processes section of the BI360 Data Warehouse user interface. There are two standard rules available for BI360.
The first supports the general requirements for US GAAP and similar accounting standards. The data for all accounts is loaded with opening balances and periodic activity.
The second supports IFRS requirements. The data for all accounts is loaded with ending balances for the period.
This currency translation rule is available for download at support.solverusa.com at https://support.solverusa.com/index.php?/Knowledgebase/Article/View/489 . Additional information regarding setup of the consolidation rules is contained in “Appendix 2: Configuring BI360 Consolidation.”
See the BI360 Data Warehouse User Manual for currency setup details and instructions on importing Process rules.
7. Setup Minority Interest Elimination
Copyright Solver, Inc., 2017 Financial Consolidations | Page 50
This setup is only necessary if there are entities which are less than 100% owned (or controlled) by the parent. There are three steps to prepare for minority interest elimination calculations:
1) Set up an entity tree (or trees) in the Data Warehouse user interface that have nodes
set to less than 100% ownership. Minority interest eliminations are only calculated for transactions with entities represented in entity tree nodes with Percent Ownership set to less than 100%.
2) Enable the Tree and Minority Parent dimensions for the GL Summary module in the Data Warehouse user interface.
3) Import the minority interest elimination rule into the Processes section of the BI360
DW user interface. The rule is available for download at support.solverusa.com at https://support.solverusa.com/index.php?/Knowledgebase/Article/View/489.
Note: See the BI360 Data Warehouse User Manual for tree setup details and instructions on creating trees and importing Process rules. Additional information regarding setup of the consolidation rules is contained in “Appendix 6: Configuring BI360 Consolidation.”
8. Setup Intercompany Activity Elimination This setup is only necessary if there are entities within the organization which conduct business with each other that needs to be eliminated for consolidated reporting. There are four steps to prepare for intercompany activity elimination calculations:
1) Set up an entity tree (or trees) in the Data Warehouse user interface. Intercompany
elimination transactions are only calculated for transactions with both entity and corresponding entity.
2) Enable the Tree and Interco Parent dimensions for the GL Summary module in the Data Warehouse Manager.
3) Create or import transactions with the corresponding entity degenerate dimension populated. Corresponding entity identifies the counterparty entity in the organization for the transaction. For example, say that company A makes a loan to company B, and both company A and company B are subsidiaries in the same organization. Company A would book a loan receivable transaction with corresponding entity = B. Company B would book a loan payable with corresponding entity = A. When possible, the corresponding entity field should be populated when the base transactions are created in the data warehouse. If this is not practical, then a form can be used to populate corresponding entity.
4) Import the intercompany activity elimination rule into the Processes section of the BI360 Data Warehouse Manager. The rule is available for download at support.solverusa.com at https://support.solverusa.com/index.php?/Knowledgebase/Article/View/489.
Copyright Solver, Inc., 2017 Financial Consolidations | Page 51
See the BI360 Data Warehouse User Manual for tree setup details and instructions on creating trees and importing Process rules. Additional information regarding setup of the consolidation rules is contained in “Appendix 2: Configuring BI360 Consolidation.”
9. Currency Translation Process The consolidation process is initiated by executing the Currency Translation rule in the Processes section of the Data Warehouse user interface. The output of the rule are transactions that reflect the rate types and rates set up in the mapping described above in section 6, “Set up Currency Conversion.” The output is also limited by several parameters:
1) Entities.
2) Scenario.
3) Category.
4) Destination currencies.
5) Periods. Multicurrency organizations usually create consolidated reports restricted to the translated amounts. There are two primary filters used to limit reports to data generated by the currency rule:
1) Category codes begin with FX (FX is appended to the beginning of the category code of the native currency transaction).
2) The Row Comment attribute is FX (if the transaction currency is different from the native currency) or FC (if the transaction currency is the same as the native currency).
Aside from these filters there are no special requirements to create reports using currency translation transactions. For more information on report syntax please see the BI 360 Report Designer User Guide. Currency translation adjustment:
When a balance sheet or other financial statement contains accounts that are translated at various rates a currency translation adjustment amount must be calculated based and presented on the differences. The currency translation rule for US GAAP provides special support for calculating currency translation adjustment. For accounts which are mapped to either the average or closing rate type, all of the year-to-date native currency periodic activity in the Monthly Amount fields is totaled and translated at the closing rate for the report date in the Annual Amount field. These are generally the correct amounts for balance sheet accounts. This amount is stored in the Value2 – YTDTotal – field. Net income (based on the income statement accounts) on the other hand should generally be presented on the balance sheet as the sum of each period separately translated at the

Copyright Solver, Inc., 2017 Financial Consolidations | Page 52
average rate for that period. This is consistent with the presentation in the profit and loss statement. If the Account Types are configured correctly, then these translated amounts are stored in the Value1 – Monthly Amount – fields. Taking the difference between the net income thus calculated vs. the net income from the Annual Amount field for the income statement accounts provides the required amount for currency translation adjustment. If there are other accounts requiring translation (e.g., retained earnings, historical rate accounts translated at specific identification rates) then additional steps need to be taken to calculate the associated currency translation adjustment. These are outlined in a white paper available on the Solver support website.
Copyright Solver, Inc., 2017 Financial Consolidations | Page 53
10. Minority Interest Elimination Process The creation of minority interest elimination transactions is initiated by executing the Minority Elimination rule in the Processes section of the Data Warehouse user interface. The minority interest elimination process is based on the entity tree structures created in the Data Warehouse. If there are no nodes in any entity tree with Percent Ownership set to less than 100% then no minority interest elimination takes place. Minority interest eliminations have exactly the same transaction structure as the original transaction on which they are based EXCEPT that they have two additional dimensions:
1) Tree – Identifies the entity tree which is driving the elimination.
2) Minority Parent – identifies the branch in the tree which is driving the elimination.
Examples of base transactions and the related minority interest eliminations may be seen in Appendix 1 below. Note that there can be many more minority elimination transactions than original transactions since each tree will require a minority elimination transaction at each level where there is minority elimination required.
Building consolidated or consolidating reports so that the filters for entity tree and entity tree node are matched to the filters for the tree dimension and minority parent dimension will fetch results which properly match the base transaction(s) and appropriate minority interest elimination transaction(s). If the filter for entity tree and entity tree node is driven from a tree-style parameter then sheet-per-value functionality with proper eliminations is available as well. This is a screenshot of typical parameters with properly matched selections for a consolidated report with minority eliminations:
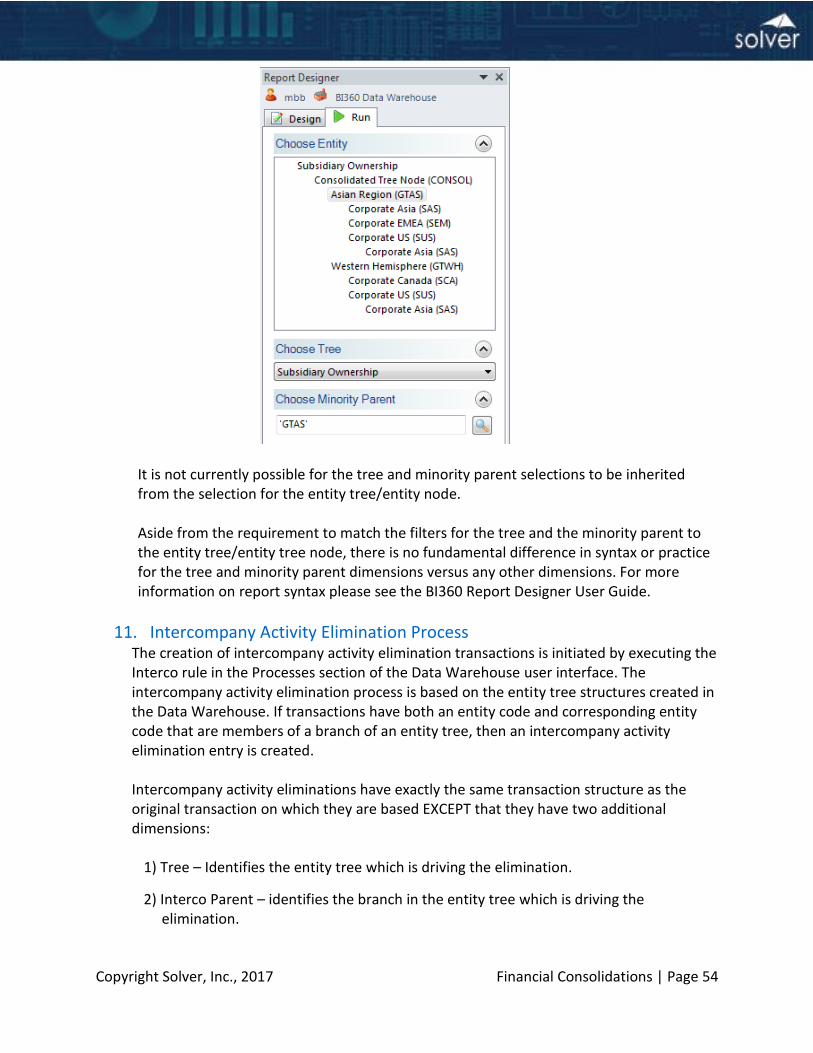
Copyright Solver, Inc., 2017 Financial Consolidations | Page 54
It is not currently possible for the tree and minority parent selections to be inherited from the selection for the entity tree/entity node. Aside from the requirement to match the filters for the tree and the minority parent to the entity tree/entity tree node, there is no fundamental difference in syntax or practice for the tree and minority parent dimensions versus any other dimensions. For more information on report syntax please see the BI360 Report Designer User Guide.
11. Intercompany Activity Elimination Process The creation of intercompany activity elimination transactions is initiated by executing the Interco rule in the Processes section of the Data Warehouse user interface. The intercompany activity elimination process is based on the entity tree structures created in the Data Warehouse. If transactions have both an entity code and corresponding entity code that are members of a branch of an entity tree, then an intercompany activity elimination entry is created.
Intercompany activity eliminations have exactly the same transaction structure as the original transaction on which they are based EXCEPT that they have two additional dimensions:
1) Tree – Identifies the entity tree which is driving the elimination.
2) Interco Parent – identifies the branch in the entity tree which is driving the elimination.
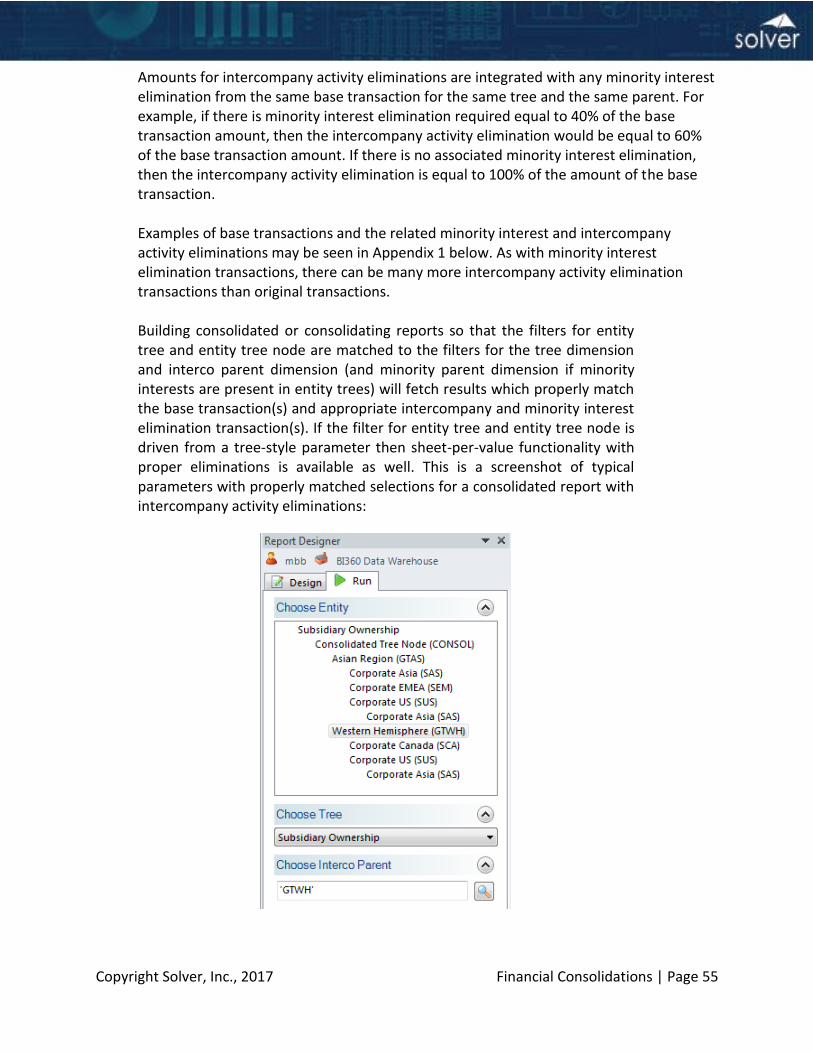
Copyright Solver, Inc., 2017 Financial Consolidations | Page 55
Amounts for intercompany activity eliminations are integrated with any minority interest elimination from the same base transaction for the same tree and the same parent. For example, if there is minority interest elimination required equal to 40% of the base transaction amount, then the intercompany activity elimination would be equal to 60% of the base transaction amount. If there is no associated minority interest elimination, then the intercompany activity elimination is equal to 100% of the amount of the base transaction.
Examples of base transactions and the related minority interest and intercompany activity eliminations may be seen in Appendix 1 below. As with minority interest elimination transactions, there can be many more intercompany activity elimination transactions than original transactions.
Building consolidated or consolidating reports so that the filters for entity tree and entity tree node are matched to the filters for the tree dimension and interco parent dimension (and minority parent dimension if minority interests are present in entity trees) will fetch results which properly match the base transaction(s) and appropriate intercompany and minority interest elimination transaction(s). If the filter for entity tree and entity tree node is driven from a tree-style parameter then sheet-per-value functionality with proper eliminations is available as well. This is a screenshot of typical parameters with properly matched selections for a consolidated report with intercompany activity eliminations:
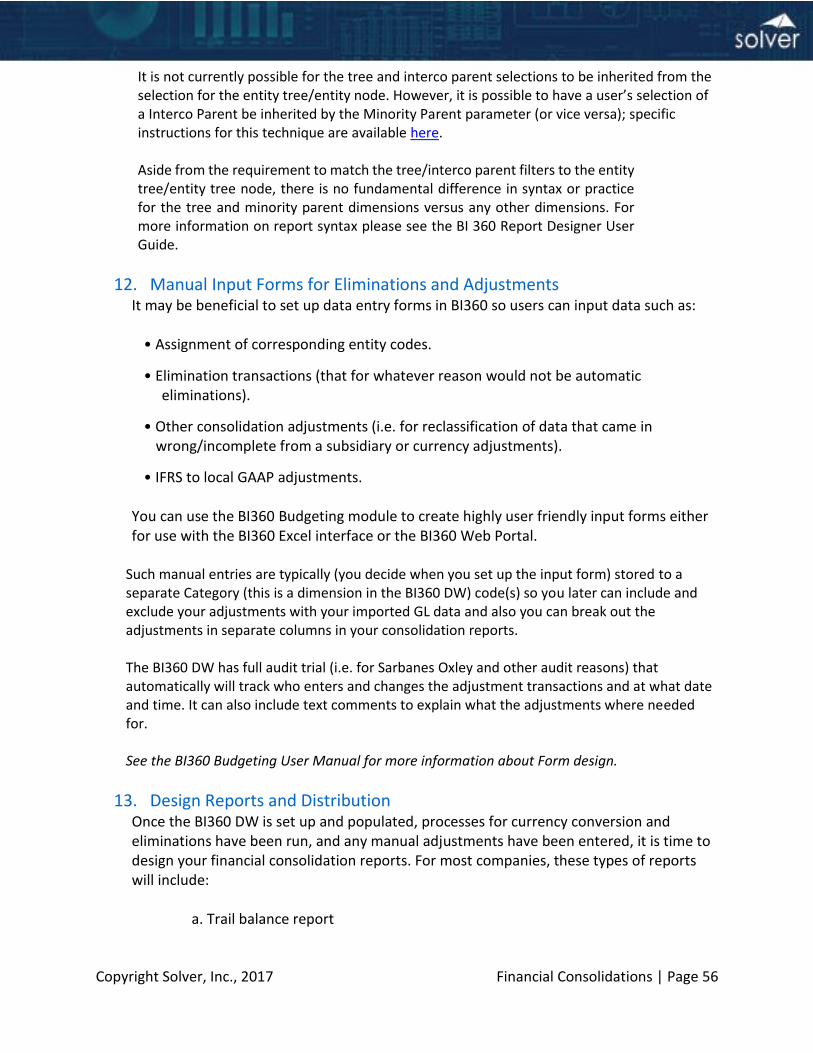
Copyright Solver, Inc., 2017 Financial Consolidations | Page 56
It is not currently possible for the tree and interco parent selections to be inherited from the selection for the entity tree/entity node. However, it is possible to have a user’s selection of a Interco Parent be inherited by the Minority Parent parameter (or vice versa); specific instructions for this technique are available here. Aside from the requirement to match the tree/interco parent filters to the entity tree/entity tree node, there is no fundamental difference in syntax or practice for the tree and minority parent dimensions versus any other dimensions. For more information on report syntax please see the BI 360 Report Designer User Guide.
12. Manual Input Forms for Eliminations and Adjustments It may be beneficial to set up data entry forms in BI360 so users can input data such as:
• Assignment of corresponding entity codes.
• Elimination transactions (that for whatever reason would not be automatic eliminations).
• Other consolidation adjustments (i.e. for reclassification of data that came in wrong/incomplete from a subsidiary or currency adjustments).
• IFRS to local GAAP adjustments.
You can use the BI360 Budgeting module to create highly user friendly input forms either for use with the BI360 Excel interface or the BI360 Web Portal.
Such manual entries are typically (you decide when you set up the input form) stored to a separate Category (this is a dimension in the BI360 DW) code(s) so you later can include and exclude your adjustments with your imported GL data and also you can break out the adjustments in separate columns in your consolidation reports.
The BI360 DW has full audit trial (i.e. for Sarbanes Oxley and other audit reasons) that automatically will track who enters and changes the adjustment transactions and at what date and time. It can also include text comments to explain what the adjustments where needed for.
See the BI360 Budgeting User Manual for more information about Form design.
13. Design Reports and Distribution Once the BI360 DW is set up and populated, processes for currency conversion and eliminations have been run, and any manual adjustments have been entered, it is time to design your financial consolidation reports. For most companies, these types of reports will include:
a. Trail balance report
Copyright Solver, Inc., 2017 Financial Consolidations | Page 57
b. Consolidated and Consolidating Profit & Loss
c. Consolidated and Consolidating Balance Sheet
d. Consolidated and Consolidating Cash Flow Many companies desire to automatically compile the same report across sheets in a single Excel workbook, starting with a consolidated version of the report on the first sheet and then replicating the same report format on the next sheets according to a consolidation tree set up in the BI360 DW. This is a powerful feature in the BI360 Report Designer. However, if you have more than 75-100 sheets in the same workbook it will significantly slow down the report execution and it might be better to consider on-demand execution or running the report in separate Excel files per company. Of course, any number of other reports can also be created. In short, you use the BI360 Report Designer to set up the reports you desire. Then you have three ways of running these reports:
a. Run reports with the BI360 Excel add-in.
b. Run reports and distribute (or print) automatically with the BI360 Publisher module.
c. Run reports in the BI360 Web Portal. See the BI360 Report Designer User Manual for more information about Report design.
14. Testing and Validation Once you have completed all the steps above, make sure you set aside time to test both your data and your reports before you go live.
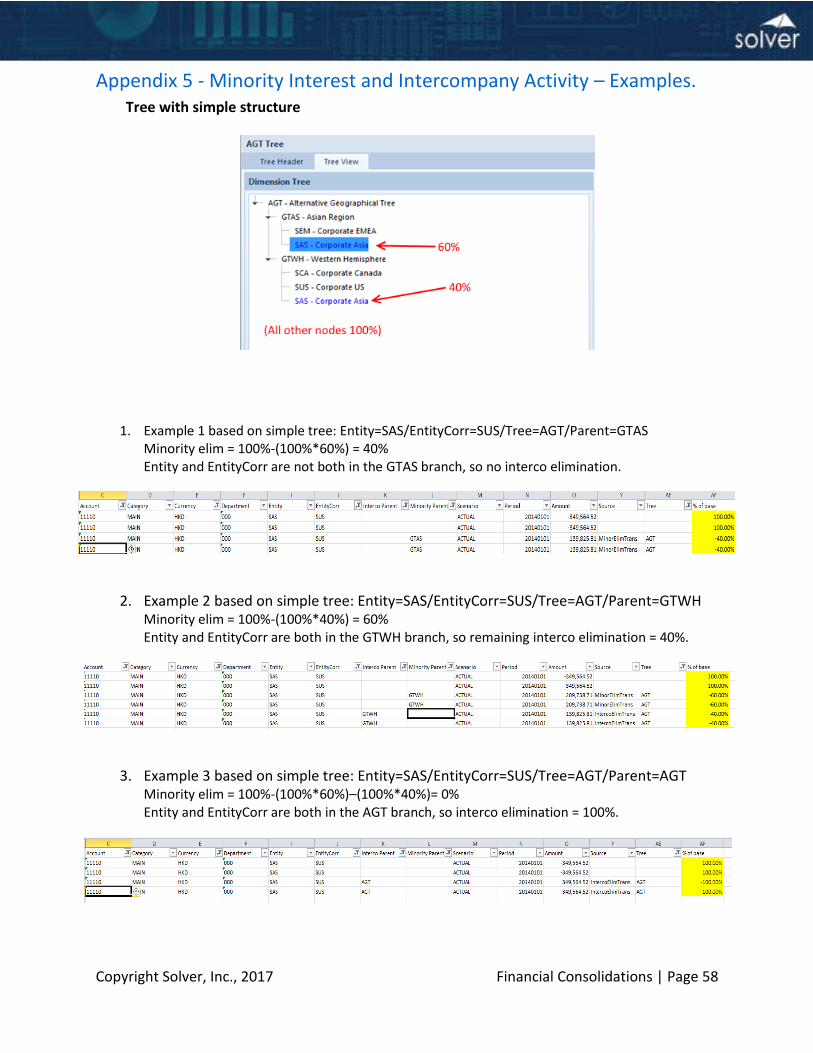
Copyright Solver, Inc., 2017 Financial Consolidations | Page 58
Appendix 5 - Minority Interest and Intercompany Activity – Examples. Tree with simple structure
1. Example 1 based on simple tree: Entity=SAS/EntityCorr=SUS/Tree=AGT/Parent=GTAS
Minority elim = 100%-(100%*60%) = 40% Entity and EntityCorr are not both in the GTAS branch, so no interco elimination.
2. Example 2 based on simple tree: Entity=SAS/EntityCorr=SUS/Tree=AGT/Parent=GTWH
Minority elim = 100%-(100%*40%) = 60% Entity and EntityCorr are both in the GTWH branch, so remaining interco elimination = 40%.
3. Example 3 based on simple tree: Entity=SAS/EntityCorr=SUS/Tree=AGT/Parent=AGT
Minority elim = 100%-(100%*60%)–(100%*40%)= 0% Entity and EntityCorr are both in the AGT branch, so interco elimination = 100%.
Copyright Solver, Inc., 2017 Financial Consolidations | Page 59
Tree With Complex Structure
Note that this tree has cascading minority ownership levels. For example, in the GTWH
branch SUS is 40% owned, while SAS is 30% owned by SUS. Therefore the effective
ownership of SAS in the GTWH branch is:
40% * 30% = 12%.
1. Example 1 based on complex tree: Entity=SAS/EntityCorr=SUS/Tree=GT/Parent=SUS
Minority elim = 100%-30% = 70% Entity and EntityCorr are both in the SUS branch, so remaining 30% is interco
elimination.
2. Example 2 based on complex tree: Entity=SAS/EntityCorr=SUS/Tree=GT/Parent=GTAS
Minority elim = 100%- 10%-(60%*30%) = 72% Entity and EntityCorr are both in the GTAS branch, so remaining 28% is interco
elimination.
Copyright Solver, Inc., 2017 Financial Consolidations | Page 60
3. Example 3 based on complex tree: Entity=SAS/EntityCorr=SUS/Tree=GT/Parent=GT Minority elim = 100%-(60%* 10%)-(60%*60%*30%) – (100%*40%*30%) = 71.2% Entity and EntityCorr are both in the GT branch, so remaining 28.8% is interco
elimination.
4. Example 4 based on complex tree: Entity=SAS/EntityCorr=SUS/Tree=GT/Parent=GTWH
Minority elim = 100%-(40%*30%) = 88% Entity and EntityCorr are both in the GTWH branch, so remaining 12% is interco
elimination.
Copyright Solver, Inc., 2017 Financial Consolidations | Page 61
Appendix 6 - Configuring BI360 Consolidation
General information about the setup of BI360 configuration is contained above:
Section 6: Setup Currency Conversion
Section 7: Setup Minority Interest Elimination
Section 8: Setup Intercompany Activity Elimination The purpose of this appendix is to provide more specific configuration instructions. While the BI360 consolidation tools will work on any version of BI360 starting with 4.0 it is recommended for versions 4.5 or later due to improved performance. Installing the consolidation process rules: The current versions of the consolidation rules are available on the Solver support site: https://support.solverusa.com/index.php?/Knowledgebase/Article/View/489. There are 3 separate rules for currency translation, minority interest eliminations and intercompany transaction eliminations. Only install the rules required for the particular consolidation environment:
If all consolidations are in a single native currency, then the currency translation rule is unnecessary.
If all entities are 100% owned, then the minority interest elimination rule is unnecessary.
If no intercompany transactions need to be eliminated in consolidation, then the intercompany elimination rule is unnecessary.
As described in the body of the user guide, any of the three rules present must be executed in this order (currency, minority interest, intercompany transactions). Configuring dimensions for BI360 consolidation: Several dimensions must be enabled from Administration in the Data Warehouse user interface
for the BI360 minority interest and intercompany transaction elimination rules to function.
These dimensions should be mapped to the GL Summary module:
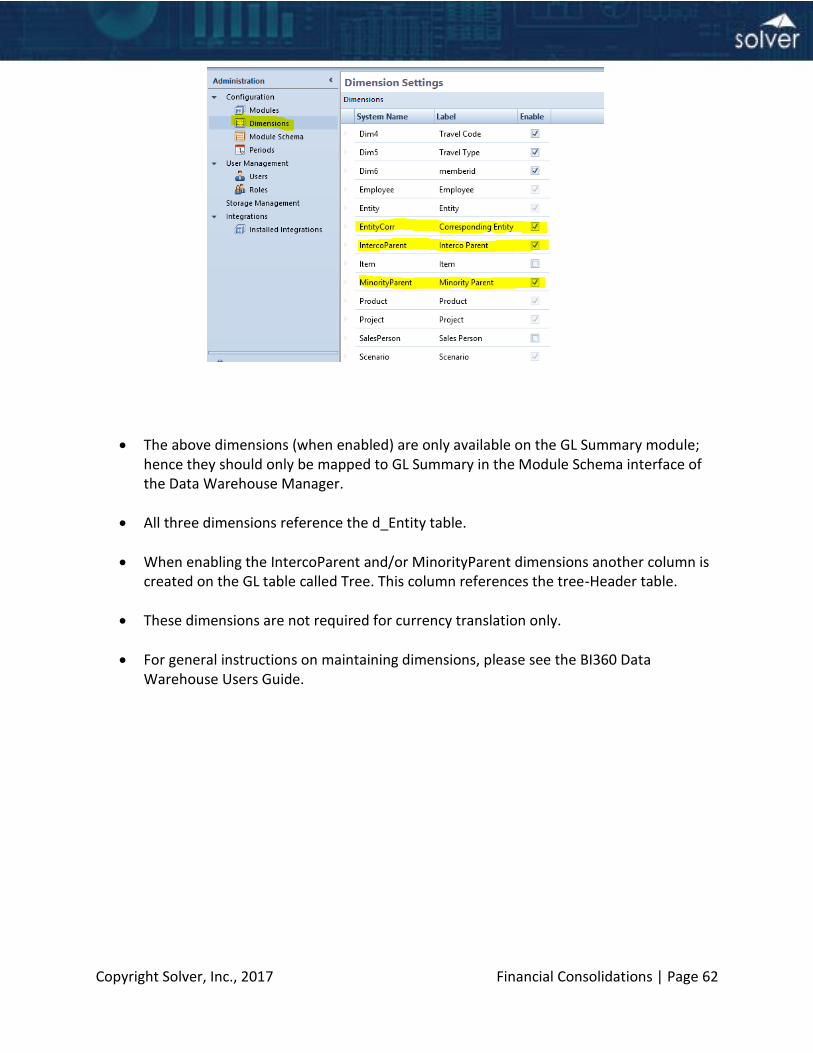
Copyright Solver, Inc., 2017 Financial Consolidations | Page 62
The above dimensions (when enabled) are only available on the GL Summary module; hence they should only be mapped to GL Summary in the Module Schema interface of the Data Warehouse Manager.
All three dimensions reference the d_Entity table.
When enabling the IntercoParent and/or MinorityParent dimensions another column is created on the GL table called Tree. This column references the tree-Header table.
These dimensions are not required for currency translation only.
For general instructions on maintaining dimensions, please see the BI360 Data Warehouse Users Guide.
Copyright Solver, Inc., 2017 Financial Consolidations | Page 63
Appendix 7 - Additional BI360 Information and Resources BI360 Reference Documents: https://www.solverglobal.com/products/documents Any other information you need: Request from [email protected] or your partner BI360 Customer Case Studies: https://www.solverglobal.com/products/customers BI360 customer portal, on-demand videos and webinars:
Webinars https://www.solverglobal.com/products/webinars/
Examples by industry: https://www.solverglobal.com/products/solutions/
On-demand videos of BI360 o Solver site: https://www.solverglobal.com/products/experience-bi360/
Customer portal gives access to rich and valuable BI360 information including – Solver University, BI360 forum, BI360 Blog, various BI360 whitepapers, training videos, etc. See preview here - https://support.solverusa.com/
Visit our website for a host of information: http://www.solverglobal.com