Embed Size (px)
Citation preview

BI Standardization: Reduce TCO +
Improve Usability Chicago User Group - Nov. 18, 2011
Mike Watschke, Global COE for BI, EIM & DW

© 2011 SAP AG. All rights reserved. 2
Agenda
BI Challenges
BI Standardization
BI Road to Success Playbooks Role
Best Practices:
BI COE (BICC)
Leveraging Pre-Built Industry & LOB Applications
Q&A
© 2011 SAP AG. All rights reserved. 3
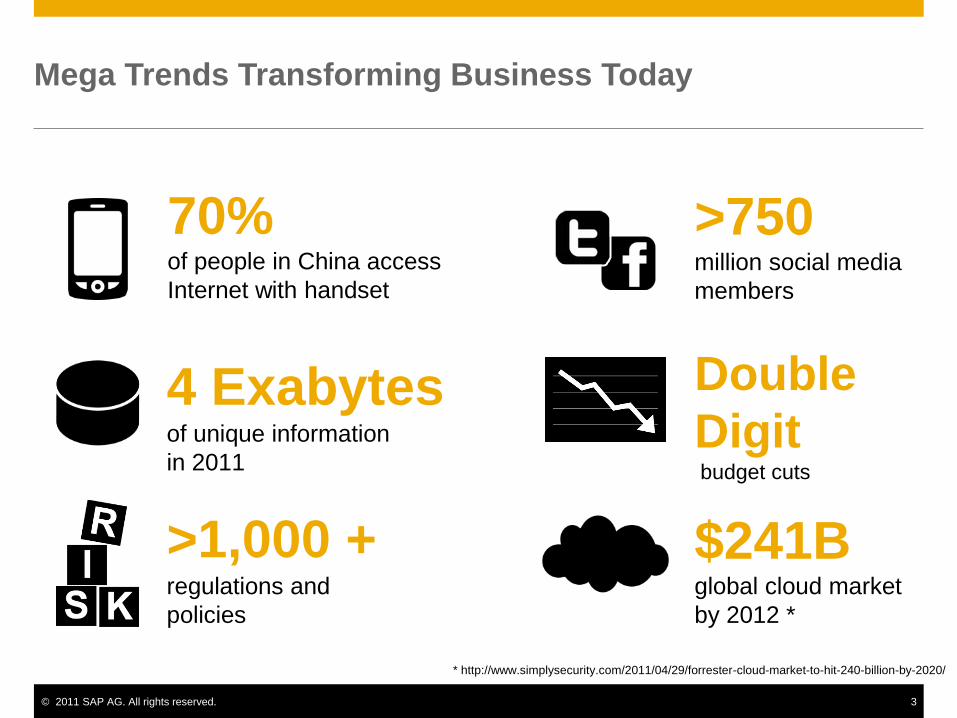
4 Exabytes
of unique information
in 2011
70% of people in China access
Internet with handset
>750 million social media
members
>1,000 +
regulations and
policies
Double
Digit budget cuts
Mega Trends Transforming Business Today
$241B global cloud market
by 2012 *
* http://www.simplysecurity.com/2011/04/29/forrester-cloud-market-to-hit-240-billion-by-2020/

© 2011 SAP AG. All rights reserved. 4
Users Need Information to Know…
Source: Tom Davenport International Institute for Analytics
How and why
did it happen?
What is the
risk?
How do you prevent /
ensure it happens again?
What
happened?
What is
happening?
What will
happen?
OP
ER
AT
ION
S l H
R l F
INA
NC
E | IT
| S
AL
ES
l M
AR
KE
TIN
G
MANUFACTURING l RETAIL l HEALTHCARE l BANKING l UTILITIES l TELCO | PUBLIC SECTOR
© 2011 SAP AG. All rights reserved. 5
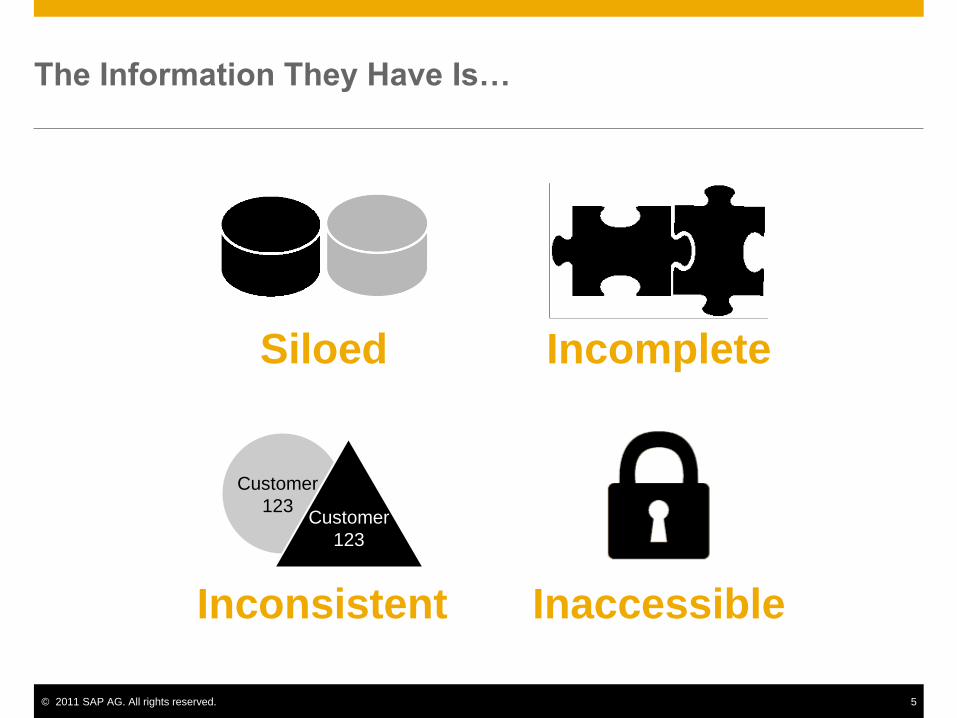
The Information They Have Is…
Inconsistent
Customer
123 Customer
123
Inaccessible
Incomplete Siloed

© 2011 SAP AG. All rights reserved. 6
BI Tools Proliferation
Is Not the Answer…

© 2011 SAP AG. All rights reserved. 7
BI Tools Proliferation Costs
Without
BI Standards
With
BI Standards
Costs
Number of BI deployments across the enterprise
Savings

© 2011 SAP AG. All rights reserved. 8
BI Standardization Impacts
Process
Standardization
• Global design, local flexibility
• Faster adoption
• Replicate best practices
Operational
Effectiveness
• Real-time visibility across the enterprise
• Better collaboration and decision making
• Speed of acquisition and integration
Growth • Timely visibility
• Accelerate change initiatives
• Take advantage of opportunities
Risk Reduction • Non-disruption – production and delivery
• International compliance
• Coherent information across the organization
IT Portfolio
Simplification
• Simpler IT architecture
• More funds for innovation
• Reduction of IT cost base
Value Drivers Areas of Impact
Customer Value
Profitability

© 2011 SAP AG. All rights reserved. 9
Driving Tangible Benefits
Time spent on BI maintenance
Business user productivity
Decision making
IT spent on data integration
IT spent on BI infrastructure
Training costs
Time to market
Undesired IT systems

© 2011 SAP AG. All rights reserved. 10
Delivering Remarkable Results
What did the best do?
40% Improved
Business User
Productivity
40% 50% Reduced
Training Costs Reduced IT
Spent on BI
Infrastructure
Source: Benchmarks from SAP Value Engineering and SAP customer experiences

© 2011 SAP AG. All rights reserved. 11
SAP BusinessObjects
Proven Market Leadership in BI
Broadest adoption
18 million+ Crystal Reports users
3 million+ Web Intelligence users
Most complete
capabilities
Unified approach for
financial, supply chain,
and environmental GRC Vibrant partner ecosystem
7,000+ partners across major ISVs, OEMs,
resellers, and consulting
Intuitive user
experience
Designed for
untrained users
Unified
information
Consumes structured and
unstructured as well as
internal and external data,
including benchmarks
Works with any
technology platform
Designed to operate in
heterogeneous environments and
well-integrated with SAP
Market
leadership
Leading analysts rate
business analytics
solutions from SAP as
#1 overall
Most complete
solution for
business users
67,000 customers =
80% of the Fortune 500
Analytic
Applications
Governance,
Risk, and
Compliance
Enterprise
Performance
Management
Business
Intelligence
Data
Warehousing
Enterprise
Information
Management
© 2011 SAP AG. All rights reserved. 12
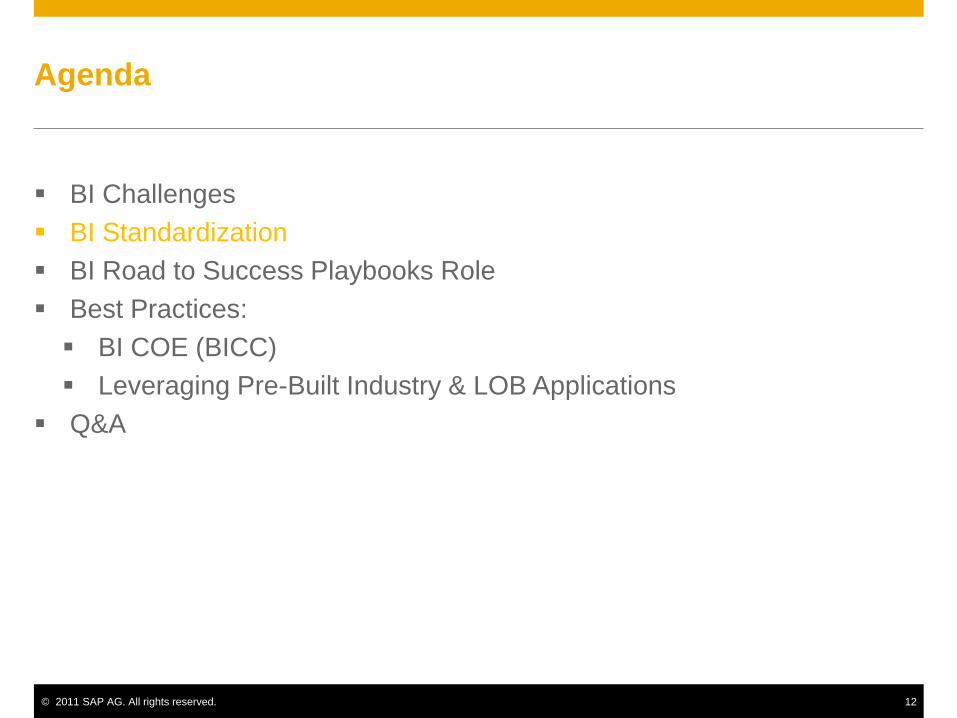
Agenda
BI Challenges
BI Standardization
BI Road to Success Playbooks Role
Best Practices:
BI COE (BICC)
Leveraging Pre-Built Industry & LOB Applications
Q&A

© 2011 SAP AG. All rights reserved. 13
Your BI Standardization Journey and Calls to Action
Roadmap Development – Define the way forward in the journey
As-Is Assessment – Become aware of the need for standardization
To-Be Vision – Develop the strategy and the case for standardization
1
2
3

© 2011 SAP AG. All rights reserved. 14
Calls to Action
As-Is Assessment 1
Analysis of BI needs, capabilities, and gaps – Road to BI Success Playbook #1-
3
Peer group comparison – BI Benchmarking
High-level savings potential – BI Standardization Calculator

© 2011 SAP AG. All rights reserved. 15
Calls to Action
To-Be Vision 2
BI strategy development – Road to BI Success playbook #4
BI solution architecture – Best Practice BI Solution Architecture on SCN
BI standardization business case – Value Lifecycle Manager
© 2011 SAP AG. All rights reserved. 16
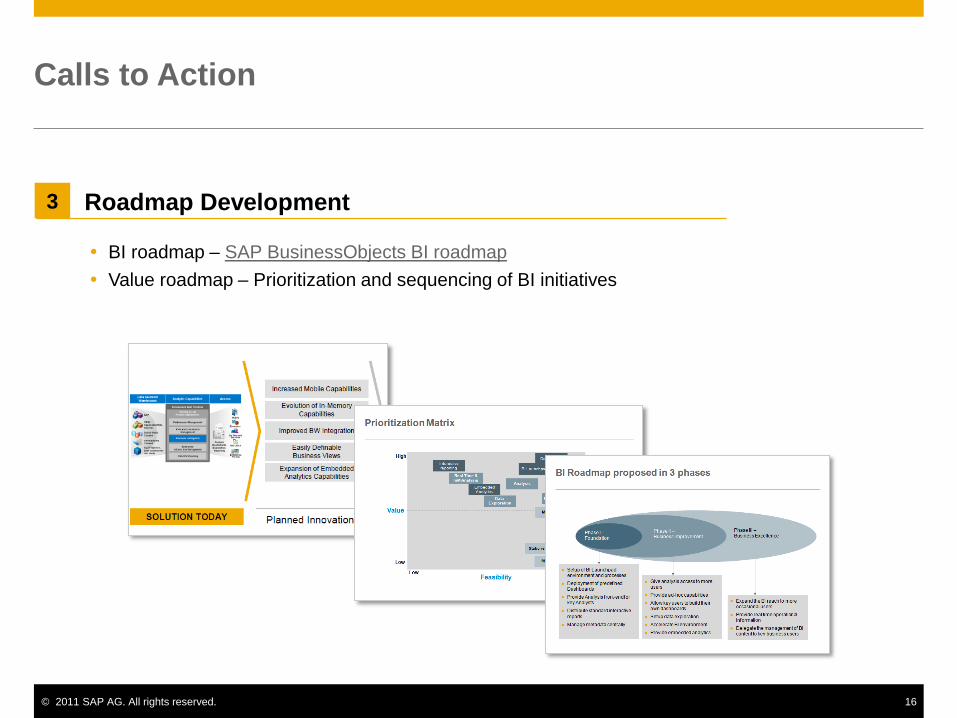
Calls to Action
Roadmap Development 3
BI roadmap – SAP BusinessObjects BI roadmap
Value roadmap – Prioritization and sequencing of BI initiatives

© 2011 SAP AG. All rights reserved. 17
BI Standardization Calculator
© 2011 SAP AG. All rights reserved. 18
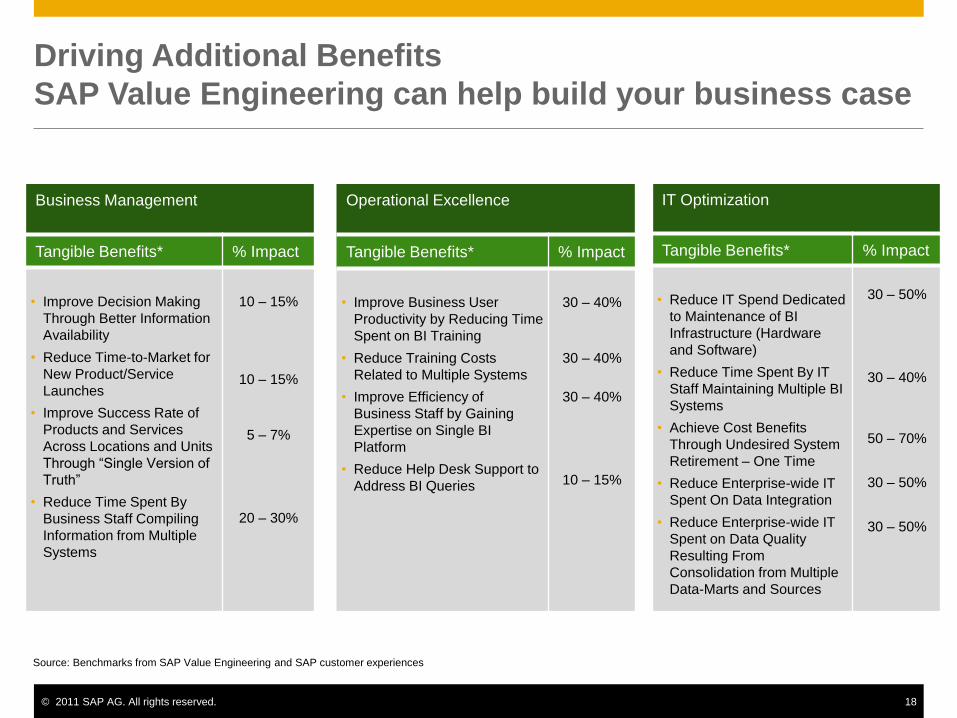
IT Optimization
Tangible Benefits* % Impact
• Reduce IT Spend Dedicated
to Maintenance of BI
Infrastructure (Hardware
and Software)
• Reduce Time Spent By IT
Staff Maintaining Multiple BI
Systems
• Achieve Cost Benefits
Through Undesired System
Retirement – One Time
• Reduce Enterprise-wide IT
Spent On Data Integration
• Reduce Enterprise-wide IT
Spent on Data Quality
Resulting From
Consolidation from Multiple
Data-Marts and Sources
30 – 50%
30 – 40%
50 – 70%
30 – 50%
30 – 50%
Operational Excellence
Tangible Benefits* % Impact
• Improve Business User
Productivity by Reducing Time
Spent on BI Training
• Reduce Training Costs
Related to Multiple Systems
• Improve Efficiency of
Business Staff by Gaining
Expertise on Single BI
Platform
• Reduce Help Desk Support to
Address BI Queries
30 – 40%
30 – 40%
30 – 40%
10 – 15%
Business Management
Tangible Benefits* % Impact
• Improve Decision Making
Through Better Information
Availability
• Reduce Time-to-Market for
New Product/Service
Launches
• Improve Success Rate of
Products and Services
Across Locations and Units
Through “Single Version of
Truth”
• Reduce Time Spent By
Business Staff Compiling
Information from Multiple
Systems
10 – 15%
10 – 15%
5 – 7%
20 – 30%
Source: Benchmarks from SAP Value Engineering and SAP customer experiences
Driving Additional Benefits
SAP Value Engineering can help build your business case

© 2011 SAP AG. All rights reserved. 19
Core Operating Model
Market Drivers
Strategic Drivers
Market Intelligence
informs Extended Value Net
informs
Operating Capabilities
Employees &
Employee
Behaviors
VALUES
NORMS
ARTIFACTS
SYMBOLS
evolves and informs evolves and informs
guides guides
Sustained by Motivators, Integrators & Governance Systems
Customer Value Profitability
Core Business Drivers
Systems Design,
IT & Business
Services
Orchestrating Information for Better Results
User Interfaces
Business
Intelligence
Busin
ess
Ap
plic
ation
s
Composite
Applications &
Processes
Performance
Management &
Analytics
Finance
Operations
Reporting & Analytics
Information Architecture
Information Consumers
Master
Data
Structured
Data
Unstructured
Data
Information Provisioning
Meta
data
Managem
ent
Transactions
After: Weill & Ross (2009), SAP (2011)

© 2011 SAP AG. All rights reserved. 20
Agenda
BI Challenges
BI Standardization
BI Road to Success Playbooks Role
Best Practices:
BI COE (BICC)
Leveraging Pre-Built Industry & LOB Applications
Q&A

© 2011 SAP AG. All rights reserved. 21
4 Step BI Road to Success Approach Utilize playbooks for repeatable value-based methodology
Playbook 1
(Business
Interviews)
Playbook 2
(IT Interviews)
Playbook 3
(Assessment
& Analysis)
Playbook 4
(Recommendations)
Current BI
Needs Baseline
Analysis
BI Strategy &
Execution
Baseline Gap Analysis
BI Strategy
Foundation
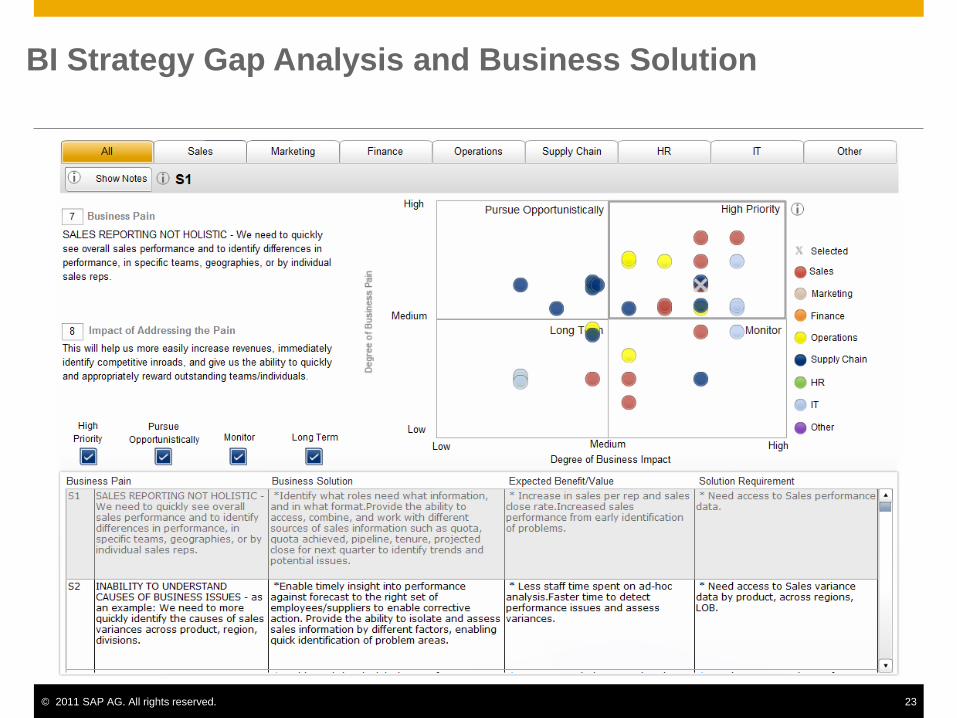
Combines different sources of sales information such as quota, quota achieved, pipeline, tenure, projected close for next quarter to identify trends and potential issues.
Determine the causes of sales reductions (bottlenecks in sales process), and the appropriate information/KPIs to track
Integrate multiple sources (if necessary).
Determine who needs what information and in what form
Automate the delivery of the information
Sales Variance - We need to more quickly be able to identify what is causing sales variances across product, region, LOB, etc
14
Combines different sources of sales information such as quota, quota achieved, pipeline, tenure, projected close for next quarter to identify trends and potential issues.
Determine the causes of sales reductions (bottlenecks in sales process), and the appropriate information/KPIs to track
Integrate multiple sources (if necessary).
Determine who needs what information and in what form
Automate the delivery of the information
Sales Performance Management - We need deeper insight into sales performance, to be able to understand where we're getting traction, where we're not, and why so adjustments can be made
13
Integrates different types of information into a single view to perform trend analysis and provide a better understanding of revenue relationships.
Determine what metrics are needed to demonstrate media performance
Determine who needs the information, and in what form.
Automate the delivery of the information required to all who need it.
Integrate data sources if needed.
Media Performance Tracking - We need deeper insight into how our media investments across various channels are performing so we can better allocate funds.
12
EXPECTED BENEFIT /
VALUE
BUSINESS SOLUTION / BENEFIT GAP
Combines different sources of sales information such as quota, quota achieved, pipeline, tenure, projected close for next quarter to identify trends and potential issues.
Determine the causes of sales reductions (bottlenecks in sales process), and the appropriate information/KPIs to track
Integrate multiple sources (if necessary).
Determine who needs what information and in what form
Automate the delivery of the information
Sales Variance - We need to more quickly be able to identify what is causing sales variances across product, region, LOB, etc
14
Combines different sources of sales information such as quota, quota achieved, pipeline, tenure, projected close for next quarter to identify trends and potential issues.
Determine the causes of sales reductions (bottlenecks in sales process), and the appropriate information/KPIs to track
Integrate multiple sources (if necessary).
Determine who needs what information and in what form
Automate the delivery of the information
Sales Performance Management - We need deeper insight into sales performance, to be able to understand where we're getting traction, where we're not, and why so adjustments can be made
13
Integrates different types of information into a single view to perform trend analysis and provide a better understanding of revenue relationships.
Determine what metrics are needed to demonstrate media performance
Determine who needs the information, and in what form.
Automate the delivery of the information required to all who need it.
Integrate data sources if needed.
Media Performance Tracking - We need deeper insight into how our media investments across various channels are performing so we can better allocate funds.
12
EXPECTED BENEFIT /
VALUE
BUSINESS SOLUTION / BENEFIT GAPCreate high level
summary of BI needs
by LOB, and their
expected impact if
addressed
Assess existence of BI
Strategy,
completeness of
execution, and impact
if completed
Prioritize Gaps of
existing BI needs, and
non-existent or poorly-
executed strategy
components
With prioritized gaps,
promote the benefits of
addressing the gaps,
and map BI solutions to
solve the business pain
Gartner Playbooks: Interactive discovery, prioritization, and recommendations for
addressing business pains and a successful enterprise BI strategy
© 2011 SAP AG. All rights reserved. 22
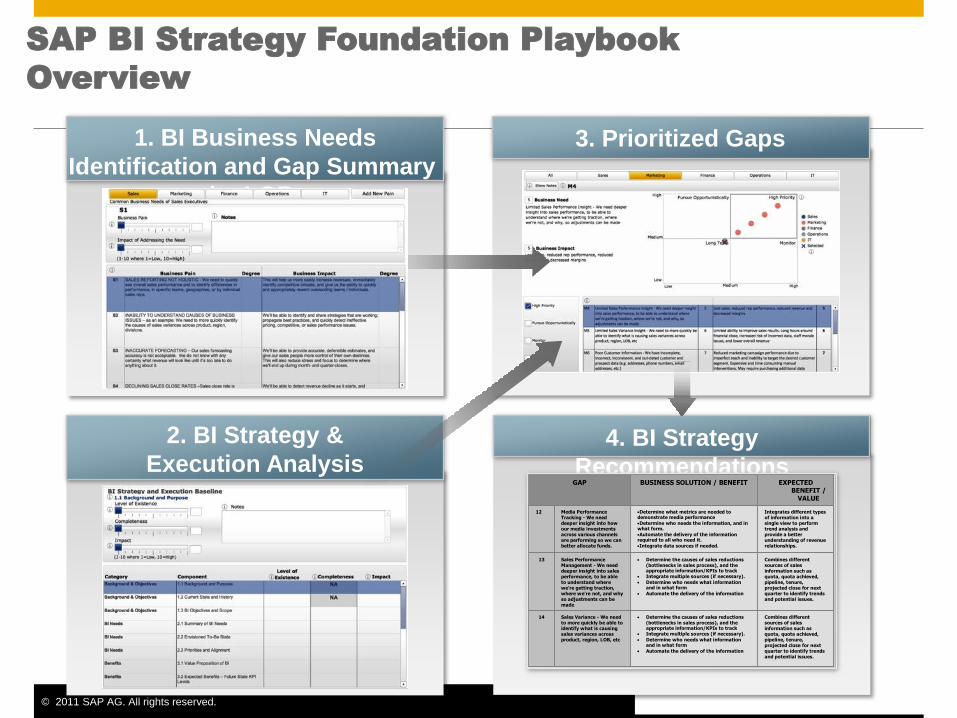
SAP BI Strategy Foundation Playbook
Overview
1. BI Business Needs
Identification and Gap Summary
by LOB
2. BI Strategy &
Execution Analysis 4. BI Strategy
Recommendations
Combines different sources of sales information such as quota, quota achieved, pipeline, tenure, projected close for next quarter to identify trends and potential issues.
Determine the causes of sales reductions (bottlenecks in sales process), and the appropriate information/KPIs to track
Integrate multiple sources (if necessary).
Determine who needs what information and in what form
Automate the delivery of the information
Sales Variance - We need to more quickly be able to identify what is causing sales variances across product, region, LOB, etc
14
Combines different sources of sales information such as quota, quota achieved, pipeline, tenure, projected close for next quarter to identify trends and potential issues.
Determine the causes of sales reductions (bottlenecks in sales process), and the appropriate information/KPIs to track
Integrate multiple sources (if necessary).
Determine who needs what information and in what form
Automate the delivery of the information
Sales Performance Management - We need deeper insight into sales performance, to be able to understand where we're getting traction, where we're not, and why so adjustments can be made
13
Integrates different types of information into a single view to perform trend analysis and provide a better understanding of revenue relationships.
Determine what metrics are needed to demonstrate media performance
Determine who needs the information, and in what form.
Automate the delivery of the information required to all who need it.
Integrate data sources if needed.
Media Performance Tracking - We need deeper insight into how our media investments across various channels are performing so we can better allocate funds.
12
EXPECTED BENEFIT /
VALUE
BUSINESS SOLUTION / BENEFIT GAP
Combines different sources of sales information such as quota, quota achieved, pipeline, tenure, projected close for next quarter to identify trends and potential issues.
Determine the causes of sales reductions (bottlenecks in sales process), and the appropriate information/KPIs to track
Integrate multiple sources (if necessary).
Determine who needs what information and in what form
Automate the delivery of the information
Sales Variance - We need to more quickly be able to identify what is causing sales variances across product, region, LOB, etc
14
Combines different sources of sales information such as quota, quota achieved, pipeline, tenure, projected close for next quarter to identify trends and potential issues.
Determine the causes of sales reductions (bottlenecks in sales process), and the appropriate information/KPIs to track
Integrate multiple sources (if necessary).
Determine who needs what information and in what form
Automate the delivery of the information
Sales Performance Management - We need deeper insight into sales performance, to be able to understand where we're getting traction, where we're not, and why so adjustments can be made
13
Integrates different types of information into a single view to perform trend analysis and provide a better understanding of revenue relationships.
Determine what metrics are needed to demonstrate media performance
Determine who needs the information, and in what form.
Automate the delivery of the information required to all who need it.
Integrate data sources if needed.
Media Performance Tracking - We need deeper insight into how our media investments across various channels are performing so we can better allocate funds.
12
EXPECTED BENEFIT /
VALUE
BUSINESS SOLUTION / BENEFIT GAP
3. Prioritized Gaps
© 2011 SAP AG. All rights reserved. 23
BI Strategy Gap Analysis and Business Solution

© 2011 SAP AG. All rights reserved. 24
BI Strategy Gap Analysis and BI Solution Recommendation
Architecture Example
© 2011 SAP AG. All rights reserved. 25
Agenda
BI Challenges
BI Standardization
BI Road to Success Playbooks Role
Best Practices:
BI COE (BICC)
Leveraging Pre-Built Industry & LOB Applications
Q&A
© 2011 SAP AG. All rights reserved. 26
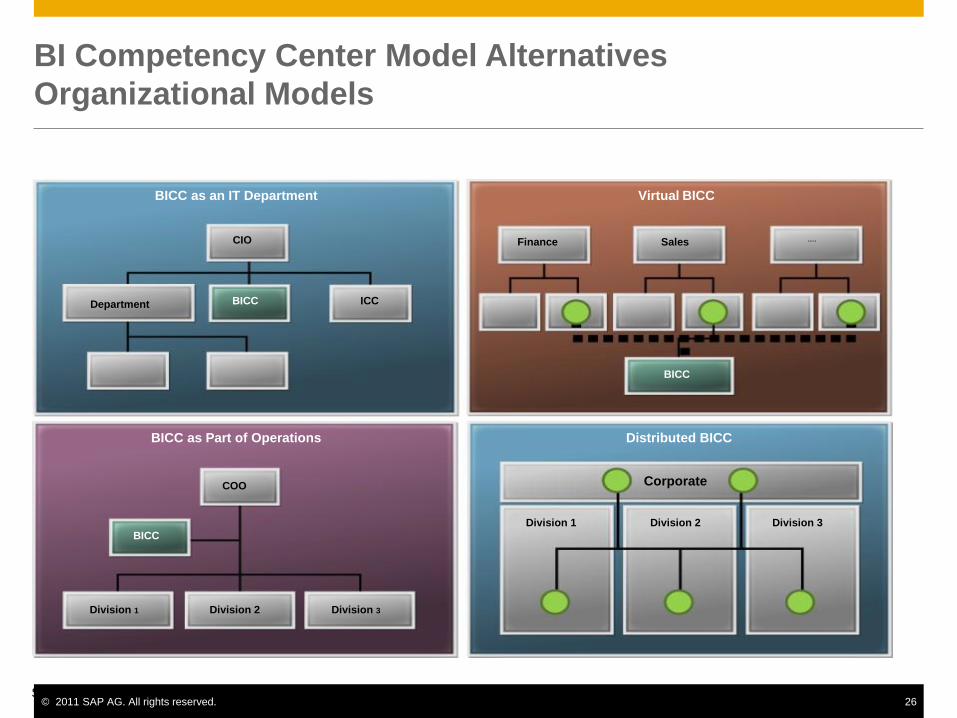
BI Competency Center Model Alternatives
Organizational Models
BICC as an IT Department Virtual BICC
BICC as Part of Operations Distributed BICC
COO
CIO
ICC Department BICC
BICC
BICC
Division 1 Division 2 Division 3
Corporate
Division 1 Division 2 Division 3
Finance .… Sales
Source: How to Define and Run a Successful Business Intelligence Competency Center, Gartner, August 2007

© 2011 SAP AG. All rights reserved. 27
BICC Skill Requirements
Business Skills:
Understanding of line-of-business (LOB) needs
Ability to help business managers set and balance priorities by
analyzing consequences of choices and creating business cases
An understanding of the organization's strategic business objectives
and the role action-oriented information plays in achieving the
corporate objectives
Stewardship skills to drive standardization of official hierarchies,
business vocabularies and other relevant business terminology, and
to participate in semantic reconciliation and ongoing data-quality
efforts
IT Skills:
Ability to understand the business intelligence infrastructure
implications of business and analytic requirements
Deep understanding of how to access and manage data required to
support business and analysis requirements
Deep understanding of diverse business intelligence and
performance management tools and technologies
Understanding of the differences in design and access characteristics
of diverse data sources
Data governance, architecture and management skills
Data administration and metadata management skills
Analytical Skills
Fluency with key analytic applications
Researching business problems and creating models that help
analyze these business problems
Working with the IT department to develop insight into how to identify
data for a specific analysis or application
Skills to train the users in how to transform data into action-oriented
information, and how to use that information
BICC Business, Analytics and IT Skills
Business Needs
Business
Skills
Organization and Processes
Business Needs
Statistical and Process Skills
Governance, Administration
Tools, Infrastructure, Applications, Data
Establish
Standards
Control
Funding Define
BI Vision
Manage
Programs
Build Technology
Blueprint
Develop
User Skills Organize
Methodology
Leadership
Analytic
Skills
IT
Skills
BICC

© 2011 SAP AG. All rights reserved. 28
BICC Strategy Map Example
IT Service
Management
Perspective
Learning &
Growth
Perspective
Contribution “The Business”
Internal Customer
Perspective
Competency
Financial
Perspective
Long-Term
Shareholder Value
BI Efficiency BI Effectiveness
Impact on
enterprise
outcomes
Ensure budgeting
discipline
Increase Asset
Utilization
Deliver BI services at competitive cost
Deliver consistent, high quality BI
services
Support business unit needs with BI
Drive business unit success with
innovative BI solutions
Achieve Operational
Excellence
Maintain a secure and reliable infrastructure that ensures business
operations
Manage service quality; deliver on
schedule
Optimize BI processes; lower unit
costs
Create and Support Business
Unit Partnerships
Improve business unit productivity and
profitability
Partner with business units; understand their
strategies
Develop effective decision support
systems
Provide Strategic Support to
the Business
Propose and deliver Information
Management Services
Understand emerging BI technologies
Attract, develop, and
retain employees with
key competencies
Provide BI tools and
techniques that enhance
the BI function
Foster a business and
customer-focused culture
2007 Balanced Scorecard Collaborative and Robert S. Kaplan - Revised
Provide superior BI professional services

© 2011 SAP AG. All rights reserved. 29
Industry Analytic Applications

© 2011 SAP AG. All rights reserved. 30
Line of Business Analytic Applications

Thank You!
Mike Watschke
Sr. Director, BI
Global Center of Excellence for BI, EIM & DW
+1 (952) 955-7466

© 2011 SAP AG. All rights reserved. 32
No part of this publication may be reproduced or transmitted in any form or for any
purpose without the express permission of SAP AG. The information contained
herein may be changed without prior notice.
Some software products marketed by SAP AG and its distributors contain
proprietary software components of other software vendors.
Microsoft, Windows, Excel, Outlook, and PowerPoint are registered trademarks of
Microsoft Corporation.
IBM, DB2, DB2 Universal Database, System i, System i5, System p, System p5,
System x, System z, System z10, System z9, z10, z9, iSeries, pSeries, xSeries,
zSeries, eServer, z/VM, z/OS, i5/OS, S/390, OS/390, OS/400, AS/400, S/390
Parallel Enterprise Server, PowerVM, Power Architecture, POWER6+, POWER6,
POWER5+, POWER5, POWER, OpenPower, PowerPC, BatchPipes,
BladeCenter, System Storage, GPFS, HACMP, RETAIN, DB2 Connect, RACF,
Redbooks, OS/2, Parallel Sysplex, MVS/ESA, AIX, Intelligent Miner, WebSphere,
Netfinity, Tivoli and Informix are trademarks or registered trademarks of IBM
Corporation.
Linux is the registered trademark of Linus Torvalds in the U.S. and other
countries.
Adobe, the Adobe logo, Acrobat, PostScript, and Reader are either trademarks or
registered trademarks of Adobe Systems Incorporated in the United States and/or
other countries.
Oracle and Java are registered trademarks of Oracle and/or its affiliates.
UNIX, X/Open, OSF/1, and Motif are registered trademarks of the Open Group.
Citrix, ICA, Program Neighborhood, MetaFrame, WinFrame, VideoFrame, and
MultiWin are trademarks or registered trademarks of Citrix Systems, Inc.
HTML, XML, XHTML and W3C are trademarks or registered trademarks of
W3C®, World Wide Web Consortium, Massachusetts Institute of Technology.
© 2011 SAP AG. All rights reserved.
SAP, R/3, SAP NetWeaver, Duet, PartnerEdge, ByDesign, SAP BusinessObjects
Explorer, StreamWork, and other SAP products and services mentioned herein as
well as their respective logos are trademarks or registered trademarks of SAP AG
in Germany and other countries.
Business Objects and the Business Objects logo, BusinessObjects, Crystal
Reports, Crystal Decisions, Web Intelligence, Xcelsius, and other Business
Objects products and services mentioned herein as well as their respective logos
are trademarks or registered trademarks of Business Objects Software Ltd.
Business Objects is an
SAP company.
Sybase and Adaptive Server, iAnywhere, Sybase 365, SQL Anywhere, and other
Sybase products and services mentioned herein as well as their respective logos
are trademarks or registered trademarks of Sybase, Inc. Sybase is an SAP
company.
All other product and service names mentioned are the trademarks of their
respective companies. Data contained in this document serves informational
purposes only. National product specifications may vary.
The information in this document is proprietary to SAP. No part of this document
may be reproduced, copied, or transmitted in any form or for any purpose without
the express prior written permission of SAP AG.