Embed Size (px)
Citation preview

Page 0 of 25
DRAFT
Bhiwandi Information Docket
May 2005
Page 0 of 25
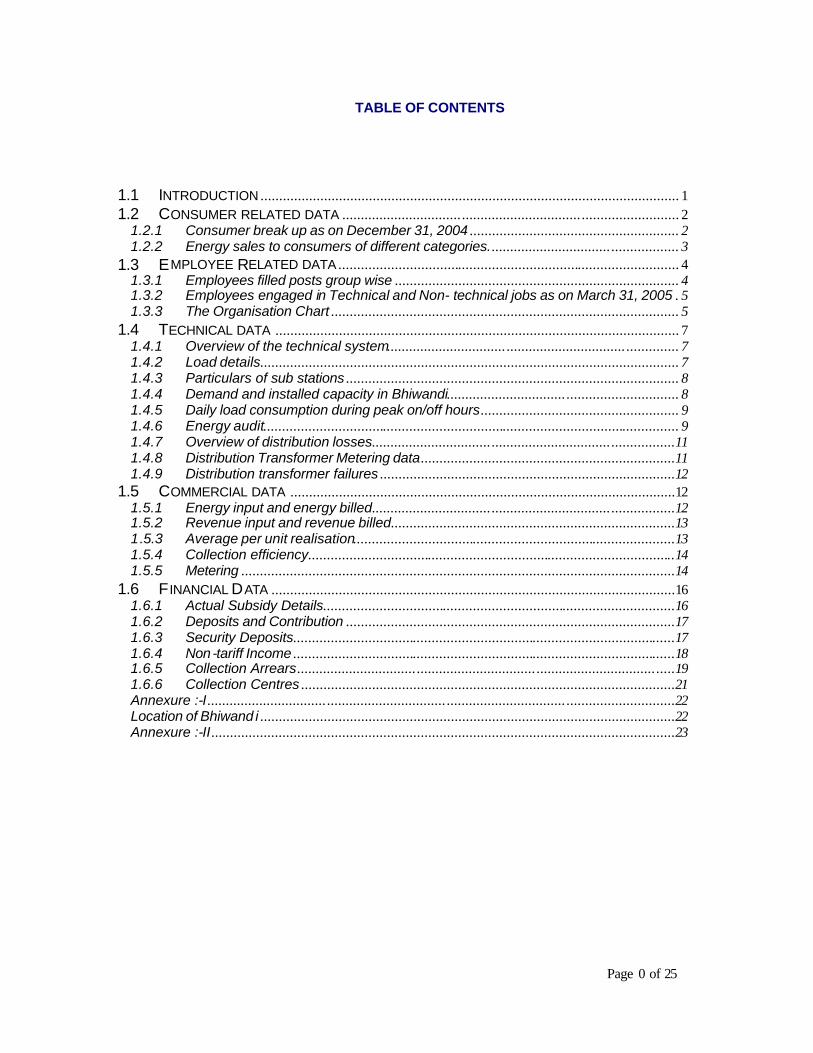
TABLE OF CONTENTS
1.1 INTRODUCTION ................................................................................................................ 1 1.2 CONSUMER RELATED DATA ................................ ................................ .......................... 2
1.2.1 Consumer break up as on December 31, 2004 ........................................................ 2 1.2.2 Energy sales to consumers of different categories................................. .................. 3
1.3 EMPLOYEE RELATED DATA ........................................................................................... 4 1.3.1 Employees filled posts group wise ............................................................................ 4 1.3.2 Employees engaged in Technical and Non- technical jobs as on March 31, 2005 . 5 1.3.3 The Organisation Chart ............................................................................................. 5
1.4 TECHNICAL DATA ............................................................................................................ 7 1.4.1 Overview of the technical system................................ ................................ .............. 7 1.4.2 Load details................................................................................................................ 7 1.4.3 Particulars of sub stations ......................................................................................... 8 1.4.4 Demand and installed capacity in Bhiwandi................................ .............................. 8 1.4.5 Daily load consumption during peak on/off hours..................................................... 9 1.4.6 Energy audit............................................................................................................... 9 1.4.7 Overview of distribution losses................................ ................................ .................11 1.4.8 Distribution Transformer Metering data....................................................................11 1.4.9 Distribution transformer failures ...............................................................................12
1.5 COMMERCIAL DATA .......................................................................................................12 1.5.1 Energy input and energy billed................................ ................................ .................12 1.5.2 Revenue input and revenue billed............................................................................13 1.5.3 Average per unit realisation......................................................................................13 1.5.4 Collection efficiency..................................................................................................14 1.5.5 Metering ....................................................................................................................14
1.6 F INANCIAL DATA ............................................................................................................16 1.6.1 Actual Subsidy Details..............................................................................................16 1.6.2 Deposits and Contribution ........................................................................................17 1.6.3 Security Deposits......................................................................................................17 1.6.4 Non-tariff Income ......................................................................................................18 1.6.5 Collection Arrears................................ ................................ ................................ .....19 1.6.6 Collection Centres ....................................................................................................21 Annexure :-I ................................ ................................ ................................ .............................22 Location of Bhiwand i ...............................................................................................................22 Annexure :-II ............................................................................................................................23

Bhiwandi Circle– Information docket
1
1.1 Introduction
Bhiwandi is an important industrial township in Thane district. It is about 48
kilometers to the south of Mumbai, details of which can be accessed at Annexure I.
According to the 2001 census of the Bhiwandi-Nizampur Municipal Corporation area,
the population is 598,703. The approximate geographical area is 300 sq kms.
Bhiwandi has a major rail link and a national highway that connect it to other cities.
The nearest airport is in Mumbai.
Bhiwandi has a good industrial base with textiles constituting the main industry. Out
of 19 lacs looms in India, around 6 lacs are estimated to be in Bhiwandi. The
industrial growth can be considered a spill over from Mumbai. The Bhiwandi circle
serviced by MSEDCL is around 40 sq kms.

Bhiwandi Circle– Information docket
2
1.2 Consumer related data
MSEDCL (Bhiwandi) circle is divided into two sub-divisions viz, Bhiwandi Urban I
Division and Bhiwandi Urban II Division. Urban I division has four subdivisions and
Urban II Division has three subdivisions. The total no of consumers serviced in the
circle as on December 31, 2004 according to the information submitted by the
MSEDCL, IT department are 1,73,883
1.2.1 Consumer break up as on December 31, 2004
The consumer break up of Bhiwandi Circle as on December 31, 2004 is as under:
Source : MSEDCL, IT Department
Consumer wise breakup (march 2005)
52%
13%3%
13%
18% 1%
RESIDENTIAL (KW) COMMERCIAL (KW) INDUSTRIAL (HP)
POWERLOOM COMMECIAL POWERLOOM METERED Others

Bhiwandi Circle– Information docket
3
1.2.2 Energy sales to consumers of different categories. The consumers of Bhiwandi Circle are classified into different categories as per their
consumption pattern.
(Sales in MUs)
(Sales in MUs)
Source : MSEDCL, IT Department
LT Category `03-04 `04-05LD-1 DOMESTIC 68.96 69.94
L D - 2 C O M M E R C I A L 47.09 85.09LD-2 C INEMA 0.36 0.43
LTP-G IND. 85 .18 110.10
L T P - G P O W E R L O O M 611.08 785.03
L T - P W W ( U ) 0 .03 0.03L T - P W W ( R ) 0 .14 0.13
L T - A G . 0 .32 0.51
L T - P O U L T R Y 0.20 0.18
ST.L IGHT 3.41 4.65T E M P . C O N N . 0.14 0.15
P . D . C O N S U M E R S 0.97 -0.49
L T T o t a l 817.87 1055.74
H T C a t e g o r y ` 0 3 - 0 4 ` 0 4 - 0 5H T P - I I N D . ( B M R / P M R ) 8 3 1 0 2H T P - I I I N D . ( O T H E R S ) 0 0H T P - I I I P W W ( B M R / P M R ) 2 4 2 2 5 9H T P - V R A I L W A Y T R A C . 1 0 1 1
H T P - V I I I P O U L T R Y / B R . 0 0
H T T o t a l 3 3 4 3 7 1

Bhiwandi Circle– Information docket
4
Sales break up for (04-05)
The break up of sales for different categories of consumers is depicted in the graph
below.
Source : MSEDCL, IT Department
1.3 Employee Related data
The employees of MSEDCL are classified into different pay groups and categories.
There are four pay groups in which the employees are classified into, namely, pay
group I, pay group II, pay group III (state wise and circle wise) and pay group IV.
1.3.1 Employees filled posts group wise The division of number of filled posts at Bhiwandi circle as on March 31, 2005 is 586.
The group wise break up is given as under
Sales Category wise(04-05)
5% 6%8%
55%
7%
18%1%
LD-1 DOMESTIC LD-2 COMMERCIAL LTP-G IND.LTP-G POWERLOOM HTP-I IND.(BMR/PMR) HTP-III PWW(BMR/PMR)others

Bhiwandi Circle– Information docket
5
Source : Bhiwandi Circle, GAD
1.3.2 Employees engaged in Technical and Non - technical jobs as on March 31, 2005
The pe rcentage wise break up of technical and non technical staff of Bhiwandi Circle
as on March 31, 2005 is described in the picture below-
Source : Bhiwandi Circle, GAD
Employees engaged in administration work have not been taken into consideration
while assessing technical and non-technical job.
1.3.3 The Organisation Chart The picture below shows the organisation chart of Bhiwandi Circle. It depicts the
various hierarchies and flow of authority in the organisation. The figures in brackets
represent the number of filled posts as on March 31, 2005
No. of Employees (March 05)12 40 21
225
288
Pay Group - I Pay Group - IIPay Gr. - III (Statewise) Pay Gr. - III (Circlewise)Pay Group-IV
Staff Details
31%
69%
Technical staff Non technical staff

Bhiwandi Circle– Information docket
6
Source : Bhiwandi Circle, GAD
Bhiwandi Circle
TECHNICAL AND LINE STAFF
ACCOUNTS
GENERAL ADMINISTRATION (GAD)
Superintending Engineers(1)
Administration Officer(1)
Asstt.
Engineer(10)
Jr.
Engineer(25)
Establishment
superintendent(1)
Divisional Accountant(5)
Executive Engineer(2
Deputy Executive Engineer(7)
Accounts Officer(1)
PAY GROUP I
Sub engineer(13)
Head Clerk(3)
Asstt. Accountant(5)
others(72) Upper Division Clerk(19) Upper Division Clerk(4)
Lower Division Clerk(90) Lower Division Clerk(20)
Asstt.Lineman(97) Line helper(152)
Peons(6), serve all depts.
Others(16)
PAY GROUP II
PAY GROUP III STATE WISE
PAY GROUP III CIRCLE WISE

Bhiwandi Circle– Information docket
7
1.4 Technical data
The entire network asset snapshot of the Bhiwandi region is attached as Annexure II.
1.4.1 Overview of the technical system A snapshot of the technical system of Bhiwandi Circle is given below
EHV S/S 5 No.s22 kV Express Feeders 5 No.s22 kV Feeders 39 No.sHT overhead lines 712 kmHT poles 9968 No.sHT underground cable 7 kmLT overhead lines 956 kmLT poles 17,208 No.sLT underground cable 8 km22 kV / 0.433 kV transformers 2,084
Network Assets
Source : Bhiwandi Circle, Technical dept
1.4.2 Load details Details of the load for the circle is presented
Load data (In MVA)Total Connected Load 750
Maximum Demand 675Existing Load Capacity 545
Pending Demand from New Service connections 50
Present Shortfall 130
Source : Bhiwandi Circle, Technical dept

Bhiwandi Circle– Information docket
8
1.4.3 Particulars of sub stations
The substation details of Bhiwandi Circle are given as under:
Name of SubstationTotal Installed
Capacity Total Demand100KV/22KV, Bhiwandi S/S 150 MVA 235 MVA220/100/22KV, Temghar S/S 200 MVA 175 MVA220 KV/22KV, Kamba S/S 100 MVA 120MVA220/22 KV, Padga S/S 125 MVA 120MVA220/ 22 KV, Colourchem S/S 020 MVA 020 MVATotal Capacity 595 MVA 675 MVA* Quota for Bhiwandi Circle
Source : Bhiwandi Circle, Technical dept
The demand of the circle per sub station is higher than the installed capacity in
Bhiwandi, Temghar and kamba sub stations.
1.4.4 Demand and installed capacity in Bhiwandi The demand and installed capacity for the circle are as below
Source : Bhiwandi Circle, Technical dept
Year wise Connected load Vs Demand
0100200300400500600700800
1998 1999 2000 2001 2002 2003 2004 2005
MV
A
Connected load Demand
Bhiwandi Circle– Information docket
9
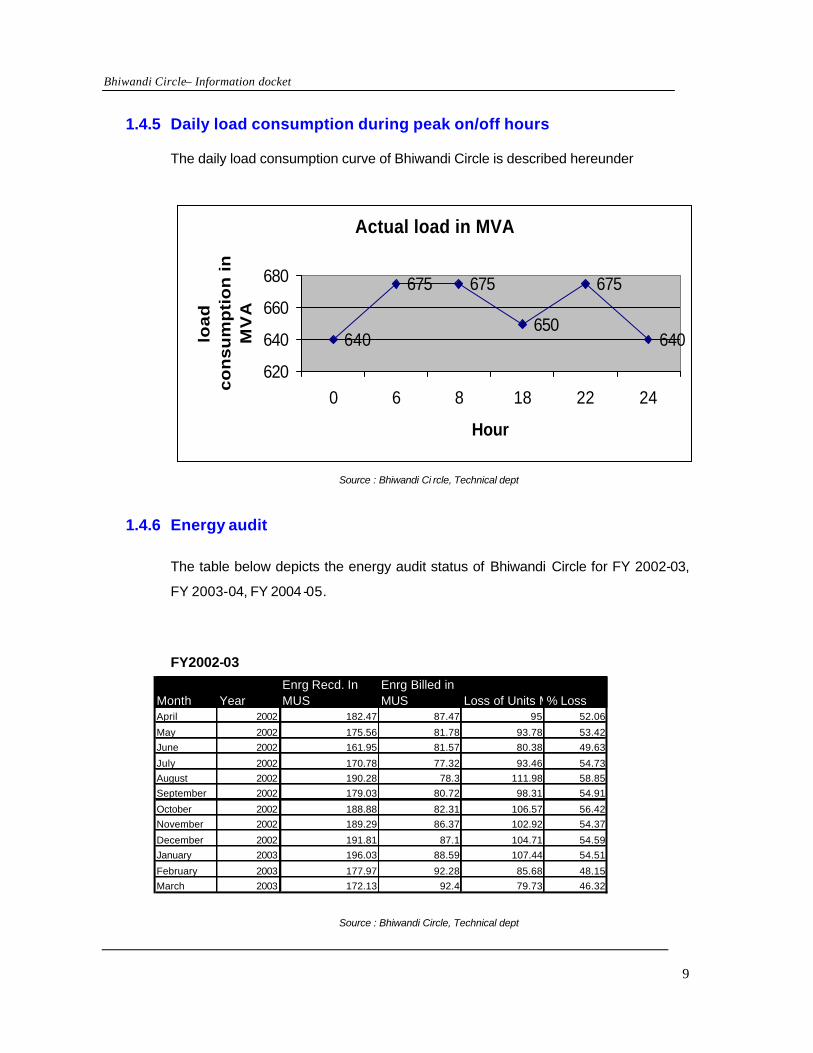
1.4.5 Daily load consumption during peak on/off hours The daily load consumption curve of Bhiwandi Circle is described hereunder
Actual load in MVA
640
675 675
650
675
640
620
640
660
680
0 6 8 18 22 24
Hour
loa
d
co
ns
um
pti
on
in
M
VA
Source : Bhiwandi Ci rcle, Technical dept
1.4.6 Energy audit
The table below depicts the energy audit status of Bhiwandi Circle for FY 2002-03,
FY 2003-04, FY 2004-05.
FY2002-03
Source : Bhiwandi Circle, Technical dept
Month YearEnrg Recd. In MUS
Enrg Billed in MUS Loss of Units MUS% Loss
April 2002 182.47 87.47 95 52.06
May 2002 175.56 81.78 93.78 53.42June 2002 161.95 81.57 80.38 49.63
July 2002 170.78 77.32 93.46 54.73August 2002 190.28 78.3 111.98 58.85September 2002 179.03 80.72 98.31 54.91
October 2002 188.88 82.31 106.57 56.42November 2002 189.29 86.37 102.92 54.37
December 2002 191.81 87.1 104.71 54.59January 2003 196.03 88.59 107.44 54.51
February 2003 177.97 92.28 85.68 48.15March 2003 172.13 92.4 79.73 46.32

Bhiwandi Circle– Information docket
10
FY2003-04
Source : Bhiwandi Circle, Technical dept
FY2004-05
Source : Bhiwandi Circle, Technical dept
Month YearEnergy Recd. In (MU) Enrg Billed in MUS
Loss of Units MUS % Loss
April 2004 194.21 112.89 81.32 41.87
May 2004 188.86 110.71 78.15 41.38June 2004 179.74 112.87 66.87 37.2July 2004 182.78 111.01 71.77 39.26
August 2004 175.99 119.38 56.6 32.16September 2004 182.96 118.52 64.44 35.22
October 2004 195.38 123.02 72.36 37.04November 2004 179.07 119.4 59.67 33.32
December 2004 199.43 124.69 74.73 37.47January 2005 203.85 127.8 76.06 37.31
February 2005 190.84 126.3 64.54 33.82March 2005 212.38 124.05 88.33 41.59
Month YearEnrg Recd. In MUS
Enrg Billed (MU) Loss of Units MUS% Loss
April 2003 92.37 61.12 31.26 33.84
May 2003 143.09 76.11 66.99 46.81June 2003 169.72 86.25 83.47 49.18
July 2003 184.79 88.53 96.25 52.09August 2003 189.01 101.23 87.78 46.44September 2003 185.71 99.01 86.7 46.69
October 2003 190.23 102.95 87.29 45.88November 2003 186.6 106.36 80.24 43
December 2003 197.81 104.96 92.85 46.94January 2004 202.79 106.37 96.43 47.55
February 2004 182.79 113.86 68.93 37.71March 2004 196.33 107.91 88.41 45.03

Bhiwandi Circle– Information docket
11
1.4.7 Overview of distribution losses
Details of month wise distribution losses of Bhiwandi Circle in 2004-05 are given
below:
Distribution Losses for 2004-05
42.09 42.6236.70
39.56
31.7835.51 38.21
33.3037.49 40.02
33.25
41.39
0
10
20
30
40
50
Apr May Jun Jul Aug Sep Oct Nov Dec Jan Feb Mar
Month
% L
oss
Source : MSEDCL, IR department
1.4.8 Distribution Transformer Metering data
Information on distributor transformers of Bhiwandi Circle is presented herewith:
Source : Bhiwandi Circle, Technical dept
N o . o f D T C ' s M e t e r e d 1 9 5 0N o . o f D T C ' s M e t e r F a u l t y 1 1 6 3M e t e r e d l o c a l l y d a m a g e d / b r o k e n 7 1 4
E A C o r r e c t l y d o n e a s o n A u g u s t 0 4 3 1 5P o w e r l o o m a s s e s s e d u n i t s a s p e r M E R C 7 0 %
P o w e r l o o m B i l l e d U n i t s a s p e r r e a d i n g 3 0 %
D T C E n e r g y A u d i t

Bhiwandi Circle– Information docket
12
1.4.9 Distribution transformer failures
Data on failures of distribution transformers of Bhiwandi Circle as against those in
service is g iven under:
Distribution Tranformer failure
1950 2065 2084
765 653 833
0
500
10001500
2000
2500
2002-03 2003-04 2004-05
year
No
of
tran
sfo
rmer
s
In Service Failures
Source : Bhiwandi Circle, Technical dept
1.5 Commercial data
1.5.1 Energy input and energy billed Information on energy input as against energy billed of Bhiwandi Circle is given under:
Energy Input vs Energy Sold
2,190 2,220 2,116 2,285
859 1,011 1,1521,427
0
500
1,000
1,500
2,000
2,500
2001-02 2002-03 2003-04 2004-05
Energy Input (Mus) Energy Sales (MUs)
Source : MSEDCL, IT Department

Bhiwandi Circle– Information docket
13
1.5.2 Revenue input and revenue billed
Data on revenue realised as against revenue sold of Bhiwandi Circle is shown in the
graph below:
Revenue billed vs Revenue collected
385.12 364.71425.18
352.79
242221.87247.82245.83
0100200300400500
2001-02 2002-03 2003-04 2004-05year
Rs.
cro
res
Revenue billed (Rs.Cr.) Revenue Collected (Rs. Cr.)
Source : MSEDCL, IT Department
1.5.3 Average per unit realisation
The average realisation per unit of Bhiwandi Circle is shown below:
Average Realisation
4.48
3.61 3.69
2.55
-
1.00
2.00
3.00
4.00
5.00
2001-02 2002-03 2003-04 2004-05 (Dec)
Year
Rs/
kWh
Source : MSEDCL, IT Department

Bhiwandi Circle– Information docket
14
1.5.4 Collection efficiency Details of collection efficiency of Bhiwandi circle are as under
Collection Efficiency
63.83%
67.95%
56.92%
62.89%
50%
55%
60%
65%
70%
2001-02 2002-03 2003-04 2004-05
Year
%
Source : MSEDCL, IT Department
1.5.5 Metering Data on meters in stock at Bhiwandi Circle are as below
Single Phase Opening balance Additions UtilisationClosing Balance
Division I 726 4754 544 4936Division II 749 7153 1272 6630 Sub-Total 1475 11907 1816 115663PhaseDivision I 194 460 194 460Division II 249 430 536 143 Sub-Total 443 890 730 603
Status of single phase and 3 phase meters as on March 2005
Source : Bhiwandi Circle, IT Processing

Bhiwandi Circle– Information docket
15
Details of working condition of meters of Bhiwandi Circle are given below
Source : Bhiwandi Circle, IT Processing
Normal Faulty Others Total BilledBhiwandi Division I Bhiwandi Subdn I 4824 2909 1915 10618Bhiwandi Subdn II 5001 1752 3249 9213Bhiwandi Subdn III 10195 5214 4981 18700Bhiwandi Division I 3373 195 3178 4236Bhiwandi Division II 0 Bhiwandi Subdn IV 7075 183 6892 9572Bhiwandi Subdn V 9795 526 9269 15270Bhiwandi Subdn VI 6375 2919 3456 12686Bhiwandi division II 830 137 693 1312Bhiwandi Subdn VII 8601 1784 6817 13600
Metering data(Feb 2005)

Bhiwandi Circle– Information docket
16
1.6 Financial Data
Financial information of Bhiwandi Circle is captured below:
1.6.1 Actual Subsidy Details Information on Subsidy of Bhiwandi Circle is given below
(Rs. in crores)
Source : Bhiwandi Circle, Accounts Dept
Subsidy2004-05(provisional) 2003-04 2002-03 2001-02
By Government of Maharashtra Powerloom consumers 39.42 62.92 61.1 NIL
Agricultural Consumers NIL 0.16 0.09 NILTotal 39.42 63.08 61.19 NIL
Bhiwandi Circle– Information docket
17
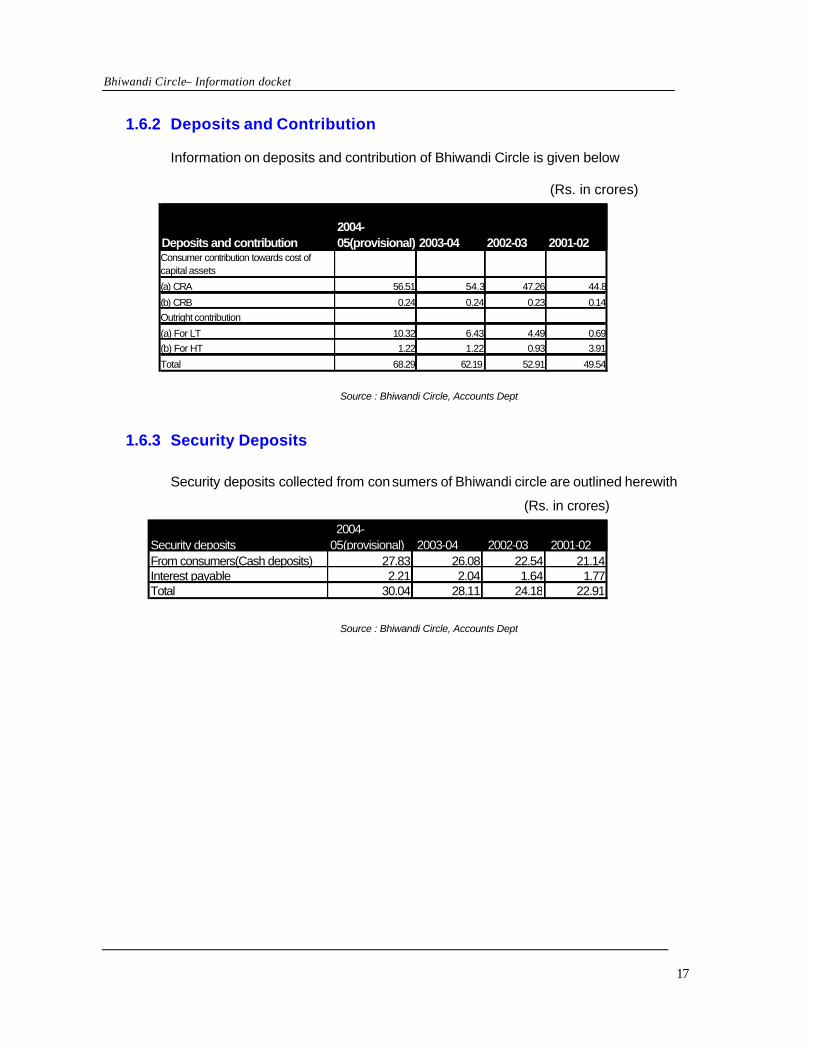
1.6.2 Deposits and Contribution Information on deposits and contribution of Bhiwandi Circle is given below
(Rs. in crores)
Source : Bhiwandi Circle, Accounts Dept
1.6.3 Security Deposits
Security deposits collected from consumers of Bhiwandi circle are outlined herewith
(Rs. in crores)
Source : Bhiwandi Circle, Accounts Dept
Deposits and contribution2004-05(provisional) 2003-04 2002-03 2001-02
Consumer contribution towards cost of capital assets (a) CRA 56.51 54.3 47.26 44.8
(b) CRB 0.24 0.24 0.23 0.14Outright contribution
(a) For LT 10.32 6.43 4.49 0.69(b) For HT 1.22 1.22 0.93 3.91
Total 68.29 62.19 52.91 49.54
Security deposits 2004-05(provisional) 2003-04 2002-03 2001-02
From consumers(Cash deposits) 27.83 26.08 22.54 21.14Interest payable 2.21 2.04 1.64 1.77Total 30.04 28.11 24.18 22.91

Bhiwandi Circle– Information docket
18
1.6.4 Non-tariff Income
Data regarding the non tariff income of Bhiwandi circle is given below:
(Rs. in crores)
Source : Bhiwandi Circle, Accounts Dept
Non tariff income2004-05(provisional) 2003-04 2002-03 2001-02
Delayed payment from Consumers 3.7 5.88 0.4 4.07
Interest from consumers 65.59 59.31 53.92 31.24Others 0.04 0.03 0.04 0.03Total 69.33 65.22 54.36 35.33

Bhiwandi Circle– Information docket
19
1.6.5 Collection Arrears
The collection arrears of Bhiwandi circle amounted to Rs. 746.48 crores as on December 31, 2004. The aging analysis of arrears is as under
Aging of Arrears2%
4%
4%
87%
3%
Upto 6 months 6 - 12 Months 1 - 2 Years 2 - 3 Years More than 3 Years
Source : MSEDCL, IT Department
Aging of arrears as on Dec 31, 2004 Rs Crores
Upto 6 months 25.536 - 12 Months 16.291 - 2 Years 32.302 - 3 Years 31.69More than 3 Years 640.67
Total 746.48 Source : MSEDCL, IT Department
The category wise break up of arrears of Bhiwandi circle in percentage is as below
Category Wise ArrearsLD-1
DOMESTIC17%
LD-2 COMMERCIAL
12%
LTP-G IND.8%
OTHERS2%
P.D.CONSUMERS
28%
LTP-G POWERLOOM
33%
Source : MSEDCL, IT Department

Bhiwandi Circle– Information docket
20
Category Name Rs CroresLD-1 DOMESTIC 125.46LD-2 COMMERCIAL 88.30LTP-G IND. 59.28LTP-G POWERLOOM 253.70P.D.CONSUMERS 207.15OTHERS 12.60
TOTAL 746.48 Source : MSEDCL, IT Department

Bhiwandi Circle– Information docket
21
1.6.6 Collection Centres The details of the collection centres of Bhiwandi Circle are as under:
Source : Bhiwandi Circle, Accounts Dept
The funds from the Thane District Co-op Bank is transferred to MSEDCL account at
State Bank of India, Bhiwandi, and fro m then on is transferred to State bank of India,
at Fort, Mumbai.
The collections from the Chandrakanth Haribhade sir Co –op society are deposited
into the MSEDCL account at State Bank of India, Bhiwandi.
T D C C B a n k a t P u r n a
C h a n d r a k a n t h H a r e b h a d e S i r c o - o p c r e d i t s o c i e t y
D i v i s i o n I ( 4 ) D i v i s i o n I I ( 3 )
N o . 1 O p p o s i t e B N M C o f f i c e
N o . 2 O p p o s i t e B N M C o f f i c e
N o . 3 O p p o s i t e H o t e l U t s a v , K a l y a n R d .
N o . 4 N a r p o l i n e a r w e i g h b r i d g e
N o . 5 K a l y a n R d . n e a r p o w e r s u b- s t n
N o . 6 N e x t t o k u r l a b r i d g e
N o . 7 N e x t t o k u r l a b r i d g e
M S E B ( 7 )
N O N M S E B ( 3 )
T h a n e D i s t . C o . o p B a n k a t P a d g a o n
C o l l e c t i o n C e n t r e s i n B h i w a n d i R e g i o n ( 1 0 )

Bhiwandi Circle– Information docket
22
Annexure :-I Location of Bhiwandi
The location of Bhiwandi is depicted in the picture below

Bhiwandi Circle– Information docket
23
Annexure :-II Bhiwandi Technical Network