Embed Size (px)
Citation preview

8/3/2019 Bharti Airtel Result Updated
http://slidepdf.com/reader/full/bharti-airtel-result-updated 1/13
Please refer to important disclosures at the end of this report 1
(` cr) 3QFY12 2QFY12 % chg (qoq) 3QFY11 % chg (yoy)
Net sales 18,477 17,276 6.9 15,756 17.3
EBITDA 5,958 5,815 2.5 4,982 19.6
EBITDA margin (%) 32.2 33.7 (141)bp 31.6 63bp
PAT 1,011 1,027 (1.5) 1,304 (22.4)
Source: Company, Angel Research
Bharti Airtel (Bharti) reported a mixed performance for 3QFY2012, with revenue
coming in-line with our as well as street expectations. The company, however,
disappointed on the operating and profitability fronts due to higher depreciation
and amortization expenses. Also, minutes of usage (MOU) of mobile – India as
well as Africa business declined by 1.0% and 2.5% qoq to 419min and 125min,
respectively. We maintain our Neutral view on the stock.
Result highlights: For 3QFY2012, Bharti’s consolidated revenue stood at
` 18,477cr, up 6.9% qoq. Revenue from mobile services for India came in at
` 10,176cr, up 4.0% qoq on the back of a 3.2% qoq increase in average revenue
per minute (ARPM) to ` 0.45/min. However, MOU declined by 1.0% qoq due to
slow traffic growth. Zain Africa’s contribution to revenue stood at ` 5,358cr, up by
whopping 16.7% qoq, aided by INR depreciation and 2.5mn net subscriber
additions. EBITDA margin of mobile India as well as Africa business increased by
0.18bp and 0.47bp qoq to 33.8% and 26.7%, respectively. However, EBITDA
margin of all the other business segments declined sharply, which led to a 141bp
qoq decline in Bharti’s consolidated EBITDA margin to 32.2%. PAT came in at ` 1,011cr, down 1.5% qoq, negatively impacted by higher depreciation costs of
` 3,585cr in 3QFY2012 vs. ` 3,184cr in 2QFY2012 and higher tax rates.
Outlook and valuation: Bharti is on its way to turnaround its Africa business by
bringing down its network operating expenditure by outsourcing various
network-related developments. Thus, we expect the combination of stable KPIs
and cost efficiencies to drive the EBITDA margin for the Africa business to 26.6%
and 27.0% by FY2012 and FY2013, respectively. We expect Bharti’s Indian
and African mobile subscriber base to post a CAGR of 8.2% and 17.4% over
FY2011–13E to 189.9mn and 60.9mn subscribers, respectively. However, key
downside risks such as 1) uncertainty in regulatory outcome; 2) pricing scenario in
Africa operations; and 3) delay in return on investments made in 3G launches,
still loom. We maintain our Neutral rating on the stock.
Key financials (Consolidated, IFRS)
Y/E March (` cr) FY2009 FY2010 FY2011 FY2012E FY2013E
Net sales 36,962 41,847 59,467 71,601 80,983
% chg 36.8 13.2 42.1 20.4 13.1
Net profit 8,615 9,108 6,035 4,705 6,927
% chg 27.3 5.7 (33.7) (22.0) 47.2
EBITDA margin (%) 41.4 40.3 33.7 32.8 33.3
EPS (`) 22.7 24.0 15.9 12.4 18.2
P/E (x) 15.6 14.7 22.3 28.6 19.4
P/BV (x) 4.4 3.2 2.8 2.5 2.3
RoE (%) 28.3 21.6 12.4 8.9 11.6
RoCE (%) 23.3 17.6 8.2 8.3 10.9
EV/Sales (x) 3.8 3.3 3.3 2.8 2.3
EV/EBITDA (x) 9.2 8.1 9.7 8.5 7.0
Source: Company, Angel Research
NEUTRALCMP ` 354
Target Price -
Investment Period -
Stock Info
Sector
Bloomberg Code
Shareholding Pattern (%)
Promoters 68.5
MF / Banks / Indian Fls 8.2
FII / NRIs / OCBs 17.5
Indian Public / Others 5.8
Abs. (%) 3m 1yr 3yr
Sensex 0.8 (0.4) 90.4
Bharti Airtel (10.9) 6.2 9.4
Face Value ( `
)BSE Sensex
Nifty
Reuters Code
134,435
0.6
445/309
480,795
Telecom
Avg. Daily Volume
Market Cap ( ` cr)
Beta
52 Week High / Low
517,707
5,368
BRTI.BO
BHARTI.IN
Ankita Somani
022-39357800 Ext: 6819
Bharti Airtel
Performance highlights
3QFY2012 Result Update | Telecom
February 8, 2012

8/3/2019 Bharti Airtel Result Updated
http://slidepdf.com/reader/full/bharti-airtel-result-updated 2/13
Bharti Airtel | 3QFY2012 Result Update
February 8, 2012 2
Exhibit 1: 3QFY2012 – Financial performance (Consolidated, IFRS)
(` cr) 3QFY12 2QFY12 % chg (qoq) 3QFY11 % chg (yoy) 9MFY12 9MFY11 % chg (yoy)
Net revenue 18,477 17,276 6.9 15,756 17.3 52,736 43,202 22.1
Operating expenditure 12,518 11,461 9.2 10,774 16.2 35,256 28,685 22.9EBITDA 5,958 5,815 2.5 4,982 19.6 17,479 14,517 20.4
Depreciation & amortization 3,585 3,184 12.6 2,711 32.2 9,900 7,236 36.8
EBIT 2,374 2,631 (9.8) 2,271 4.5 7,580 7,281 4.1
Interest charges 788 1,119 (29.6) 747 5.5 2,761 1,498 84.3
Non operating expenditure - - - 0 - - (23) -
Other income - - 26 - 98
PBT 1,586 1,513 4.9 1,550 2.3 4,818 5,902 (18.4)
Income tax 559 490 14.0 337 65.9 1,563 1,279 22.1
PAT 1,028 1,023 0.5 1,213 (15.3) 3,256 4,623 (29.6)
Share in earnings of associate (6) - - (6) (7)
Minority Interest 11 (4) (345.5) (90) (111.9) (3) (77) (95.6)
Adj. PAT 1,011 1,027 (1.5) 1,304 (22.4) 3,253 4,707 (30.9)
EPS ( ` ) 2.7 2.7 (1.6) 3.4 (22.4) 5.4 12.4 (56.7)
EBITDA margin (%) 32.2 33.7 (141)bp 31.6 63bp 33.1 33.6 (46)bp
EBIT margin (%) 12.8 15.2 (238)bp 14.4 (157)bp 14.4 16.9 (248)bp
PAT margin (%) 5.5 5.9 (47)bp 8.3 (279)bp 6.2 10.9 (470)bp
Source: Company, Angel Research
Exhibit 2: Actual vs. Angel estimates
(` cr) Actual Estimate % Var.
Net sales 18,477 18,133 1.9
EBITDA margin (%) 32.2 34.1 (181)bp
PAT 1,011 1,445 (30.0)
Source: Company, Angel Research
In-line revenue growth
For 3QFY2012, Bharti reported modest revenue growth of 6.9% qoq, with
consolidated revenue coming in at ` 18,477.
Exhibit 3: Revenue break-up (Business segment wise)
Business segment (` cr) 3QFY12 2QFY12 % chg (qoq) 3QFY11 % chg (yoy)
Mobile services – India & South Asia 10,176 9,783 4.0 9,146 11.3
Mobile services – Africa 5,358 4,591 16.7 4,044 32.5
Telemedia services 913 953 (4.2) 907 0.7
Enterprise services 1,188 1,104 7.6 1,050 13.1
Passive infrastructure services 2,439 2,377 2.6 2,197 11.0
Others 399 406 (1.7) 195 104.9
Eliminations 1,997 1,937 3.1 1,783 12.0
Net revenue 18,477 17,276 6.9 15,756 17.3
Source: Company, Angel Research

8/3/2019 Bharti Airtel Result Updated
http://slidepdf.com/reader/full/bharti-airtel-result-updated 3/13
Bharti Airtel | 3QFY2012 Result Update
February 8, 2012 3
Mobile business – India and South Asia: Revenue of the mobile business – India
and South Asia – grew by 4.0% qoq to ` 10,176cr on the back of 3.2% qoq growth
in ARPM to ` 0.45/month. However, MOU reported a 1.0% qoq dip to 419mn due
to lower growth in traffic. Revenue of mobile – India and South Asia – business wasalso impacted because of the slight decline in value-added services (VAS) share
(even when 3G services are launched in all the circles and this was seasonally a
strong quarter for telecom companies), which decreased to 14.3% in 3QFY2012
from 14.5% in 2QFY2012. All this led to 2.2% qoq growth in ARPU to
` 187/month. In 3QFY2012, the company added 2.87mn subscribers in this
segment, taking its total subscriber base to 175.6mn.
Exhibit 4: Trend in MOU (qoq)
Source: Company, Angel Research
Exhibit 5: Trend in VAS share (qoq)
Source: Company, Angel Research
Exhibit 6: Trend in ARPM (qoq)
Source: Company, Angel Research
Exhibit 7: Trend in ARPU (qoq)
Source: Company, Angel Research
Mobile – Africa business: For 3QFY2012, Zain Africa’s revenue stood at ` 5,358cr,
up 16.7% qoq, aided by addition of 2.5mn subscribers, taking its total subscriber
base to 50.9mn and a 0.1% qoq increase in ARPM to US¢5.7/min. However,
MOU declined by 2.5% qoq to 125min, which led to a 2.3% qoq fall in ARPU to
US$7.1/month.
(0.9)
4.9
2.7
(5.5)
(1.1)
(0.1)(0.8)
(4.9)
(1.0)
(8)
(6)
(4)
(2)
0
2
4
6
380
400
420
440
460
480
500
3 Q F Y 1 0
4 Q F Y 1 0
1 Q F Y 1 1
2 Q F Y 1 1
3 Q F Y 1 1
4 Q F Y 1 1
1 Q F Y 1 2
2 Q F Y 1 2
3 Q F Y 1 2
( % )
( m i n s )
MoU qoq growth
11.0
11.8 11.6
12.7
13.8
15.014.6 14.5 14.3
9
10
11
12
1314
15
16
3 Q F Y 1 0
4 Q F Y 1 0
1 Q F Y 1 1
2 Q F Y 1 1
3 Q F Y 1 1
4 Q F Y 1 1
1 Q F Y 1 2
2 Q F Y 1 2
3 Q F Y 1 2
( % )
VAS share
(7.8)
(9.1)
(4.6)
(0.9) (0.6)
(2.4)
(0.8)0.9
3.2
(12)
(8)
(4)
0
4
0.2
0.4
0.6
3 Q F Y 1 0
4 Q F Y 1 0
1 Q F Y 1 1
2 Q F Y 1 1
3 Q F Y 1 1
4 Q F Y 1 1
1 Q F Y 1 2
2 Q F Y 1 2
3 Q F Y 1 2
( % )
( ` / m i n )
ARPM qoq growth
(8.6)
(4.6)
(2.0)
(6.3)
(1.6)(2.5) (1.8)
(3.8)
2.2
(12)
(8)
(4)
0
4
150
200
250
3 Q F Y 1 0
4 Q F Y 1 0
1 Q F Y 1 1
2 Q F Y 1 1
3 Q F Y 1 1
4 Q F Y 1 1
1 Q F Y 1 2
2 Q F Y 1 2
3 Q F Y 1 2
( % )
( ` / m o n t h )
ARPU qoq growth

8/3/2019 Bharti Airtel Result Updated
http://slidepdf.com/reader/full/bharti-airtel-result-updated 4/13
Bharti Airtel | 3QFY2012 Result Update
February 8, 2012 4
Exhibit 8: Operating metrics for Zain Africa
3QFY12 2QFY12 % chg qoq 3QFY11 % chg yoy
ARPM (US¢/min) 5.7 5.7 0.1 6.1 (6.4)
MOU (min) 125 128 (2.5) 120 3.5 ARPU (US$/month) 7.1 7.3 (2.3) 7.3 (3.0)
Subscriber base (mn) 50.9 48.4 5.2 42.1 20.9
Source: Company, Angel Research
Telemedia services: Revenue of the telemedia business declined by 4.2% qoq to
` 913cr due to a 4.1% qoq decline in its ARPU to ` 916 in 3QFY2012 from ` 955 in
2QFY2012, as this is seasonally a weak quarter for the telemedia business. Also,
the total subscriber base of Bharti in this business declined by 11 to 3,317.
Currently, the company derives ~54% of the revenue of telemedia services from
data services (non voice-based services).
Exhibit 9: Telemedia – Subscriber base and ARPU trend
Source: Company, Angel Research
Enterprise services: Revenue of the enterprise services segment grew by 7.6% qoq
to ` 1,188cr in 3QFY2012.
Passive infrastructure services: Revenue growth in the passive infrastructure services
segment stood at 2.6% qoq to ` 2,439cr. Tenancy ratio improved to 1.91 in3QFY2012 from 1.89 in 2QFY2012.
964
937
961
954
934
934
952
955916
600
800
1000
1,500
2,000
2,500
3,000
3,500
3 Q F Y 1 0
4 Q F Y 1 0
1 Q F Y 1 1
2 Q F Y 1 1
3 Q F Y 1 1
4 Q F Y 1 1
1 Q F Y 1 2
2 Q F Y 1 2
3 Q F Y 1 2
( ` )
( i n 0 0 0 ' s )
Telemedia subscribers (in 000's) ARPU

8/3/2019 Bharti Airtel Result Updated
http://slidepdf.com/reader/full/bharti-airtel-result-updated 5/13
Bharti Airtel | 3QFY2012 Result Update
February 8, 2012 5
Exhibit 10: Trend in passive infrastructure business (qoq)
Source: Company, Angel Research
Margins decline
During the quarter, at the operational front, EBITDA margin of mobile – India and
South Asia – business and mobile – Africa business grew by 0.18bp and 0.47bp
qoq to 33.8% and 26.7%, respectively. However, EBITDA margin of all the other
business segments declined sharply, with margin of telemedia services, enterprise
services and passive infrastructure business decreasing by 541bp (steep due to
migration in billing system), 457bp (due to disruptions occurred on account of fire
at one of its data centers) and 11bp qoq to 38.8%, 16.9% and 37.3%, respectively.
All this led to a 141bp qoq decline in Bharti’s consolidated EBITDA margin to32.2%. This decline is attributed to high SG&A expenses and access charges.
Exhibit 11: Segment-wise EBITDA margin trend (qoq)
Source: Company, Angel Research
1.65 1.65 1.681.73
1.77 1.79 1.81
1.75 1.78 1.80 1.831.87 1.89 1.91
1.0
1.2
1.4
1.6
1.8
2.0
0
300
600
900
1,200
1 Q F Y 1 1
2 Q F Y 1 1
3 Q F Y 1 1
4 Q F Y 1 1
1 Q F Y 1 2
2 Q F Y 1 2
3 Q F Y 1 2
T e n a n c y ( x )
N o . o f t o w e r s ( i n 0
0 ' s )
Bharti Infratel (BTIL) Indus BTIL tenancy Indus tenancy
35.2 34.933.3
34.2 33.7 33.8
46.144.6 45.2 45.5 44.2
38.8
24.721.5
25.7
22.1
21.516.9
37.1 38.6 37.0 37.7 37.537.3
15
25
35
45
55
2QFY11 3QFY11 4QFY11 1QFY12 2QFY12 3QFY12
( % )
Mobile services-India & South Asia Telemedia services
Enterprise services Passive infrastructure services

8/3/2019 Bharti Airtel Result Updated
http://slidepdf.com/reader/full/bharti-airtel-result-updated 6/13
Bharti Airtel | 3QFY2012 Result Update
February 8, 2012 6
Exhibit 12: Opex break-up (qoq)
Source: Company, Angel Research
During the quarter, Bharti’s consolidated net profit stood at ` 1,011cr, down 1.5%
qoq, negatively impacted by higher depreciation costs of ` 3,585cr in 3QFY2012
vs. ` 3,184cr in 2QFY2012 (on account of a one-off item) and higher tax rate of
35.2% vs. 32.4% in 2QFY2012.
Outlook and valuation
Bharti is on its way to turnaround its Africa business by bringing down its network
operating expenditure by outsourcing various network-related developments.
The company has been consistently adding above 2.0mn subscribers per quarter
in its Africa business. In terms of KPIs, the company has managed to keep its ARPM
constant at US¢5.7/min and is expecting prices to remain stable in the African
market. However, MOU, after reporting a continuous increase since the past six
quarters, posted a decline of 2.5% to 125min in this quarter. Thus, we expect the
combination of stable KPIs and cost efficiencies to drive the EBITDA margin of the
Africa business to 26.6% and 27.0% by FY2012 and FY2013, respectively, from
25.3% in FY2011.
On the domestic business front, the company undertook price hikes of 20% for
on-net prepaid calls for all its 22 circles. This has gradually pushed ARPM to
` 0.45/min in 3QFY2012 from ` 0.43/min in 2QFY2012. We expect Bharti’s Indian
and African mobile subscriber base to post a CAGR of 8.2% and 17.4% over
FY2011–13E to 189.9mn and 60.9mn subscribers, respectively. In addition, we
expect VAS share to inch up due to surging demand for non-SMS data services to
further comfort the company’s ARPM. Bharti’s MOU is expected to remain soft
because of the various free minute packages offered by competition as well as
some moderation in volumes due to increased rates.
The strong cashflow generation on account of 1) the expected improvement in
operating profitability due to price increases in the domestic market and
cost-efficiency measures in Africa business and 2) lower capex needs of ~US$3bn
annually in future are expected to help the company’s debt repayment abilities.
However, key downside risks such as 1) uncertainty in regulatory outcome;
2) pricing scenario in Africa operations; and 3) delay in return on investments
made in 3G launches, still loom. We remain Neutral on the stock.
12.4 12.9 13.3 12.6 13.2 13.9
21.8 21.4 21.9 21.8 22.5 22.7
8.2 8.6 8.5 8.7 8.8 8.45.7 5.6 5.7 5.4 5.3 5.2
18.2 19.9 17.1 17.7 16.6 16.2
33.7 31.6 33.5 33.7 33.6 33.7
0
20
40
60
80
100
2QFY11 3QFY11 4QFY11 1QFY12 2QFY12 3QFY12
( % )
Access charges Network costs License fee Employee cost S,G&A cost EBITDA margin

8/3/2019 Bharti Airtel Result Updated
http://slidepdf.com/reader/full/bharti-airtel-result-updated 7/13
Bharti Airtel | 3QFY2012 Result Update
February 8, 2012 7
Exhibit 13: One-year forward EV/EBITDA (x)
Source: Company, Angel Research
Risks and concerns
Bharti, as per its accounting policy, is accounting for forex loss occurred on interest
being paid on forex debt in the profit and loss statement; however, forex loss on
balance sheet items (revaluation losses) is included in the foreign currency
translation reserve. Due to INR depreciation over the past five months (10-12%),
even after reporting ~ ` 3,250cr of profit in 9MFY2012, the net worth of the
company is almost flat from FY2011 ( ` 51,623cr) to 3QFY2012 ( ` 51,950cr), as
foreign currency translation reserve is taking a hit, moving from ` 1,402cr to
negative ` 1,014cr.
Currently, the effective interest cost of Bharti is 5.5%, which is much lower than the
domestic interest cost. Bharti, due to huge forex debt in its books, is always
exposed to the risk that the effective interest costs might turn out to be higher than
reported costs in the long run, courtesy foreign currency movement, if interest rate
parity kicks in. Keeping this scenario in mind, if we were to assume effective
interest costs to be ~10.5% (nearer to domestic borrowing cost), the interest outgo
of Bharti would increase manifold. This would increase Bharti’s interest cost by
100% and FY2013E EPS would be reduced to ` 12.5 from ` 18.2, thus implying
that Bharti would be trading at very expensive valuations of ~25x PE.
Exhibit 14: Change in estimates
FY2012 FY2013
Parameter Earlier Revised Variation Earlier Revised Variation
(` cr) estimates estimates (%) estimates estimates (%)
Net revenue 71,094 71,601 0.7 80,835 80,983 0.2
EBITDA 24,060 23,509 (2.3) 28,441 27,001 (5.1)
PBT 7,320 6,742 (7.9) 11,213 9,839 (12.3)
Tax 2,026 2,043 0.9 2,803 2,952 5.3
PAT 5,326 4,705 (11.7) 8,446 6,927 (18.0)
Source: Company, Angel Research
0
75,000
150,000
225,000
300,000
375,000
450,000
525,000
A p r - 0 7
A u g - 0 7
D e c - 0 7
A p r - 0 8
A u g - 0 8
D e c - 0 8
A p r - 0 9
A u g - 0 9
D e c - 0 9
A p r - 1 0
A u g - 1 0
D e c - 1 0
A p r - 1 1
A u g - 1 1
D e c - 1 1
E V ( ` c r )
EV 17x 14x 11x 8x 5x

8/3/2019 Bharti Airtel Result Updated
http://slidepdf.com/reader/full/bharti-airtel-result-updated 8/13
Bharti Airtel | 3QFY2012 Result Update
February 8, 2012 8
Exhibit 15: Recommendation summary
Company Reco. CMP Tgt. price Upside FY2013E FY2013E FY2011-13E FY2013E FY2013E
(`) (`) (%) P/BV (x) P/E (x) EPS CAGR (%) RoCE (%) RoE (%)
Bharti Airtel Neutral 354 - - 2.3 19.4 7.0 10.9 11.6Idea Cellular Neutral 92 - - 2.2 29.8 6.7 10.0 7.3
RCom Neutral 93 - - 0.5 16.2 (5.7) 3.3 2.8
Source: Company, Angel Research

8/3/2019 Bharti Airtel Result Updated
http://slidepdf.com/reader/full/bharti-airtel-result-updated 9/13
Bharti Airtel | 3QFY2012 Result Update
February 8, 2012 9
Profit and Loss account (Consolidated, IFRS)
Y/E March (` cr) FY2009 FY2010 FY2011 FY2012E FY2013E
Net sales 36,962 41,847 59,467 71,601 80,983
Roaming and access charges 5,290 4,481 7,499 9,991 11,717
% of net sales 14.3 10.7 12.6 14.0 14.5
Network operating exp. 5,936 8,912 12,993 16,260 18,137
% of net sales 16.1 21.3 21.8 22.7 22.4
License fee 3,827 4,088 5,166 6,060 6,590
% of net sales 10.4 9.8 8.7 8.5 8.1
Other expenses 6,596 7,513 13,774 15,781 17,539
Total expenditure 21,649 24,993 39,432 48,092 53,982
% of net sales 58.6 59.7 66.3 67.2 66.7
EBITDA 15,313 16,854 20,035 23,509 27,001
% of net sales 41.4 40.3 33.7 32.8 33.3
Dep. and amortization 4,758 6,284 10,206 13,164 13,759
Non operating expenses 22 (18) 111 - -
EBIT 10,533 10,589 9,719 10,345 13,243
Interest charges 2,762 18 2,182 3,604 3,404
Other income, net 1,753 70 129 - -
Profit before tax 9,523 10,640 7,666 6,742 9,839
Provision for tax 662 1,345 1,778 2,043 2,952
% of PBT 6.9 12.6 23.2 30.3 30.0
PAT 8,862 9,295 5,887 4,698 6,887
Share in earnings of associate (71) - - (6) -
Minority interest 176 187 (148) (12) (40)Adj. PAT 8,615 9,108 6,035 4,705 6,927
EPS ( ` ) 22.7 24.0 15.9 12.4 18.2

8/3/2019 Bharti Airtel Result Updated
http://slidepdf.com/reader/full/bharti-airtel-result-updated 10/13
Bharti Airtel | 3QFY2012 Result Update
February 8, 2012 10
Balance sheet (Consolidated, IFRS)
Y/E March (` cr) FY2009 FY2010 FY2011 FY2012E FY2013E
Liabilities
Share capital 1,898 1,899 1,899 1,899 1,899Reserves and surplus 28,496 40,295 46,868 51,129 57,611
Tot. shareholders’ funds 30,394 42,194 48,767 53,027 59,510
Minority interest 1,070 2,529 2,856 2,856 2,856
Secured loans 5,399 8,147 53,234 49,991 42,317
Unsecured loans 6,481 2,042 8,437 18,210 15,414
Total debt 11,880 10,190 61,671 68,201 57,731
Other liabilities 1,816 5,300 4,665 1,200 1,800
Total liabilities 45,161 60,212 117,959 125,284 121,897
Assets
Gross block 54,981 69,725 96,810 112,790 122,790
Acc. depreciation 14,067 21,462 31,668 44,831 58,590
Net block 40,914 48,263 65,142 67,959 64,200
Goodwill 4,036 5,989 63,732 64,893 64,893
Oth. non-current assets - 1,825 1,918 2,893 3,103
Investments 3,805 5,236 622 1,315 1,315
Inventories 96 48 214 368 400
Sundry debtors 2,853 3,571 5,493 7,062 7,765
Cash and equivalents 1,115 2,532 958 1,234 2,088
Other current asst 6,552 2,381 3,921 5,521 6,921
Total current assets 10,615 8,532 10,585 14,184 17,174
Less: - current liab. 15,155 10,841 28,430 32,808 36,678
Less:- provisions 79 41 118 138 153
Net current assets (4,619) (2,350) (17,962) (18,762) (19,657)
Net deferred tax - 1,249 4,506 6,987 8,044
Miscellaneous exp. 1,024 - - - -
Total assets 45,161 60,212 117,959 125,284 121,897

8/3/2019 Bharti Airtel Result Updated
http://slidepdf.com/reader/full/bharti-airtel-result-updated 11/13
Bharti Airtel | 3QFY2012 Result Update
February 8, 2012 11
Cash flow statement (Consolidated, IFRS)
Y/E March (` cr) FY2009 FY2010 FY2011 FY2012E FY2013E
Pretax profit from operations 7,771 10,571 7,536 6,742 9,839
Depreciation 4,758 6,284 10,206 13,164 13,759
Expenses (deferred)/written off - - - - -
Pre tax cash from operations 12,529 16,854 17,742 19,905 23,598
Other income/prior period ad 1,753 70 129 - -
Net cash from operations 14,282 16,924 17,872 19,905 23,598
Tax (662) (1,345) (1,778) (2,043) (2,952)
Cash profits 13,620 15,584 16,093 17,862 20,646
(Inc)/Dec in
Current assets (3,609) 3,501 (3,628) (3,323) (2,136)
Current liabilities 1,755 (4,352) 17,666 4,399 3,885
Net trade working capital (1,854) (851) 14,038 1,076 1,749
Cash flow from oper. actv. 11,766 14,733 30,131 18,937 22,395
(Inc)/Dec in fixed assets (14,331) (13,633) (27,085) (15,980) (10,000)
(Inc)/Dec in intangibles (12) (1,953) (57,743) (1,161) -
(Inc)/Dec in investments 1,014 (1,431) 4,614 (692) -
(Inc)/Dec in net dfr. tax asset - (1,249) (3,257) (2,481) (1,057)
(Inc)/Dec in minority interest 215 1,458 328 - -
(Inc)/Dec in oth. non-curr. ast. (514) (801) (94) (967) (170)
Cash flow from investing actv. (13,628) (17,608) (83,237) (21,282) (11,227)
Inc/(Dec) in debt 2,174 (1,690) 51,481 6,530 (10,470)
Inc/(Dec) in equity/premium 272 2,944 1,130 - -
Others 297 3,484 (635) (3,465) 600Dividends 444 444 444 444 444
Cash flow from financing actv. 2,299 4,293 51,532 2,621 (10,314)
Cash generated/(utilized) 437 1,418 (1,575) 276 854
Cash at start of the year 678 1,115 2,532 958 1,234
Cash at end of the year 1,115 2,532 958 1,234 2,088
8/3/2019 Bharti Airtel Result Updated
http://slidepdf.com/reader/full/bharti-airtel-result-updated 12/13
Bharti Airtel | 3QFY2012 Result Update
February 8, 2012 12
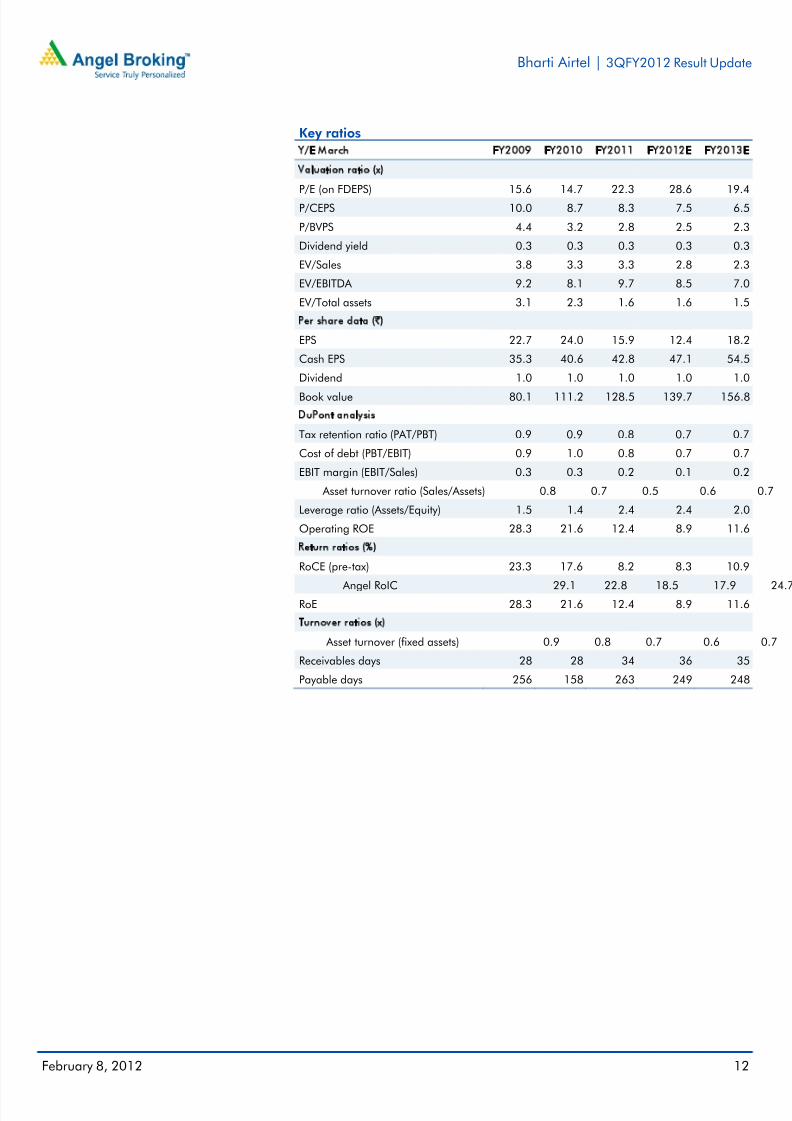
Key ratios
Y/E March FY2009 FY2010 FY2011 FY2012E FY2013E
Valuation ratio (x)
P/E (on FDEPS) 15.6 14.7 22.3 28.6 19.4P/CEPS 10.0 8.7 8.3 7.5 6.5
P/BVPS 4.4 3.2 2.8 2.5 2.3
Dividend yield 0.3 0.3 0.3 0.3 0.3
EV/Sales 3.8 3.3 3.3 2.8 2.3
EV/EBITDA 9.2 8.1 9.7 8.5 7.0
EV/Total assets 3.1 2.3 1.6 1.6 1.5
Per share data (`)EPS 22.7 24.0 15.9 12.4 18.2
Cash EPS 35.3 40.6 42.8 47.1 54.5
Dividend 1.0 1.0 1.0 1.0 1.0
Book value 80.1 111.2 128.5 139.7 156.8
DuPont analysis
Tax retention ratio (PAT/PBT) 0.9 0.9 0.8 0.7 0.7
Cost of debt (PBT/EBIT) 0.9 1.0 0.8 0.7 0.7
EBIT margin (EBIT/Sales) 0.3 0.3 0.2 0.1 0.2
Asset turnover ratio (Sales/Assets) 0.8 0.7 0.5 0.6 0.7
Leverage ratio (Assets/Equity) 1.5 1.4 2.4 2.4 2.0
Operating ROE 28.3 21.6 12.4 8.9 11.6
Return ratios (%)
RoCE (pre-tax) 23.3 17.6 8.2 8.3 10.9
Angel RoIC 29.1 22.8 18.5 17.9 24.
RoE 28.3 21.6 12.4 8.9 11.6
Turnover ratios (x)
Asset turnover (fixed assets) 0.9 0.8 0.7 0.6 0.7
Receivables days 28 28 34 36 35
Payable days 256 158 263 249 248

8/3/2019 Bharti Airtel Result Updated
http://slidepdf.com/reader/full/bharti-airtel-result-updated 13/13
Bharti Airtel | 3QFY2012 Result Update
F b 8 2012 13
Research Team Tel: 022 - 3935 7800 E-mail: [email protected] Website: www.angelbroking.com
DISCLAIMER
This document is solely for the personal information of the recipient, and must not be singularly used as the basis of any investmentdecision. Nothing in this document should be construed as investment or financial advice. Each recipient of this document should make
such investigations as they deem necessary to arrive at an independent evaluation of an investment in the securities of the companies
referred to in this document (including the merits and risks involved), and should consult their own advisors to determine the merits and
risks of such an investment.
Angel Broking Limited, its affiliates, directors, its proprietary trading and investment businesses may, from time to time, make
investment decisions that are inconsistent with or contradictory to the recommendations expressed herein. The views contained in this
document are those of the analyst, and the company may or may not subscribe to all the views expressed within.
Reports based on technical and derivative analysis center on studying charts of a stock's price movement, outstanding positions and
trading volume, as opposed to focusing on a company's fundamentals and, as such, may not match with a report on a company's
fundamentals.
The information in this document has been printed on the basis of publicly available information, internal data and other reliablesources believed to be true, but we do not represent that it is accurate or complete and it should not be relied on as such, as thisdocument is for general guidance only. Angel Broking Limited or any of its affiliates/ group companies shall not be in any way responsible for any loss or damage that may arise to any person from any inadvertent error in the information contained in this report .
Angel Broking Limited has not independently verified all the information contained within this document. Accordingly, we cannot testify,nor make any representation or warranty, express or implied, to the accuracy, contents or data contained within this document. While Angel Broking Limited endeavours to update on a reasonable basis the information discussed in this material, there may be regulatory,compliance, or other reasons that prevent us from doing so.
This document is being supplied to you solely for your information, and its contents, information or data may not be reproduced,
redistributed or passed on, directly or indirectly.
Angel Broking Limited and its affiliates may seek to provide or have engaged in providing corporate finance, investment banking or
other advisory services in a merger or specific transaction to the companies referred to in this report, as on the date of this report or in
the past.
Neither Angel Broking Limited, nor its directors, employees or affiliates shall be liable for any loss or damage that may arise from or in
connection with the use of this information.
Note: Please refer to the important `Stock Holding Disclosure' report on the Angel website (Research Section). Also, pleaserefer to the latest update on respective stocks for the disclosure status in respect of those stocks. Angel Broking Limited andits affiliates ma have investment ositions in the stocks recommended in this re ort.
Disclosure of Interest Statement Bharti Airtel
1. Analyst ownership of the stock No
2. Angel and its Group companies ownership of the stock No
3. Angel and its Group companies' Directors ownership of the stock No
4. Broking relationship with company covered No
Ratings (Returns): Buy (> 15%) Accumulate (5% to 15%) Neutral (-5 to 5%)Reduce (-5% to 15%) Sell (< -15%)
Note: We have not considered any Exposure below ` 1 lakh for Angel, its Group companies and Directors