Embed Size (px)
Citation preview

BHA Racing
Data PackJanuary 2018
© British Horseracing Authority 2018
1 Jan to 31 Jan 1
James Follows ([email protected])
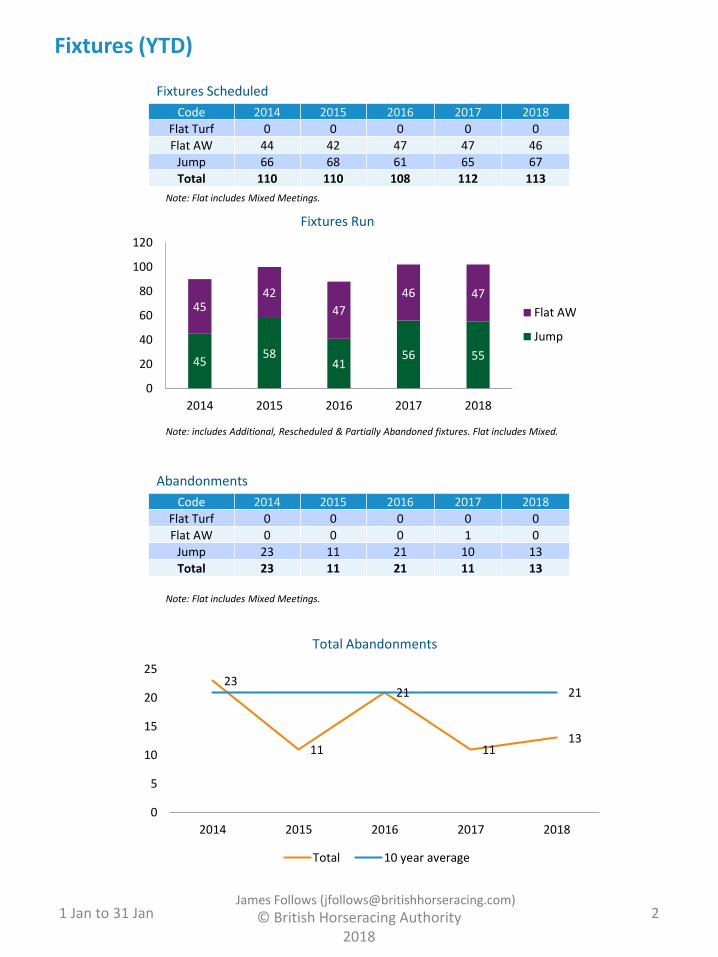
Fixtures (YTD)
© British Horseracing Authority 2018
1 Jan to 31 Jan 2James Follows ([email protected])
Note: includes Additional, Rescheduled & Partially Abandoned fixtures. Flat includes Mixed.
Note: Flat includes Mixed Meetings.
Note: Flat includes Mixed Meetings.
Fixtures Scheduled
Code 2014 2015 2016 2017 2018
Flat Turf 0 0 0 0 0
Flat AW 44 42 47 47 46
Jump 66 68 61 65 67
Total 110 110 108 112 113
4558
4156 55
4542
47
46 47
0
20
40
60
80
100
120
2014 2015 2016 2017 2018
Fixtures Run
Flat AW
Jump
Abandonments
Code 2014 2015 2016 2017 2018
Flat Turf 0 0 0 0 0
Flat AW 0 0 0 1 0
Jump 23 11 21 10 13
Total 23 11 21 11 13
23
11
21
1113
21
0
5
10
15
20
25
2014 2015 2016 2017 2018
Total Abandonments
Total 10 year average

© British Horseracing Authority 2018
1 Jan to 31 Jan 3
James Follows ([email protected])
Turf Fixtures by Going
2014 2015 2016 2017 2018Firm 0 0 0 0 0
Good to Firm 0 0 0 0 0
Good 0 1 1 9 0Good to Soft 4 10 5 14 3
Soft 15 31 15 24 26
Heavy 25 16 20 8 26
0
10
20
30
40
50
60
70
2014 2015 2016 2017 2018
Turf Fixtures by Going
Firm
Good to Firm
Good
Good to Soft
Soft
Heavy
Total Prize Money (£ 000's)
Code 2014 2015 2016 2017 2018
Flat AWT 1,675 1,711 2,094 2,004 2,400Flat Turf 0 0 0 0 0
Jump 3,260 4,154 3,564 3,909 4,929
Total 4,934 5,865 5,658 5,913 7,329
0
2,000
4,000
6,000
8,000
2014 2015 2016 2017 2018
Total Prize Money (£ 000's)
Jump
Flat AWT
Average Prize Money (£) (by race)
Code 2014 2015 2016 2017 2018Flat AWT 5,168 6,177 6,670 6,361 7,341Flat Turf 0 0 0 0 0
Jump 10,414 11,048 13,449 10,672 13,615Total 7,746 8,982 9,772 8,678 10,637

© British Horseracing Authority 2018
1 Jan to 31 Jan 4
James Follows ([email protected])
Funding by Source (£ 000's)
YearNo.
FixturesTotal Prize
FundHBLB
Funding Owners Divided Races
Racecourse Executive
Contribution BHA Dev Fund2017 102 £5,913 £2,566 £470 £119 £2,754 £42018 102 £7,329 £2,867 £533 £115 £3,809 £5
17-18 +/-% 0.00% 23.95% 11.73% 13.40% -3.36% 38.31% 25.00%
HBLB Funding39%
Owners7%
Divided Races2%
Racecourse Executive
Contribution52%
BHA Dev Fund0%
Funding by Source in 2018
Number of Divisions
Code Type 2017 2018 16-17 +/-Flat Hcap 17 18 5.9%Flat WFA 2 3 50.0%
Jump Hcap 1 0 -100.0%Jump WFA 8 5 -37.5%
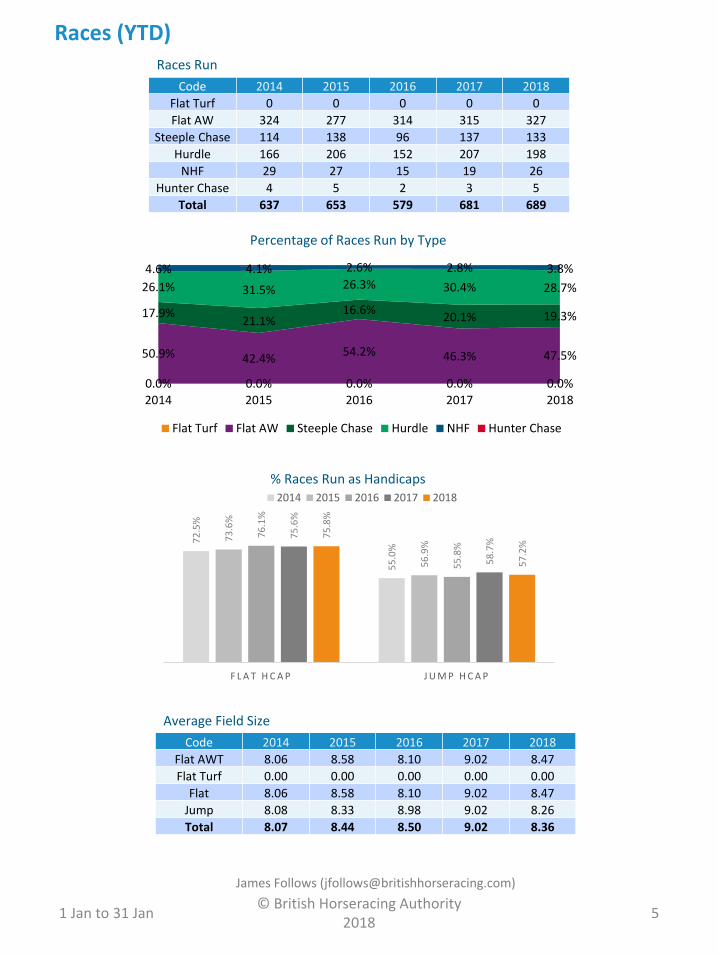
0.0% 0.0% 0.0% 0.0% 0.0%
50.9% 42.4%54.2% 46.3% 47.5%
17.9%21.1%
16.6%20.1% 19.3%
26.1% 31.5% 26.3% 30.4% 28.7%
4.6% 4.1% 2.6% 2.8% 3.8%
2014 2015 2016 2017 2018
Percentage of Races Run by Type
Flat Turf Flat AW Steeple Chase Hurdle NHF Hunter Chase
© British Horseracing Authority 2018
1 Jan to 31 Jan 5
James Follows ([email protected])
Races (YTD)Races Run
Code 2014 2015 2016 2017 2018
Flat Turf 0 0 0 0 0
Flat AW 324 277 314 315 327
Steeple Chase 114 138 96 137 133
Hurdle 166 206 152 207 198
NHF 29 27 15 19 26
Hunter Chase 4 5 2 3 5
Total 637 653 579 681 689
Average Field Size
Code 2014 2015 2016 2017 2018
Flat AWT 8.06 8.58 8.10 9.02 8.47
Flat Turf 0.00 0.00 0.00 0.00 0.00
Flat 8.06 8.58 8.10 9.02 8.47
Jump 8.08 8.33 8.98 9.02 8.26
Total 8.07 8.44 8.50 9.02 8.36
72
.5%
55
.0%
73
.6%
56
.9%
76
.1%
55
.8%
75
.6%
58
.7%
75
.8%
57
.2%
F L A T H C A P J U M P H C A P
R2014 2015 2016 2017 2018
% Races Run as Handicaps
0
2,000
4,000
6,000
8,000
0
1,000
2,000
3,000
4,000
2014 2015 2016 2017 2018
Declarations
Flat AWT
Flat Turf
Jump
Total
0
3,000
6,000
9,000
12,000
15,000
0
2,500
5,000
7,500
10,000
2014 2015 2016 2017 2018
Entries
Flat AWT
Flat Turf
Jump
Total
© British Horseracing Authority 2018
1 Jan to 31 Jan 6James Follows ([email protected])
4.00
5.00
6.00
7.00
8.00
9.00
10.00
2014 2015 2016 2017 2018
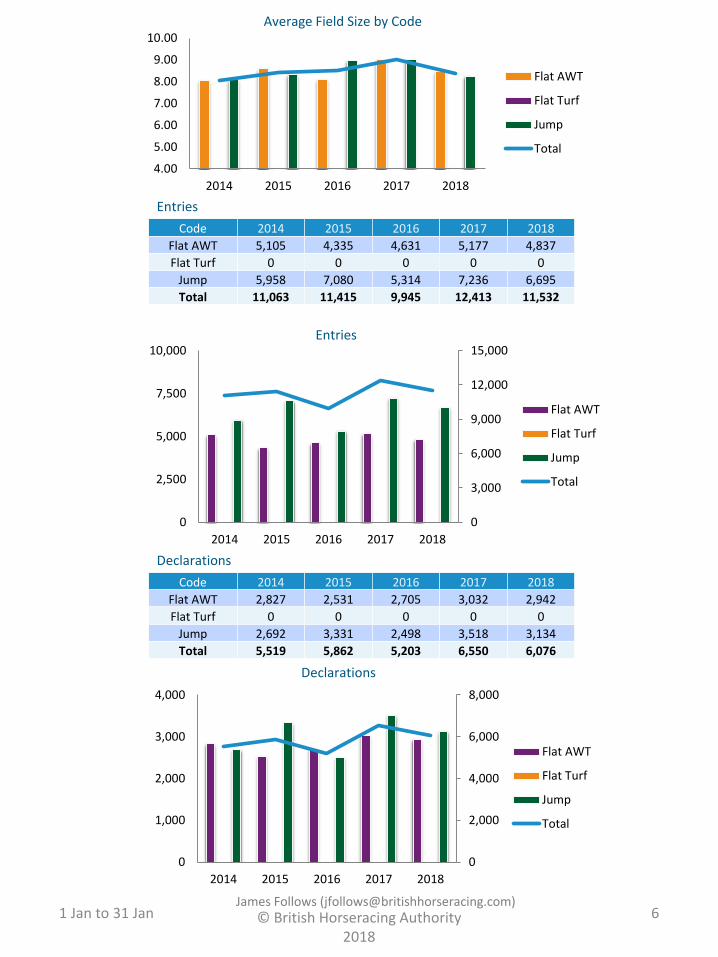
Average Field Size by Code
Flat AWT
Flat Turf
Jump
Total
Entries
Code 2014 2015 2016 2017 2018
Flat AWT 5,105 4,335 4,631 5,177 4,837
Flat Turf 0 0 0 0 0
Jump 5,958 7,080 5,314 7,236 6,695
Total 11,063 11,415 9,945 12,413 11,532
Declarations
Code 2014 2015 2016 2017 2018
Flat AWT 2,827 2,531 2,705 3,032 2,942
Flat Turf 0 0 0 0 0
Jump 2,692 3,331 2,498 3,518 3,134
Total 5,519 5,862 5,203 6,550 6,076

© British Horseracing Authority 2018
1 Jan to 31 Jan 7
James Follows ([email protected])
Eliminations
Code 2014 2015 2016 2017 2018
Flat AWT 113 123 43 248 216
Flat Turf 0 0 0 0 0
Jump 17 22 39 89 75
Total 130 145 82 337 291
0
100
200
300
400
0
100
200
300
400
2014 2015 2016 2017 2018
Eliminations
Flat AWT
Flat Turf
Jump
Total
Runners
Code 2014 2015 2016 2017 2018
Flat 2,611 2,376 2,543 2,840 2,771
Jump 2,528 3,133 2,379 3,303 2,990
Total 5,139 5,509 4,922 6,143 5,761
Individual Runners
Code 2014 2015 2016 2017 2018Flat 1,627 1,605 1,688 1,874 1,851
Jump 2,162 2,557 2,037 2,725 2,520
Dual 19 23 15 22 15
Total 3,808 4,185 3,740 4,621 4,386
3,8084,185
3,740
4,621 4,386
0
1,000
2,000
3,000
4,000
5,000
0
2,000
4,000
6,000
8,000
2014 2015 2016 2017 2018
Runners vs. Individual Runners
Runners Individual Runners

0.600.54
0.49
0.60
0.46
0.00
0.10
0.20
0.30
0.40
0.50
0.60
0.70
2014 2015 2016 2017 2018
Average Non-Runners per Race
0
50
100
150
200
250
300
350
400
450
2014 2015 2016 2017 2018
Non-Runners
Jump
Flat
1 Jan to 31 Jan© British Horseracing Authority
20188
James Follows ([email protected])
Average No. of Runs per Horse
Code 2014 2015 2016 2017 2018
Flat 1.59 1.46 1.49 1.50 1.48
Jump 1.16 1.21 1.16 1.20 1.18
Total 1.35 1.32 1.32 1.33 1.31
Non-Runners
Code 2014 2015 2016 2017 2018
Flat 216 155 162 192 171
Jump 164 198 119 215 144
Total 380 353 281 407 315
Non-Runners as a % of Declarations
Code 2014 2015 2016 2017 2018
Flat 7.6% 6.1% 6.0% 6.3% 5.8%
Jump 6.1% 5.9% 4.8% 6.1% 4.6%
Total 6.9% 6.0% 5.4% 6.2% 5.2%

© British Horseracing Authority 2018
1 Jan to 31 Jan 9
James Follows ([email protected])
Average Field Size (by race type)
2014 2015 2016 2017 2018
FLAT 8.06 8.58 8.10 9.02 8.47
Pattern/Listed 0.00 0.00 0.00 0.00 0.00
Handicap 8.64 9.04 8.46 9.46 8.84
WFA Conditions 5.67 4.78 5.20 5.78 6.22
Maiden 7.60 8.79 7.94 8.55 9.00
Novice 0.00 0.00 0.00 0.00 7.23
Sellers/Claimers 5.95 6.32 6.41 7.07 6.31
Auction Races 6.78 7.47 6.95 7.33 8.50
Sales Races 0.00 0.00 0.00 0.00 0.00
STEEPLE CHASE 7.01 7.12 7.77 8.05 6.81
Pattern/Listed 8.18 7.80 9.15 9.15 8.40
Handicap 7.33 7.24 8.13 8.30 6.98
Maiden/Novice 4.40 5.25 4.09 5.47 3.85
WFA Conditions 5.00 6.00 5.00 6.00 4.00
HURDLE 8.44 9.09 9.72 9.39 9.13
Pattern/Listed 7.00 7.33 8.00 7.92 7.38
Handicap 8.94 9.18 10.43 9.75 9.54
Maiden/Novice 8.41 9.37 9.42 9.29 9.10
WFA Conditions 3.00 7.00 0.00 0.00 0.00
Sellers/Claimers 5.25 7.33 6.00 6.33 7.00
NHF RACES 10.28 8.89 8.87 11.53 9.08
HUNTER CHASES 7.50 7.60 11.50 12.67 8.20
6.00 7.00 8.00 9.00 10.00 11.00 12.00 13.00
FLAT
STEEPLE CHASE
HURDLE
NHF RACES
HUNTER CHASES
Average Field Size by Race Type
2014 2015 2016 2017 2018
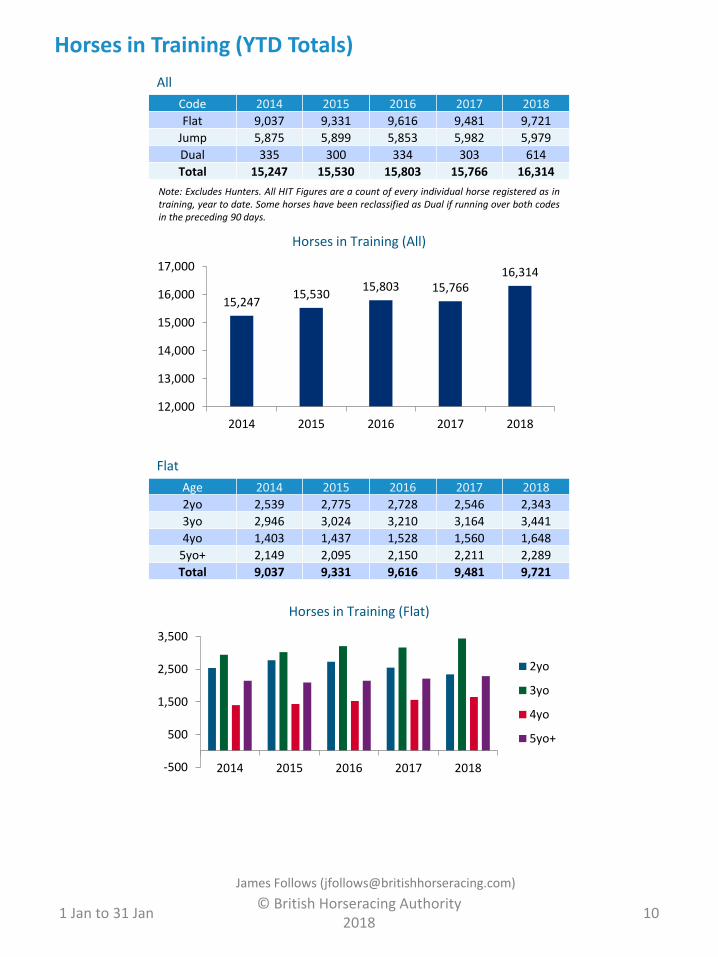
Horses in Training (YTD Totals)
© British Horseracing Authority 2018
1 Jan to 31 Jan 10
James Follows ([email protected])
Note: Excludes Hunters. All HIT Figures are a count of every individual horse registered as intraining, year to date. Some horses have been reclassified as Dual if running over both codesin the preceding 90 days.
15,24715,530
15,803 15,76616,314
12,000
13,000
14,000
15,000
16,000
17,000
2014 2015 2016 2017 2018
Horses in Training (All)
All
Code 2014 2015 2016 2017 2018
Flat 9,037 9,331 9,616 9,481 9,721
Jump 5,875 5,899 5,853 5,982 5,979
Dual 335 300 334 303 614
Total 15,247 15,530 15,803 15,766 16,314
Flat
Age 2014 2015 2016 2017 2018
2yo 2,539 2,775 2,728 2,546 2,343
3yo 2,946 3,024 3,210 3,164 3,441
4yo 1,403 1,437 1,528 1,560 1,648
5yo+ 2,149 2,095 2,150 2,211 2,289
Total 9,037 9,331 9,616 9,481 9,721
-500
500
1,500
2,500
3,500
2014 2015 2016 2017 2018
Horses in Training (Flat)
2yo
3yo
4yo
5yo+
© British Horseracing Authority 2018
1 Jan to 31 Jan 11
James Follows ([email protected])
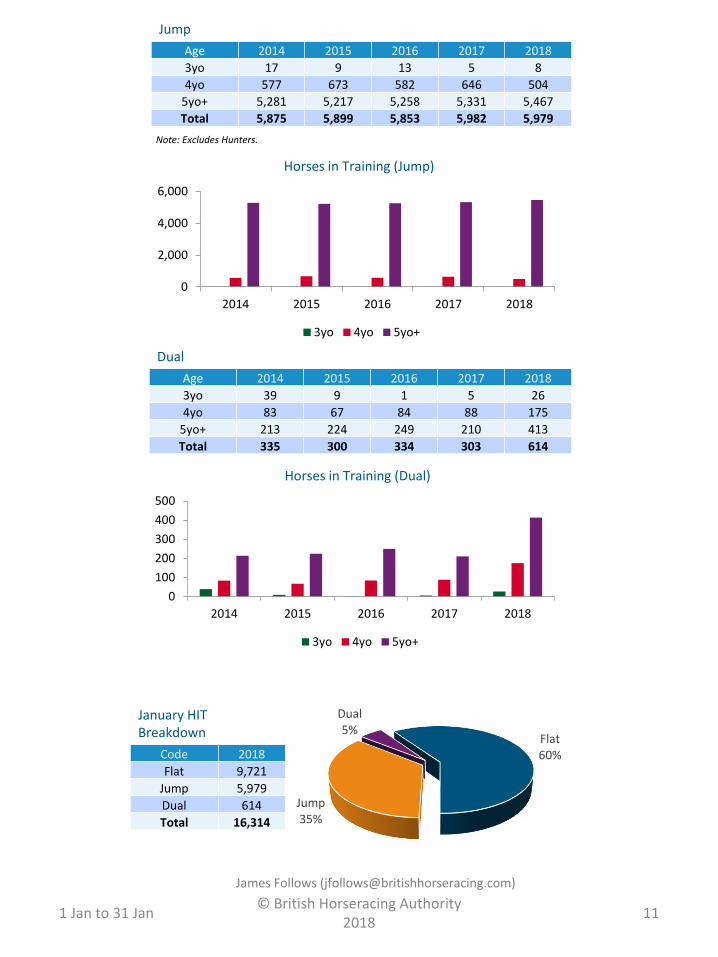
Note: Excludes Hunters.
Flat60%
Jump35%
Dual5%
Jump
Age 2014 2015 2016 2017 2018
3yo 17 9 13 5 8
4yo 577 673 582 646 504
5yo+ 5,281 5,217 5,258 5,331 5,467
Total 5,875 5,899 5,853 5,982 5,979
0
2,000
4,000
6,000
2014 2015 2016 2017 2018
Horses in Training (Jump)
3yo 4yo 5yo+
0
100
200
300
400
500
2014 2015 2016 2017 2018
Horses in Training (Dual)
3yo 4yo 5yo+
Dual
Age 2014 2015 2016 2017 2018
3yo 39 9 1 5 26
4yo 83 67 84 88 175
5yo+ 213 224 249 210 413
Total 335 300 334 303 614
January HIT Breakdown
Code 2018
Flat 9,721
Jump 5,979
Dual 614
Total 16,314

38.2%
61.8%
2018< 7 Races
7+ Races
© British Horseracing Authority 2018
1 Jan to 31 Jan 12
James Follows ([email protected])
OTHER KPIs (Full Year)
7 Race Cards
2014 2015 2016 2017 2018
< 7 Races 7.8% 52.0% 43.2% 43.1% 38.2%
7+ Races 92.2% 48.0% 56.8% 56.9% 61.8%
Races with fewer than 6 Runners
Code 2014 2015 2016 2017 2018
Flat 17.3% 14.4% 14.0% 8.9% 13.5%
Jump 18.2% 14.6% 14.3% 12.0% 20.7%
Total 17.7% 14.5% 14.2% 10.6% 17.3%
0.0%
5.0%
10.0%
15.0%
20.0%
2014 2015 2016 2017 2018
Races <6 Runners
Races with 8 (or more) Runners
Code 2014 2015 2016 2017 2018
Flat 56.2% 65.0% 56.7% 71.7% 64.2%
Jump 51.1% 55.9% 64.5% 63.4% 53.9%
Total 53.7% 59.7% 60.3% 67.3% 58.8%
0.0%
20.0%
40.0%
60.0%
2014 2015 2016 2017 2018
Races 8+ Runners

0
10
20
30
40
50
2014 2015 2016 2017 2018
Free to Air Televised Races
Jump
Flat
© British Horseracing Authority 2018
1 Jan to 31 Jan 13
James Follows ([email protected])
Races with Odds On and Evens Favourites
Code 2014 2015 2016 2017 2018
Flat 20.1% 20.6% 16.6% 15.6% 19.0%
Jump 20.8% 19.9% 25.3% 24.0% 21.5%
Total 20.4% 20.2% 20.6% 20.1% 20.3%
0.0%
10.0%
20.0%
30.0%
2014 2015 2016 2017 2018
Races with Odds On and Evens Favourites
Flat Jump
Races with Odds Against Favourites
Code 2014 2015 2016 2017 2018
Flat 79.9% 79.4% 83.4% 84.4% 81.0%
Jump 79.2% 80.1% 74.7% 76.0% 78.5%
Total 79.6% 79.8% 79.4% 79.9% 79.7%
70.0%
80.0%
90.0%
2014 2015 2016 2017 2018
Races with Odds Against Favourites
Flat Jump
Free to Air Televised Races
Code 2014 2015 2016 2017 2018
Flat 4 0 2 0 0
Jump 28 41 40 32 29
Total 32 41 42 32 29

© British Horseracing Authority 2018
1 Jan to 31 Jan 14
James Follows ([email protected])
Horses running from 1lb or 2lb above the rating band in handicaps
Race Type
Races Affected AFS
Over Weight wins
Over Weight Runners Strike rate
Over Weight's Percentage of Rivals Beaten IV
Flat AW 106 9.81 22 146 15.1% 61.1% 1.43
Chase 31 9.13 3 41 7.3% 45.2% 0.62
Hurdle 33 10.67 7 42 16.7% 59.4% 1.63
Mares' and Fillies' Races
Year Code Races Runners AFS % <6 runners Avg. Prize Fund2017 Flat 23 185 8.04 8.7% £7,5672018 Flat 19 142 7.47 31.6% £9,7052017 Jump 36 291 8.08 22.2% £8,664
2018 Jump 34 282 8.29 23.5% £11,870
Flat Conditions Stakes (included within BHA handicapping trial)
Year Races Runners AFS Avg Fav SP % <6 runners
2017 8 45 5.63 2.49 62.5%
2018 8 48 6.00 1.93 50.0%

© British Horseracing Authority 2018
1 Jan to 31 Jan 15
James Follows ([email protected])
BHA Racing
Data PackJanuary 2018