Embed Size (px)
Citation preview

Kongens Nytorv 6 1050 Copenhagen K
Denmark Tel.: +45 3336 7100 Fax: +45 3336 7199
eea.europa.eu
Beyond water quality: sewage treatment in a 1
circular economy 2
3
Subtitle 4
5
6
7
8
9
10
Version: 2.3 11
Date: 04/10/21 12
EEA activity: 1.1.2 13
14
15
16
17
Author: 18
From: 19
20
Contributors: co-authors, or delete line 21
From: organisation 22
23
24
Document History (optional) 25
26
Version Date Author(s) Remarks
21/02/08 CW For ETC info
V1 21/05/02 CW For EEA internal
V2 21/08/17 CW
V2_1 21/08/31 CW/PR For EEA internal
V2_2 17/09/2021 CW For ENV/JRC
UWWT, CE and ZP, draft, 7th Oct 2021 Page | 2
V2_3 04/10/2021 CW With ENV/JRC edits
V2_4 06/10/2021 CW Clean version for Eionet consultation
27
28
Contents 29
Beyond water quality: sewage treatment in a circular economy ................................................. 1 30
Contents ........................................................................................................................................ 2 31
Acknowledgements ....................................................................................................................... 4 32
Key messages ................................................................................................................................ 5 33
Executive summary ....................................................................................................................... 6 34
1 Introduction – prevention of water pollution ........................................................................ 8 35
1.1 Aim of the report ........................................................................................................... 8 36
1.2 Scope of the report ....................................................................................................... 8 37
1.2.1 Structure of the report .............................................................................................. 8 38
1.3 Sewage management – policies and ambitions ............................................................ 9 39
1.3.1 Historical context ...................................................................................................... 9 40
1.3.2 Current policies and ambitions ................................................................................. 9 41
2 Urban waste water treatment, health and pollution .......................................................... 12 42
2.1 Introduction ................................................................................................................ 12 43
2.2 Sewage and urban waste water treatment ................................................................ 12 44
2.2.1 What’s in sewage and urban waste water .............................................................. 12 45
2.2.2 Treatment methods ................................................................................................ 13 46
2.3 Pollution from sewage ................................................................................................ 17 47
2.3.1 Nutrients.................................................................................................................. 17 48
2.3.2 Micropollutants ....................................................................................................... 19 49
2.3.3 Disease and antimicrobial resistance ...................................................................... 20 50
2.4 Dwellings not connected to a sewer system ............................................................... 21 51
2.5 Storm overflows .......................................................................................................... 22 52
2.6 Industrial waste water................................................................................................. 23 53
2.7 Sludges arising from urban waste water treatment ................................................... 24 54
2.7.1 Sewage sludge ......................................................................................................... 24 55
2.7.2 Process waste .......................................................................................................... 25 56
2.8 Greenhouse gas emissions .......................................................................................... 25 57
3 Energy and resources ........................................................................................................... 28 58
UWWT, CE and ZP, draft, 7th Oct 2021 Page | 3
3.1 Introduction ................................................................................................................ 28 59
3.2 Energy use and efficiency ............................................................................................ 28 60
3.2.1 Sustainable use of resources ................................................................................... 28 61
3.2.2 UWWTP energy use and efficiency ......................................................................... 29 62
3.3 Extracting resources from sewage and sewage sludge............................................... 30 63
3.3.1 Sewage sludge ......................................................................................................... 30 64
3.3.2 Sewage sludge production ...................................................................................... 31 65
3.3.3 Resource recovery from sewage sludge.................................................................. 32 66
3.3.4 Energy generation ................................................................................................... 33 67
3.3.5 Water reuse ............................................................................................................. 34 68
3.4 Low input sewage treatment ...................................................................................... 37 69
4 Systemic change: Zero pollution, circular economy ............................................................ 39 70
4.1 Introduction ................................................................................................................ 39 71
4.2 Re-thinking “urban waste water treatment” .............................................................. 39 72
4.3 Zero pollution and waste water treatment ................................................................. 41 73
4.4 Circular economy – from “waste water treatment” to resource recovery ................. 41 74
4.5 Accelerating the transition .......................................................................................... 43 75
4.5.1 De-centralised solutions for circularity ................................................................... 44 76
4.5.2 Individual action ...................................................................................................... 45 77
4.6 What needs to change ................................................................................................ 45 78
List of abbreviations -to be added .............................................................................................. 47 79
Glossary – to be added ................................................................................................................ 48 80
References – to be added ........................................................................................................... 49 81
82
83
84
85
86
87

UWWT, CE and ZP, draft, 7th Oct 2021 Page | 4
Acknowledgements 88
Text here 89

UWWT, CE and ZP, draft, 7th Oct 2021 Page | 5
Key messages 90
• Treatment to clean up our sewage is essential to protect human health and the 91 environment. 92
• Urban waste water treatment (UWWT) has been key to improving the quality of 93 Europe’s waters in recent decades, shown in the significant improvement of bathing 94 water quality. However, treatment methods can be energy- and water- intensive. 95
• Many chemicals from our homes and workplaces, such as plasticisers and personal 96 care products, end up in waste water. These then need removing, as waste water 97 treatment remains the last chance to protect our waters from chemical pollution. 98
• Greenhouse gases are emitted at many stages of UWWT, from those embedded in 99 infrastructure like sewers to sludge management. 100 101
• We can move from our linear approach to waste water treatment, which focuses on 102 the water cycle and water treatment, to a genuinely circular approach, which 103 considers all the inputs and emissions related to sewage treatment. 104
• Sewage treatment can generate energy and allow resource recovery, e.g. of 105 phosphorus, leading to sustainability. 106
• Treatment of sewage is not “one size fits all”. Local conditions call for local solutions. 107 Financial resources, the availability of land, the density of population and types of 108 industry are among the factors which influence potential options. 109
• Technical solutions already exist to deliver circularity in sewage treatment. Vacuum 110 toilets enable sewage to be safely treated within buildings or streets, recovering 111 both energy and nutrients. Meantime, waste water from washing and cooking can 112 be reused for lower quality applications. We need to enable implementation of such 113 innovative approaches, through regulations, institutional and cultural shifts. 114
• A key component for longer term circularity of sewage treatment is to ensure that 115 harmful chemicals no longer reach sewage. This requires implementation of the 116 Chemicals Strategy for Sustainability under the European Green Deal. 117
118
119

UWWT, CE and ZP, draft, 7th Oct 2021 Page | 6
Executive summary 120
The European Green Deal sets an ambitious agenda “to transform the EU into a fair and 121 prosperous society, with a resource-efficient and competitive economy where there are no net 122 emissions of greenhouse gases” (EC, 2019). 123
Sewage treatment is an essential service which can deliver clean water, nutrients and organic 124 fertiliser. It can and should contribute to delivering the Green Deal, while recognising that the 125 primary priority is to protect human health and the environment from harm caused by 126 insufficiently treated sewage. 127
EU water legislation has focused on the water cycle, improving water quality and aiming to 128 restore biodiversity. The Urban Waste Water Treatment Directive 1991 (UWWTD) has led to 129 improved water quality in Europe, but urban waste water treatment plants (UWWTP) still 130 represent the major point source of pollutants to Europe’s waters (EC, 2019; EEA ). Compliance 131 with the UWWTD requires building collection and treatment facilities, usually involving use of 132 energy-intensive materials such as concrete and steel, with energy-intensive operation, while 133 not covering greenhouse gas emissions of methane and nitrous oxides (Fig ES-1). 134
Water managers have already identified ways to become more energy efficient and reduce 135 operational greenhouse gas emissions (GHG). Some UWWTPs generate more energy than they 136 use, through biogas generation and waste water heat recovery. Some towns and operators have 137 ambitious plans for “net zero” GHG emissions and are intensively reviewing their infrastructure 138 and processes. Alternative approaches to energy-intensive treatment include constructed 139 wetlands which in addition can provide green space for citizens, and decentralised approaches 140 which treat and dispose, at or near the source, relatively small volumes of waste water. 141
Sewage treatment should be recognised as integral to resource recovery, rather than “waste 142 management”. Incentives for reuse and recovery are needed to enable use of a range of 143 products recovered from the waste water stream. Legal barriers limiting use of recovered 144 resources should be revisited. Coherent legislative frameworks for all relevant sectors along 145 potential value chains should be in place to enable recovered resources to enter the market. 146
Solutions for sewage and urban waste water treatment are necessarily local and need to take 147 into account the local situation. An optimal approach for a densely-populated city is unlikely to 148 be the same as for a low density, rural population. At legislative level, a focus on the desired 149 outcome could provide flexibility for local solutions. 150
A significant blocker in realising circularity in sewage treatment is the presence of harmful 151 chemical pollutants in waste water. This leads to the need for intensive treatment to remove 152 them and then the presence of persistent pollutants in sludge, making that unsuitable for reuse 153 on land. Breaking this cycle requires the successful implementation of the Green Deal 154 “Chemicals Strategy for Sustainability”, so that harmful pollutants are no longer present in the 155 sewage. 156
Achieving a circular economy in sewage treatment is a long term project and is dependent on 157 many contributors. Case studies show the opportunity. At national and regional level, social 158 acceptance of change is crucial for successful implementation. Strategic goals, giving industry 159 and the public confidence in long term direction, enable investment in innovative approaches. 160 Certification schemes can build public confidence in circular products and improve social 161 acceptance. Collaboration across sectors and partners is essential for a successful outcome. At 162 municipal level, projects require significant local input and energy. 163
164
165
166

UWWT, CE and ZP, draft, 7th Oct 2021 Page | 7
167
Figure ES 1 Inputs and outputs of sewage treatment, 168
169
170 a) at WWTP, b) source separation sewage treatment 171
172
173
174
175

UWWT, CE and ZP, draft, 7th Oct 2021 Page | 8
1 Introduction – prevention of water 176
pollution 177
1.1 Aim of the report 178
Treatment of urban waste water – sewage and water used in homes and workplaces - is essential 179 for the health of both humans and the environment. Originally undertaken to prevent disease 180 through contamination of drinking water supplies, recognition of the harmful role nutrients had 181 on the environment led to the [agreement] on the Urban Waste Water Treatment Directive 182 (UWWTD) in 1991. In recent years, we have become more aware of the many other pollutants 183 in waste water, which are not targeted by that Directive. With the over-arching perspective of 184 the European Green Deal and 8th Environmental Action Programme we also better recognise the 185 broader role that waste water treatment can provide in helping to mitigate climate change. 186 Rather than “waste”, we should consider the treated water and sewage sludge as resources to 187 be reused in a circular economy. Cleaner water provides more natural habitats, benefitting 188 biodiversity. Investment in prevention of pollution, including upstream measures such as 189 avoiding use of harmful chemicals, is key to delivering sustainability. 190
This report sets out considerations for sewage treatment towards meeting the ambitions of the 191 Green Deal for 2050, through targeting zero pollution and circularity. 192
193
194
1.2 Scope of the report 195
This study focuses on sewage and the dirty (“grey”) water we send down sinks, drains and 196 sewers. Left untreated, this waste water pollutes rivers, lakes, groundwater and seas. The 197 treatment required to minimise pollution of water however, can lead to production of 198 greenhouse gases and contaminated sludges, which can go on to pollute air, soils and water. 199
The combination of sewage and grey water, “urban waste water”, is usually treated in urban 200 waste water treatment plants, but for the 11 % of Europeans whose dwellings are not connected 201 to waste water treatment (Eurostat, 2019), individual treatment such as septic tanks or package 202 plants are necessary. These too can pollute air and water. 203
It doesn’t have to be this way. Applying a systemic approach to sewage and waste water, Europe 204 can move to a virtuous circle, minimising pollution and utilising the renewable resources 205 provided by sewage and its treatment. Delivering this needs a range of approaches, including 206 technology, infrastructure investment, nature-based solutions, changes in legislation and 207 cultural acceptance. 208
With the ambition of the European Green Deal coinciding with the refit of Water legislation, 209 there is now an opportunity to re-set our approach to the treatment of Urban Waste Water 210 Treatment and set Europe on track for sustainable waste water treatment by 2050. 211
212
1.2.1 Structure of the report 213
Chapter 1 sets out existing policies and relevant legislation. Chapter 2 focuses on the treatment 214 of waste water and pollution. Chapter 3 considers the resources used in treatment of sewage, 215 and the resources which could be reused and recovered. Chapter 4 considers a systemic 216 approach to delivering sustainable sewage treatment. 217
218

UWWT, CE and ZP, draft, 7th Oct 2021 Page | 9
219
1.3 Sewage management – policies and ambitions 220
1.3.1 Historical context 221
Recognition of the link between disease and sewage in the nineteenth century led to the 222 development of sewer networks in cities around Europe. Treatment facilities were gradually 223 developed, though even into the 1990’s and 2000’s some European cities were still discharging 224 untreated sewage to their waters (EC, 2002, 2011). Understanding of the association between 225 healthy waters for humans and the environment increased from the 1970’s, with the first 226 Community environment action programme setting out to “prevent, reduce and as far as 227 possible eliminate pollution and nuisances; maintain a satisfactory ecological balance and 228 ensure the protection of the biosphere; ensure the sound management of and avoid any 229 exploitation of resources or of nature which cause significant damage to the ecological balance” 230 (EEC, 1973). Legislation to protect drinking water (EEC, 1975) bathing water in 1975 (EEC, 1975) 231 and other water pollution prevention measures followed. 232
Recognising the harm caused by excessive nutrients in sewage discharged to surface waters, the 233 Urban Waste Water Treatment Directive (UWWTD) (EEC, 1991) was adopted in 1991 with the 234 objective to protect the environment from the adverse effects of the treatment and discharge 235 of urban waste water and from certain industrial sectors. This Directive set requirements for 236 minimum levels of treatment for urban areas (so-called “agglomerations”) of 2000 population 237 equivalents1 (p.e.) and above. More demanding levels of treatment were required for larger 238 populations and where the discharge was into sensitive waters. 239
240
1.3.2 Current policies and ambitions 241
The European Green Deal (EC, 2019) sets out an ambition to reset the Commission’s 242 commitment to tackling climate and environmental-related challenges. It also aims to protect, 243 conserve and enhance the EU's natural capital, and protect the health and well-being of 244 citizens from environment-related risks and impacts. Alongside this strategic direction for 245 Europe, the draft 8th Environment Action Programme (EC, 2020) aims at “accelerating the 246 transition to a climate-neutral, resource efficient, clean and circular economy in a just and 247 inclusive way”. Living well, within the limits of our planet, requires in Europe a fundamental re-248 appraisal of how we use and recycle resources. This sets a bold context for waste water 249 treatment, where the opportunity to move to a circular economy exists in tandem with 250 reducing pollution. 251
252
Looking at the Green Deal, the Zero Pollution ambition is for pollution to be reduced to levels 253 no longer considered harmful to health and natural ecosystems, and which respect planetary 254 boundaries (EC, 2021). Waste water treatment has a key role to play here, representing the 255 last chance to prevent pollutants in urban waste water reaching the aquatic environment, but 256 the focus on minimising pollutants in the effluent has, until recently, not considered the 257 gaseous and solid waste emissions to a similar degree. Greenhouse gases can be released 258 during treatment, energy used in pumping water is significant, while sewage sludge can 259 contain the substances “cleaned” from the water. The Sewage Sludge Directive (1986) is 260 currently being evaluated, but currently contains limits only on metals. This is despite concerns 261 that the limits are too high and do not consider other pollutants (Ricardo, 2021). Reflecting the 262
1 Population equivalent is a unit to measure the amount of sewage generated in agglomerations. 1 population
equivalent expresses an amount of sewage generated by one person per day and it corresponds to the organic biodegradable load having a five-day biochemical oxygen demand (BOD5) of 60 g of oxygen
UWWT, CE and ZP, draft, 7th Oct 2021 Page | 10
pressures on water availability already affecting some Member States, the Water Reuse 263 Regulation (EC, 2020) sets standards for treated waste water to be used in irrigation, such as 264 on chemical and microbiological contamination. An integrated Nutrient Management Plan is 265 being developed under the Circular Economy Action Plan to use nutrients more sustainably 266 and stimulate markets for recovered nutrients (EC, 2020). 267
268
In recent decades, it has been increasingly understood that the development of many more 269 chemicals and products has led to many thousands of chemicals potentially being released to 270 the environment. Our knowledge of the behaviour and fate of many of these is low, yet the 271 risk posed by some could be high. Alongside this, there is a crisis in biodiversity driven by 272 factors such as climate change, pollution, over-exploitation, land and sea use and invasive 273 species. Ensuring we limit pollution from sewage and waste water is essential. But this is an 274 “end of pipe” solution. It is very complex to work back from the pollutants in sewage to try and 275 exclude from product chains (Ricardo, 2021). A more fundamental review of what chemicals 276 and products we use in our homes and workplaces is needed. The Chemicals Strategy for 277 Sustainability sets out the ambition towards a toxic-free environment, with the aim that 278 chemicals are made safe-and-sustainable-by-design, and thereby will be produced and used in 279 a way that maximises their contribution to society, while avoiding harm. 280
281
The over-arching Water Framework Directive (WFD) (EC, 2000) provides a framework for 282 management of Europe’s waters. In surface waters, the WFD considers both chemical and 283 ecological status, with the objective of all water bodies to be in good status. Nutrient pollution 284 caused by insufficiently treated waste water is a pressure on the natural ecosystem, most 285 immediately affecting the ecological status. Chemical pollution, with toxic, bioaccumulative and 286 persistent substances, can be recorded under chemical status (if the substance is listed under 287 the Environmental Quality Standards Directive, EC 2008, 2013). Other substances in excessive 288 amounts can lead to failure of ecological status, if they are regarded as pollutants at the river 289 basin level. For these reasons, the UWWTD is a basic measure under the WFD, as failure to fully 290 implement the UWWTD is likely to lead to failure of good status requirements under the WFD. 291
292
An additional driver for the implementation of the UWWTD in some areas has been the Bathing 293 Water Directive (EC, 2006, EEC 1976). With its focus on human health, the need to reduce faecal 294 contamination of bathing waters has driven high standards of waste water treatment, such as 295 disinfection e.g. where beach tourism is a significant industry. Protection of drinking waters from 296 microbiological, chemical and physical contamination has a long history in the EU, with the 1975 297 Drinking Water Directive being recast in 2020 to reflect more recent understanding about 298 contaminants. 299
300
Sustainable Development Goal 6 is to ensure the availability and sustainable management of 301 water and sanitation for all (UN, n.d.). While much of the EU considers implementation of 302 more advanced waste water treatment, we should not overlook those who still lack access to 303 sanitation (e.g. Szilvasi et al, 2017; Heidegger and Wiese, 2020) - in 2021, the WHO counted 304 over 30 million people in this position in the European region. Significant inequalities persist 305 between rural and urban areas, and between rich and poor people, with rural dwellers and the 306 poorest being the most disadvantaged. 307
308
In line with the precautionary principle towards the environment, set out in the Treaty on the 309 Functioning of the EU, A.191 (EU, 1992), much of the EU policy around chemicals takes a 310 “source control” approach – aiming to prevent pollution, while the WFD provides a monitoring 311 mechanism to check on the most harmful substances present in water. Thus the 2006 312

UWWT, CE and ZP, draft, 7th Oct 2021 Page | 11
Registration, Evaluation, Authorisation and Restriction of Chemicals Regulation (REACH) aims 313 to improve the protection of human health and the environment through the better and 314 earlier identification of the intrinsic properties of chemical substances. Meanwhile, the 315 Industrial Emissions Directive (IED) targets discharges from large installations, while the 316 European Pollutant Release and Transfer Register (E-PRTR) requires operators to record 317 pollutant emissions above certain thresholds. The IED and E-PRTR are under review and the 318 requirements related to emissions to water may be strengthened for both direct and indirect 319 releases. The E-PRTR currently requires UWWTPs to report where they are over a threshold of 320 100 000 p.e., which is recognised as being too high for a threshold and not ambitious enough 321 to address the target 90% of pollutants released by this sector (ICF Consulting Services, 2020). 322
323
324
325
326
327
328
UWWT, CE and ZP, draft, 7th Oct 2021 Page | 12
2 Urban waste water treatment, health and 329
pollution 330
2.1 Introduction 331
The primary reason for treating sewage is to protect human health and the environment. Lack 332 of sanitation pollutes drinking water and leads to disease in humans. In 1991, the UWWTD 333 focused on nutrient pollution (primarily nitrogen and phosphorus) in efforts to reduce 334 eutrophication of Europe’s rivers, lakes and seas. Together with legislation to restrict pollution 335 from industry, this action has been effective in seeing life return to “dead rivers”. 336
In Europe, most sewage enters sewers to be conveyed to a waste water treatment plant where 337 it is treated to reduce pollutant load. The effluent is then discharged to the environment, 338 typically rivers, lakes and coastal zones. In less densely-populated areas, or those where 339 investment in infrastructure is lacking, individual solutions need to be found for sewage, such as 340 package plant or septic tanks. Construction, maintenance and operation of waste water 341 collection and treatment comes at high financial and greenhouse gas cost. Biological and 342 chemical sludges arising from the treatment process must be regularly removed from the plant 343 and treated. 344
Nowadays we recognise that there are many more pollutants in sewage than were recognised 345 in 1991. We have limited understanding of the risks to aquatic life presented by mixtures of 346 chemicals in surface waters, where many of those chemicals have come from the products in 347 our own homes. We know that in future there are likely to be risks of which we are not 348 necessarily yet aware. The coronavirus pandemic has re-alerted us to the use of waste water as 349 a way to monitor disease in the community (EC, n.d). 350
Treatment of urban waste water presents the last chance to protect the environment from the 351 pollutants it contains, and is “end-of-pipe” control. Treatment to clean the water can transfer 352 pollutants to sewage sludge and treatment sludges, potentially requiring management of solid 353 waste. 354
The enormous effort to reduce sewage pollution, underpinned by the Urban Waste Water 355 Treatment Directive supported by other EU and national legislation, has led to significant 356 improvement of Europe’s surface waters in recent decades. Such efforts cannot stand still: 357 achieving and maintaining compliance with the UWWTD has been estimated at costing an 358 additional 253 billion EUR between 2019 - 2030 (EC, 2019). Without tackling the root causes of 359 harmful pollutants, doing “more of the same” will not lead to a sustainable way to managing an 360 essentially renewable resource. 361
362
2.2 Sewage and urban waste water treatment 363
“Show me your waste water and I will tell you who you are.” Composition of waste water reflects 364 all human activities, life style, materials used in homes. It provides information on the use of 365 medicines and personal care products, and on environmental behaviour. 366
367
2.2.1 What’s in sewage and urban waste water 368
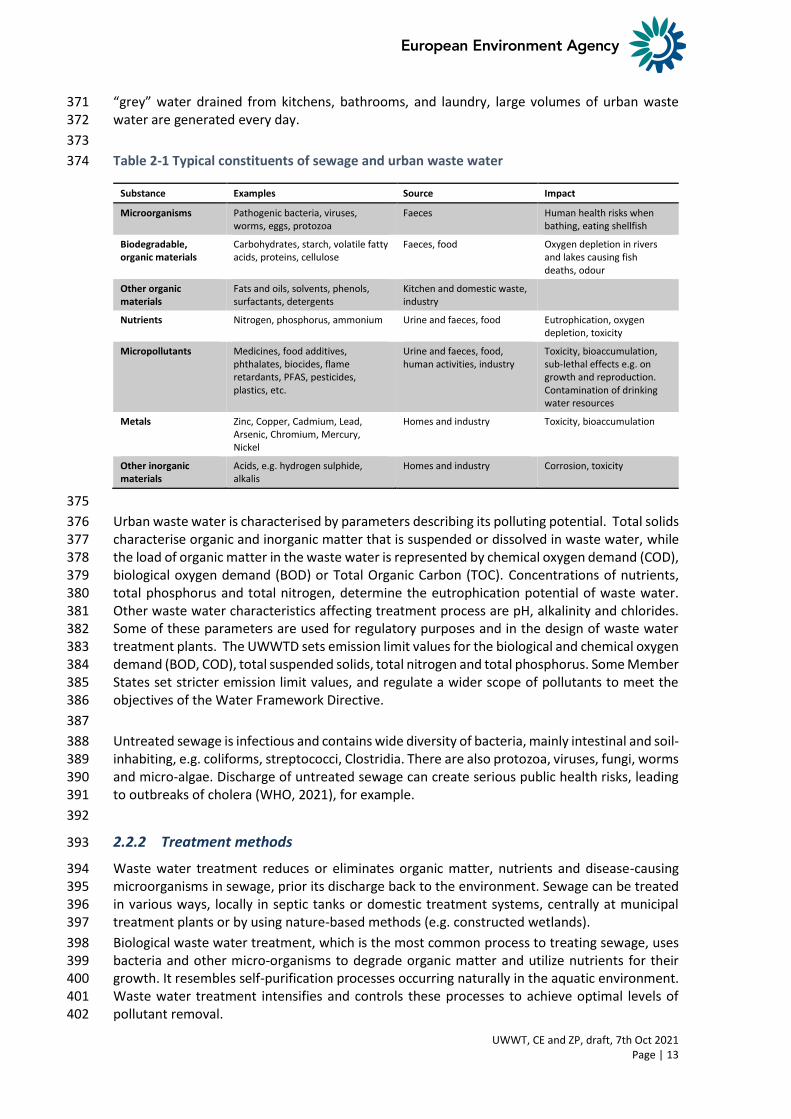
Sewage, the faeces and urine we all excrete, is mainly water. The remainder contains a large 369 number of organic and inorganic, suspended and dissolved solids (see Table 2.1). Mixed with 370
UWWT, CE and ZP, draft, 7th Oct 2021 Page | 13
“grey” water drained from kitchens, bathrooms, and laundry, large volumes of urban waste 371 water are generated every day. 372
373
Table 2-1 Typical constituents of sewage and urban waste water 374
Substance Examples Source Impact
Microorganisms Pathogenic bacteria, viruses, worms, eggs, protozoa
Faeces Human health risks when bathing, eating shellfish
Biodegradable, organic materials
Carbohydrates, starch, volatile fatty acids, proteins, cellulose
Faeces, food Oxygen depletion in rivers and lakes causing fish deaths, odour
Other organic materials
Fats and oils, solvents, phenols, surfactants, detergents
Kitchen and domestic waste, industry
Nutrients Nitrogen, phosphorus, ammonium Urine and faeces, food Eutrophication, oxygen depletion, toxicity
Micropollutants Medicines, food additives, phthalates, biocides, flame retardants, PFAS, pesticides, plastics, etc.
Urine and faeces, food, human activities, industry
Toxicity, bioaccumulation, sub-lethal effects e.g. on growth and reproduction. Contamination of drinking water resources
Metals Zinc, Copper, Cadmium, Lead, Arsenic, Chromium, Mercury, Nickel
Homes and industry Toxicity, bioaccumulation
Other inorganic materials
Acids, e.g. hydrogen sulphide, alkalis
Homes and industry Corrosion, toxicity
375
Urban waste water is characterised by parameters describing its polluting potential. Total solids 376 characterise organic and inorganic matter that is suspended or dissolved in waste water, while 377 the load of organic matter in the waste water is represented by chemical oxygen demand (COD), 378 biological oxygen demand (BOD) or Total Organic Carbon (TOC). Concentrations of nutrients, 379 total phosphorus and total nitrogen, determine the eutrophication potential of waste water. 380 Other waste water characteristics affecting treatment process are pH, alkalinity and chlorides. 381 Some of these parameters are used for regulatory purposes and in the design of waste water 382 treatment plants. The UWWTD sets emission limit values for the biological and chemical oxygen 383 demand (BOD, COD), total suspended solids, total nitrogen and total phosphorus. Some Member 384 States set stricter emission limit values, and regulate a wider scope of pollutants to meet the 385 objectives of the Water Framework Directive. 386
387
Untreated sewage is infectious and contains wide diversity of bacteria, mainly intestinal and soil-388 inhabiting, e.g. coliforms, streptococci, Clostridia. There are also protozoa, viruses, fungi, worms 389 and micro-algae. Discharge of untreated sewage can create serious public health risks, leading 390 to outbreaks of cholera (WHO, 2021), for example. 391
392
2.2.2 Treatment methods 393
Waste water treatment reduces or eliminates organic matter, nutrients and disease-causing 394 microorganisms in sewage, prior its discharge back to the environment. Sewage can be treated 395 in various ways, locally in septic tanks or domestic treatment systems, centrally at municipal 396 treatment plants or by using nature-based methods (e.g. constructed wetlands). 397
Biological waste water treatment, which is the most common process to treating sewage, uses 398 bacteria and other micro-organisms to degrade organic matter and utilize nutrients for their 399 growth. It resembles self-purification processes occurring naturally in the aquatic environment. 400 Waste water treatment intensifies and controls these processes to achieve optimal levels of 401 pollutant removal. 402

UWWT, CE and ZP, draft, 7th Oct 2021 Page | 14
At treatment plants, the sewage usually goes through several, consecutive steps of treatment 403 (see table 2.2): pre-treatment, primary treatment, secondary treatment and, possibly, advanced 404 treatment. 405
After secondary treatment, waste water is pumped into the secondary settling tanks, where 406 sludge is separated from treated water. Treated water is then either discharged into the 407 recipient, or undergoes advanced treatment tackling specific substances that cannot be 408 adequately removed by secondary treatment (also known as (tertiary treatment). Advanced 409 treatment technologies are sometimes combined with primary or secondary treatment (e.g., 410 biological removal of nitrogen and phosphorus). 411
412
Table 2-2 Urban waste water treatment processes 413
Treatment Process Typical technologies Treatment / Removal of
Pre-treatment
physical separation
screening,
sedimentation,
flotation
debris, grit, fibres, sand, oil, grease
Primary physical separation
sedimentation, flotation suspended solids, oils
Secondary biochemical degradation,
physical separation
Activated Sludge Process
Trickling filters
Sequential Batch Reactor
Moving Bed Bio Film Reactor
Membrane Bioreactor
Oxidation ponds/
lagoon-constructed wetlands
organics, partial treatment of nutrients (nitrogen and phosphorus), microorganisms
See note
Advanced physical separation, chemical degradation
biochemical degradation,
disinfection (chlorination, ozonisation and ultraviolet (UV) treatment)
activated carbon filtration,
advanced oxidation
Advanced biological treatment,
reverse osmosis,
coagulation, microfiltration,
ultrafiltration
microorganisms, nutrients
highly biologically active and difficult to biodegrade substances (micropollutants)
414
Note: Although conventional secondary treatment has not been designed to remove nutrients or 415 micropollutants, waste water treatment plants do remove some nutrients and micropollutants to some 416 extent (including some pharmaceuticals and metals) 417
418
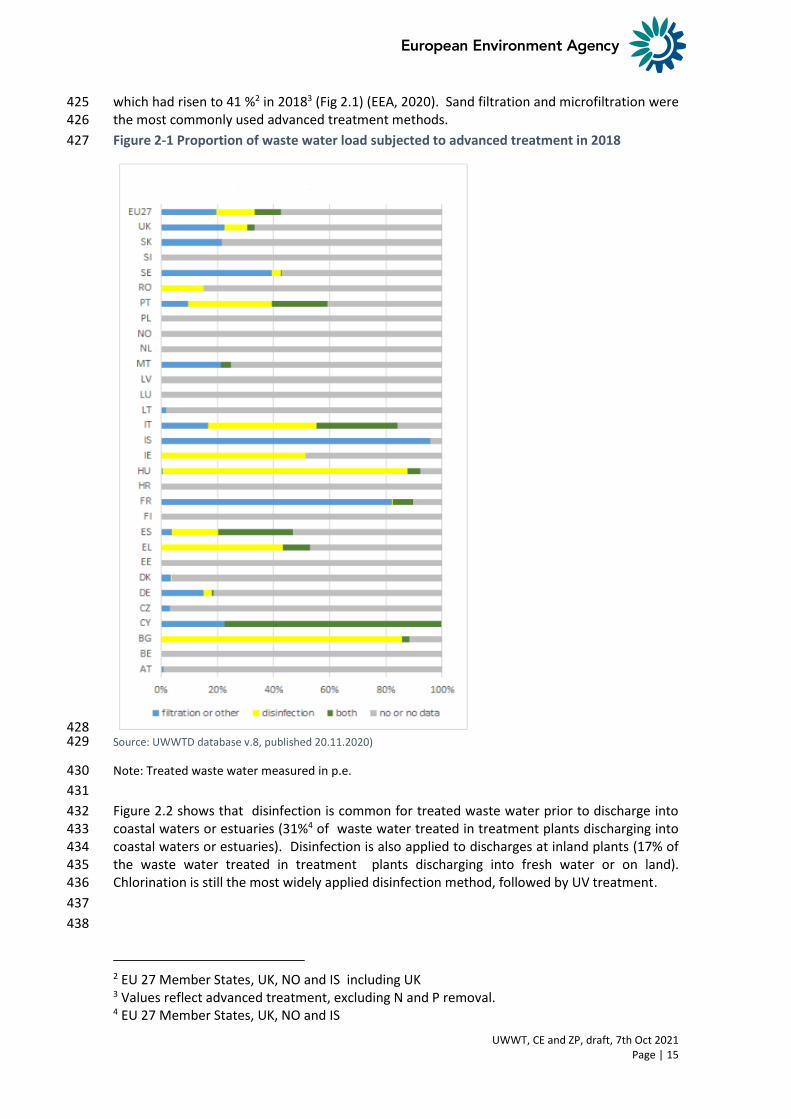
The UWWTD requires that in agglomerations bigger that 10 000 p.e. located in areas sensitive 419 to eutrophication, Member States apply an advanced treatment to remove nitrogen and 420 phosphorus from waste water prior discharge (called ‘more stringent treatment’). Application 421 of other types of advanced treatment is not mandatory but should be used to ensure that 422 receiving water body meets quality objectives after discharge of treated waste water. In 2007, 423 20 % of the total waste water treated in Member States was subject to advanced treatment, 424
UWWT, CE and ZP, draft, 7th Oct 2021 Page | 15
which had risen to 41 %2 in 20183 (Fig 2.1) (EEA, 2020). Sand filtration and microfiltration were 425 the most commonly used advanced treatment methods. 426
Figure 2-1 Proportion of waste water load subjected to advanced treatment in 2018 427
428 Source: UWWTD database v.8, published 20.11.2020) 429
Note: Treated waste water measured in p.e. 430
431
Figure 2.2 shows that disinfection is common for treated waste water prior to discharge into 432 coastal waters or estuaries (31%4 of waste water treated in treatment plants discharging into 433 coastal waters or estuaries). Disinfection is also applied to discharges at inland plants (17% of 434 the waste water treated in treatment plants discharging into fresh water or on land). 435 Chlorination is still the most widely applied disinfection method, followed by UV treatment. 436
437
438
2 EU 27 Member States, UK, NO and IS including UK 3 Values reflect advanced treatment, excluding N and P removal. 4 EU 27 Member States, UK, NO and IS

UWWT, CE and ZP, draft, 7th Oct 2021 Page | 16
Figure 2-2 Waste water treatment plants equipped with disinfection (2018) 439
440 441 Source UWWTD database v.8, published 20.11.2020) 442
Note: UV = ultraviolet radiation 443 444
Most of the advanced treatment methods require the input of extra energy and/or resources 445 e.g. energy for ozone generation or UV treatment in disinfection; the use of activated carbon in 446 micropollutant reduction. Energy consumption may increase by between 10-60% with these 447 advanced methods. Meanwhile, optimisation of biological treatment for nutrient removal from 448 water also supports reductions in concentrations of many micropollutants. 449
Treatments need to take into account local characteristics. For example, ozonation of water 450 containing certain levels of bromide presents a risk of the formation of carcinogenic bromated 451 organic compounds (Kehrein, 2020). 452
453
454
UWWT, CE and ZP, draft, 7th Oct 2021 Page | 17
2.3 Pollution from sewage 455
2.3.1 Nutrients 456
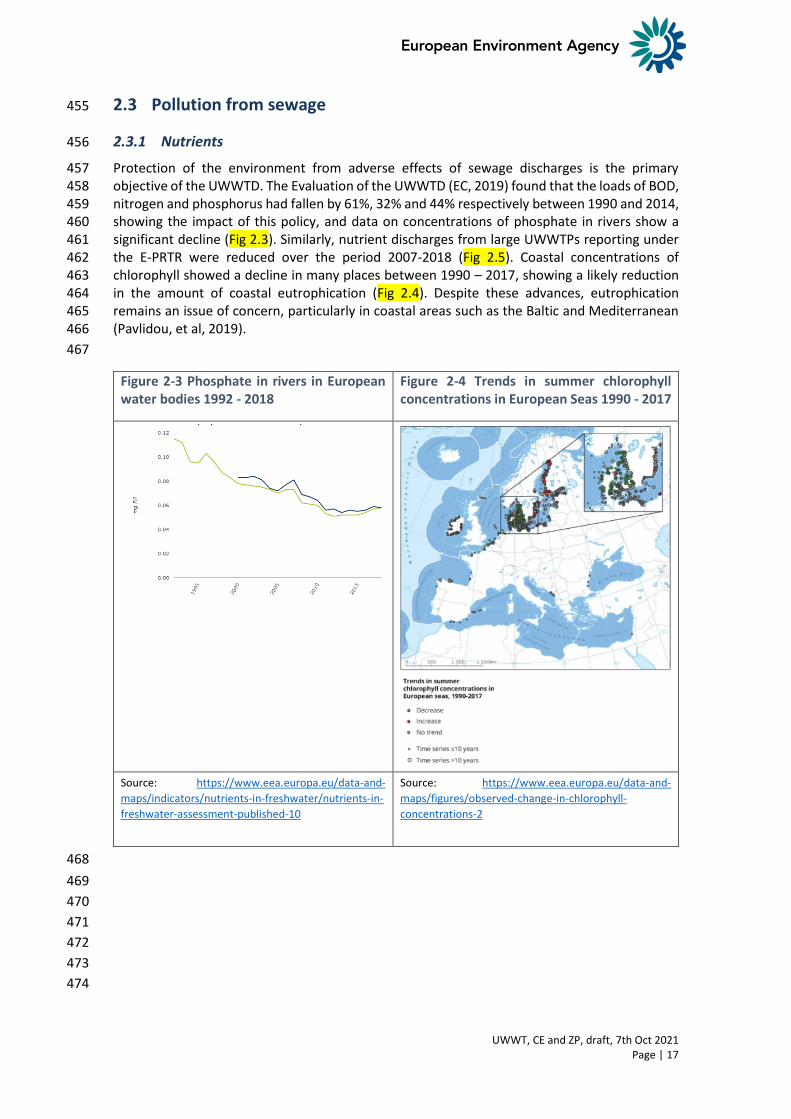
Protection of the environment from adverse effects of sewage discharges is the primary 457 objective of the UWWTD. The Evaluation of the UWWTD (EC, 2019) found that the loads of BOD, 458 nitrogen and phosphorus had fallen by 61%, 32% and 44% respectively between 1990 and 2014, 459 showing the impact of this policy, and data on concentrations of phosphate in rivers show a 460 significant decline (Fig 2.3). Similarly, nutrient discharges from large UWWTPs reporting under 461 the E-PRTR were reduced over the period 2007-2018 (Fig 2.5). Coastal concentrations of 462 chlorophyll showed a decline in many places between 1990 – 2017, showing a likely reduction 463 in the amount of coastal eutrophication (Fig 2.4). Despite these advances, eutrophication 464 remains an issue of concern, particularly in coastal areas such as the Baltic and Mediterranean 465 (Pavlidou, et al, 2019). 466
467
Figure 2-3 Phosphate in rivers in European water bodies 1992 - 2018
Figure 2-4 Trends in summer chlorophyll concentrations in European Seas 1990 - 2017
Source: https://www.eea.europa.eu/data-and-
maps/indicators/nutrients-in-freshwater/nutrients-in-
freshwater-assessment-published-10
Source: https://www.eea.europa.eu/data-and-
maps/figures/observed-change-in-chlorophyll-
concentrations-2
468
469
470
471
472
473
474
UWWT, CE and ZP, draft, 7th Oct 2021 Page | 18
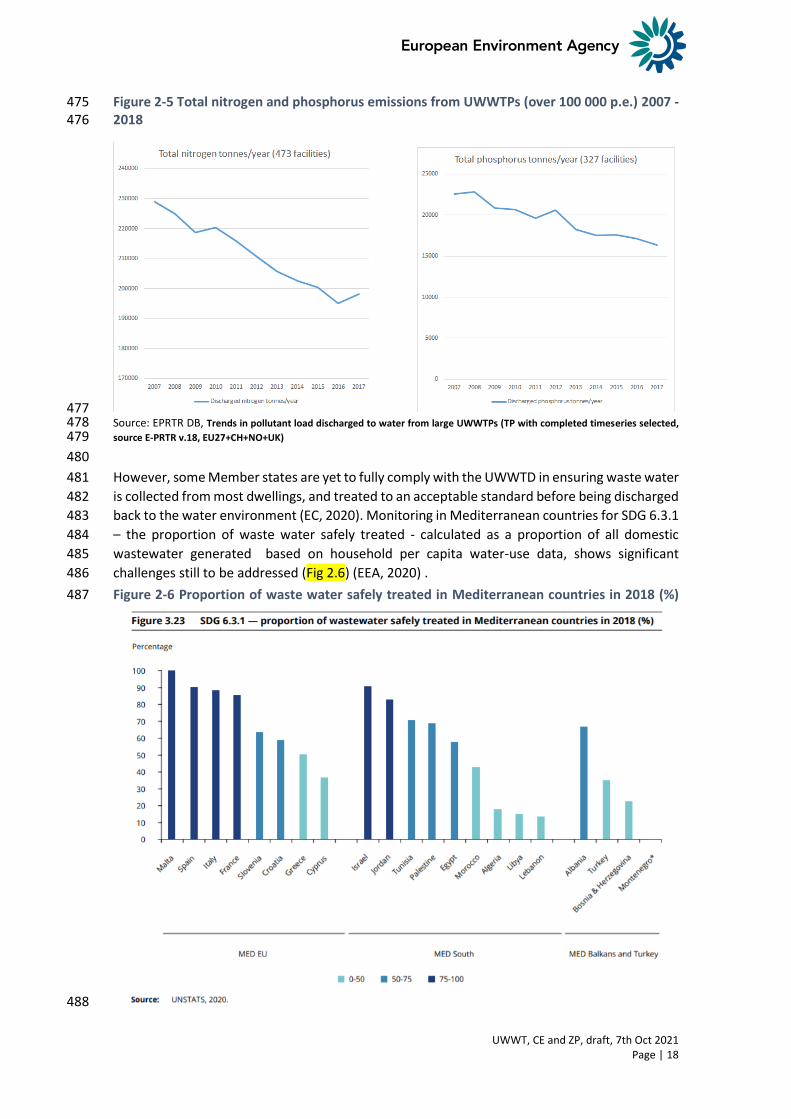
Figure 2-5 Total nitrogen and phosphorus emissions from UWWTPs (over 100 000 p.e.) 2007 - 475 2018 476
477 Source: EPRTR DB, Trends in pollutant load discharged to water from large UWWTPs (TP with completed timeseries selected, 478 source E-PRTR v.18, EU27+CH+NO+UK) 479
480
However, some Member states are yet to fully comply with the UWWTD in ensuring waste water 481
is collected from most dwellings, and treated to an acceptable standard before being discharged 482
back to the water environment (EC, 2020). Monitoring in Mediterranean countries for SDG 6.3.1 483
– the proportion of waste water safely treated - calculated as a proportion of all domestic 484
wastewater generated based on household per capita water-use data, shows significant 485
challenges still to be addressed (Fig 2.6) (EEA, 2020) . 486
Figure 2-6 Proportion of waste water safely treated in Mediterranean countries in 2018 (%)487
488

UWWT, CE and ZP, draft, 7th Oct 2021 Page | 19
489
Reporting under the Water Framework Directive indicates that most Member States are 490
challenged in achieving targets with respect to restoring all waterbodies to ‘Good Status’ by 491
2027. Pollution pressures from sewage caused failure of ecological status, arising both from 492
point sources from UWWTPs (8 % water bodies) and storm overflows (3 %) and from diffuse 493
sources such as non-connected dwellings (10 %) (Fig 2.7) (EEA, 2021). Urban run-off seems to 494
represent a significant pressure in transitional and coastal waters. 495
496
Figure 2-7 Significant pressures causing failure to meet good ecological status (RBMP2) 497
498 499
Source: Water Framework Directive database https://www.eea.europa.eu/data-and-maps/dashboards/wise-wfd 500 (EU27+NO+UK) 501
502
Where sewage discharges have occurred over decades, recovery of an ecosystem can be difficult 503 to assess. However, an historical study on the River Seine in France showed the impact of human 504 activities on migratory fish from the sea to Paris, between 1900s and 2010s (Pichon et al, 2020; 505 Beslagic, 2013). Discharges of untreated sewage and other wastes in the 1970s led to low 506 dissolved oxygen concentrations in the river, leading to a “chemical barrier” to migration. By the 507 2010s, improvements to waste water treatment and the implementation of effective fish 508 passages allowed migratory fish to again reach Paris. Prior to the UWWTD, untreated sewage 509 sludge was dumped at sea. Sewage represents a food source for some species, allowing them to 510 aggressively compete for this resource. Studies of the recovery of a sewage sludge dump site in 511 the North Sea showed that less tolerant benthic species began to live in the site area within 2-3 512 years’ cessation of dumping (Birchenough and Frid, 2009). 513
514
515
2.3.2 Micropollutants 516
Understanding of the range of pollutants in water, and our ability to measure them, has moved 517
a long way since 1991. We now recognise that many “micropollutants” find their way into urban 518
waste water and risk being discharged to the environment if they are not treated or removed. 519
Such pollutants can be natural, like metals and polyaromatic hydrocarbons (PAHs), as well 520
synthetic biocides, medicines, flame retardants etc. Waste water treatment has shown itself 521
capable of removing relatively high proportions of many of these substances, but often not 522

UWWT, CE and ZP, draft, 7th Oct 2021 Page | 20
sufficiently to meet chemical standards requirements under the WFD (Gardner et al, 2013). 523
Furthermore, concern about mixtures in the environment (EC, 2012; Posthuma et al, 2019) leads 524
to calls for higher removal from urban waste water. 525
Historically, we have largely understood chemical pollutants as arising from industry and 526
agriculture. However, restrictions on industrial discharges, particularly from point sources, have 527
led to a decline in the significance of this as a source. Research in the UK showed that the most 528
significant source of micropollutants to UWWTPs was our homes (Fig 2.8) (Comber et al, 2014). 529
530
Figure 2-8 Pollutant sources to UWWTPs531
532
1 UK WIR Chemical Investigation Programme 533
534
This finding should have profound impact on our understanding of chemical pollutants in 535
sewage. Rather than being “someone else’s responsibility” with an impact “somewhere else”, 536
these pollutants are in chemicals and products we use in our homes – substances with harmful 537
characteristics such as carcinogenicity and endocrine disruption, as well as those directly 538
harmful to aquatic life. 539
Citizens are concerned. 84% of Europeans are worried about the impact of chemicals present in 540
everyday products on their health, and 90% are worried about their impact on the environment 541
(EC, 2020). In Switzerland, studies on impact of micropollutants on surface water status and on 542
drinking water resources resulted in a referendum and then legislation to upgrade existing waste 543
water treatment plants to remove micropollutants (Logar et al, 2014). 544
Despite restrictions on certain substances through source control legislation such as Regulation 545
on Registration, Evaluation, Authorisation and Restriction of Chemicals (REACH) (EU, 2006), the 546
number of chemicals in everyday use has grown enormously in recent decades (EEA, 2019). 547
Efforts are in place to break a cycle where restriction of one substance has merely led to its 548
replacement by similar (unrestricted) molecule – so-called “regrettable substitution” (ECHA, 549
n.d.; Kemi, n.d.) – and moving to safe and sustainable-by-design criteria for chemicals (EC, 2020). 550
551
2.3.3 Disease and antimicrobial resistance 552
One of the “discoveries” of the Covid-19 pandemic was the role that waste water monitoring 553 can play in tracking the presence of the virus, such that the EC recommended a common 554 approach to establish systematic surveillance of SARS-CoV-2 (EC, 2021) (EC, 2021)). In fact, 555

UWWT, CE and ZP, draft, 7th Oct 2021 Page | 21
such monitoring has a long history, with polio being monitored this way in the 1940s (Schmidt, 556 2020). Pathogens excreted through bodily fluids, skin and hair find their way into sewers 557 through toilet flushing and cleaning (eg bathing, floor washing) (Sinclair, et al, 2008). Use of 558 waste water monitoring for early warning and tracking of disease outbreaks seems likely to 559 continue, given its potential for widespread coverage and relatively low cost (~EUR 25 000 for 560 one UWWTP per year) (JRC, 2021). 561
562
There is real concern around the risk represented by antimicrobial resistance (AMR), where 563 antibiotics no longer are able to cure common infections (WHO, 2021). Intensively studied in the 564 food and health sectors have not yet been matched in the environment (EFSA, 2021). UWWT 565 relies on naturally-resistant organisms breaking down organic matter and other waste water 566 constituents. Resistance genes may be transferred and generated in the waste water, eg through 567 exposure to antibiotic residues excreted by patients, and then transferred into the environment. 568 Large scale understanding of the potential for transfer of resistance genes back into people is 569 not yet available, but some smaller studies show contamination, eg surfers showed 3 times the 570 level of antibiotic resistant E. coli compared to non-surfers (Leonard et al, 2018). If UWWTPs 571 were found to be a significant cause of transfer of resistance genes, it is possible that disinfection 572 would be more widely required. Research is on-going in this area. 573
2.4 Dwellings not connected to a sewer system 574
Dwellings which are not connected to UWWTPs can be a source of diffuse pollution if sewage is 575 directly released to the environment without treatment, or when local sewage treatment is 576 applied but is not well-maintained or operated (European Commission, 2007). Approximately 11 577 % of the EU population (55 million people) was not connected to waste water collection in 2017 578 (Eurostat, 2019). Reporting under the WFD showed that non-connected dwellings were a 579 significant diffuse pollution pressure, affecting 8.5 % of surface water bodies and 4 % of 580 groundwater area (Grebot et al, 2019; EEA, 2021). 581
582
The UWWTD requires that waste water produced in urban settlements under 2000 p.e. must be 583 collected or treated in Individual Appropriate Systems (IAS) (e.g. septic tanks, domestic waste 584 water treatment plants) - which equate to “non-connected dwellings” under the WFD. These 585 solutions can be used where building a collecting system is not justified owing to “no 586 environmental benefit or because it would involve excessive cost”, and must be able to ensure 587 that discharged waste water allows receiving waters to meet the relevant quality objectives and 588 the relevant provisions of the UWWTD. Reporting on the implementation of the UWWTD in 589 2018 showed that about 9.9 million p.e.5 was not collected nor received any treatment mainly 590 among newer Member States (fig 2.9). It also indicated that 13.8 million p.e. of waste water was 591 collected and treated via IAS, with some countries relying on this approach for a significant 592 proportion of their sewage (fig 2.10). 593
Non-connected dwellings and small settlements can treat sewage effectively, such as through 594 small treatment plants and constructed wetlands, though typically this requires strong oversight 595 (Grebot et al, 2019). Owners of individual systems take care not to disrupt the process treatment 596 process, e.g. avoiding the flushing of harmful substances (Mulder, 2019). Finland, with 597 approximately 1 million people living in urban areas below 2 000 p.e. (c.18 % of total population) 598 and with an additional 1 million vacationers, applies extensive legislation regulating the 599 operation of IAS (Grebot et al, 2019). However, more often regulation is relatively weak, not 600
5 EU27+IS+NO+UK

UWWT, CE and ZP, draft, 7th Oct 2021 Page | 22
least because such facilities are usually on private land, and it can be a challenge to ensure 601 effective treatment where financial resources as well as skilled personnel may be lacking (ibid). 602 603
604
Figure 2-9 Percentage of waste water load collected in collecting systems, addressed through 605 independent and other appropriate systems (IAS) or discharged without treatment in Europe, 606 2018 607
Figure 2-10 Actual load treated via IAS, 2018 608
Fig 2.9 Fig 2.10 609 610
611
612 613
Source: UWWTD Waterbase 2020 614
2.5 Storm overflows 615
Rain and stormwater or water from melted snow, which does not soak into the soil, forms 616 surface run-off. The quality of surface run-off is determined by landuse characteristics. Water 617 falling on impervious surface, like highways, streets, parking lots, roofs, industrial and 618 construction facilities, green areas, etc. is recognised as a major source of pollution (sediments, 619 micropollutants, bacteria, oils) of water bodies originating in urban environment. Sewers collect 620 urban runoff as well as sewage. In separated sewer systems, runoff is conveyed separately and 621
UWWT, CE and ZP, draft, 7th Oct 2021 Page | 23
discharged without treatment into nearby waterway, whereas in combined sewers, it is 622 collected together with waste water and travels to UWWTP. To prevent flooding of the UWWTP 623 during heavy rainfall, sewerage systems are equipped with combined sewer overflows (CSO), 624 allowing discharge of a mixture of runoff and urban waste water directly into surface waters. 625 This may lead to pollution by organic matter, nutrients, micropollutants, bacteria and viruses, 626 which can cause oxygen depletion, toxicity and health risks. Of particular importance is impact 627 of CSO on the quality of bathing waters, owing to the increased concentrations of coliforms (JRC, 628 2019). Studies on micropollutants in CSO showed substantially elevated concentrations of some 629 (caffeine, ibuprofen) occurring in urban streams following CSO discharges, which were higher 630 than in treated effluents from WWTPs (Buerge et al, 2006). 631
To reduce the frequency of CSO discharges, some UWWTPS have temporary storage tanks which 632 hold the “first flush” of storm water, which is considered to be the most contaminated. 633 Sewerage systems are expensive – the Thames Tideway Tunnel in London, which is being built 634 to reduce CSO discharges, is expected to cost about EUR 6 billion (Thames Water, 2021) 635
There are over 3 million kilometres of sewer systems across Europe, with at least 650,000 CSOs 636 (Eureau, 2020). In the second reporting under WFD, 4% of surface water bodies were reported 637 (by 18 MS) to be affected by pollution from storm overflows (EEA, 2021), though the actual 638 proportion of water bodies affected may be higher, because quantification of discharges from 639 CSOs is problematic (Ahm et al, 2016). 640
Studies into the implementation of the UWWTD found that full compliance with the Directive in 641
relation to the management of CSOs and urban runoff would offer significant reduction of 642
pollution load that ends up in environment (JRC, 2019). 643
In a pilot study for storm water management in northern France, Bézannes Joint Development 644
Zone constructed a landscaped park instead of a traditional civil engineering solution (Oppla, 645
2021). This project had a number of aims, among them to reduce flood risk and the load to sewer 646
systems, restoring ecosystems and their functions, increase biodiversity, improve water quality, 647
increase accessibility to green open spaces and increase well-being through nature-based 648
solutions. 649
With climate change increasing the frequency of heavy rainfall events in some areas, without 650 additional efforts, the problems related to CSO discharges are likely to increase. Adapting to 651 sudden, heavy rainfall is a priority in some European cities, not least to avoid tragic 652 consequences such as those in Germany in summer 2021. Solutions include sustainable urban 653 drainage systems and managing runoff, such as by harvesting rainfall, capturing runoff and 654 allowing it to soak into the ground or treating it (e.g. through constructed wetlands) and then 655 releasing runoff at a controlled rate (Grebot et al, 2019). 656
657
2.6 Industrial waste water 658
The focus of this study is urban waste water. Smaller scale manufacturing and food and drink 659 production typically discharge to the sewer system, where the waste water is treated at the 660 UWWTP. Member States must ensure that the discharge of industrial waste water to the sewer 661 allows its effective treatment by the UWWTP, so that it does not damage equipment and the 662 resulting sludge can be treated and disposed in an environmentally sound manner. In contrast, 663 large industrial sources often have on-site treatment facilities, discharging directly into water. 664 Typically such installations are regulated under the Industrial Emissions Directive (IED) (EC, 665 2010), such as pulp and paper, metals, energy supply and chemicals sectors (EEA, 2018). Quality 666 of the effluent discharged by industry in both cases can be permitted by environmental 667 regulators and waste water utilities. Regulation of industrial discharges to water has led to 668 significant improvement in water quality since the 1970s. 669

UWWT, CE and ZP, draft, 7th Oct 2021 Page | 24
Emissions to water from large UWWTPs are reported and publicly available under the IED and 670 the European Pollutant Release and Transfer Register (E-PRTR) Regulation (EC, 2006; 2010). 671 Minimum reporting thresholds apply, to limit the reporting burden, based on installation size 672 and quantity released of a list of 91 substances. A relatively small proportion of the reporting 673 concerns emissions to water, and a relatively small number of UWWTPs report data to the Portal 674 (in 2017, 901 in the EU27). Both the IED and the E-PRTR are currently under review, with UWWTP 675 capacity thresholds one of the areas under consideration (EC, 2020). 676
Even with the limited reporting under E-PRTR, UWWTPs represent the major “point source” of 677 pollution to water (EEA 2018; EEA, 2019). It must be remembered that the pollution does not 678 derive from the UWWTP itself: rather, the many sources in the sewer network – homes, industry, 679 schools, etc – are collected at the plant. 680
681
2.7 Sludges arising from urban waste water treatment 682
2.7.1 Sewage sludge 683
Treatment of sewage at UWWTPs produces sewage sludge, which is usually treated (e.g. 684 dewatering, thickening, pasteurisation, sanitation, etc) to ensure that sludge is suitable for its 685 intended use or disposal. Two main types of sewage sludge arise from the waste water 686 treatment process: 687
• Primary sludge – settleable solids separated during primary treatment of waste water (physical 688 separation such as screening) 689
• Secondary sludge – organic material produced by bacteria during secondary, biological 690 treatment. 691
Sewage sludge is characterised by a high carbon and nutrient content and high water content. 692 It may contain pathogens and pollutants such as metals, persistent organic compounds, 693 microplastics and pharmaceuticals. It can have an unpleasant odour. Sludges from treatment of 694 urban waste water are categorised as “absolute non-hazardous” waste in the European List of 695 Waste (EC, 2018a). 696
Following its extraction from the waste water treatment process, sewage sludge requires 697 treatment to enable more efficient and safer transport and ultimate recovery (of nutrients or 698 energy) and/or disposal. Common treatment options include thickening, stabilisation, 699 dehydration and sometimes drying of sludge. Additional and well-established management 700 techniques for sewage sludge include lime treatment, anaerobic digestion (AD), composting 701 with other organic waste. Final recovery and disposal include spreading of treated sludge on 702 land and incineration. The application of sludge onto farmland is only allowed if the sludge 703 content remains under thresholds established for a set of heavy metals, and after given time 704 periods which should have passed between the production of the sludge and its application. 705 Minimum durations are set in the Sewage Sludge Directive (SSD) (EEC, 1986). 706
However, because the sludge can contain pollutants which have been “cleaned out” of the 707 water, there are concerns about the pollutant load in the sludge. Limits on metal loads to the 708 soil are set in the SSD and some countries have set stricter limits than those in this old Directive 709 (SSD evaluation; Ricardo 2021). Concerns in some Member States about the contaminant load 710 potentially entering human food, or being released into the environment, have led to 711 restrictions on sludge being put to land (e.g.DE, NL). Some countries have found that to maintain 712 consumer confidence, and to protect the environment, they have needed to develop 713 comprehensive assurance schemes for sludge applied to land (CROSS-REF to ch 3). 714
715
716

UWWT, CE and ZP, draft, 7th Oct 2021 Page | 25
2.7.2 Process waste 717
Every waste water treatment technology produces process waste that must be safely disposed 718 of, as well as treated water and sludge. Processing, treatment and disposal of the process waste 719 is subject to waste management legislation. Aims to minimise the amount of landfill waste by 720 2024 is likely to expand ways of treatment and disposal of process waste in terms of reuse and 721 recycling. 722
Large items, sands, fats, grease and oils resulting from sewage screening, sieving, oil separation 723 and fat extraction are usually considered as wastes requiring disposal. Other process wastes 724 depend upon the type of treatment technologies applied, and may include chemical sludge from 725 phosphorus precipitation, concentrated liquid wastes from membrane-based treatments and 726 spent activated carbon. It is difficult to find detail on amounts of waste produced by waste water 727 treatment processes. The substrate for trickling filters, such as lava rock or plastic substrate, can 728 last for decades so relatively insignificant. The amounts of sand used in sand filters are relatively 729 small in comparison to e.g those used in construction. A study performed by UKWIR considered 730 the use of activated carbon in micropollutant removal (UKWIR, 2020). Use of powdered 731 activated carbon was found not to be a viable option, given the large increase in sludge produced 732 that would need to be incinerated, with such capacity not being available in the UK where much 733 sludge goes to land. The use of granular activated carbon to remove micropollutants was 734 estimated at an additional 7-8% of the total produced by the UK water sector (4 million t/a), and 735 an increase of 2% in total dry solids sludge production (UKWIR, 2020). 736
Recovery of resources from waste water treatment residues, as an alternative to traditional 737 modes of disposal (landfilling, incineration) is the subject of numerous research projects, 738 studying for example conversion of fats, oils and grease from sewage pre-treatment to biofuel 739 using physicochemical processes, or recovery of resources from rejects from membrane-based 740 technologies applied in advanced treatment. 741
742
743
2.8 Greenhouse gas emissions 744
Typically we consider water quality and sewage sludge when thinking of impacts of waste water 745
treatment. However, direct emissions of greenhouse gases arise from biological treatment of 746
organic material in urban waste water, principally methane (CH4), and nitrous oxide (N2O) (which 747
is associated with nitrogen removal). Improved treatment of urban waste water since the 1990s 748
has helped to prevent significant methane emissions, owing to the collection and treatment of 749
wastewater in efficient, centralised facilities (EC, 2020), with emissions steadily declining to 17 750
351 kt CO2 eq in 2019 (Fig 2.11). The decline has largely been in methane emissions, which more 751
than halved since 1989, while those in nitrous oxides have changed little since the early 2000s, 752
at about 6 100 kt CO2 eq per year (EEA, 2021). 753
754
755
756
757
758
759
760

UWWT, CE and ZP, draft, 7th Oct 2021 Page | 26
Figure 2-11 CO2eq released by domestic waste water treatment 761
762 GHG emissions from domestic waste water treatment sector. Overall emission in CO2 equivalents 763 Source: EEA, GHG emission data viewer 764
765
Indirect emissions from UWWTPs arise mainly from the use of fossil fuels in electricity 766
production and in drying and transporting sewage sludge (Zheng and Ma, 2019). 767
768
Infrastructure for urban waste water treatment can lead to a high level of embedded 769
greenhouse gases, with estimates suggesting infrastructure-related GHG emissions comprise 770
about 50% of the total emitted by waste water treatment (JRC, ). Emissions arise from raw 771
materials extraction, content in materials, such as concrete and steel in pipes and tanks, and 772
those from construction. Scottish Water have developed a measure “investment intensity” to 773
assess and control emissions of this nature (Scottish Water, 2021). They estimate that 60% of 774
these emissions come from civil engineering, with infrastructure and mechanical and electrical 775
work making up most of the remainder. They aim to choose low emissions options, procure 776
low or zero emission construction materials and build using low or zero carbon construction 777
techniques. This will require innovation in the development of materials, construction methods 778
and equipment. 779
780
Waste water treatment can reduce emissions of greenhouse gases through a range of methods, 781 from optimising operation to modifying the plant. Emission of CO2 can be reduced by enhancing 782 energy efficiency of the treatment, minimising pumping and treatment of surface water runoff 783 and by generating biogas from the anaerobic digestion of sewage sludge as a source of heat and 784 energy in Combined Heat and Power production technology (CHP). Reductions in N2O can be 785 achieved by application of control strategies to prevent incomplete nitrification/denitrification, 786 while CH4 emissions can be reduced by control measures to prevent gas leakages from sludge 787 handling facilities and control of that formed in the sewers. 788
789
Additional demands for waste water treatment to remove micropollutants are likely to increase 790 energy requirements, as their removal is currently based mostly on energy intensive methods 791

UWWT, CE and ZP, draft, 7th Oct 2021 Page | 27
per unit of pollutant removed (Capodaglio and Oloffsson, 2019). Strategies that water utilities 792 could adopt to mitigate the carbon impact of micropollutant removal include: 793
• source control so that treatment is not required, 794
• least-carbon end-of- pipe/process addition which aims to find the least-carbon 795 solution, acknowledging the embodied and operational carbon emissions associated 796 with additional treatment. 797
• increased operational efficiencies. 798
• Redeveloping existing treatment processes to lower energy alternatives. 799
• renewable energy generation to reduce operational emissions e.g. through on-site 800 generation of energy. 801
802
803
804

UWWT, CE and ZP, draft, 7th Oct 2021 Page | 28
3 Energy and resources 805
3.1 Introduction 806
“Waste water treatment” is aimed at delivering clean water which is safe to be returned to the 807 environment. It implies a linear process. However, our use of water is a transient stage of its 808 natural cycle. Generation of sewage is largely predictable – a sustainable resource - allowing the 809 infrastructure for its use and re-use to be established. 810
Waste water treatment currently uses at least 1% of total energy production in Europe (Ganora, 811 2019; Capodaglio and Olson, 2020). Pumping and treating water makes it the largest municipal 812 use of energy. Energy efficiency can deliver savings on existing treatment costs, while demand 813 for more intensive treatment is likely to drive up the energy requirement. 814
Meanwhile, sewage contains valuable resources. In waste water, this includes the water itself, 815 but also heat, nutrients like nitrogen and phosphorus, and energy and other resources which 816 can be derived from sewage sludge. Treated sewage sludge itself is valued for its nutrient and 817 organic matter for agriculture in parts of Europe, but concern about mainly chemical 818 contamination constrains its potential applications. 819
Taken together, the best-operating plants are able to meet environmental discharge limits and 820 generate at least enough energy to power their own energy needs. The role of these “water 821 resource factories” (Kehrein, 2020) can underpin a circular economy. 822
823
3.2 Energy use and efficiency 824
3.2.1 Sustainable use of resources 825
Minimising unnecessary use of resources is the first step towards sustainability, and often can 826 provide monetary savings to operators. In the context of water, efficient use of this essential 827 resource should be high priority, both because water can be in short supply, and because 828 pumping and treatment are expensive in both energy and financial terms. Water saved from use 829 also does not become waste water. The circular economy under the Green Deal sets out the EC’s 830 ambitions for resource use, focusing on certain product chains and recognising the relationship 831 between circularity and climate neutrality (EC, 2020). 832
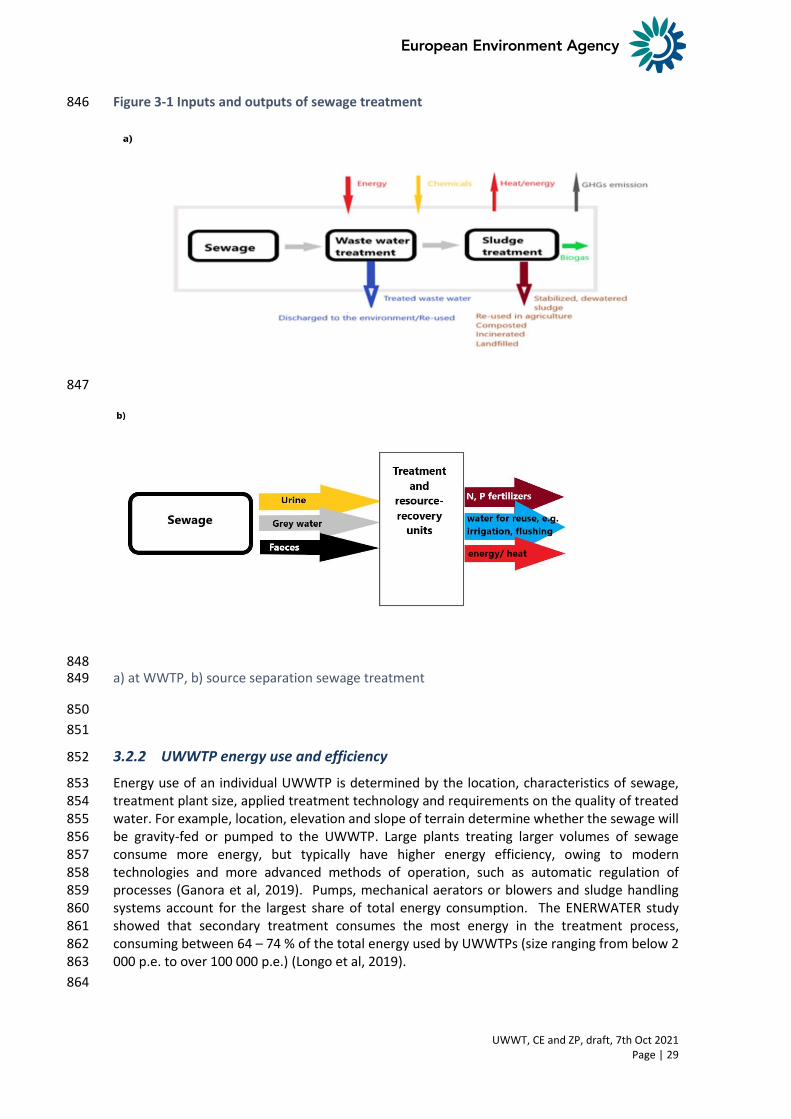
Figure 3.1 summarises the inputs and outputs of a) urban waste water treatment, and b) sewage 833 treatment separated at source, such as in decentralised treatment. While many of the products 834 are similar, the main difference is scale – typically, (a) might apply from 50 people to millions, 835 while currently (b) would mainly apply in Europe to pilot studies. This chapter mainly focuses on 836 conventional treatment (a) as the dominant approach. However, the importance of smaller scale 837 approaches (b) is increasing in innovative towns and operators. 838
839
840
841
842
843
844
845
UWWT, CE and ZP, draft, 7th Oct 2021 Page | 29
Figure 3-1 Inputs and outputs of sewage treatment 846
847
848 a) at WWTP, b) source separation sewage treatment 849
850
851
3.2.2 UWWTP energy use and efficiency 852
Energy use of an individual UWWTP is determined by the location, characteristics of sewage, 853 treatment plant size, applied treatment technology and requirements on the quality of treated 854 water. For example, location, elevation and slope of terrain determine whether the sewage will 855 be gravity-fed or pumped to the UWWTP. Large plants treating larger volumes of sewage 856 consume more energy, but typically have higher energy efficiency, owing to modern 857 technologies and more advanced methods of operation, such as automatic regulation of 858 processes (Ganora et al, 2019). Pumps, mechanical aerators or blowers and sludge handling 859 systems account for the largest share of total energy consumption. The ENERWATER study 860 showed that secondary treatment consumes the most energy in the treatment process, 861 consuming between 64 – 74 % of the total energy used by UWWTPs (size ranging from below 2 862 000 p.e. to over 100 000 p.e.) (Longo et al, 2019). 863
864

UWWT, CE and ZP, draft, 7th Oct 2021 Page | 30
Increasing energy costs, as well as pressure to reduce GHG emissions, have forced waste water 865 treatment operators to look for ways to optimize energy consumption and navigate towards 866 energy neutrality or even positivity, resulting in energy self-sufficiency or surplus (cross ref to 867 3.3.4). Reductions in energy consumption can be achieved through a variety of means. For 868 example, the installation of energy-efficient aeration equipment in secondary treatment, 869 improved process control, reduction of leakage, energy efficient approaches to sludge 870 thickening/dewatering e.g. optimised sludge dewatering. 871
It is estimated that if all plants that use more than the current average amount of energy were 872 shifted to the EU average value, the saving would be slightly more than 5 500 GWh/year. With 873 highly stringent targets of efficiency improvement, saving of about 13 500 GWh/year could be 874 expected (Ganora, 2019). 875
876
Text box: Improvements in energy efficiency 877
Bulgaria. The Sofia waste water treatment plant was commissioned in 1984 and 878 historically consumed between 16 000 and 24 000 MWh electricity per year. Following 879 the installation of combined heat and power (CHP) units in 2010, the energy produced 880 annually on site rose from 15 288 MWh to 23 100 MWh in 2017. Measures implemented 881 to reduce energy consumption included optimising the aeration process via air flow 882 regulation, improving the anaerobic digestion process and utilising heat potential of on-883 site CHPs. This led to the plant producing 23 % more energy than was needed for its 884 operation in 2017 (i.e. 4 300 MWh). 885
Source CircE. Energy production in Waste water treatment plant Kubratovo 886
887
Although the waste water treatment industry is not targeted by the EU Energy Efficiency 888 Directive (EU, 2018), water utilities use benchmarking and energy audit procedures as tools to 889 optimise energy consumption and greenhouse gas emissions in waste water treatment (Clos et 890 al, 2020). Currently there is no systematic EU wide data collection of the energy efficiency of 891 urban waste water treatment, as a standardized methodology at European level has not been 892 adopted. ENERWATER has developed a methodology for assessing and improving energy 893 efficiency and labelling of WWTPs, enabling a rapid audit and assessment for decision support. 894 895
3.3 Extracting resources from sewage and sewage sludge 896
3.3.1 Sewage sludge 897
Sewage sludge has been used for centuries as a fertiliser (Mulder, 2019). Addition of sewage 898 sludge to land can provide nutrients such as nitrogen and phosphorus, and humus which can 899 help the soil structure. Long term experiments show fertility enhancement after sewage sludge 900 application, resulting from lower soil bulk density and higher soil carbon concentration 901 (Börjesson and Kätterer, 2018). Where lime has been used to treat the sludge, the sludge can 902 also help reduce the acidity of agricultural soils. The Sewage Sludge Directive (EEC, 1986) sets 903 minimum treatment and standards to protect against health and pollution risks from sludge 904 application to land. This old Directive is currently under evaluation (autumn 2021) and is planned 905 for revision under the Green Deal. However, concerns remain that the treated sludge has 906 effectively collected many of the persistent pollutants present in waste water, which then may 907 be dispersed on to the land and become a source of diffuse pollution. A study in Norway 908 considered microplastics in sludge, concluding that they could be a major source to the 909 environment though with no assessment of the risk that this might present (Lusher et al, 2017). 910 Knowledge about the sources and presence of microplastics in water is still limited (EEA, in prep). 911
UWWT, CE and ZP, draft, 7th Oct 2021 Page | 31
A study investigating concentrations of metals and several pharmaceuticals in the sludge itself, 912 from 11 UWWTPs over a year, calculated that concentrations would be below soil predicted no 913 effect concentrations (UKWIR, 2018). 914
Across Europe, there are polarising opinions as to the fate of sewage sludge. In Germany there 915 is a national strategy to end the application of sewage sludge to soil, with deadlines by 2032 for 916 UWWTPs over 50 000 p.e., though sludge from smaller plants may still be used (Ricardo, 2021). 917 In parallel, the ProgGress strategy requires the recovery of phosphorus from the sludge through 918 mono-incineration (BMUB, 2016). Meanwhile, in Sweden, policy has shifted towards treated 919 sludge going to land as part of a more circular approach (text box). 920
921
Text box: REVAQ-CERTIFIED WASTE WATER TREATMENT PLANTS IN SWEDEN 922
In Sweden, concerns about contaminants in sludge led to recommendations not to apply sludge 923 to land during the early 2000s (Ricardo, 2021). However, in 2008 a collaboration between 924 farmers, regulators and the water and food industries led to a certification scheme “REVAQ”, 925 which assures the safety of sludge application to agricultural land, both in relation to the quality 926 of soil and food and to water quality. This has led to an increase in the amount applied to land 927 rising from 22 % in 2011 to 45 % in 2018 (Ricardo, 2021). Studies showed that “there is clear 928 evidence that sludge fertiliser application supplies plant nutrients and humus that agriculture 929 demands.” (Ministry of the Environment of Sweden, 2020). 930
931
3.3.2 Sewage sludge production 932
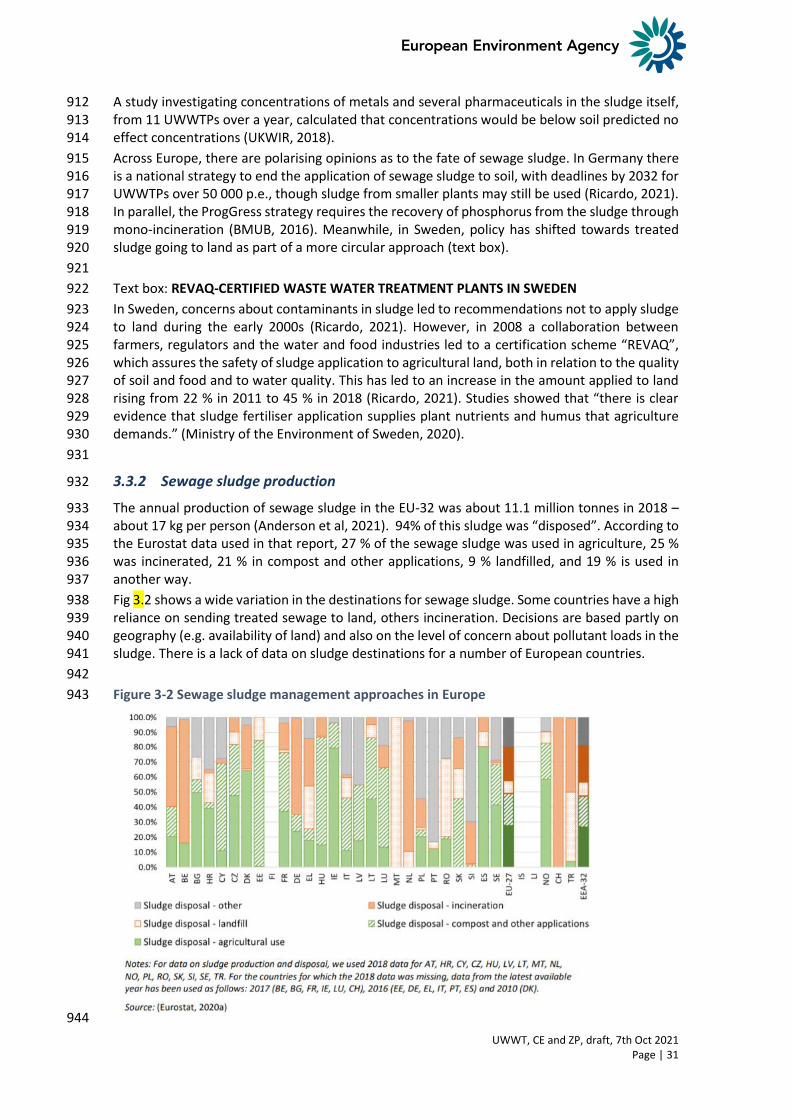
The annual production of sewage sludge in the EU-32 was about 11.1 million tonnes in 2018 – 933 about 17 kg per person (Anderson et al, 2021). 94% of this sludge was “disposed”. According to 934 the Eurostat data used in that report, 27 % of the sewage sludge was used in agriculture, 25 % 935 was incinerated, 21 % in compost and other applications, 9 % landfilled, and 19 % is used in 936 another way. 937
Fig 3.2 shows a wide variation in the destinations for sewage sludge. Some countries have a high 938 reliance on sending treated sewage to land, others incineration. Decisions are based partly on 939 geography (e.g. availability of land) and also on the level of concern about pollutant loads in the 940 sludge. There is a lack of data on sludge destinations for a number of European countries. 941
942
Figure 3-2 Sewage sludge management approaches in Europe943
944

UWWT, CE and ZP, draft, 7th Oct 2021 Page | 32
The cost for treatment + disposal of sludge in European countries has been estimated to reach, 945 on average, approximately 200 € per tonne of dry mass, according to the type of treatment and 946 disposal. 947
With regards to sludge production, the treatment can have two objectives: 948
• recovery of materials or energy from sludge, utilising its resource potential; 949
• reduction of the amount of sludge produced, minimising waste. 950
The increase of the solid content in sludge by dewatering significantly reduces the volume of 951 wet sludge for disposal. The reduction of dry mass of sludge leads to the reduction of solid 952 content and volume. Methods are based on physical, mechanical, chemical, thermal and 953 biological treatments. Most of them are aimed at solids solubilisation and disintegration of 954 bacterial cells in sludge. 955
956
3.3.3 Resource recovery from sewage sludge 957
Owing to its high nutrient and organic matter content, and the energy content of dried sludge 958 being comparable to that of woody biomass, sewage sludge is a potential secondary resource 959 which can contribute to Europe’s transition to a circular economy (Ricardo, 2021). A potential 960 obstacle for promoting sludge reuse and recovery stems from two policy objectives which may 961 be in conflict: 962
• Protection of the environment and human health, which require that sludge for reuse 963 complies with specific quality standards 964
• Resource efficiency promoting the use of sludge in agriculture, ensuring the recycling 965 and recovery of valuable and finite nutrients. 966
967
Prevention of contamination of sewage by persistent, hazardous pollutants would allow 968 recycling of sewage sludge on land without concerns that this might lead to diffuse pollution of 969 soils, plants and water. 970
The estimated annual amount of nutrients that could be potentially recovered from sewage 971 sludge produced in UWWTPs in the EU 27 ranges between 6 900 and 63 000 t of phosphorus 972 and between 12 400 and 87 500 t of nitrogen (EEA-32: between 8 100 and 68 100 t of 973 phosphorus and between 14 600 and 94 700 t of nitrogen). These amounts correspond 974 respectively to 0.6-6% of total P fertilizers and 0.1-1% of total N fertilizers used in the EU in 2018 975 (Anderson et al, 2021). 976
Sludge could also contribute to renewable energy policy and targets as feedstock for energy 977 generation, for example, through anaerobic digestion, incineration, pyrolysis and gasification. 978 Estimations of additional energy potential (i.e. on top of that already recovered) has been 979 subject to several studies assessing different sewage sludge options. Anderson et al (2021) 980 estimated that the EU-27 could potentially recover between 1 800 GWh and 3 200 GWh of 981 energy (net heat and electricity) through anaerobic digestion of the total generated sewage 982 sludge currently intended for landfilling and composting, and 250 GWh (net electricity) through 983 incineration of the total generated sewage sludge currently sent to landfill. This respectively 984 represents 7 % , 13 % and 1 % of the total waste water sector energy needs in the EU-27 in 2018. 985
Using an alternative approach to calculation, JRC (ref) estimated that up to an additional 3285 986 GWh could potentially be recovered through anaerobic digestion of the total sewage sludge 987 applied directly on land (30%) and 850 GWh resulting from incineration of sludge currently sent 988 to landfill. 989
Selection of the optimum sewage sludge option for energy recovery must consider additional 990 energy demands and GHG losses that arise from sludge processing. Energy savings and burdens 991 need to be summed to derive a net value for assessed energy recovery options. The JRC study 992 concluded that across different sewage sludge options, anaerobic digestion followed by use on 993

UWWT, CE and ZP, draft, 7th Oct 2021 Page | 33
land and co-incineration were the options that have the lowest (but still net positive) GHG 994 emissions. 995
996
Phosphorus 997
Phosphate rock has been identified as a critical raw material by the EC (EC, 2014). As an essential 998 nutrient for the food system, reuse and recovery of phosphorus is of high priority. Policies under 999 the Green Deal are addressing this: as part of the Circular Economy Action Plan, an integrated 1000 Nutrient Management Plan will be developed towards ensuring more sustainable application of 1001 nutrients and stimulating markets for recovered nutrients (EC, 2020). More broadly, the 1002 chemicals strategy for sustainability aims to promote the EU’s resilience of supply and 1003 sustainability of critical chemicals (EC, 2020). 1004
The recovery of phosphorus from sewage sludge is a great challenge for countries where sewage 1005 sludge is incinerated and where nutrients are not being recycled. Various recovery processes 1006 exist, but they are not (yet) cost-effective and are therefore not yet applied to large scale 1007 UWWTPs. In Switzerland, regulatory changes foresee already that phosphorus recovery from 1008 sewage sludge will become mandatory. Some incineration plants already store sludge ash to 1009 recover the phosphorus in future. 1010
Significant efforts have been made toward phosphorus recovery from sewage sludge based on 1011 the precipitation of phosphorus minerals e.g. in the form of struvites. These recovery 1012 technologies have been developed and put into operation largely in the Japan and Netherlands. 1013 Global demand for fertiliser is expected to increase by 4% a year due to population growth, so 1014 it can be expected that fertiliser recovery from waste water will gain further importance in the 1015 future. As well as conventional fertiliser, manure from livestock production also competes with 1016 fertiliser recovered from wastewater. In livestock-rich areas, manure may be a more cost-1017 effective solution than treated sewage sludge, demonstrating again the need to apply local 1018 solutions to sewage treatment (Kehrein, 2020). 1019
1020
Other resources can be recovered from waste water and sewage sludge e.g. cellulose, bioplastics 1021 and alginic acid (Kehrein, 2020). Case studies illustrate a wide variety of possible recovery 1022 options, as well as the technical solutions for resource recovery e.g. UWWTP Amsterdam West 1023 which considered the recovered products alginic acid, bioplastic, cellulose, phosphorus and 1024 biogas (van der Hoek et al, 2016). Blockers preventing wide-scale application of resource 1025 recovery is not the availability of technology, but the lack of a planning and design methodology 1026 to identify and deploy the most sustainable solutions in a given context. 1027
Actions leading to a more circular and sustainable economy revolve around reduction, reuse and 1028 recycling. Bottlenecks which can hinder the successful implementation of these can be grouped 1029 into three categories – Economics and value chain, Environment and health; and Society and 1030 policy. Recovering the value from sewage sludge illustrates aspects of bottlenecks, such as 1031 process costs, resource quality, market value and competition, and utilisation and application in 1032 the value chain assessment. Societal acceptance of the reuse of treated sewage sludge and 1033 resources recovered from it - overcoming the “yuck” factor - is an area with significant 1034 challenges. 1035
1036
3.3.4 Energy generation 1037
Although UWWTPs use significant amounts of energy, the waste water theoretically contains 1038 between five and 10 times more chemical and thermal energy than needed for treatment. While 1039 only some of that energy can be recovered, it is possible for UWWTPs to be net energy producers 1040 (Riley et al, 2020). 1041

UWWT, CE and ZP, draft, 7th Oct 2021 Page | 34
Energy recovery of the chemical, thermal and hydrodynamic energy contained in sewage can 1042 provide electricity, biogas, steam and hot water. The energy content of sludge is typically similar 1043 to the energy content of low-grade coal (Stone et al. 2010). Energy can be generated from 1044 sewage sludge through pre-treatment by anaerobic digestion to produce biogas, and/or by 1045 incineration of the sludge. Biogas comprises of 60 – 70 % methane, and 30 – 40 % of carbon 1046 dioxide, trace amounts of other gases (e.g. hydrogen, hydrogen sulphide and nitrogen). 1047 Recovery of methane from biogas allows use in applications such as gas engines, electricity 1048 and/or heat. Serious accidents can occur with biogas generation (e.g. BBC, 2020) and the ability 1049 to meet necessary safety standards as part of the transition to greater sustainability is an 1050 important consideration. 1051
In a study considering the potential for sludge currently landfilled in the EU-27, it was estimated 1052 that 7 - 13 % of UWWT energy needs (1 800 - 3 200 GWh6) could be met if that sludge were pre-1053 treated by anaerobic digestion, although data were hard to come by (Anderson et al, 2021). This 1054 value represents an upper limit, as it would not be feasible to implement anaerobic digestion at 1055 all UWWTPs. 1056
1057
Most focus on energy generation from UWWT has been on anaerobic digestion and incineration, 1058 but operators may have other options. For instance, solar and wind energy generation, and heat 1059 recovered from the waste water itself. Solar panels installed on the roofs of Viikinmäki UWWTP 1060 in Finland generate c.210 MWh per year, or approximately 0.5 % of annual electricity use. Heat 1061 recovery from effluent waste water shows can be a much more significant source of energy, 1062 with potential heat energy recovery at up to 500 % of a plant’s heat energy consumption 1063 (Heinonen, pers. comm.). Actual solutions for a particular plant depend on local circumstances. 1064 For instance, incineration facilities may not be available, while biogas generation may not be 1065 economic at some smaller sites. 1066
1067
1068
3.3.5 Water reuse 1069
A perhaps less-recognised benefit of waste water treatment is that it enables others to reuse 1070 this precious resource. Cleaning the water allows use for other human activities, avoiding the 1071 abstraction from other, possibly non-renewable sources, such as groundwater. 1072
The return of suitably-clean water is also important for aquatic life, ensuring there is sufficient 1073 water in lakes and rivers for life to persist. In parts of Europe, particularly the south, climate 1074 change is predicted to lower river discharge levels by up to 40% under a 3 oC temperature rise 1075 scenario (EEA, 2021). The WFD and Biodiversity Strategy (EC, 2020) consider ecological flows, 1076 i.e. the amount of water required for the aquatic ecosystem to continue to thrive and provide 1077 the services we rely upon (EC, 2016), but Member States are in early stages of implementation 1078 (EEA, 2021). 1079
Water reuse has become a key part of water resources management in countries suffering 1080
highest water stress. Where water resources are abundant or less stressed (CSI 018), waste 1081
water reuse is driven by other factors, e.g. conservation of groundwater resources, reduction of 1082
costs; the precautionary principle. The primary use of reused water is in irrigation for 1083
agriculture, with the modelled potential for reuse shown in Figure 3.4. Other uses are in 1084
irrigation of urban space, groundwater recharge and river flow improvement. 1085
1086
6 Values for EEA-32 were 1 900 – 3 300 GWh

UWWT, CE and ZP, draft, 7th Oct 2021 Page | 35
• Indirect reuse is the reuse of treated waste water which is placed into a water body such 1087 as a lake, river, or aquifer, and then some of it retrieved for later use. 1088
• Direct reuse of treated waste water refers to the introduction of treated waste water 1089 via pipelines, storage tanks, and other infrastructure directly from a water treatment 1090 plant. For example, the distribution of treated waste water to be used directly in 1091 agricultural irrigation. 1092
1093
The quality requirement of reclaimed water is dictated by the final use (agricultural, industrial, 1094 urban, environmental, recreational) and this determines the treatment technology to be 1095 applied. Waste water treatment plants producing reclaimed water may be equipped with an 1096 advanced treatment composed of different technologies (e.g. coagulation/flocculation, 1097 filtration, ultrafiltration, reverse osmosis, disinfection) which determine investment, 1098 maintenance, and operating costs. 1099
1100
Implementation of water reuse is not widespread in the EU, though it is increasing in some 1101 Member States (Fig 3.x). It has been estimated that the potential for treated urban effluents in 1102 the EU is six times higher than current level of reuse (Pistocchi et al, 2017). In countries with 1103 significant problems of water stress or water scarcity, water reuse practice has been developed, 1104 facilitated by national guidelines providing regulatory reference on water reuse practices. Data 1105 are hard to come by but suggest that Cyprus reuse more than 90% of their waste water, followed 1106 by Greece, Malta, Portugal, Italy and Spain, where the share of reused urban effluent range 1107 between 1 and 12%. Water reuse schemes have been locally applied in other EU countries, e.g. 1108 Belgium and Germany, for purposes such as urban irrigation, industrial uses, and aquifer 1109 recharge. In Sweden, a key driver was the protection of coastal water quality and conservation 1110 of groundwater resources. 1111
1112
Figure 3-3 Water reuse in Mediterranean EU Member States1113
1114
1115
1116
1117
1118

UWWT, CE and ZP, draft, 7th Oct 2021 Page | 36
Figure 3-4 Modelled potential of water reuse for agricultural irrigation in the EU 1119
1120 Source: Pistocchi et al, 2017 1121 Note: Average irrigation water requirement, computed with the EPIC model. 1122
The reuse of treated water helps to increase the available amount of water at a relatively low 1123 marginal cost. The treated effluent quality can be adapted to the users’ needs, allowing 1124 economic efficiency. Costs of treated waste water can be lower where uses are closer to each 1125 other, owing to savings in infrastructure and transport costs. However, issues such as social 1126 acceptability of reusing “waste water”, costs in comparison to abstracted water and the 1127 infrastructure investment which may be needed can act against implementation of water reuse. 1128
Despite the Water Reuse Regulation of 2020, which recognises that water reuse will become 1129 more necessary and so set standards for the agricultural reuse of waste water, numerous 1130 barriers to water reuse still exist in Europe. Drivers for reuse include population pressure and 1131 water scarcity. A coherent legislation framework (currently being established in the frame of 1132 Circular Economy Plan) is needed, which provides flexibility for treated water quality depending 1133 on destination uses, and allows for governance structures enabling interdependencies between 1134 waste water providers and users of reused water. 1135
1136
Text box /case studies: Waste water reuse 1137
Case study – waste water reuse for irrigation - Milan, Italy 1138
Reuse of wastewater for irrigation reduces the quantity of drinking water used for 1139 irrigation and guarantees supply of high-quality water for farmers in the Milan area. All 1140 the water treated by the Nosedo and San Rocco plants meets the limits applicable to 1141 reuse for irrigation purposes, as certified by ARPA, and is used to irrigate a substantial 1142 portion of farmland with a surface area of over 100 km2. This practice for irrigating the 1143 rural areas outside the city, has its roots in the past and reflects the historical and 1144 cultural heritage of the area. 1145
1146
1147
UWWT, CE and ZP, draft, 7th Oct 2021 Page | 37
Case study – beer brewed using recycled waste water - Čížová microbrewery – Czechia 1148
To raise public awareness of the importance of preserving water, together with Veolia, 1149 Čížová microbrewery in the Czech Republic developed a beer brewed using recycled 1150 waste water. Veolia recovers waste water at its Prague treatment plant and then 1151 treats the water using a mobile, membrane water reclamation unit. The treatment 1152 comprises coagulation, followed by ultrafiltration and reverse osmosis, where ultra-1153 fine synthetic membranes serve as a filter that lets water pass through and retains 1154 suspended solids and other substances, such as micro-organisms and viruses. The 1155 water is then filtered through granulated activated carbon and disinfected. The 1156 advantage of membrane technology is that the filtration does not need added 1157 chemicals and new types of membranes have low energy consumption. The treated 1158 water is then transported to Čížová microbrewery, where it is used to brew ERKO beer. 1159 15 hectoliters of lager were produced in May 2019 and more continue to be produced 1160 as the interest in supporting recycling schemes grows. 1161 1162
1163
3.4 Low input sewage treatment 1164
Options for waste water treatment are constrained by local factors. A densely populated city, 1165 with many industries and limited land availability presents one extreme, while sparsely 1166 populated, rural areas represent another. Construction of waste water treatment plant can 1167 involve greenhouse gas-intensive activities and high costs, in both the building and operating 1168 phases. Alternative solutions can use less energy, release fewer harmful emissions and provide 1169 local benefits and control (Water Projects online, 2019). 1170
1171
A focus on nature-based solutions under the EU’s Biodiversity Strategy (EC, 2020) brings 1172 attention to small-scale solutions to sewage treatment. Natural wetland systems are able to 1173 transform and/or remove various pollutants through a series of physical, biological, and 1174 chemical processes, and therefore improve water quality. These processes are mimicked in so-1175 called “constructed“ wetlands. These treat waste water near its source, without high demands 1176 on infrastructure and operational costs, while enabling recovery and use of resources from 1177 waste water and increasing green space in rural or peri-urban areas. In a study on Slovenia, the 1178 JRC compared various solutions in terms of cost-effectiveness and socioeconomic acceptability. 1179 They found that nature-based solutions were a preferred option for areas with a predominance 1180 of rural, scattered dwellings and small settlements. The concept was proposed as a mainstream 1181 solution for the less urbanized areas of the Lower Danube region (Pistocchi et al, 2020). 1182
Owing to their low costs and low maintenance, constructed wetlands are popular in low-income 1183 regions. But they can be also used as a decentralised approach for blocks of buildings, 1184 neighbourhoods, commercial facilities, isolated communities and remote areas, etc. Reduction 1185 of nutrient concentrations can deliver similar results to tertiary treatment (Cooper et al, 2020). 1186 Studies on micropollutants suggest that such constructed wetlands can be effective at 1187 preventing release to water (Gorito et al, 2018) though care must be taken to ensure oxidation 1188 conditions in constructed wetlands are appropriate to address organic micropollutants (Reyes 1189 Contreras et al, 2019). 1190
1191

UWWT, CE and ZP, draft, 7th Oct 2021 Page | 38
Figure 3-5 Comparison of needs for land, energy and maintenance between constructed 1192 wetlands and conventional urban waste water treatment1193
1194
1195 Source Stefanakis, 2019 1196
Recent technological advances have managed to significantly close the gap with conventional, 1197 mechanical technologies in terms of land requirement (e.g. the compact, mobile aerated 1198 constructed wetland) (Stefanakis, 2019). Such solutions can be integrated in urban and peri-1199 urban areas for wastewater treatment and urban runoff control and management, following the 1200 decentralised approach. For example, the INNOQUA Horizon 2020 project investigated a 1201 modular system for water treatment based on the purifying capacity of biological 1202 microorganisms (earthworms, zooplankton and microalgae), developing a technology for 1203 decentralised waste water treatment (INNOQUA). 1204
1205
Text Box: Waste water purification in villages in Spain 1206
In Spain, the challenge for administrations to implement waste water purification systems in 1207 towns with less than 1 000 inhabitants stood out in the search for balance between the 1208 elimination of pollution and the economic sustainability of treatment plants. The cost of 1209 operation and maintenance of a conventional treatment plant in municipalities with more than 1210 10,000 inhabitants could be around 10 euros per inhabitant per year, while in a town where 1211 fewer than 100 people live it would increase to 345 euros. Use of alternative technologies with 1212 lower maintenance costs, adapted to the local situation was expected to significantly reduce this 1213 economic gap. Analysis was carried out on the presence of emerging pollutants in the waters of 1214 the treatment plants of the Badajo province, such as drugs and herbicides. This highlighted 1215 analgesics as being the emerging pollutants with the highest concentration in the water entering 1216 the treatment plants, although in 90 percent of the cases, residues were eliminated during the 1217 purification process. 1218
1219
UWWT, CE and ZP, draft, 7th Oct 2021 Page | 39
4 Systemic change: Zero pollution, circular 1220
economy 1221
4.1 Introduction 1222
Treatment to clean our sewage is essential to protect human health and the environment. Waste 1223 water treatment is also expensive, resource intensive and can generate significant greenhouse 1224 gas emissions. In seeking to protect the environment from micropollutants generated by our 1225 modern way of living, we solve the issue by adding yet more resource-intensive solutions, 1226 creating more waste and emissions. In our focus towards ensuring the water cycle is respected, 1227 we have developed a linear solution – missing the circularity which sewage treatment should 1228 represent. This approach is an unsustainable way to resolve an issue of a “waste” that will be 1229 continuously generated. 1230
1231
A central problem that we create for ourselves is the use of substances which are harmful to the 1232 environment, traces of which can enter the water system from our homes, schools and 1233 workplaces. Some of these substances are essential and alternatives may not be available. But 1234 for others, achieving the aims of the Chemicals for Sustainability Strategy provide for a long term 1235 solution. Transitioning to a society where chemicals and products no longer contain substances 1236 of concern7 both advances zero pollution and also allows circularity, within the product as well 1237 as the “waste water” chain. In advance of achieving that ambition, we will nevertheless have to 1238 manage pollutants already in use and circulation. 1239
Historically, we have left it to water managers to solve society’s waste problem, at the end of 1240 the pipe. But already more sustainable solutions are being trialled by innovative utilities, villages 1241 and cities. By recognising the central role that waste water treatment can play in a circular, zero 1242 pollution economy, full power can be applied to achieve systemic change. 1243
4.2 Re-thinking “urban waste water treatment” 1244
As a society, we have gone to considerable lengths to address the harm that our untreated 1245 sewage causes to human and environmental health. The 1991 UWWTD required that Member 1246 States provide collection systems and treatment of waste water, which has led to significant 1247 improvement in Europe’s water quality. 1248
But, this has come at considerable cost – financial, in pollutants to water and greenhouse gas 1249 emissions, and, as we look ahead to a changing climate, with new challenges. More intense 1250 rainfall in parts of Europe is leading to more frequent surface water flooding and discharge or 1251 runoff of pollutants. In other areas, lack of water resources is becoming a key concern. 1252 Demographic change can lead to over- and under-capacity in water utilities such as UWWTPs, 1253 reducing their efficiency. 1254
Practically, we have built a system which requires dilution of a nutrient and energy-rich natural 1255 resource by clean water, mixing that with other potentially harmful substances, then draining 1256 or pumping this mixture through an extensive pipeline network to a central point. Here, energy 1257 is used to aerate and pump “waste water” through various filters and treatment facilities, dry 1258 out the solid material and then discharge the cleaned water. Disposal of the sewage sludge faces 1259 continual challenges for politically-acceptable and economically-viable routes. This linear 1260
7 i.e. those with persistent, toxic, bioaccumulative and mobile characteristics
UWWT, CE and ZP, draft, 7th Oct 2021 Page | 40
approach focuses on water quality, giving much lower priority to other environmental 1261 dimensions. 1262
1263
There are other ways to manage our sewage safely and with much less infrastructure. Keeping 1264 the sewage from toilets separate from other contaminated “grey” water, such as that from 1265 washing, allows alternative, water-less treatment to kill pathogens and recover the nutrients 1266 and or energy (Zeeman and Kujawa-Roeleveld, 2011). Meanwhile, less intensive treatment, or 1267 no treatment, allows the grey water to be reused where quality demands are lower, e.g. in parks 1268 and gardens. Such decentralised schemes can operate at a very local scale, e.g. buildings and 1269 streets. 1270
Clearly, such approaches are niche in the near term. Conventional safe treatment and 1271 management of human waste mostly relies on expert engineers and water managers, and the 1272 infrastructure in homes, schools and workplaces mostly relies on connection to waste water 1273 treatment plants. Experiments with building-focused sewage treatment and water reuse have 1274 already shown the problems associated with construction mistakes, where effluents from other 1275 non-drinking water systems in buildings have been introduced into the drinking water 1276 distribution system, compromising human health (EC, 2021). Less immediate, environmental 1277 harm may be caused if the waste from ourselves and our houses continues to be contaminated 1278 with micropollutants (Zintz et al, 2021; Comber et al, 2014). However, households with 1279 individual treatment systems such as septic tanks tend to be careful not to poison those systems 1280 (Mulder, 2019). Realising the ambitions of the Chemicals Sustainability Strategy over the longer 1281 term is key to reduce harmful micropollutants at source. “Hybrid grey and green” water 1282 infrastructure combines centralised and decentralised water treatment, leading to reduced 1283 water loss, increased water reuse, optimising the exploitation of alternative water sources in a 1284 circular economy, and strengthening resilience against climate change events (WE, 2020). 1285
One of the features of such a local approach is that it already provides the opportunity for small, 1286 remote or under-served communities to tackle sewage treatment in areas where that is still 1287 lacking, and to develop skills and capabilities in “new” technologies (or rather, re-learning 1288 traditional recycling). New developments in urban areas, such as the brownfield site at 1289 Buiksloterham (see text box), can provide opportunities in purpose-built, decentralised 1290 treatment approaches. 1291
1292
Text box: Case study – Collaboration, city level - Amsterdam, the Netherlands. 1293
In Buiksloterham, a collaboration between the water board, municipality and housing 1294 corporation is piloting a study on separation of waste water at source, to test the 1295 sustainability of decentralized sewage treatment. An innovative vacuum sewer and 1296 floating treatment plant has been built with a capacity of 1550 p.e., with vacuum toilets 1297 installed in 47 floating homes. 1298
The traditional waste water sewer system is replaced by a multiple sewer system, which 1299 consists of a vacuum pipe with a small diameter for the concentrated collection of 1300 sewage and a free-fall pipeline for grey water. This collection method enables efficient 1301 local water treatment and raw materials (phosphate), heat and energy (biogas) can be 1302 recovered and reused locally. This primarily provides raw materials and energy, but also 1303 saves energy through avoidance of pumping waste water over long distances. 1304
Amsterdam plans to learn from Buiksloterham in its development of Strandeiland, a new 1305 island in IJburg where approximately 8,000 homes will be built. The water board and the 1306 municipality want to apply New Sanitation there, as well as using thermal energy from 1307 waste water and surface water to make Strandeiland energy neutral. 1308
1309
UWWT, CE and ZP, draft, 7th Oct 2021 Page | 41
4.3 Zero pollution and waste water treatment 1310
Health protection and prevention of pollution continue to be the key purpose of sewage and 1311 urban waste water treatment. Improved scientific knowledge since the 1990s has shown the 1312 presence of many pollutants in surface waters, and many of these arise from chemicals and 1313 products that we use in our homes and workplaces. Cleaning, washing and runoff introduce 1314 these into the waste water stream. Such societal and sectoral issues are beyond the capacity of 1315 water managers to resolve, but rather, require wholesale review of what substances we choose 1316 or allow to be used. Such is the role for the Chemicals for Sustainability Strategy, launched by 1317 the EC in 2020 (EC, 2020). Among its ambitions, the Strategy aims to ban the most harmful 1318 chemicals in consumer products and allow use of such substances only where essential. This is 1319 key to reducing the load of harmful chemicals into waste water. The ambition to boost the 1320 production and use of chemicals that are safe and sustainable by design should lead to lower 1321 chemical pollution over the longer term. In turn, lowered pollution loads in waste water will 1322 reduce the need for intensive treatment i.e. turning from a vicious into a virtuous circle. 1323
1324
Meanwhile, UWWTPs face the challenge of cleaning up waste water to meet more demanding 1325 standards set in legislation. Modelling for the revised UWWTD by the JRC has examined the costs 1326 and benefits of micropollutant removal, considering ca. 1200 chemicals assumed as a proxy of 1327 the total pollution conveyed by raw wastewater. This has shown that advanced treatment for 1328 micropollutants at all plants in Europe with a capacity of 100 000 p.e. or more could reduce the 1329 overall toxicity of discharged effluents by about 40% (JRC, 202x). 1330
1331
The decisions taken to addressing sewage treatment through any particular approach are 1332 necessarily local. Water managers aim to optimise according to local requirements and 1333 possibilities: ensuring and enabling circularity principles form part of those considerations is the 1334 role of policymakers. Where trade-offs come into play, ensuring the protection of human health 1335 and the environment should take primacy. 1336
1337
4.4 Circular economy – from “waste water treatment” to resource 1338
recovery 1339
The goal of a circular economy is to manage natural resources efficiently and sustainably (EEA, 1340 2016). Respecting planetary boundaries through increasing the share of renewable resources 1341 while reducing the consumption of raw materials and energy, and at the same time cutting 1342 emissions and material losses, meets goals set both for sustainability and business efficiency. 1343 The Circular Economy Action Plan under the Green Deal seeks to accelerate the transition 1344 towards a regenerative growth model and move towards keeping resource consumption within 1345 planetary boundaries, thereby reducing Europe’s consumption footprint (EC, 2020). Three 1346 principles underpin the detail for a circular economy: 1347
Eliminate waste and pollution 1348
Circulate products and materials 1349
Regenerate nature 1350
Source: Ellen MacArthur Foundation, n.d. 1351
1352
Water in the environment follows a natural cycle that secures water resources by regulating 1353
water flow and ensuring water quality. On the other hand, in systems created by people that 1354
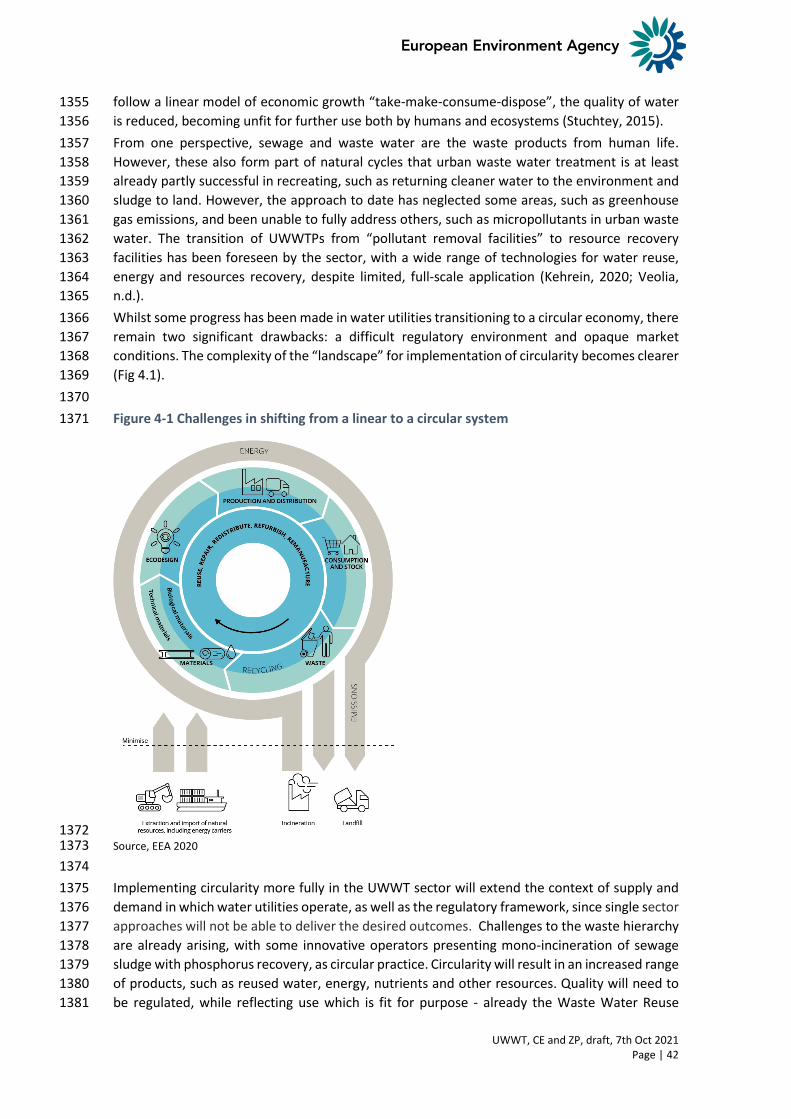
UWWT, CE and ZP, draft, 7th Oct 2021 Page | 42
follow a linear model of economic growth “take-make-consume-dispose”, the quality of water 1355
is reduced, becoming unfit for further use both by humans and ecosystems (Stuchtey, 2015). 1356
From one perspective, sewage and waste water are the waste products from human life. 1357
However, these also form part of natural cycles that urban waste water treatment is at least 1358
already partly successful in recreating, such as returning cleaner water to the environment and 1359
sludge to land. However, the approach to date has neglected some areas, such as greenhouse 1360
gas emissions, and been unable to fully address others, such as micropollutants in urban waste 1361
water. The transition of UWWTPs from “pollutant removal facilities” to resource recovery 1362
facilities has been foreseen by the sector, with a wide range of technologies for water reuse, 1363
energy and resources recovery, despite limited, full-scale application (Kehrein, 2020; Veolia, 1364
n.d.). 1365
Whilst some progress has been made in water utilities transitioning to a circular economy, there 1366
remain two significant drawbacks: a difficult regulatory environment and opaque market 1367
conditions. The complexity of the “landscape” for implementation of circularity becomes clearer 1368
(Fig 4.1). 1369
1370
Figure 4-1 Challenges in shifting from a linear to a circular system 1371
1372 Source, EEA 2020 1373
1374
Implementing circularity more fully in the UWWT sector will extend the context of supply and 1375
demand in which water utilities operate, as well as the regulatory framework, since single sector 1376
approaches will not be able to deliver the desired outcomes. Challenges to the waste hierarchy 1377
are already arising, with some innovative operators presenting mono-incineration of sewage 1378
sludge with phosphorus recovery, as circular practice. Circularity will result in an increased range 1379
of products, such as reused water, energy, nutrients and other resources. Quality will need to 1380
be regulated, while reflecting use which is fit for purpose - already the Waste Water Reuse 1381

UWWT, CE and ZP, draft, 7th Oct 2021 Page | 43
Regulation (2020) has taken steps in this direction. Customers across different economic sectors 1382
e.g. energy, agriculture and industry, need to play an active role in defining the quality of 1383
products. Specific value chains, embedded in local or regional economies, may need to be 1384
established for specific products or services. Taken together, delivering circularity will require 1385
adaptation of existing institutions and regulatory practices. Holistic, integrated water 1386
management is required which does not necessarily follow conventional administrative, 1387
sectoral, political and geographical boundaries. It will need to build on broad-based engagement 1388
and partnership ( Stuchtey, 2015; IWA, 2016; Arup et al., 2018). 1389
1390
4.5 Accelerating the transition 1391
Sewage treatment is an essential service which can provide clean water, nutrients and 1392 renewable energy. However, in its current operation it uses significant amounts of energy, leads 1393 to significant emissions of greenhouse gases and produces sewage sludge in large quantities 1394 which may represent disposal problem for utilities. The shift from “waste water management” 1395 to “resource hubs” is already happening in some forward-thinking towns and utilities (text 1396 boxes). 1397
1398
Text box: Case study – Net zero emissions - Scottish Water, UK 1399
Scottish Water have a target to reach net zero GHG emissions by 2040. Some actions are 1400 directly in their control, such as improving energy efficiency and hosting renewable 1401 energy. But others require efforts to influence customers and supply chains, such as the 1402 amount of water people use, removing surface water from sewers, and reducing 1403 emissions in the cement they buy (Scottish Water, 2021). They have identified areas for 1404 innovation, such as low energy treatment methods; ammonia and methane recovery; 1405 the need for digital and analytical tools; low/zero emissions materials for investment 1406 and operations. 1407
1408
Text box: Case study – Energy efficiency and recovery - Marselisborg UWWTP, Denmark 1409
In 2005, Aarhus City Council decided to upgrade and consolidate its municipal waste 1410 water treatment system, which at that time comprised of 17 smaller facilities. The 1411 Danish water sector aims to be climate and energy neutral by 2030. 1412
Marselisborg UWWTP has increased plant efficiency and reduced energy consumption 1413 by optimising its processes. It now produces 50 % more electricity than it needs for 1414 UWWT and 2.9 GW of heat for the district heating system. Energy-saving technologies 1415 include an advanced control system, a new turbo compressor, sludge liquor treatment 1416 and optimisation of the bubble aeration system. This has resulted in saving 1417 approximately 1 GWh/year (c.25 %) in power consumption. By implementing energy 1418 efficient solutions and producing biogas from the sludge, the utility is able to cover 1419 almost all the energy needed for the whole water cycle - from groundwater extraction, 1420 to pump stations, water distribution and waste water treatment. 1421
1422
While solutions adapted to the local situation are necessary for sewage treatment, the 1423 characteristics which are necessary to achieve a transition to more sustainable approaches can 1424 be set out. Innovation can play major role in enabling circularity. More efficient technologies, 1425 which eg reduce energy costs of resource recovery and increase recovery rates are perhaps 1426 obvious, but innovation also applies to new partnerships extending across public administration, 1427 research, industry and citizens, with new business models and new forms of water governance 1428

UWWT, CE and ZP, draft, 7th Oct 2021 Page | 44
(Martins et al, 2013; Moore eta al, 2014; EWA, 2014). Sustainability, nature-protection ideas and 1429 citizens can contribute to the exploration of alternative domestic, communal, and public 1430 approaches. The Strategic Implementation Plan for EIP Water identifies several areas, such as 1431 water re-use and recycling; water and waste water treatment; the water-energy nexus; and 1432 cross-cutting issues including water governance; decision support systems and monitoring and 1433 financing (European Commission, 2012a). Digitalisation can help in the delivery of improved 1434 efficiency and productivity, and faster monitoring to inform decision-making (Mbavarira and 1435 Grimm 2021; EC, 2021). Connecting to Stakeholders beyond Traditional Boundaries provide 1436 mechanisms to promote a shift towards markets for recovered resources and sustainable 1437 technologies, using perhaps Integrated Resource Management as a process to bring together all 1438 the resource groups. This allows optimisation of the supply and demand for resources, and for 1439 opportunities and synergies to be taken into account, helping to place recovered resources in 1440 appropriate value chains. Practically, achieving circular practice can require intense efforts by all 1441 players, not least in the area of enabling legislation (text box). 1442
1443
Text box: Case study – Legislative barriers to urban phosphorus recovery - NL 1444
Phosphorus can be recovered in different products from sewage sludge, for example as 1445 struvite (which can be used as a slow-release fertiliser) or in ash following mono-1446 incineration (where the sludge is not mixed with other wastes). In the Netherlands, 1447 experiments to recover struvite from UWWTPs at full scale started in 2006, but 1448 introduction to the fertiliser market was hindered by the classification of struvite as a 1449 waste, with the Fertilisers Act prohibiting use of wastes. A change in legislation was 1450 supported by extensive studies examining struvite use as a fertiliser and various 1451 initiatives of the Dutch Nutrient Platform, in particular the Dutch Phosphate Value Chain 1452 Agreement signed by more than 30 businesses, research institutes, non-governmental 1453 organisations and the Dutch Ministry of Infrastructure and Water Management, to 1454 initiate a sustainable market for reusable phosphate streams (Nutrient Platform, 2021). 1455 Use of struvite and other two recovered phosphates as fertilisers was eventually 1456 approved from 2015. 1457
1458
4.5.1 De-centralised solutions for circularity 1459
One of the empowering aspects of sewage treatment is that local conditions lead to necessarily 1460 local solutions (APE, 2019). There are tools for individual houses, small villages and towns, up to 1461 major cities. 1462
Decentralised waste water management is used to treat and dispose, at or near the source, 1463 relatively small volumes of waste water, originating from single households or groups of 1464 dwellings located in relatively close proximity (less than c. 3–5 km) and not served by a central 1465 sewer system connecting them to a regional UWWTP. While still needing a local collection 1466 system, this is likely to be much smaller and less expensive than those used for conventional, 1467 centralized treatment, especially when the greywater components have been separated human 1468 waste (Capodaglio, 2017). Decentralised systems focus on the on-site treatment of waste water 1469 and on local recycling and reuse of resources contained in domestic waste water. They are 1470 particularly attractive because of the possibility of reducing long-term treatment costs. The 1471 systems can be easily adapted to local conditions, capacity can be added incrementally and 1472 quickly. As such they can serve as alternatives to conventional expansion/refurbishment of the 1473 sewer network and thus could help to save funds in the short and long terms. Remote control 1474 and monitoring contributed to operation and management improvement and resolved problem 1475 with lack of skilled personnel. Decentralised solutions enable introducing source separation 1476 between urine and faeces, and possibly grey water through toilet systems or other water saving 1477 systems which can further enhance resources and energy recovery. 1478

UWWT, CE and ZP, draft, 7th Oct 2021 Page | 45
Decentralised solutions in general will tend to be compatible with local water use and reuse 1479
requirements where locally treated water could support agricultural productivity or (in more 1480
urban areas) be used as a substitute for drinking water for uses which do not require such high 1481
quality (e.g. landscaping, surface storage, recreation, groundwater recharge, industrial 1482
application/ cooling) (Capodaglio, 2017). 1483
The decision to implement a decentralised solution to waste water treatment needs is usually 1484
made or discussed at the local level, and local stakeholders are usually more proactive when 1485
considering these systems. Stakeholder involvement can help in establishing closed loops for 1486
local reuse of recovered resources and thus contribute to establishing viable value chain for 1487
recovered resources as a part of local economy. As such they can serve as sources of valuable 1488
novel approaches, and testing laboratories for new concepts that can be extrapolated at larger 1489
scales. 1490
1491
4.5.2 Individual action 1492
For those of us living in areas where our sewage and waste water disappears down the pipe, our 1493 influence on reducing the environmental impact of UWWT might seem somewhat remote. But 1494 we all have a part to play. 1495
i) Water efficiency. Using water more efficiently not only saves water, but also the 1496 energy put into treating it and pumping it to the tap, and then the resources to take 1497 it through the UWWT process. 1498
ii) Avoid putting harmful pollutants down the sink and drain. Then they do not need to 1499 be removed from the water - if indeed, it is possible to remove them. Safe disposal 1500 of pollutants is usually offered by local councils. Leftover medicines can be taken 1501 back to pharmacies. 1502
iii) When replacing clothes, textiles and furniture, consider those which are made of 1503 environmentally-friendly materials if possible. This helps avoid pollutants in such 1504 products being washed out and then eventually reaching the sewer system. 1505
1506
4.6 What needs to change 1507
With no change to current direction, the trajectory for UWWT in Europe is for more energy-1508 intensive treatment, to remove micropollutants about which we are becoming increasingly 1509 aware. Concern about pollutants transferred to sludge during water treatment will continue to 1510 limit opportunities for using sewage sludge in application to land, leading to increased demand 1511 for incineration and problems for regions lacking such capacity. Infrastructure investment costs 1512 will continue to increase, along with the GHG emissions embedded in concrete, plastics and steel 1513 for sewer networks and treatment plants. 1514
Water managers are skilled at optimising processes within their remit. UWWTP processes can 1515 be optimised to improve energy efficiency. GHGs released during treatment are being reduced 1516 and more energy recovered from the UWWT cycle, such as in biogas and through heat recovery. 1517 Nutrient recovery, particularly of phosphorus, is driving innovative utilities towards solutions 1518 such as mono-incineration and finding applications for reuse of remaining ash. 1519
Accepting this situation with no change risks accepting an unsustainable lock-in (EEA, 2020). 1520
Addressing long-term sustainability in this area means fundamentally reviewing the purpose of 1521 sewage treatment. In the long term, protecting human health and the environment from sewage 1522 and waste water does not necessarily require the major infrastructure programme that we have 1523 developed. Decentralised and nature-based solutions, such as constructed wetlands and source 1524 separation schemes, allow for low input, effective sewage treatment, while at the same time 1525

UWWT, CE and ZP, draft, 7th Oct 2021 Page | 46
producing local environmental benefits such as green space. The treatment solution at any 1526 particular place has to reflect the local situation, but more sustainable approaches should be 1527 enabled. 1528
Achieving a circular economy in sewage treatment is a long term project and is dependent on 1529 many contributors. From realising the Chemicals Strategy for Sustainability to prevent 1530 micropollutants reaching sewage from our homes, to enabling legislation at all levels, to 1531 establishing viable markets for recycled products. Such are the needs to transition to the 1532 sustainability envisaged by the Green Deal. 1533
1534
1535
1536
1537
1538 1539
1540

UWWT, CE and ZP, draft, 7th Oct 2021 Page | 47
List of abbreviations -to be added 1541
Abbreviation Name Reference
EEA European Environment Agency www.eea.europa.eu
1542
1543
1544

UWWT, CE and ZP, draft, 7th Oct 2021 Page | 48
Glossary – to be added 1545
Word Meaning
Eutrophication
1546
1547
1548

UWWT, CE and ZP, draft, 7th Oct 2021 Page | 49
References – to be added 1549
• For print references use the following format: 1550
• Author’s surname, author’s initial(s)., year of publication, Title of reference work 1551
(where appropriate include edition number), publisher, place of publication, relevant 1552
page numbers if necessary. 1553
1554
• For online references use the following format: 1555
• Author’s surname, author’s initial(s)., year of publication, Title of reference work 1556
(where appropriate include edition number), publisher, (URL) accessed ../../…. 1557
1558
1559


![Beyond Kuperberg Flows - homepages.math.uic.eduhomepages.math.uic.edu/~hurder/talks/Bedlewo20130603.pdf · Beyond Kuperberg Flows ... [Harrison, 1988] Replace the circular orbits](https://img.pdfslide.us/doc/110x75/5b1513da7f8b9ab6778d7e9d/beyond-kuperberg-flows-hurdertalksbedlewo20130603pdf-beyond-kuperberg-flows.jpg)