Embed Size (px)
Citation preview

BEYOND SINGER VS. NON-SINGER IN SINGING, HEALTH AND WELL-BEING:
DEVELOPMENT AND TESTING OF THE SINGING EXPERIENCE SCALE
by
Sally L. Busch B.A.Sc. McMaster 2003
B.A. Carleton University 2010
A thesis submitted to the Faculty of Graduate and Postdoctoral Affairs
in partial fulfillment of the requirements for the degree of
Master of Arts
in
Psychology
Carleton University Ottawa, Canada
©2013 Sally Busch

1+1Library and Archives Canada
Published Heritage Branch
Bibliotheque et Archives Canada
Direction du Patrimoine de I'edition
395 Wellington Street Ottawa ON K1A0N4 Canada
395, rue Wellington Ottawa ON K1A 0N4 Canada
Your file Votre reference
ISBN: 978-0-494-94620-6
Our file Notre reference ISBN: 978-0-494-94620-6
NOTICE:
The author has granted a nonexclusive license allowing Library and Archives Canada to reproduce, publish, archive, preserve, conserve, communicate to the public by telecommunication or on the Internet, loan, distrbute and sell theses worldwide, for commercial or noncommercial purposes, in microform, paper, electronic and/or any other formats.
AVIS:
L'auteur a accorde une licence non exclusive permettant a la Bibliotheque et Archives Canada de reproduire, publier, archiver, sauvegarder, conserver, transmettre au public par telecommunication ou par I'lnternet, preter, distribuer et vendre des theses partout dans le monde, a des fins commerciales ou autres, sur support microforme, papier, electronique et/ou autres formats.
The author retains copyright ownership and moral rights in this thesis. Neither the thesis nor substantial extracts from it may be printed or otherwise reproduced without the author's permission.
L'auteur conserve la propriete du droit d'auteur et des droits moraux qui protege cette these. Ni la these ni des extraits substantiels de celle-ci ne doivent etre imprimes ou autrement reproduits sans son autorisation.
In compliance with the Canadian Privacy Act some supporting forms may have been removed from this thesis.
While these forms may be included in the document page count, their removal does not represent any loss of content from the thesis.
Conformement a la loi canadienne sur la protection de la vie privee, quelques formulaires secondaires ont ete enleves de cette these.
Bien que ces formulaires aient inclus dans la pagination, il n'y aura aucun contenu manquant.
Canada

SINGING EXPERIENCE SCALE
Abstract
Research suggests that singing may be beneficial to physical health as well as
psychological and social well-being. However, this area of research is plagued by
methodological shortcomings including limited consideration of variation in singing-
related variables that may influence who benefits from singing and why. In the present
study, a new measure - the Singing Experience Scale (SE) - was developed using
literature review, focus groups, expert feedback (N= 12) and large sample testing (N =
213). Factor analyses revealed a unified, 23-item scale that was highly reliable and
demonstrated significant correlational relationships with health and well-being measures.
However, exploratory analyses suggested that these relationships may: a) be reduced or
negated by controlling for demographic variables, and b) vary depending on group
membership (choir member vs. general population). Although continued testing is
needed, the SE is a new measure with promising characteristics that may facilitate future
research in singing, health, and well-being.
Keywords: singing and health, singing and well-being, singing experience,
scale development, measurement

SINGING EXPERIENCE SCALE
Acknowledgements
I would like to thank everyone who contributed to the completion of this project.
First and foremost, I would like to thank my supervisor, Dr. Mary Gick for her patience
and guidance, and for giving me some of the best life-advice I could ever hope to receive.
I would also like to thank Advancing Interdisciplinary Research in Singing (AIRS; a
SSHRC-funded MCRI) for their support and interest in this project. A heartfelt thanks to
my committee members, Dr. Anne Bowker, Dr. Chris Davis, and Dr. Lisa Mills for their
invaluable feedback. Finally, I would like to thank my husband, Chris, as well as my
family, for their unceasing loving support and encouragement, without which this
endeavor would not have been possible.

SINGING EXPERIENCE SCALE
Table of Contents
Introduction.............................................................................................................................. 1
Singing, Health, and Well-being........................................................................................ 1
Singers, Non-singers, and Singing-Related Variables in the Literature ...................... 14
Summary...........................................................................................................................26
The Present Study................................................................................................................. 28
Preliminary Work.................................................................................................................. 28
Latent Variable and Theoretical Foundation..................................................................28
Item Generation and Potential Subscales........................................................................ 32
Study 1: Expert Feedback..................................................................................................... 36
Method..............................................................................................................................37
Results and Discussion.................................................................................................... 38
Study 2: Testing and Refining the Singing Experience Scale ...........................................54
Hypotheses........................................................................................................................55
Method..............................................................................................................................56
Results and Discussion....................................................................................................62
General Discussion............................................................................................................... 84
Limitations and Future Research.....................................................................................89
Conclusion.............................................................................................................................92
References..............................................................................................................................93
Appendices........................................................................................................................... 103

SINGING EXPERIENCE SCALE
List of Tables
Table 1: Average Relevance and Clarity Scores for Proposed Singing Behavior
Subscale Items........................................................................................................ 42
Table 2: Average Relevance and Clarity Scores for Proposed Skill / Professional /
Performance Subscale Items...................................................................................44
Table 3: Average Relevance and Clarity Scores for Proposed Physical Experience
Subscale Items........................................................................................................ 47
Table 4: Average Relevance and Clarity Scores for Proposed Psychological
Experience Subscale Item s.....................................................................................49
Table 5: Average Relevance and Clarity Scores for Proposed Social Experience
Subscale Items........................................................................................................ 51
Table 6: Descriptive Statistics for Singing Experience Scale - Testing Version
Items........................................................................................................................66
Table 7: Exploratory Factor Analysis Pattern Matrix..........................................................70
Table 8: Singing Experience Items Retained or Discarded for Scale Reliability and
Validation Analyses............................................................................................... 72
Table 9: Frequencies of Demographic Variables for Total Sample and
Known Groups........................................................................................................ 74
Table 10: Descriptive Statistics for Validation Measures Across Total Sample
and Known Groups............................................................................................... 75
Table 11: Pearson Correlations Between Singing Experience Scale and Health and
Well-being Validation Measures......................................................................... 78
Table 12a: Hierarchical Multiple Regression Analyses Predicting Health From

SINGING EXPERIENCE SCALE
Singing Experience and Known Group (SRH, HBC-WB, HBC-AC)..............79
Table 12b: Hierarchical Multiple Regression Analyses Predicting Health From
Singing Experience and Known Group (HBC-TR, HBC-SR)........................ 79
Table 13: Hierarchical Multiple Regression Analyses Predicting Hedonic Well-being
From Singing Experience and Known Group....................................................82
Table 14: Hierarchical Multiple Regression Analyses Predicting Eudaimonic Well-being
From Singing Experience and Known Group.................................................... 84

viiSINGING EXPERIENCE SCALE
List of Figures
Figure 1: Two-way Interaction Between Known Group and Singing Experience for
Positive Affect........................................................................................................81

viiiSINGING EXPERIENCE SCALE
List of Appendices
Appendix A: Focus Group Responses ............................................................................... 103
Appendix B: Potential Subscales and Associated Items for the Singing Experience
Scale............................................................................................................... 107
Appendix C: Study 1 - Expertise Questionnaire............................................................... 109
Appendix D: Study 1 - Description of Theoretical Model Provided for
Expert Feedback........................................................................................... 110
Appendix E: Singing Experience Scale - Testing Version...............................................I l l
Appendix F: Study 2 Measures........................................................................................... 112
Appendix G: Pearson Correlations Between Singing Experience Scale Items............... 118
Appendix H: Principal Components Pattern Matrix (supporting E FA ).......................... 119
Appendix I: Parallel Analysis Output................................................................................. 120
Appendix J: Pearson Correlations Between Validation Measures...................................121

1SINGING EXPERIENCE SCALE
Beyond Singer vs. Non-Singer in Singing, Health and Well-being:
Development and Testing of the Singing Experience Scale
“Research on singing for health is an idea whose time has come” (Gick, 2011,
p.203). At present, although there is some evidence to suggest that singing may be
beneficial for health and well-being, the research is hindered by methodological
challenges and inconsistencies (Clift, Nicol, Raisbeck, Whitmore & Morrison, 2010;
Gick, 2011). These challenges include how singing experience - and what it means to be
a singer - is measured and defined. In the present study, I introduce a new measure of
singing experience that will facilitate methodological improvement in the area of singing,
health, and well-being. First, I provide a brief review of the literature in that area,
followed by a review and critique of how singers, non-singers, and singing experience
have been defined and measured to date in psychological research.
Singing, Health, and Well-being
Recent literature reviews by Gick (2011) and Clift et al. (2010) have determined
that the available research in the area of singing, health and well-being is limited in scope
and methodology. However, despite these limitations, the extant research suggests that
engaging in singing may be beneficial for physical health, as well as for psychological
and social well-being. To date, such research has included studies of the perceived
benefits as well as quantitatively measured effects of singing; a significant proportion of
the research has also examined singing as a therapeutic intervention.
Perceived benefits. Several studies have asked singers about the benefits of
singing. Clift and Hancox (2001) performed two such studies with a university college
choral society. The first of these studies consisted of a brief, open-response format

2SINGING EXPERIENCE SCALE
questionnaire asking about the benefits they perceived from singing with the choir.
Content analyses of the participants’ (n = 74) responses revealed that these singers
perceived a wide variety of benefits from singing with a choir, including: a) physical
benefits such as improved breathing and improved voice; b) emotional benefits such as
improved mood and relaxation; c) social benefits such as making friends; and d) spiritual
benefits such as feeling uplifted. The second study used a structured questionnaire based
on the results from the first study to measure to what degree choristers agreed with
specific statements about possible benefits of singing. Participants’ responses (« = 91)
indicated that high percentages of these singers believed that singing benefits them in a
variety of ways, such as making their mood more positive (93% agreed), helping them to
relax (80% agreed), and increasing lung capacity (83% agreed). However, the results
from this second study must be examined with appropriate perspective. Given that the
structured questionnaire was based on initial suggestions from a similar sample of
individuals (from the same choral society), it is not surprising that participants agreed
with the statements in the questionnaire (Gick, 2011).
In a larger scale study, Clift, Hancox, Morrison, Hess, Kreutz, and Stewart (2007)
asked 633 choral singers in England about the benefits of choral singing. From
participants’ free-form responses, the authors generated a list of potential mechanisms
“by which singing may impact on wellbeing and health: positive affect; focused attention;
deep breathing; social support; cognitive stimulation; and regular commitment” (p.201).
Participants in the study also filled out the short form of the World Health Organization
Quality of Life questionnaire (WHOQoL), which asks about four different aspects of
well-being (physical, psychological, social, and environmental). Results suggested that

3SINGING EXPERIENCE SCALE
choristers generally experienced high quality of life, but even those who scored low on
the WHOQoL endorsed singing as an activity that benefits their well-being.
Finally, in a cross-national survey study focusing on the potential physical
benefits of singing, Clift, Hancox, Morrison, Hess, Kreutz and Stewart (2009) asked 1064
choral singers in Australia, England and Germany the following question: “What effects,
if any, does singing in a choir have on your physical health?” (p. 52). In an open response
format, 76.9 % of respondents indicated that they believed singing to have physical
effects. The vast majority of effects reported were positive, such as improved lung
function and breathing (34.2 % of total sample), increased positive affect and happiness
(18.7% of total sample), relaxation and stress relief (10.8 % of total sample), an
opportunity for exercise (8.6% of total sample), and improved posture (9.5 % of total
sample). However, many (23.1 % of the total sample) did not respond to the question or
indicated no effects of singing on health. Further, the authors acknowledged that the free
form answer format made it difficult to quantify the confidence expressed in the
perception of benefit.
In a similarly qualitative study of choral singing, Faulkner and Davidson (2006)
used interviews to explore the social benefits of singing. The participants, eleven
members of an Icelandic male chorus, described choral singing as a complex social
activity, involving opportunities for good-natured competition as well as collaboration.
Singing in harmony was highlighted as a means of fulfilling the need for “vocal
collaboration and social connectiveness” (Faulkner & Davidson, 2006, p. 231).
Hillman (2002) used a combination of open response questions and Likert ratings
of health and wellbeing to examine the perceived benefits of participatory singing in

4SINGING EXPERIENCE SCALE
retirees. The participants (n=75) were members of a community singing group, and they
were asked to rate their perceptions of their own health and wellbeing before and after
joining the group. Emotional wellbeing and quality of life were found to demonstrate
statistically significant improvements from participants’ ratings, but physical health and
social life were not found to improve significantly. However, in free-form responses
participants reported a variety o f perceived benefits of participatory singing including
benefits for health and social life. Interestingly, Hillman acknowledged limitations in
asking participants for their perceptions of their own health, social life, etc., but failed to
mention recall bias. As some participants reported being involved in the singing program
for as long as 11 years, their retrospective ratings of health and wellbeing at the time of
beginning singing may have been significantly biased (Gick, 2011).
These studies suggest that singers from around the world perceive singing to be
beneficial for physical health, as well as social and psychological well-being. However,
such studies, despite care taken to avoid leading questions (e.g., Clift et al., 2009), may
reinforce the idea that singing has effects and individuals already participating in singing
may be biased towards believing that those effects are positive. Further, as Clift et al.
(2009) noted, perceived benefits may be hard to quantify.
Quantitative evidence. Many studies have taken a quantitative approach to
studying the effects of singing, often attempting to tease out whether the perceived
benefits of singing can be measured more directly. These studies include examinations of
the impact of singing on both psychological and physical well-being.
Busch and Gick (2012) measured the effects of approximately two hours of choral
singing on a series of psychological well-being measures using a before and after

5SINGING EXPERIENCE SCALE
naturalistic design. Busch and Gick found that a single choir rehearsal may significantly
increase positive affect, vitality, and feelings of personal growth among choristers (n =
59). This suggests that choral singing can measurably enhance several aspects of well
being. Also, as Valentine and Evans (2001), found, the well-being benefits of singing
may not be confined to choral singing. Valentine and Evans compared the effects of three
activities - solo singing (n = 10), choral singing (n = 13), and swimming (n= 10) - on
physiological and psychological well-being, also using a naturalistic before and after
design. Choral and solo singing were found to similarly increase hedonic tone and
energetic arousal, as well as decrease tension; however swimming had a greater effect
than singing. These findings may be limited by the fact that participants were not
randomly assigned to their activities (Gick, 2011). Interestingly, though, “main effects
which were significant were shown by every swimmer, but not by every singer”
(Valentine & Evans, 2001, p.l 19). This suggests that differences may exist between
singers that cause them to experience more or less benefit.
This concept of variability in the effects of singing is supported by a study
performed by Grape, Sandgren, Hansson, Ericson, Theorell (2003). Grape et al. explored
possible benefits of (solo) singing on physical and psychological well-being during a
singing lesson, comparing amateur and professional singers. Measures included heart-rate
variability, cortisol levels, mood scales, and a semi-structured interview. Although all
participants reported feeling more energetic and relaxed following a lesson, amateur
singers were more likely to experience improved mood. Further, cortisol levels in
amateurs decreased, whereas cortisol levels increased in professionals. Results of the
heart rate analyses also indicated that professionals were more likely to experience

6SINGING EXPERIENCE SCALE
cardiovascular benefits from singing. Overall, the study suggests differential effects of
singing on well-being for amateur vs. professional singers.
Similarly, singing may be generally believed to improve mood, but research
suggests that the relationship of singing to mood may be complex. Unwin, Kenny, and
Davis (2002) randomly assigned participants (n = 81) to either singing or listening
conditions to explore the effects of singing on mood. Unwin et al. hypothesized that
active singing would have greater effects on mood than listening due to the physical and
breathing components of singing. Although singing did improve mood, it was not found
to differ significantly from the listening condition. Also, as Wendrich, Brauchle, and
Staudinger, R. (2010) found, singing can be used to induce either negative or positive
emotions depending on the material sung. Wendrich et al. randomly assigned choir
members to one of two conditions (positive or negative) and used “songs specifically
inducing positive emotions and songs inducing negative emotions, depending on the
musical style and the language” (p. 146) to change choristers’ moods. This suggests that
although singing in general may be perceived to improve mood, the material sung may
influence this effect.
Mood may also play a role in the impact of singing on physical health. Several
studies have been conducted on the impact of singing on physical health using stress and
immune indicators as outcome measures. Typical of these studies is the use of salivary
measures of cortisol (a measure of stress) and immunoglobulin A (IgA; a measure of
immune function) in association with singing conditions and / or mood measures.
Beck, Cesario, Yousefi and Enamoto (2000) investigated whether choral singing
may enhance immune system function by measuring changes in cortisol and IgA before

7SINGING EXPERIENCE SCALE
and after choral rehearsals and performance. Participants were drawn from a professional
performing group. Beck et al. found that IgA1 increased significantly in all conditions
(rehearsal and performance); cortisol on the other hand decreased after rehearsals and
increased following performance. This suggests that singing may enhance immune
function, but that the impact of singing on stress indicators may depend on the conditions
surrounding the singing.
Kreutz, Bongard, Rohrmann, Hodapp and Grebe (2004) compared active singing
with passive listening effect on salivary IgA, cortisol, and mood with an amateur choir
during rehearsal only. Active singing increased IgA as well as increased positive mood
and decreased negative mood, while listening decreased cortisol and increased negative
mood. However, Kreutz et al. did not examine the relationships between mood, cortisol,
and IgA.
The role of mood in the relationship between singing and physical health was
suggested by Beck, Gottfried, Hall, Cisler, and Bozeman’s (2006) study with solo
singers. They found that singing increased IgA when positive emotions were associated
with singing, whereas singers who approached singing as a professional endeavor and / or
felt stressed during singing tended to experience decreased IgA. Although the sample in
this study was small {n - 10), this suggests that singing may have differential effects
depending on how one approaches or perceives singing.
Singing has also been linked with healthy behaviors. Kenny, Davis, and Oates
(2004) examined anxiety and occupational stress in professional opera singers. They
1 Increase in IgA is considered an improvement in immune function, as IgA is a primary defense against illnesses that might be contracted through respiratory or digestive tracts (Beck et al., 2006).

8SINGING EXPERIENCE SCALE
found that these singers were more likely to engage in healthy behaviors (e.g., good diet,
exercise and avoidance of alcohol) than other occupational groups. Kenny, Davis, and
Oates (2004) suggested that this was likely due to the desire of singers to maintain the
health of their voices.
These studies suggest that singing may be associated with increased
psychological and physical well-being in a quantifiable way, but that the effects may
depend on the conditions of the singing experience (rehearsal vs. performance; material
sung) or factors related to the singer themselves (mood; professional status). However, it
must be noted that many such studies (all of those mentioned here except for Unwin et
al., 2002), were performed with individuals who had self-selected for singing. Thus, it is
unclear whether singing would have similar effects for individuals not pre-disposed
towards singing.
Interventions and therapeutic research. The therapeutic value of singing has
been explored for a wide variety of ailments, including irritable bowel syndrome, chronic
pain, breathing-related disorders, and dementia. Singing interventions have also been
done with marginalized populations including homeless and imprisoned individuals.
In a self-described small-scale study, Grape and Theorell (2009) randomly
assigned Irritable Bowel Syndrome (IBS) patients to either choir singing or group
sessions (in which patients could talk about their IBS). After one year, many participants
had withdrawn from the study, but even with the small remaining sample size (choir n =
11; group n =14), the authors found trends in the data suggesting that choral singing
might be beneficial for IBS and possibly for other stress-related disorders.

9SINGING EXPERIENCE SCALE
Kenny and Faunce (2004) assigned chronic pain patients ( n - 77) to either group
participatory singing or listening to singing while exercising. These interventions were
added to the pain management program that all patients were undergoing. Kenny and
Faunce wished to compare these two groups on the outcome variables of mood, perceived
pain, and coping. Ultimately, because a number of participants failed to show up for
singing, the analyses included comparison of the singing group to the standard pain
management program all patients were undergoing (as represented by those who failed to
show up for singing, but completed measures). Although no statistically significant
differences were found for the singing vs. exercising group, participants in the singing
group “tended to show a greater increase in active coping following the intervention”
(p.250) than those who failed to attend the singing group. However, as Kenny and Faunce
noted, the effect size of this difference was small.
Breathing-related studies with singing have included interventions for chronic
obstructive pulmonary disorder, a degenerative disease involving progressive difficulties
with breathing (Engen, 2005). One study with senior citizens (n — 7) suffering from
emphysema (a type of COPD) consisted of six weeks of group singing sessions, which
also included singing-appropriate posture and breathing instruction (Engen, 2005).
Following the intervention, six of seven subjects had shifted their style of breathing to
one that is more diaphragmatic (deeper breathing) and demonstrated increased breath
support and control. Bonilha, Onofre, Vieira, Prado, and Martinez (2009) also examined
group singing as an intervention for COPD. Individuals diagnosed with COPD were
assigned to either a singing condition (n = 15) or a control group (« = 15) consisting of
handicraft class. The results suggested that singing was well-tolerated by COPD patients

10SINGING EXPERIENCE SCALE
and that singing may improve, or help decrease the decline of, lung capacity in this
population by increasing maximal expiratory pressure. Although quality of life (QoL)
improved similarly for both groups, Bonilha et al. commented that “if the control group
had not performed any activity, the positive effects of singing on QoL would have been
demonstrated more clearly” (p.7). However, it should be noted that in this comment
Bonilha et al. assume that QoL would have remained constant without intervention, and
this may not be an accurate assumption.
Several studies have also examined the potential therapeutic value of singing for
patients suffering from dementia such as Alzheimer’s disease. Bannan and Montgomery-
Smith (2008) performed a pilot study investigating the feasibility and impacts of group
singing with Alzheimer’s patients. Results gleaned from video and audio recordings as
well as questionnaires filled out by caregivers (in conjunction with patients where
possible) suggested that not only could individuals with Alzheimer’s disease participate
in singing, but they could also learn new songs. Participants also appeared to benefit from
the experience, reporting enjoyment and increased vitality.
The learning of new material through singing is supported by a more recent case
study of singing with a patient who suffered from mild Alzheimer’s. Moussard, Bigand,
Belleville, and Peretz (2012) found that new phrases showed better recall over time if
they were presented as sung to a familiar melody (rather than spoken or sung to an
unfamiliar melody). Moussard et al. also suggested that the singing may be an especially
useful tool for dementia care due to its recreational characteristics.
Olderog Millard and Smith (1989) used behavior mapping to study the effect of
singing on Alzheimer’s patients in a nursing home. In a small sample study where

11SINGING EXPERIENCE SCALE
patients were their own controls, behavior during and after 30 minute singing sessions
was compared to behavior during and after 30 minute discussion groups. Participants
exhibited greater (more frequent) physical and social behaviors from singing sessions
than from discussion sessions. Further, participants were more likely to engage vocally in
the singing sessions than in the discussion sessions.
Singing may also have therapeutic value with other groups, such as prison
populations or homeless individuals. Silber (2005) established and conducted a choir in a
women’s prison in Israel. Silber acted as an observer, videotaped sessions, and conducted
interviews with choir participants in order to measure their reaction to involvement in the
choir. The results suggested that choirs could be used as a therapeutic intervention with
this population, as it offered opportunities for raising self-esteem and social interaction
within the alternative (to criminal context of prison) community o f choir (Silber, 2005).
Similarly, Cohen (2009) conducted two studies with prison choirs comparing the well
being of inmates participating in a prison choir to inmates not participating in choir.
Measures included the Friedman Well-being Scale as well as choir participants’ written
responses to choir experience. Although the overall well-being scale showed no
significant differences between the choir participants and the control group, certain
subscales (sociability, joviality, emotional stability, happiness) did demonstrate an
increase in choir members after a performance. The quantitative data measuring well
being was supported by qualitative analyses of the choristers’ written reports, suggesting
that “choral singing may enhance inmate singers’ well-being” (Cohen, 2009, p.60).
Marginalized populations such as the homeless may also benefit from the
therapeutic value of singing, as evidenced by a series of studies by Bailey and Davidson

12SINGING EXPERIENCE SCALE
(2002,2003, 2005). The first of these studies was done with members of The Homeless
Choir in Montreal, using semi-structured interviews to measure participants’ reactions to
choral involvement. Seven out of 17 members of the choir (all male as membership in the
choir is limited to males) participated in the study. Analysis of participants’ responses
during these interviews indicated that participants found singing with the choir
therapeutic for a variety of emotional and physical challenges, as well as a source of
meaningful social interaction (Bailey & Davidson, 2002, 2003).
Bailey and Davidson (2005) then further explored their findings by comparing a
choir for homeless individuals to a middle-class choir. Semi-structured interviews were
used to gather input on the effects of group singing from the members of the homeless
choir, while a focus group format was used to gather data from the middle-class choir
members. Bailey and Davidson noted that this study also served as a way to compare the
effects of group singing on individuals with low musical experience (as in the homeless
choir) to higher musical experience (in the middle-class choir). Their results indicated
that the perception of benefit from singing may be independent o f singing experience and
socioeconomic status, as both groups perceived significant benefits from singing, but that
the types and intensity of benefits experienced may be different. For example, for the
homeless choir participants, singing with the choir offered emotional balance and an
experience of group membership not often afforded marginalized individuals. For
members of the middle-class choir, however, the focus seemed to be more on improving
singing. According Bailey and Davidson (2005) middle-class singers were more likely to
be constrained by “prevalent social expectations of musicianship” (p.269) and this may
interfere with their experience of benefit from group singing.

13SINGING EXPERIENCE SCALE
These studies suggest that singing sessions may provide positive stimulation for
individuals suffering from dementia, breathing exercise for COPD patients, stress-
reduction for IBS patients, as well as have therapeutic value among prison inmates and
homeless populations. However, the sample sizes in these studies are often small and the
effects drawn from participants’ qualitative reports of benefit. Further, as Bailey and
Davidson’s (2005) study suggests, the nature of the therapeutic value of singing may
depend on individual factors such as SES, singing experience, or expectations.
Overall, the research in singing, health, and well-being is suggestive, but far from
conclusive. As the research reviewed here indicates, singing may offer a variety of
benefits to psychological and physical health such as increased psychological well-being
(Busch & Gick, 2012; Hillman, 2002), improved immune function (Beck et al., 2000;
Kreutz et al., 2004), as well as therapeutic value for dementia patients (Lesta & Petocz,
2006; Olderog Milard & Smith, 1989) and marginalized populations (Bailey & Davidson,
2002; Cohen, 2009). However, as both Gick (2011) and Clift et al (2010) observed in
their recent reviews, this area of research is in a developmental stage and at present
suffers from a variety of methodological weaknesses. These weaknesses include
generally small sample sizes and naturalistic designs that frequently suffer from a self
selection bias as the participants have self-selected to sing (Gick, 2011). Further, as Clift
et al. (2010) noted “(Research to date has been highly variable with respect to scope,
design, methods, samples...(s)uch variations make it difficult to draw any general
conclusions” (p.9).
Thus, at present, it is unclear whether the benefits of singing reported by singers
would extend to individuals who did not self-select to sing. Further, as suggested by the
14SINGING EXPERIENCE SCALE
research (e.g., Bailey & Davidson, 2005; Beck et al., 2006; Grape et al., 2003; Valentine
& Evans, 2001), differences may exist between singers that influence health and well
being outcomes related to singing. From such evidence Gick (2011) recommended that
variables that should be considered in future research include person variables such as
musical background and amateur vs. professional status. The next section of the literature
review demonstrates how existing psychological research on singing has measured
singing-relevant characteristics and behaviors, often using them to differentiate between
singers and non-singers.
Singers, Non-singers, and Singing-Related Variables in the Literature
In order to determine who benefits from singing and how, researchers have often
compared populations of so-called singers and non-singers. Information about singing
experience is used to categorize participants as either a singer or non-singer. However, as
research in singing, health, and well-being moves forward, the reliability and validity of
such dichotomous classification must be evaluated in light of potentially significant
singing-related variation within each of these populations.
Singer vs. non-singer. At present, much of the psychological research in singing
currently labels participants simply as either singers or non-singers. Researchers use a
variety of characteristics including choral membership, vocal training, professional status,
and self-perceived singer status to define the categorical grouping of participants as either
singers or non-singers.
In a study published in 2008, Pai, Lo, Wolf, and Kajieker compared singers and
non-singers to determine whether singing was related to snoring and daytime
somnolence. The singer sample was recruited from two local adult choirs while the non-
15SINGING EXPERIENCE SCALE
singer sample were individuals obtained from the general population who “do not sing”
(p.265). This non-specific turn of phrase used by Pai et al. (2008) to characterize the non
singer group left many questions unanswered. How did the researchers determine that
these individuals do not sing? Do they mean never - not even in the shower? There was
also little specific information provided about the singer participants. Although at one
point the singers are referred to as “semi-professional choir singers” (p.265), it is not
clear what merited the term semi-professional. Was this the choirs’ status, or that of the
individual recruited singers? However, this study does suggest that one of the simplest
means of distinguishing between singer and non-singer populations is by self-reported
choir membership.
Similarly, Prakup (2012) investigated the impact of singing on the voices of older
participants, using choir membership as the main criterion for distinguishing between
singer and non-singer groups. Prakup used acoustic measures of the voice as well as
listener judgement of age as the outcome variables of interest. All singer participants in
the study reported having been a member of a choir for at least 10 consecutive years,
though it was unclear whether this was a requirement for being included in the singer
group. Non-singers, on the other hand, were required to have refrained from participating
“in any formal vocal training, including singing instruction.. .or.. .choir since high
school” (p.343). Thus, intentionally or not, Prakup’s study suggests a potential wide
divide between those who might be clearly considered singers (long-term choir members)
and those who might clearly be considered non-singers (those with no training or choir as
adults).
As suggested by Prakup’s (2012) mention of training in the definition of non-

16SINGING EXPERIENCE SCALE
singer, the study of voice can also be another fairly straightforward means of determining
singer status. In 1996, Sapir et al. compared and contrasted singers with non-singers on
several factors including mood, attitudes towards singing, and vocal health. Sapir et al.
drew their sample from the university student population, defining singers as voice
students and non-singers as those “who were not trained to be singers and who had not
been involved in professional or classical singing” (p. 194). Sapir et al. (1996) also noted
that 6% of the original sample had to be excluded from analyses for various reasons,
including that some of the participants could not be clearly classified as singers. Although
singers and non-singers were not found to differ significantly on mood, singers were
more likely to report vocal health issues and to rate singing as highly important in their
life.
Similarly, in another study concerned with the health of singers, Petty (2012) used
vocal training as part of the criteria used to distinguish between singers and non-singers.
Petty sought to examine the health information-seeking behaviors (e.g., how and where
individuals seek information about health-related issues) of singers as compared to non
singers. Singer status was defined by two criteria: a) self-identification, and b) singing
training; thus, those in the control group had to self-identify as non-singers as well as
have “no history of formal singing study” (p.331). Singers were required to self-identify
as such, but they also had to have undergone at least 1 year of classically based singing
instruction (it was unclear why the singing instruction was restricted to classical).
Interestingly, however, Petty at one point referred to “the untrained or nonsinging
population” (p.331), suggesting a potential awareness that vocal training and singer status
may not be equivalent population-defining factors.

17SINGING EXPERIENCE SCALE
Although several of the aforementioned studies used combinations of singing-
related variables to define singer and non-singer categories, arguably the most restrictive
definition of singer was fashioned by Phyland, Oates, and Greenwood for their study
published in 1999. This study compared vocal behaviors and vocal health across singers
and non-singers. However, in order to first be deemed a singer for the purposes of
Phyland et al.’s (1999) study, the participants had to satisfy rigorous qualifications; these
included self-identifying as a professional singer, as well as having over the past year: a)
received income from singing, and b) have sung more than 2 hours per month on average.
According to Phyland et al., these qualifications allowed the study “to focus on those
singers who... rely on their singing voice for an income and on those who sing regularly”
(p.604). The authors also acknowledged that they were purposely excluding some types
of singers, thus demonstrating their acknowledgement of the variable definition of the
term singer. Interestingly, Phyland et al. were much less selective in their definition of
non-singers. They depended upon the singer participants to approach a non-singer friend,
appearing to trust the singer participants to define the terms of non-singer. Although non
singer participants were screened and excluded from analyses if they reported that they
had sung in public during the last year, it is unclear whether these non-singers might still
have sung frequently in private, or whether they might have self-classified as a singer.
These studies demonstrate a wide variety of means used differentiate between
singers and non-singers. However, the validity and reliability o f some of these
determining factors may be suspect. As Mizener (1993) noted, being in a choir may
measure group membership more than singer status, as many non-choristers can enjoy
singing and be quite skilled at it; thus, the validity of choir membership as a means of

18SINGING EXPERIENCE SCALE
differentiating singers from non-singers is uncertain. Also, dichotomizing individuals into
either singers or non-singers may not properly represent the nature of singer status. For a
truly dichotomous categorical variable, participants should be relatively easy to divide
into two distinct groups (e.g., as with sex - male or female; Field, 2009); however, as
Sapir et al. (1996) and Phyland et al. (1999) both noted, their definitions of singer status
meant excluding participants completely from either singer or non-singer groups.
Similarly, Prakup’s (2012) study suggested a significant gray area between those
who can clearly be established as singers and those who can clearly be established as
non-singers. In these studies, individuals who possessed some vocal training but were not
university voice students (Sapir et al., 1996), professional singers who performed only
rarely (Phyland et al., 1999) and individuals with some singing training but no history of
choir membership (Prakup, 2012) were (or might have been) excluded. Further, the
variation in definition of the singer and non-singer division even amongst these few
studies makes generalizations across studies problematic. For example, can the results of
Phyland et al.’s (1999) study of professional singers be said to apply to Pai et al.’s (2008)
sample of choral singers (recall, Pai et al. defined singers by choir membership)?
Professional singers and choral singers may represent quite different groups, especially in
terms of singing-related behaviors; for example, professional singers may rehearse much
more often or take much better care of their vocal health than choral singers because their
livelihood depends on their vocal abilities. Thus, the dichotomization of participants into
either singer or non-singer categories demonstrates significant weaknesses.
Singer variation. Just as the aforementioned studies demonstrated, studies
looking to contrast singers and non-singers often target choirs or voice students as a

19SINGING EXPERIENCE SCALE
source for singer participants; this trend continues in research focusing on the singer
population. These singer samples are often categorized (e.g., solo vs. choir, amateur vs.
professional) or asked about their singing experience (e.g., duration of choir membership,
extent of training) to help describe the characteristics of the sample, depending on the
purpose and design of the study.
Categorization o f singers. Researchers have to date categorized singers using
several different criteria. In a previously mentioned study by Phyland, et al. (1999),
singer participants were parsed according to the genre of music they performed (i.e.,
opera, musical theatre, and non-rock contemporary such as jazz or blues). This was done
because the authors wished to compare vocal health issues between these groups (using
non-singers as a control group). Genre of music performed was thought to be a key
variable influencing vocal behaviors, in particular demands placed on the voice, that
would in turn influence vocal health. Although Phyland et al.’s results countered this
hypothesis (vocal health did not appear to depend on genre of music sung), the three
singer groups were found to differ significantly on the number o f hours they performed
each month.
In the aforementioned study published in 2001, Valentine and Evans compared
the effects of solo singing, choral singing, and swimming on physiological and
psychological well-being. Consistent with the previously discussed research (e.g., Pai et
al., 2008; Sapir et al., 1996), this study drew its singer participants from vocal students
and choir members. The distinction between solo singer and choral singer was made
because Valentine and Evans wished to determine whether the social aspect of singing
might confer differential effects on well-being.

20SINGING EXPERIENCE SCALE
Recall also Grape et al.’s (2003) study comparing the effects of a singing lesson
on amateur vs. professional singers. Consistent with the studies o f Sapir et al. (1996) and
Petty (2012), the singer participants in Grape et al.’s (2003) study were the students of
classical singing teachers. In order to distinguish between amateur and professional
singers, “professional singers were operationally defined as those who earned at least
25% of their total salary from singing” (Grape et al., 2003, p.66) whereas amateur singers
were required to be studying singing for leisure and receive no income from singing.
Interestingly, although these definitions provide clear guidelines for each category of
singer, they leave a noticeable gap between professional and amateur singers; individuals
who were studying singing in order to become a professional singer and / or those who
occasionally earn money from singing (< 25% of their total income) would theoretically
be excluded from the study. The authors do not mention having to exclude any
participants, though it is worth noting that the original pool of individuals approached for
participation in this study was very small (21 individuals) and five of those individuals
refused to participate (Gick, 2011). However, despite their small sample (n = 16), Grape
et al. found statistically significant differences between amateur and professional singers
with respect to cortisol levels before and after a singing lesson (professional singers’
cortisol rose whereas amateurs’ cortisol dropped). The two groups also reported very
different motivations and emotions in connection with attending a singing lesson.
Another study that compared amateur and professional singers was published by
Bemassi-Werke, Queiroz, Araujo, Bueno and Oliveira in 2012. The purpose of this study
was to examine musicians’ ability to recall pseudowords, tone series, and digital spans
and to consider the influence of musical expertise on this recall. The participants were

21SINGING EXPERIENCE SCALE
divided into three groups according to their musical expertise: a) amateur singers sampled
from amateur choirs; b) professional singers sampled from professional choirs; and c)
musicians with absolute pitch (those who can identify any tone upon hearing it without
requiring a reference point) including both singers and other musicians. Bemassi-Werke
et al. theorized that differences might exist between these groups in the area of tone recall
because professional singers’ greater training might afford them the use of mnemonic
strategies unavailable to amateur singers; similarly, those with absolute pitch might be
able to use the verbal labels of tones to help them remember tone sequences. Results of
the study were mixed, but did support the idea that vocal training influences tone recall.
These studies suggest that singing experience may exhibit meaningful variation
beyond a simple singer vs. non-singer dichotomy. That is, the singer population may be
further parsed according to the type of singing performed (e.g., by genre of music; solo or
choral) and their professional status and that these variables may influence meaningful
outcomes such as memory and levels of the stress hormone cortisol. Categorical divisions
within the singer category itself may exhibit similar weaknesses to the singer vs. non
singer dichotomy; divisions between groups may not be clear (e.g., a singer who does
both choral and solo singing) and the groups insufficiently inclusive (e.g., someone who
occasionally earns income from singing).
Individualized variation. Variation amongst singers is also denoted in some
studies on a more individualized basis. In these cases, rather than assigning singer
participants to a category of singers, researchers measure individual variation on singing-
related variables. One such study was the previously discussed study by Pai et al. (2008),
which examined relationships between singing, snoring, and daytime somnolence. Using

22SINGING EXPERIENCE SCALE
general linear modeling, the authors determined that the singer participants’ number of
years of singing (an individual difference variable) was not predictive of daytime
somnolence. Despite Pai et al.’s finding that singers were less likely to snore, the
relationship between number of years singing and snoring was not examined.
Other previously discussed studies that included singing-related individual
difference variables in their analyses are Beck et al. (2000) as well as Busch and Gick
(2012). Beck et al. (2000) analyzed the singer variation variable o f choral experience and
its relationship to the immune system (as measured by changes in cortisol and salivary
immunoglobulin A). Participants were drawn from a professional choir, but as Beck et al.
(2000) reported, individual choral experience varied widely, ranging from 10-55 years.
Busch and Gick (2012) on the other hand considered whether time spent singing per
week (which varied from 2.5 to 17 hours in the sample) was predictive of change in well
being for choral singers. However, neither Beck et al.’s (2000) or Busch and Gick’s
(2012) analyses with these singer difference variables achieved statistically significant
results. This suggests that individual differences on singing-related variables may be
considered relevant, but they have yet to demonstrate significant relationships in
statistical analyses.
Variation in singing experience amongst participants is also often reported in
studies, but not used in analyses. Busch and Gick (2012) reported several singing-related
characteristics of their choral singer participants that were not used in analyses, including:
a) duration of choir membership (4 months - 43 years); b) membership in other
(additional) choirs; and c) history of solo voice training. Other studies that reported
variation amongst their singer participants but didn’t use it in their analyses include Beck,

23SINGING EXPERIENCE SCALE
Gottfried, Hall, Cisler, & Bozeman (2006) and Broomhead, Skidmore, Eggett & Mills
(2012). Beck et al.’s (2006) study was similar to Beck et al.’s (2000) study concerning
singing and immune system change but the participants were solo (instead of choral)
singers. Although Beck et al. (2006) reported the average number o f years participants
had been singing, they did not utilize this variable in the analyses. Similarly, in
Broomhead et al.’s (2012) study of the effect of a pre-performance intervention designed
to induce a positive mindset on singing performance characteristics (e.g., expressiveness,
timing, tone, etc.), the researchers noted the varied experience of their chorister
participants (including choral membership duration and vocal training) but didn’t use it in
their analyses. The reporting of these variations amongst singer participants indicate that
the researchers considered it worthwhile to gather at least some information about the
singing experience of the participants, even though they did not include these variables in
their analyses.
Thus, it is clear from the research that not all singers are the same. Singers exhibit
variation on singing-related variables that may be relevant to associations between
singing and health and well-being outcomes. This variation may be represented through
the categorical grouping of participants or considered as individual variation. The
individual variation variables as demonstrated allow for greater variation in responses
(e.g., number of years as opposed to group A or B) and do not exclude participants; thus,
this representation of individual singer variation appears to more accurately capture
singer characteristics and present fewer weaknesses than categorical representations of
singer variation. However, these measures are by no means perfect. It is possible that
analyses using these minimalist measures of singer variation (e.g., choir experience, time
24SINGING EXPERIENCE SCALE
spent singing) have thus far failed to demonstrate statistically significant relationships to
health and well-being outcomes because these variables don’t capture enough meaningful
variation.
Non-singer variation. Within the literature surrounding research in singing,
variation within the singer population on singing-related variables is clearly visible. But
even so-called non-singers may exhibit variation on singing-related variables. Chong
(2010) sought to examine the attitudes of non-singers towards singing. For the purposes
of the study, singers were defined as those with formal singing training and so voice-
majors were excluded from the university student sample of non-singers. Chong’s results
indicated that a large proportion (88.3% of the sample) of non-singers enjoy singing and
do it for a variety of reasons including self-expression, stress reduction, and spirituality.
Thus, clearly, even non-singers may engage in singing behavior and can vary in their
reasons for enjoying singing. It is also worthwhile to note, however, a significant
weakness in the definition of non-singers as anyone not majoring in voice at university.
Someone like myself, for example, who took eight years of voice lessons and sang in
several choirs before deciding not to major in voice at university would have been in the
same category as individuals who had never sung in a choir or taken any voice lessons.
Thus, clearly, significant singing-related variation is possible among non-singers when
such a simplistic categorical approach is used to define populations.
Beyond singer vs. non-singer. Some few singing studies avoid targeting singer
and non-singer populations entirely and instead use alternate methods (e.g., pitch-
matching exercises) to distinguish between types of singers. This approach suggests that
everyone might be considered a singer at least to some degree. The earliest example of

25SINGING EXPERIENCE SCALE
such a study is demonstrated by Mitchell’s (1991) brief research note describing his
efforts at teaching non-singers, whom he defined as poor pitch singers, to sing. Then, in
2003, Richards and Durrant published a study in which they used observation and
interviews, as well as some quantitative questionnaires, to examine the experience of
non-singers learning to sing. Participants in this study were classified as non-singers
based solely upon their self-identification as non-singers, although the authors also
mention that the term non-singer in the context of this study refers to “reluctant,
unconfident, or less experienced singers” (Richards & Durrant, 2003, p.78). It is
interesting to note the contradiction in this definition, as individuals are referred to both
as singers and non-singers; however, this seeming contradiction in terms is consistent
with the authors’ assertions in the introduction of the article. There, Richards and Durrant
(2003) argue that the Western perception of singing as a binary ability - “something that
you either can or can’t do” (p.78) - is a meaningless concept, particularly in the context
of teaching singing. Instead, Richards and Durrant appear to subscribe to a non-Westem
perspective in which “everyone is considered to be a singer” (p.80).
Other studies refer to singing more in terms of a skill that everyone possesses to
varying degrees. These studies did not target known singer populations, but rather
categorized participants as various types of singers using pitch-matching as a key
criterion. In an fMRI-based study examining neural correlates o f singing vs. language,
Wilson, Abbott, Lusher, Gentle, and Jackson (2010) grouped participants according to
pitch accuracy as expert and non-expert singers. Interestingly, Wilson et al. also gathered
information about the singing experience of participants, including training, choir
membership, singing performance and practice, though this information did not appear to

26SINGING EXPERIENCE SCALE
be used in the classification of singers as expert or non-expert. In 2012, Leveque,
Giovanni, and Schon performed a study investigating pitch-matching abilities among
differently-skilled singers. Participants were classified as either poor singers or controls
(fine singers) according to a combination of social evaluation (i.e. they had a history of
being told they weren’t good singers) and an assessment of pitch accuracy by a jury of
listeners.
These studies indicate that the distinction between singers and non-singers may be
a fluid concept; even non-singers can become singers and everyone can sing to some
degree. Thus, as previously suggested, the simplistic dichotomous categorization of
participants as either singer or non-singer would seem to be invalid and unreliable.
Summary
The research suggests that singing may be beneficial for several different aspects
of physical health, as well as for psychological and social well-being (Clift et al., 2010;
Gick, 2011). However, given that much of the research has been done with small sample
sizes and / or so-called singer samples (e.g., individual who have self-selected to sing), it
is difficult to determine how generalizable these health and well-being benefits may be
(Gick, 2011). Further, the characteristics used to define singer vs. non-singer samples
fluctuate from study to study depending on the perspective, goals, or resources of the
researcher. This makes comparison of health and well-being outcomes across studies
difficult, as the population of interest is continually re-defined. Participants who do not
clearly fit into a researcher’s definition of singer (or non-singer) are often excluded from
studies, and so potential data are lost. The artificial dichotomization of participants into
either singer or non-singer categories, when in truth the differences between these groups

27SINGING EXPERIENCE SCALE
might be better described along a continuum, may be causing a loss of information and
reduced statistical power for analyses (Streiner, 2002; Tabachnick & Fidell, 2007).
As demonstrated in the literature review, great variation exists within these
studies between individual participants in terms of singing-related factors such as singing
behavior, degrees of vocal training, and attitudes towards singing. Further, this variation
may be related to differential health and well-being outcomes, as suggested by Grape et
al.’s (2003) finding that amateur and professional singers demonstrate differential cortisol
reactions to a singing lesson and Bemassi-Werke et al.’s (2012) finding that singing
training influences memory. But even when such variation is measured in studies, the
questions asked are inconsistent and the variation is often left out of analyses. A single
measure that quantifies singing experience by assessing all relevant variables (e.g., choir
membership, vocal training, singing behaviors) along a continuous scale, or using several
subscales to capture different aspects of singing experience, may present a more accurate
representation of the variation amongst singers and non-singers. This sort of measure
would facilitate closer examinations of who may experience health and well-being
benefits from singing, as well as provide insight into how and why singing may produce
such benefits.
The Present Study
The objective of the present study was to develop a reliable, valid, and continuous
measure of singing experience in order to describe and capture, in a meaningful and
statistically useful way, variation that may be tied to health and well-being. My approach
to scale development was integrative and designed to maximize the reliability and
validity of my proposed scale (within the limits of a Master’s thesis project). Though

28SINGING EXPERIENCE SCALE
based primarily on the classical approach to scale development as presented in Clark and
Watson (1995), my method incorporated a few additional steps in order to enhance scale
validity. These additions include the use of focus groups and obtaining expert feedback
on items before testing the items with a large sample (as recommended by DeVellis,
2003; Gehlbach & Brinkworth, 2011; Simms, 2008; Worthington & Whittaker, 2006). In
the following, I describe the preliminary work as well as two studies that went into
developing the Singing Experience Scale (SE).
Preliminary Work
During this phase of scale development I used a combination of literature review
and focus group feedback to develop a theoretical model for the Singing Experience
Scale (SE) and generate potential scale items.
Latent Variable and Theoretical Foundation
The first step in scale development according to the classical method is defining
the latent variable that is to be measured in order to define the scope of the scale (Clark &
Watson, 1995; DeVellis, 2003). Clark and Watson (1995) similarly advocated the need
for a strong theoretical foundation during the initial development of a measure in order to
ensure that “the resulting scale will make a substantial contribution to the psychological
literature” (p.310). Thus, I incorporated several approaches into establishing the
foundation and defining the scope of the Singing Experience Scale. The approaches I
employed were: a) an extensive consideration of the available literature; b) focus groups;
and, c) integration of the literature and focus group information into a cohesive
theoretical model.

29SINGING EXPERIENCE SCALE
Literature review. A review of the literature is advocated in the classical method
of scale construction; it is valued both as a means to gather data about existing definitions
of the latent variable, as well as a means of placing one’s definition in context and
ensuring its future relevance (Clark & Watson, 1995; DeVellis, 2003). As identified in
literature review presented in the introduction, singers may be distinguished from non
singers by many factors including:
• choir membership
• vocal training
• skill
• professional singer status
• perceived singer status
Singers have also been described using the following variables:
• what type of singing they do (e.g., solo or choral);
• how much experience they have (e.g., duration of choral membership);
• how much singing they actually do (e.g., amount of time spent singing per week).
Some of these variables have already been shown to be related to health and well-being
outcomes (e.g., professional status; Grape et al., 2003) and others have been hypothesized
to (e.g., choir membership may influence social well-being outcomes associated with
singing; Busch & Gick, 2012). Each of these variables describes an aspect of singing
experience and was considered for potential inclusion in the Singing Experience Scale.
Focus groups. The decision to use focus groups was based upon the work of
Gehlbach and Brink worth (2011), who advocate focus groups as a means of gathering
perspective on the latent variable from the target population in order to enhance the

30SINGING EXPERIENCE SCALE
content validity of the scale. I used Facebook to pose the following question to my adult
friends and acquaintances:
Imagine that you have a friend who you would feel comfortable calling “a singer”. How would you describe this person? What might distinguish this person from someone you would not call a singer?
I received 79 responses from a variety of individuals; many wrote lengthy responses to
the question, while others chose to simply endorse the response o f a previous respondent
(as in a true focus group, respondents could see each other’s responses). I also posed the
question to my supervisor’s lab group, gaining an additional eight responses. Further, I
used the lab meeting as an opportunity for a more formal focus group in which to discuss
the responses and discern their potential meanings. This helped me avoid the potential for
a singular interpretation (bias) in my reading of the responses and helped me to distill
what aspects of the focus group feedback might be most helpful and relevant to my scale
design project. Responses from the focus groups were varied (see Appendix A for a
compendium of all responses), but key themes included:
• singing behavior
• skill
• training
• professional status
• performance (e.g. singing for an audience)
• innate musicality
• enjoyment of singing
• commitment / dedication to singing

31SINGING EXPERIENCE SCALE
As demonstrated by the responses from the informal focus groups, describing a
singer requires considerations of multiple aspects of the human experience (e.g., behavior
as well as thought). In particular, the concepts of innate musicality, enjoyment, and
commitment emphasized psychological aspects that the target population associated with
describing someone as a singer. Further, these expressed associations echoed some of the
benefits individuals have reported from singing such as improved mood and self-
expression (e.g., Clift et al., 2001; Chong, 2010).
Integration. Thus, I determined that the new measure would describe singing-
related experience along several continuous axes (i.e., potentially using several different
subscales) in order to facilitate the description of samples without dichotomous
classification of participants as either singer or non-singer. In accordance with the
conception of singing as a complex biological, psychological, and social activity, as put
forth by Gick (2011), I decided to include physical and social experiences of singing in
addition to those psychological experiences of singing suggested as important by the
literature and focus groups. As the biopsychosocial model developed by Engel (1977)
suggests, health and well-being are the result of interactions between biological,
psychological and social mechanisms. Further, in addition to suggesting that person
variables such as musical background should be examined more closely (as mentioned in
the introduction), Gick (2011) recommended that biological, psychological and social
mechanisms receive greater attention in future research.
As a result, the latent variable for my measure became singing experience that
may influence health or well-being outcomes. Thus, the scope o f the measure included
both behavioral aspects of singing (e.g., those often heretofore used to describe

32SINGING EXPERIENCE SCALE
differences between singers and non-singers) as well as the nature of the experience while
singing (physiological, psychological, and social aspects). With this theoretical basis in
mind, I was then able to begin the process of generating items for my questionnaire
measuring singing experience.
Item Generation and Potential Subscales
At the item generation stage of scale development Clark and Watson (1995), as
well as DeVellis (2003) and Simms (2008), recommend being initially over-inclusive and
as comprehensive as possible in trying to generate items that will capture all possible
aspects of the latent variable. Items should be written so as to ensure variation in the
responses (Clark & Watson, 1995). Further, items should be developed that “reflect all
different manifestations and levels of the underlying trait for which reliable measurement
is desired” (Simms, 2008, p.419). This implies the need for a consideration of the target
population for the measure as well as the potential range of expression of the latent
variable that might be measureable in that population. It is important to be able to
distinguish between all levels of the latent variable - not just high vs. low - in order to
achieve an appropriately continuous scale. Brinkworth and Gehlbach (2011), Clark and
Watson (1995), DeVellis (2003), Rust and Golombok (2009), and Simms (2008)
emphasize several principles of item writing including:
• the importance of clear wording geared toward the understanding of the target
audience;
• avoidance of potentially ambiguous items that may measure something other than
the desired latent variable (e.g., items that make assumptions or use language that
may influence the response);

33SINGING EXPERIENCE SCALE
• choosing a response format that is consistent with item wording and satisfies
statistical goals for the scale;
• considering useful characteristics of items (e.g., using negatively worded items to
check whether the participant is paying attention to his / her responses; using
redundant items to enhance the internal reliability of a scale).
Based on these recommendations, I decided to use both negatively worded items and
redundant items in my scale. I also decided to use a Likert response scale for the items
ranging from 1 to 5 to indicate the frequency of the experience (1 = never to 5 = always).
A Likert scale was chosen because it is a format widely used in psychological research
that does a good job of representing a continuum of response options (DeVellis, 2003).
The five-point response option was chosen because it is also commonly used, and
demonstrates equivalent or better response characteristics than the also commonly used
four-point or seven-point response options (Wakita, Ueshima, & Noguchi, 2012).
The different aspects of singing experience I wished to measure resolved
themselves into a potential for five distinct subscales with proposed items (see Appendix
B; note that subscales with items are also listed in Tables 1-5 in Study 1). The first
subscale focused on singing behavior; in particular, how often someone may sing.
Frequency of singing has only rarely been considered in the literature (e.g., Busch &
Gick, 2011; Phyland et al., 1999). However, these items may be especially useful for
describing singing-related behavior of individuals who at present might be classified as
non-singers (i.e., because they do not take voice lessons or sing professionally). Further,
in the context of singing, health, and well-being research, if singing has the potential to
be considered a health behavior, then it may be important to consider how often

34SINGING EXPERIENCE SCALE
individuals engage in it. Inspiration for the wording of items was drawn from the focus
group feedback (e.g., comments such as “sings at every opportunity” and “hums a lot or
sings quietly throughout the day”).
The second subscale focused on measuring aspects of singing experience that
have a stronger basis of previous measurement in the literature, including singing skill
and training, as well as professional status. These variables were all used to distinguish
between singers and non-singers in the literature (e.g., Phyland et al., 1999; Sapir et al.
1996; Wilson et al., 2010) as well as supported in the focus group comments. Although
performance had not been used in studies to distinguish between singers and non-singers,
it was also included in this subscale based on the reasoning that training and professional
singing are frequently associated with performance. Focus group feedback suggested that
performance may be worthy of inclusion in the scale; further, this variable has been
shown to be relevant in the context of health outcomes (e.g., Beck et al., 2000; Cohen,
2009). Similarly, professional status may also be related to health and well-being
outcomes from singing (e.g., Beck et al., 2006; Grape et al., 2003).
The aim of the third subscale was to measure physical aspects of singing
experience that may be related to health and well-being outcomes. Items developed for
this subscale were based on research suggesting that the breathing and exercise aspects of
singing may be responsible for some of the benefits individuals report from singing (e.g.,
Bonilha et al., 2009; Engen, 2005; Grape et al., 2003; Valentine & Evans, 2001). Despite
the interesting research suggesting that singing may benefit the immune system, I could
not devise an appropriate means to measure this in an experiential self-report. Care was

35SINGING EXPERIENCE SCALE
taken to avoid overlap between physical experiences during singing and potential
physical outcomes from singing (e.g., stress-relief, improved breathing).
The fourth subscale included psychological experiences during singing. As with
the physical experience subscale, great care was taken to avoid potential psychological
outcomes and restrict focus to psychological experience. Items were developed based on
focus group feedback which suggested that enjoyment and innate musicality may be
important factors to consider in describing singers (e.g., “is happier singing” and “always
has a song in his/her heart”). The inclusion of items measuring the importance of singing
was also supported by Sapir et al.’s (1996) finding that singers rated singing as much
more important in their life than did non-singers. The significance of the activity being
experienced was thought be important to include as it may influence measures of
eudaimonic well-being such as personal growth which was found to increase following
singing (Busch & Gick, 2012). Similarly, enjoyment of singing was hypothesized to be a
potential experiential prerequisite of improved mood (reported in several studies
including Clift & Hancox, 2001 and Grape et al., 2003).
Finally, the aim of the fifth subscale was to measure social experiences related to
singing that may be related to health and well-being outcomes. Items concerning group
and choral singing were included because of the obvious potential for social interaction
(as opposed to solo singing). Choir membership has also been used to differentiate
between singers and non-singers (as in Pai et al., 2008; Prakup, 2012). Items concerning
the communication aspect of singing and harmonization were also included as they have
been suggested to be potentially important social components o f singing (Faulkner &
Davidson, 2006; Silber, 2005).

36SINGING EXPERIENCE SCALE
Ultimately, the resulting scale - the Singing Experience Scale - Item Pool (SE-IP)
- consisted of 39 items. As I had initially hoped to develop a final scale consisting of
approximately 20 items (a convenient and relatively brief scale), 39 seemed a reasonable
number of items to begin testing with, based on the recommendations of both Rust and
Golombok (2009) as well as DeVellis (2003). DeVellis (2003) indicated that the larger
the item pool, the better, but Rust and Golombok (2009) recommended that the size of the
item pool should be based on the desired length of the final scale, with a minimum of
50% more items in the initial pool than is desired in the final scale. However, Rust and
Golombok (2009) did not include expert feedback on items as a step in their
recommended scale design. Thus, I began with a slightly larger item pool than
recommended by Rust and Golombok (2009), and relied on expert feedback to help me
refine my items before testing the scale in the target population. These steps - expert
feedback and initial testing of the scale - are described in the following two studies.
Study 1: Expert Feedback
The first study I carried out with the Singing Experience Scale was a request for
feedback from singing research experts. Advocated by DeVellis (2003), Gehlbach and
Brinkworth (2011), Simms (2008), and Worthington and Whittaker (2006), expert
feedback enhances scale development by giving the scale designer a chance to get
feedback from experienced researchers prior to mass testing of the scale in the target
population. Expert review of the theoretical basis of the scale aids content validity by
helping ensure that all relevant aspects of the latent variable are included in the scale.
Further, experts may help with the refinement of the initial item pool by providing
feedback on item characteristics such as relevance or clarity (DeVellis, 2003; Gehlback &

37SINGING EXPERIENCE SCALE
Brinkworth, 2011). However, as DeVellis (2003) noted, even experts in a research area
may not fully understand the scale construction process, and so the final responsibility for
all decisions remains in the hands of the scale developer.
Method
Participants. Participants {n = 12) were singing research experts affiliated with
the SSHRC-funded Multi-Collaborative Research Initiative Advancing Interdisciplinary
Research in Singing (AIRS)2. The sample consisted of nine researchers, two student
researchers, and one musician. Four indicated psychology to be their primary area of
expertise, one indicated sociology, three indicated music, three listed music therapy, and
one listed their expertise as interdisciplinary. When asked about their involvement with
singing research, 11 out of 12 indicated that it was one of several areas of interest; only
one indicated that singing research was a passing interest. Five participants were involved
in singing research for five or more years, five have been involved for two to five years,
and two were involved for less than two years.
Procedure. This study was conducted online using Qualtrics. Responses collected
were anonymous and IP addresses were not collected. A recruitment notice containing a
link to the online study was forwarded by mass email to AIRS collaborators and co
investigators by the project administrator with the approval of the project director. The
survey remained open for 10 days following the issuance of the recruitment notice.
2 My supervisor Mary Gick, PhD., is a co-investigator and I am a student member of AIRS; the group’s website is www.airsplace.ca.3 One participant emailed me requesting to start the survey over because they had inadvertently quit the survey partway through. The participant provided information about the date and time at which this had occurred, so I was able to identify and delete the partial response, informing the participant that they could start the survey over at their convenience.

38SINGING EXPERIENCE SCALE
Measures. The expert feedback survey was designed based on suggestions from
DeVellis (2003) as well as Gehlbach and Brinkworth (2011).
Expertise. This portion of the study asked participants to indicate the nature,
level, and duration of their involvement in singing research, as well as their primary area
of expertise (see Appendix C).
Feedback on theoretical model. Participants were provided with a description of
the overall theoretical model guiding the scale development and asked to provide free
form comments (see Appendix D).
Feedback on items. Presented with lists of items grouped by potential subscale
(see Appendix B), participants were asked to indicate in a multiple choice format whether
each item was relevant, somewhat relevant, or not relevant. Similarly, they were asked to
indicate on a multiple choice format whether each item was clear or unclear. Participants
were also invited to provide comments on each group of items, including suggesting
additional items for consideration.
Overall comments. At the end of the survey, participants were invited to provide
overall comments or suggestions on the Singing Experience Scale.
Results and Discussion
The feedback provided by these singing research experts about the Singing
Experience Scale - Item Pool (SE-IP) is presented and discussed in the following
sections.
Feedback on theoretical model. Five participants elected to offer comments on
the description of the theoretical model guiding scale development. These comments
were as follows:

39SINGING EXPERIENCE SCALE
Comment #1: what about meaning of activity? is that covered under psychological? identity aspects of being a singer? impact when disrupted (e.g., unable to sing b/c of illness); thread of continuity over one's life? spiritual or transpersonal aspects of singing
Comment #2: it may be useful to ask how often the respondent has actually sung in the past week pat month, past year, and in which circumstances.
Comment #3: Seems reasonable. I would howeve (sic) encourage an open-ended element to the Q. so that you might carry out more qualitative analyses.
Comment #4:1 feel like singing experience and experience of singing are two different things - is one's experience of singing related to their singing experience and if so, how? Experience of listening to singing could be included - not how often but how they experience others' singing How will singing skill be measured? People with a lot of training sometimes will say that they are not skilled and vice versa.Private experience of singing??
Comment #5: Looks good!
All comments were considered carefully for what they might contribute to the
theoretical basis of the Singing Experience Scale. The concept o f meaning was
particularly interesting because it may have a relationship with well-being, but it was
difficult to determine how this might be measured in an experiential context, especially
given the intended response format. However, some of the psychological items may serve
to capture meaning to some extent (e.g., “Singing is important to me”; “I feel that I have
to sing”). While I appreciated the idea of qualitative analyses, it was not possible within
the confines of the current research project. Also, a great deal o f qualitative research has
already been carried out in the area of singing, health and well-being (e.g., Clift et al.
2007,2009), and these studies helped guide the present study. Part of the purpose of the
current study and scale development was to facilitate the movement into quantitative
evaluations of these ideas within larger samples than possible in qualitative analyses.

40SINGING EXPERIENCE SCALE
As noted in Comment #4, it is true that singing experience and experience of
singing are somewhat distinct concepts, but this is why they are being considered as
separate subscales. I felt it was important to consider both forms o f experience because of
the complexity of describing such a variable activity as singing. Singing experience such
as training or skill alone may not be very strongly related to the health and well-being
outcomes I’m interested in; in fact, I suspect that the nature of the experience during
singing may influence the relationship. This is suggested by the studies of immune
response where the nature of the singing experience influences the health outcome (e.g.,
singing perceived as a professional vs. amateur activity, Beck et al., 2006; rehearsal vs.
performance, Beck et al., 2000).
The idea of including listening to singing was considered, but I believe that
listening to singing is a completely different concept than actively engaging in singing,
and so would require its own measurement scale (i.e., experiences of listening could
involve unique physical, psychological, and social aspects). However, the issue of
measuring skill was a particularly excellent point raised here. As Comment #4 suggested,
individuals who are quite skilled may not perceive themselves as such and so measuring
perceived skill may be a flawed approach (see skill/professional/performance subscale
feedback for further discussion).
Feedback on items. Responses for relevance and clarity of items were scored as
follows: a) relevant = 1; b) somewhat relevant = 2; c) not relevant = 3; d) clear = 1; e)
unclear = 2. However, not all participants (n = 12) completed all relevance and clarity
questions for all items. Thus, to avoid loss of data by deleting participants, the relative
relevance and clarity of items was assessed using average scores (i.e., relevance and

41SINGING EXPERIENCE SCALE
clarity scores for each item were totaled and then divided by the number of responses).
Using this model, the potential range of relevance scores was 1-3, where approaching 1
denoted the greatest relevance. Similarly, the potential range of clarity scores was 1-2,
where 1 denoted the greatest clarity. Relevance questions were answered by a minimum
of eight and a maximum of 11 experts. Clarity questions were answered by a minimum of
seven and a maximum of 10 experts. Participants made comments and suggested
additional items for all subscales. The relevance and clarity scores for items, as well as
the comments and suggested items are presented below; they are grouped and discussed
by subscale of the SE-IP for ease of interpretation.
Singing behavior subscale. Average relevance scores for the singing behavior
subscale items ranged from 1.00 (SD = 0) to 1.60 (SD = 0.70), indicating generally high
relevance of these items (see Table 1). Participants also rated these items as highly to
moderately clear, with average clarity scores ranging from 1 (SD = 0) to 1.40 (SD = 0.52;
see Table 1).
Table 1
Average Relevance and Clarity Scores for Proposed Singing Behavior Subscale Items.
Relevance ClarityItems M (SD) M (SD)
I often sing or hum a tune 1.00 (0) 1.20 (0.42)I sing every chance I get 1.45 (0.52) 1.40 (0.52)I avoid singing (R) 1.00 (0) 1.00 (0)I sing at least a couple of hours per week 1.10(0.32) 1.22 (0.44)I sing on a regular basis 1.10(0.32) 1.33(0.50)I can sine for hours at a time 1.60 CO.701 u s r o .s o i
Note. Relevance (R = 1-3) and clarity (R =1-2), where 1 = highest relevance or clarity.
Four participants made comments on this subscale and two additional items were
suggested, as follows:

42SINGING EXPERIENCE SCALE
Comment #1: Ask for number of hours of singing per week, avoiding wording such as "a couple of hours"
Comment #2: If I was replying, I'd wonder if "singing on a regular basis" or "at least a couple of hours" meant formally, in structured fashion vs cummulation (sic) of 2 hours humming here and there as one goes through the week; or meant one one's (sic) own or with others or what classifies as singing
Comment #3: Do you sing with members of your family? with friends? with workmates? will fellow students? with neighbours? Where do you sing? in a choir? by yourself, etc.
Comment #4: be clearer with on (sic) how you are operationally defining things so that participants' answers can be compared. Terms such as "regular basis" or "often" mean different things to different peo pie(sic)-
Suggested item #1:1 only sing when I am alone
Suggested item #2 :1 sing in front of friends and family
Three of the comments (#1,#2 & #4) generally reinforce the data by suggesting a
re-evaluation of items that use non-specific language. Thus, I decided to: a) remove often
from “I often sing or hum a tune”, and b) delete “I sing every chance I get” and “I sing on
a regular basis”, substituting instead “I sing every day”. The lower relevance score of “I
can sing for hours at a time” relative to other items made it suspect, but upon further
consideration, its score was still indicative of quite high relevance given the potential
range (M= 1.60; R = 1 - 3). Further, this item represents an important aspect of singing
behavior: duration of singing (along with “I sing a couple of hours a week”). However, in
order to make the meaning and purpose of these items clearer, they were altered to: a) “I
sing for an hour or more at a time” to differentiate between people who sing only briefly
(e.g., in the shower), and those who sing for longer periods of time (e.g., in voice
lessons), and b) “I sing for two or more hours per week” to measure cumulative singing

43SINGING EXPERIENCE SCALE
over time, here using two hours as a benchmark because that is often the duration of a
choir rehearsal.
Comment #3 seemed to encourage description of instances in which people sing.
This would be interesting, but is not related to the present goals for the Singing
Experience Scale (SE). The purpose of this scale is not to be purely descriptive. The
primary purpose of the SE is to describe singing experience within a context that is
meaningful with respect to health and well-being; thus the items that I have chosen to
include have some basis for inclusion as they may influence health and / or well-being.
Further, as can be noted from the variety of instances listed by the commenter, listing
scenarios in which people sing can quickly become a slippery slope, as people sing in a
wide variety of situations and contexts.
Similarly, suggested item # 2, while interesting, did not seem to be related to my
goals in developing the SE. “I sing in front of friends and family” could perhaps measure
a performance aspect, but would not likely be sufficiently “performance” to influence
stress markers. Note that suggested item #1 was already included in the social experience
subscale of the SE-IP. Thus, the revised list of items for this subscale was:
1) I sing or hum a tune2) I sing every day3) I avoid singing (R)4) I sing for an hour or more at a time5) I sing for two or more hours every week
Skill / professional / performance subscale. Average relevance scores for this
subscale’s items ranged from 1.10 (SD = 0.32) to 1.60 (SD = 0.84), indicating generally
high relevance of these items as well (see Table 2). Participants also found these items

44SINGING EXPERIENCE SCALE
quite clearly worded, with average clarity scores ranging from 1.00 (SD = 0) to 1.33 (SD
= 0.52; see Table 2).
Table 2
Average Relevance and Clarity Scores fo r Proposed Skill / Professional / Performance Subscale Items.
Relevance ClarityItems M (SD) M (SD)I have taken voice lessons 1.10(0.32) 1.11 (0.33)I have received vocal training 1.10(0.32) 1.11 (0.33)I have earned income from singing 1.10(0.32) 1.11 (0.33)I have been paid to sing 1.11 (0.33) 1.13(0.35)I've been told that I'm a good singer 1.50 (0.71) 1.22 (0.44)I can carry a tune when I sing 1.30 (0.48) 1.00 (0)I'm a good singer 1.60 (0.84) 1.33 (0.50)I have sung in front of others 1.20 (0.42) 1.22 (0.44)I have sung onstage 1.20 (0.42) 1.11 (0.33)I have sung as part of a performance 1.20 (0.42) 1.22 (0.44)I have been told that I shouldn’t sing (R) 1.30 (0.67) 1.22 (0.44)I avoid singing in public (R) 1.20 (0.42) 1.0010)
Note. Relevance (R = 1-3) and clarity (R =1-2), where 1 - highest relevance or clarity.
Four participants made comments on this subscale and one additional item was
suggested, as follows:
Comment #1: 3rd and 4th options above mean the same thing
Comment #2: questions 3 and 4 are the same thing- income and being paid- maybe only choose one of those 2 questions
Comment #3: Things marked unclear need to be contextualized a bit more. For example, vocal training through a class/choir or individual lessons, as a child or as an adult...
Comment # 4 :1 assume the ones representing the same information are there as reliability checks?
Suggested item: use singing in a therapeutic medium
The four items rated lowest on relevance were all skill-related items (“I’m a good
singer”, “I’ve been told I’m a good singer”, “I can carry a tune when I sing”, and “I’ve

45SINGING EXPERIENCE SCALE
been told that I shouldn’t sing”). This hearkened back to comments on the theoretical
model that suggested measuring skill in this fashion was a flawed approach. Self
perceived skill (as measured by self-report questions such as those listed here) may be
unrelated to actual singing skill; thus, it is unclear whether skill measured in this way
would be relevant within the desired context for this measure. Recall that previous studies
measuring skill either classified participants according to amateur or professional status
(e.g., Bemassi-Werke et al., 2012) or used pitch-matching techniques (e.g., Wilson et al.,
2010). Further, although singing skill was suggested in focus group data to be important
for the distinction between singers and non-singers, the relationship between skill and
health or well-being outcomes is uncertain, and may depend heavily on one’s definition
of skill. Thus, I decided to delete all skill-related items and reconceived this subscale as a
training / professional / performance subscale.
Comments about redundant items were considered, but items were intended to be
a reliability check. However, the suggested item inspired a truly different way to ask
about singing as an aspect of someone’s job rather than in the classic performance singer
context. Thus, I substituted “Singing is part of my job” (in place of “I earn income from
singing”) which may better capture alternate ways that singing can be a source of income
as in music therapy or teaching. Comment # 3 also helped me consider ways to alter the
items intended to measure vocal training. Specifically, I decided to alter “I have received
vocal training” because it might be confused with private voice lessons. Instead, I
substituted “I am taught singing techniques” which may capture less formal forms of
vocal instruction, as in a choir setting. At this point I also noticed that the tense of the
remaining items in the subscale was different than in other subscales. In order to avoid

46SINGING EXPERIENCE SCALE
items grouping together during later factor analyses due to a spurious relationship from
wording, I changed all items to reflect present tense for consistency with other subscale
items. Thus, the revised list of items for this subscale was:
1) I take singing lessons2) I am taught singing techniques3) I get paid to sing4) Singing is part of my job5) I sing in front of others6) I sing onstage7) I sing as part of a performance8) I avoid singing in public (R)
Physical experience subscale. Average relevance scores for the physical
experience subscale items ranged from 1.33 (SD = 0.50) to 1.63 (SD = 0.74), indicating
moderately high relevance of these items (see Table 3). Participants also rated these items
as moderately clear, with average clarity scores ranging from 1.22 (SD = 0.44) to 1.56
(SD = 0.53; see Table 3).
Table 3
Average Relevance and Clarity Scores for Proposed Physical Experience Subscale Items.
Relevance ClarityItems M (SD) M (SD)
I use my whole body to sing 1.40 (0.70) 1.22 (0.44)Singing is exercise for me 1.33 (0.50) 1.30(0.48)I get physically involved when I'm singing 1.60 (0.70) 1.56 (0.53)Singing changes my breathing 1.38(0.74) 1.38(0.52)I breathe deeper to sing 1.44 (0.73) 1.22 (0.44)I do breathing exercises when I sine 1.63 (0.743 1.33 (0.50)
Note. Relevance (R = 1-3) and clarity (R =1-2), where 1 = highest relevance or clarity.
Three participants made comments on this subscale and three additional items
were suggested, as follows:
Comment #1: breathing exercise before singing to warm up rather than"....when I sing" singing changes my breathing but also my breathingchanges my singing

SINGING EXPERIENCE SCALE47
Comment #2: what does it mean to get "physically involved;" how does breathing change?
Comment #3: These don't really make sense to me and probably need rewording. Essentially you want to know if breathing for singing (or learning to breathe for singing) affects breathing when not singing. I'd think about this some more!
Suggested item #1:1 pay attention to my posture when singing
Suggested item #2 :1 can stand without problem throughout rehearsals
Suggested item #3 :1 am physically energized after rehearsing
The lower ratings of these items (as compared to the previous subscales) and the
comments suggested that I may have failed to make the purpose o f this subscale clear to
the expert participants. This demonstrates a weakness of seeking feedback in this way as
opposed to having an in-person back and forth discussion with a smaller number of
experts. For example, while it may have been interesting to consider how breathing
changes singing (as mentioned in Comment #1), it was not relevant in the context of the
present study. Also, Comment 3 suggested that I wished to know how breathing is
affected, when in fact my interest was in how health may be affected by the breathing
changes that occur during singing, regardless of whether or not those breathing changes
linger after singing.
Two items were deleted to address the scores and comments. “I get physically
involved when I sing” was deleted because the idea of singing as exercise is well
addressed by “I use my whole body to sing” and “Singing is exercise for me”. “I do
breathing exercises when I sing” was also deleted because breathing exercises may not be
an actual part of the singing experience, but may occur beforehand as a warm up in voice
lessons or choirs; thus, removing this item helped to both broaden the appeal of the

48SINGING EXPERIENCE SCALE
subscale (by reducing the training / choral perspective), while also focusing more closely
on the desired target of the actual singing experience (not the peripherals).
Suggested items #1 and #2 raised the consideration of the potential role of posture
as an aspect of the physical experience of singing. Singers have reported posture
improvement as one of the physical health benefits of participating in singing activities
(Clift et al., 2009). However, the postural aspects of singing may only be associated with
more formal types of singing (i.e., a voice lesson or choir where someone observing
would alter the posture). Further, there have been no studies done to demonstrate that the
posture(s) associated with singing have an impact on health. This could be a very
interesting area for future research, but at present, postural experience was deemed
inappropriate for inclusion in this subscale due to a lack of theoretical support. Suggested
item #3 bordered on an outcome measure (i.e., after singing) as opposed to an experience
of singing itself and so was not added to the subscale. Thus, the revised list of items for
this subscale was:
1) I use my whole body to sing2) Singing is exercise for me3) Singing changes my breathing4) I breathe deeper to sing
Psychological experience subscale. Average relevance scores for the
psychological experience subscale items ranged from 1.10 (SD = 0.32) to 1.30 (SD =
0.67), indicating a generally high perceived relevance of these items (see Table 4).
Participants also rated these items as quite clear, with average clarity scores ranging from
1.00 (SD = 0) to 1.29 (SD = 0.49; see Table 4).

49SINGING EXPERIENCE SCALE
Table 4
Average Relevance and Clarity Scores for Proposed Psychological Experience Subscale Items.
ItemsRelevance
M (SD)Clarity M (SD)
I enjoy singing 1.10(0.32) 1.00 (0)I like to sing 1.10(0.32) 1.13 (0.35)I dislike singing (R) 1.10(0.32) 1.13(0.35)I express myself through singing 1.30 (0.67) 1.25 (0.46)I feel that singing is important to me 1.10(0.32) 1.13 (0.35)I feel that singing is a part of who I am 1.20 (0.42) 1.29 (0.49)I feel like I have to sine 1.3010.48) 1.29 (0.49)
Note. Relevance (R = 1-3) and clarity (R =1-2), where 1 = highest relevance or clarity.
Two participants made comments on this subscale and three additional items were
suggested, as follows:
Comment #1: restate as singing is important to me and singing is a part of who I am
Comment #2: singing makes me feel uncomfortable; explore the other side of the coin a bit more.
Suggested item #1: singing is a meaningful activity in my life
Suggested item #2: singing expresses my faith/spirituality/religion
Suggested item #3: singing helps me cope with life/manage stress
In accordance with comment #1, “I feel that” was removed from two
items such that they became “Singing is important to me” and “Singing is part of
who I am”. Similarly, in order to address the relatively lower clarity score for “I
feel like I have to sing”, I altered this item to “I need to sing”. In order to reduce
excessive redundancy I also decided to delete “I like to sing” in favor of keeping
the reverse-scored “I dislike singing” item.
Comment #2 was also interesting, although it was difficult to know how
50SINGING EXPERIENCE SCALE
to ask individuals about negative psychological experiences with singing
because so many studies describing the effects of singing have been done with
self-selected singers who generally describe positive experiences. However, as
Bailey and Davidson’s (2005) study suggested, even choral singers can
experience embarrassment or discomfort in singing, particularly i f they are
concerned about making mistakes. Thus, I decided to include a new item
“Singing makes me feel uncomfortable or embarrassed”; this item was reverse-
scored because I would not expect a negative psychological experience such as
embarrassment to be positively associated with psychological well-being.
Suggested item #1 was too closely related to potential outcome measures
(i.e., meaning aspects of eudaimonic well-being) to clearly belong in this attempt
at measuring purely experiential aspects of singing. Further, meaning may be
captured to some extent by “Singing is important to me” and “Singing is part of
who I am”. Suggested item #2 was already encompassed by “I express myself
through singing” (as the suggested is simply a subtype of that more general
case). Suggested item # 3 again represented more of an outcome from singing
than an experience during singing. I attempted to devise an experiential
representation of stress relief, but could not develop a suitable item for inclusion.
Future research might re-consider this issue. Thus, the revised list of items for
this subscale was as follows:
1) I enjoy singing2) I dislike singing (R)3) I express myself through singing4) Singing is important to me5) Singing is part of who I am6) I need to sing

51SINGING EXPERIENCE SCALE
7) Singing makes me feel uncomfortable or embarrassed (R)
Social experience subscale. Average relevance scores for the physical experience
subscale items ranged from 1.10 (SD = 0.32) to 1.67 (SD = 0.71), indicating moderate to
high relevance of these items (see Table 5). Participants also rated the clarity of these
items as ranging from very clear (M =1.00; SD = 0) to only moderately clear (M - 1.60;
SD = 0.52; see Table 5).
Table 5
Average Relevance and Clarity Scores for Proposed Social Experience Subscale Items.
Relevance ClarityItems M (SD) M (SD)
I have sung with a choir 1.10(0.32) 1.00 (0)I sing with others 1.20 (0.42) 1.38 (0.52)I’ll only sing when I’m alone (R) 1.20 (0.42) 1.13 (0.35)I communicate with others through singing 1.67 (0.71) 1.60 (0.52)I prefer to sing with others 1.20 (0.42) 1.00 (0)I am more comfortable singing in a groupthan by myself 1.20 (0.42) 1.00 (0)
I have belonged to the same choir for years 1.40 (0.70) 1.13(0.35)When I sine. I like to harmonize with others 1.30 f0.67) 1.13(0.35)
Note. Relevance (R = 1-3) and clarity (R =1-2), where 1 = highest relevance or clarity.
Two participants made comments on this subscale and one additional item was
suggested, as follows:
Comment # 1: difference between formal vs informal — e.g., around campfire, with family/friends/in church vs formal structured performance focus. Seems important how respondents are primed toread the questions the intro material to survey....what counts assinging
Comment # 2: some things could be more contextualized; also - everything seems very formal - what about less formal contexts like singing around a camp fire, karaoke, singing in the care (sic) with the radio, etc...
Suggested item #1: wherever I'm living, I look for a choir to join

52SINGING EXPERIENCE SCALE
Based on the relatively low relevance and clarity scores for “I
communicate with others through singing”, I decided to delete this item.
Although opportunity for communication may be conjectured to be part of the
social benefits of singing, this aspect has yet to be studied in the necessary depth
to justify its inclusion in this scale. Also, in consideration of the comments, I
decided to also delete “I have belonged to the same choir for years” in order to
reduce the more formal choral perspective. Further, although it may be
suspected that duration of choral membership confers differential social benefits,
evidence supporting this idea is lacking. The suggested item was interesting, but
appeared to deal more with motivation to join a group than with singing
experience itself, and so was not included. The comments regarding priming and
contextualization were addressed in greater detail in conjunction with the overall
comments (see the next section). Thus, the revised list of items for this subscale
was:
1) I sing with a choir2) I sing with others3) I’ll only sing when I’m alone (R)4) When I sing, I like to harmonize with others5) I prefer to sing with others6) I am more comfortable singing in a group than by myself
Overall comments. Four participants chose to offer final, overall comments
as follows:
Comment # 1: very interesting!
Comment #2: Good Luck!
Comment #3: It would be good to have question on whether or not singing is embarassing (sic) for people

53SINGING EXPERIENCE SCALE
Comment #4 :1 think this is a great topic. I didn't have the time to spend thinking about each item as much as I would have liked. Three main things: I really think that some of the variables need to be better contextualized and operationalized - so that participants understand each question in the same way, include more questions about informal singing contexts - it feels biased in that many of the questions seem rooted in a "choral" perspective, and make a clearer differentiation between singing experience and the experience of singing. Non experienced singers may have wonderful experiences o f singing and that has health implications for the general public.
Comment #4 related to issues raised in the comments for the social experience
subscale. Specifically, experts seemed to be suggesting that participants may be
influenced by a more formal perception of what singing is than I intended to be measured
by the SE. So, as suggested, I endeavored to better operationalize and communicate the
purpose of the scale to participants. To do this, I added a brief preamble to the
instructions for participants in the SE, so that participants may understand that all kinds
of singing experience are valid. The preamble read as follows:
You will now be asked about your experience with singing. These experiences may include formal experiences like in a choir or voice lessons, but we also wish to know about your experience singing in less formal situations such as karaoke or when you sing along with the radio or in the shower. Basically, in answering these questions, we want you to think about any and all kinds of singing you may do.
Overall, expert feedback was very helpful in revising the item pool of the SE (see
also general discussion). This process resulted in the development of the Singing
Experience Scale - Testing Version (SE-TV; see Appendix E) for testing in the target
population.
Study 2: Testing and Refining the Singing Experience Scale
A key step in the classical model of scale development is testing of the scale in
the target population. The data collected from a large, heterogeneous sample are analyzed

54SINGING EXPERIENCE SCALE
to help refine the scale and determine whether the model demonstrates reliability and
validity (Clark & Watson, 1995).
Factor analysis “summarizes patterns of correlations among observed variables, to
reduce a large number of observed variables to a smaller number o f factors” (Tabachnick
& Fidell, 2007, p.608). In scale development, the observed variables are the testing scale
items and they should ideally reduce to a single factor - the latent variable that is being
measured. Thus, the purpose of performing factor analysis in scale development is to
determine whether or not the scale is measuring a single latent variable (i.e., do the items
reduce to a single factor) and to differentiate between those items that measure the single
latent variable well and those that might be measuring some other, related construct
(DeVellis, 2003). However, it is also possible to have a latent variable that consists of
several distinct aspects, which may emerge as more than one distinct factor during factor
analysis. If the grouping of items into the multiple factors makes sense from a theoretical
standpoint, then this can result in the development of subscales (Clark & Watson, 1995).
Internal consistency reliability, which refers to whether or not the questions in the
scale all measure the same thing, may be calculated using Cronbach’s coefficient alpha.
Combach’s alpha uses the correlations between the responses to each item in the
questionnaire to determine how related the questions are to each other. Ideally, all
questions in a scale should be highly related if they are all measuring the same thing: the
latent variable of interest (DeVellis, 2003; Rust & Golombok, 2009).
Construct validity, which pertains to the relationships between the new scale and
other variables, may also be examined at this stage of scale development. Essentially, if
these relationships reflect expected strength and directions, then the scale is considered to

55SINGING EXPERIENCE SCALE
have construct validity (DeVellis, 2003; Rust & Golombok, 2009). For example, a scale
measuring attitudes towards health-care could be said to have construct validity if
individuals who had positive attitudes towards health care were also more likely to have a
family doctor. This example also demonstrates known-groups validation (a form of scale
validation) in which individuals who belong to a group (e.g., those having a family
doctor) can be distinguished from those who do not belong to that group based on the
scores they achieve on a measure (e.g., attitudes towards health care scale; De Vellis,
2003). Clark and Watson (1995) highly recommend examination of relationships between
the new scale and measures of related constructs during initial data collection in order to
evaluate the theoretical basis upon which the new scale was developed.
The purpose of this study was to test the Singing Experience Scale - Testing
Version (SE-TV) in a heterogeneous sample of the target population (adults). Item-level
analyses, factor analyses, as well as reliability analyses were used to examine how the
SE-TV performed and refine the scale. The construct validity of the scale was also
considered, using known-groups validation as well as analysis o f the relationships
between the SE and established measures of health and well-being.
Hypotheses
1) The Singing Experience Scale will demonstrate five distinct subscales:
a. singing frequency
b. profession / performance / skill
c. physical experience
d. psychological experience
e. social experience

56SINGING EXPERIENCE SCALE
2) Choir members will score higher than the general population on all subscales on
the Singing Experience Scale (known groups validation).
3) High scores on a) singing frequency and b) profession / performance / skill
subscales will each be positively associated with perceived singer status. Self-
identification as a singer has previously been used to help define singer vs. non
singer populations (e.g., Petty, 2012; Phyland et al., 1999).
4) High scores on the physical experience subscale in combination with high scores
on singing frequency will be associated with higher ratings of physical health.
Singing has been positively associated with self-rated health (Cohen et al., 2006).
5) High scores on the profession / performance / skill subscale will be associated
with increased health behaviors. Professional singing has been associated with
increased practice of healthy behaviors and avoidance of unhealthy behaviors
(Kenny, Davis & Oates 2004).
6) High scores on psychological and social experience subscales in combination with
high scores on singing frequency will be positively associated with psychological
well-being. Several studies suggest that various aspects o f well-being may be
influenced by singing, including hedonic aspects of well-being such as mood
(Busch & Gick, 2012; Unwin et al., 2002; Valentine & Evans, 2001). Eudaimonic
aspects of well-being such as vitality and personal growth (Busch & Gick, 2012),
as well as social benefits (Clift & Hancox, 2001; Silber, 2005) have also been
associated with singing.
Method

57SINGING EXPERIENCE SCALE
Participants. Participants for this study were drawn from two groups: a) the
general adult population, and b) choir members. Of 382 individuals who consented to
participate in the study, 213 were retained for analyses (see discussion of completers vs.
non-completers and missing data analyses in preliminary analyses). The 213 participants
consisted of 157 adults from the general population recruited by snowballing methods
using email and Facebook, as well as 56 choir members recruited by email from four
Ottawa-area amateur adult choirs. Participants ranged in age from 18-85, with the mean
age of the total sample M= 44.87 (SD = 16.32). The sample consisted of 28.6% males
and 71.4 % females. The majority of the total sample was Caucasian (90.6%), with the
remaining identifying as African (0.5%), Asian (3.3%), Middle Eastern (0.9%), or Other
(4.7%; see descriptive statistics and Table 9 for more detailed demographic information
by group).
Measures. Demographic variables. Participants were measured on a number of
demographic variables including gender, age, highest completed education, income, and
ethnicity (see Appendix F).
Singing Experience Scale - Testing Version (SE-TV). This 30-item scale
measuring various aspects of singing experience was under development in this study.
Participants were asked to indicate the frequency with which they experienced each item
on a five-point Likert scale from 1 = never to 5 = always (see Appendix E).
Validation measures. Validation measures included measures of singer status as
well as of health and well-being (see Appendix F for all validation measures). Perceived
singer status was measured using a single item measure devised for the purposes of this

58SINGING EXPERIENCE SCALE
study. It asked participants to rate their agreement on a five-point Likert scale from 1 =
strongly disagree to 5 = strongly agree for the statement “I am a singer”.
Health. Self-rated health (SRH) was measured using a single item measure of
global health status; it asked participants to rate their health on a seven-point Likert scale
from 1 = very poor to 7 = excellent, could not be better. Similar, single-item measures of
self-rated health have been used widely (e.g., by Statistics Canada) and have been found
to predict mortality, as well as be inversely correlated with physician visits (Miilunpalo,
Vuori, Oja, Pasanen, & Urponen, 1997). Note that a seven-point response scale was
chosen as this response format has been shown to demonstrate response characteristics
equivalent or superior to four or five-point response options (Eriksson, Unden, &
Elofssen, 2001).
Health behaviors were measured using the Health Behavior Checklist (HBC;
Vickers, Conway & Hervig, 1990). For this measure, participants were asked to rate their
agreement with 40 statements concerning their practice of health behaviors on a five-
point Likert scale from 1 = strongly disagree to 5 = strongly agree. Twenty-six of the
items were then used to obtain average scores on four health behavior dimensions: 1)
Wellness Behaviors including items such as “I exercise to stay healthy”; 2) Accident
Control including items such as “I have a first aid kit in my home”; 3) Traffic Risk-
Taking including items such as “I speed while driving”; and 4) Substance Risk-Taking
including items such as “I do not drink”. Each of the Wellness Behavior, Accident
Control, and Traffic Risk subscale achieved moderate to good levels of reliability (a >
0.65) when averaged across four samples, although the Substance Risk subscale was less
reliable, achieving only a = 0.55 (Booth-Kewley & Vickers, 1994; Vickers, Conway, &

59SINGING EXPERIENCE SCALE
Hervig, 1990). In the present study, this pattern was replicated with Wellness Behavior a
= 0.73, Accident Control a = 0.65, and Traffic Risk a = 0.78, and Substance Risk a =
0.35.
Well-being. As well-being can be defined from either a hedonic (emphasizing
pleasure) or eudaimonic (emphasizing growth and fulfillment) perspective (Ryan & Deci,
2001), I elected to include measures representing each of these perspectives. Hedonic
well-being was measured using the Positive and Negative Affect Scale (PANAS; Watson,
Clark, & Tellegen, 1988). This 20-item scale lists mood states, asking participants to
indicate how much they feel each mood in general on a five-point Likert scale from 1 =
very slightly or not at all to 5 = extremely. Positive affect (PA) and negative affect (NA)
subscales are each represented by 10 mood states (e.g., PA: interested, excited; NA:
distressed, hostile) on the scale and a score for each subscale is calculated by summing
the scores for its items. The reliability of each of these subscales has been reportedly high
(a pa = 0.86; a na = 0.84; Watson, Clark, & Tellegen, 1988); this was replicated in the
present study with a p a = 0.89 and a n a = 0.87.
Eudaimonic well-being was measured using two measures: the Vitality Scale and
the Flourishing Scale. The Vitality Scale (VS; Ryan & Frederick, 1997) is a six-item
measure of subjective vitality that asks participants to indicate how true each statement
(e.g., “I feel energized”) is for them on a scale of 1 = not true at all to 7 = very true. The
scale is scored by summing responses to all six items and dividing by six, generating an
average response score. The VS has been reported to demonstrate high reliability (a =
0.84; Ryan 7 Frederick, 1997) and this was replicated in the present study (observed a =
0.92). The Flourishing Scale (FS; Diener et al., 2009) measures meaning, purpose and

60SINGING EXPERIENCE SCALE
social relations aspects of eudaimonic well-being; it asks participants to rate their
agreement with 8 statements (e.g., “I lead a purposeful and meaningful life”; “My social
relationships are supportive and rewarding) on five-point Likert scale from 1 = strongly
disagree to 5 = strongly agree. A total score was created by summing item scores. The
FS has demonstrated high reliability both in past research (a = 0.84; Diener et al., 2009)
and the present study (observed a = 0.93). This combination of measures was used
because the Vitality Scale has shown sensitivity to the effects of singing (Busch & Gick,
2012), while the Flourishing Scale includes social and meaning aspects of well-being.
Procedure. Potential participants reached via recruitment notice sent out by email
or posted on Facebook were invited to click a link to an online survey hosted on
Qualtrics. The general population sample and the choir member samples were directed to
distinct, but identical online surveys in order to ensure that the data from each group were
kept separate for known-groups validation. The online surveys consisted of a consent
form, the measures listed above, and a debriefing. The surveys remained open for three
weeks. Responses for each group (general population vs. choir members) were collated
using Qualtrics and then entered into a single SPSS data file where participants were
coded as either known choir member or general population.
Data analyses. Following preliminary analyses of all of the data, including
cleaning and screening for assumptions, the SE-TV was evaluated and refined. This
involved a combination of item-level examination and factor analysis of the SE-TV
items in order to identify possible items for exclusion and determine whether the scale
exhibited hypothesized subscales. Both exploratory factor analyses (EFA) using
principal axis factoring (PAF) extraction and principal components analyses (PCA)

61SINGING EXPERIENCE SCALE
forms of factor analysis were run. Clark and Watson (1995) recommend using either
EFA or PCA for scale development, but Fabrigar, Wegener, MacCallum, and Strahan
(1999) argue in favour of EFA to maximize the generalizability o f results. EFA,
however, requires assumptions of normality to be met that PCA does not. As Field
(2009) notes, PCA and EFA using PAF have been demonstrated to produce similar
results; thus, I ran the two analyses concurrently in order to evaluate the performance of
the EFA in the face of potential assumption violations. Items deemed reasonable for
inclusion in the Singing Experience Scale (SE) based on their performance in item-level
and factor analyses were submitted to reliability testing with Cronbach’s alpha. Finally,
the refined SE was subjected to validation analyses using: a) comparison of scores across
known groups; b) correlation of the SE and a criterion measure (Perceived Singer
Status); and c) correlation of the SE and measures of health and well-being for construct
validation.4
Further exploratory regression analyses were also run to investigate whether the
SE could predict change in health and well-being measures above and beyond the
variance that could be accounted for by age, gender, and income. Age, gender, and
income have been found to be significantly related to health and well-being in previous
research (e.g., Dunn, Veenstra, & Ross, 2006: Denton, Prus, & Walters, 2004; Mahan &
Estes, 2012; Mentzakis & Moro, 2009; Nolen-Hoeksema & Rusting, 1999; Prus, 2011).
Moderation analyses were included to explore the possibility o f an interaction between
known group (general population vs. choir member) and SE. Thus, in a three-step
hierarchical regression analysis conducted for each health and well-being variable, age,
4 The total sample was used for item-level and factor analyses. Evaluation at the group level only occurred during validation analyses.

62SINGING EXPERIENCE SCALE
gender, and income were controlled for in the first step, known group and SE were
entered in the second step, and the third step added an interaction term (Known Group x
SE).5
Results and Discussion
Preliminary analyses. Completers vs. non-completers. O f 382 participants (288
general population; 94 choir members) who indicated consent to participate in the study,
only 333 completed the study. Forty-six individuals quit or closed the study before seeing
all of the questions and three individuals viewed all questions but provided no data
beyond consent. Of the 49 individuals who failed to complete the study, 36 provided
demographic information, permitting a comparison of completers and non-completers.
Choir members were more likely to complete the survey than members of the general
population t (51) = 2.72, p < 0.05 (Levene’s test indicated unequal variances F = 28.87, p
< 0.01 so degrees of freedom were adjusted from 367 to 51). A closer examination
showed that 95.7% of choir members completed the survey whereas 84.4% members of
the general population completed the survey. This may have been due to choir members’
greater interest in singing research. Completers and non-completers were not found to
differ on age, gender, ethnicity or income.
Missing data, cleaning and screening fo r assumptions. Data were cleaned and
screened for errors, missing values, and outliers. Using missing values analyses in SPSS,
data were determined to be missing completely at random for the total sample as Little’s
MCAR test x2 = 2344.99, df = 2290, p > 0.05. These results were replicated for the
general population sample Little’s MCAR test x2 = 1884.45, df = 1849, p > 0.05 and
5 SE was centered for the moderation analyses.

SINGING EXPERIENCE SCALE
choir member sample Little’s MCAR test x2 = 883.28, df = 890, p > 0.05. As the
percentage of missing data for each group was also < 5%, casewise deletion was used,
with the resultant sample size n = 213.6 It is worth noting that the ratio of participants
across known groups was closely maintained through casewise deletion, as the
percentage of cases deleted from each group was very similar (35.4% of general
population; 37.8% of choir members).
Variables were screened for normality and univariate outliers using skew and
kurtosis values in combination with frequencies and histograms. Only two case scores on
the Flourishing Scale were deemed extreme enough to warrant moving to within +/- 3.29
standard deviations. Multivariate outliers were detected using Mahalanobis distance, but
as no patterns could be discerned by a closer examination of cases and the observed
maximum Cook’s distance was < 1, these cases were determined to be insufficiently
influential to warrant alteration or deletion (Field, 2009; Tabachnick & Fidell, 2007). To
detect potential multicollinearity among the variables, correlation tables were examined
and regressions were run to examine the variance inflation factor (VIF). No VIF
exceeded 10, suggesting that multicollinearity was not an issue (Field, 2009), although
correlations between some SE items were high (see item-level analyses for further
discussion). Linearity was screened for using bivariate plots and plots of residuals as
6 The single-item health measure (SRH) was responsible for a large proportion of the missing data (56 / 333 participants did not complete this item). I originally intended to use the SF-36 as the health measure, but licensing fees in excess of $1000 prevented me from doing so. Although missingness was considered as potentially important for the evaluation of SE items, a closer look prior to casewise deletion revealed very few cases of missingness per item (max = 7 / 333) and no meaningful patterns.

64SINGING EXPERIENCE SCALE
appropriate.7 Homogeneity of variance was examined across known groups for PA, NA,
VS, FS, and all HBC subscales; Levene’s test of homogeneity of variance was non
significant for all dependent variables ip > 0.05). Independence o f errors was considered
for all regressions using the Durbin-Watson coefficient; as no values exceeded the
recommended range of one to three (Field, 2009) this assumption was also met (observed
values ranged from 1.88-2.08).
Scale evaluation and refinement. Item-level analyses. SE items were evaluated
for performance in the total sample by analyses of range, mean centrality, variance, and
the shape of item distributions. Inter-item correlations were also examined.
Distribution. According to DeVellis (2003), a mean near the center of the
response scale and a relatively high variance are desirable item characteristics. Thus,
items with non-central means were flagged for further examination and consideration for
deletion from the scale (on a response scale of 1-5,1 judged centrality to be
approximately 2.5-3.5). Similarly, I flagged items with relatively low variance (< 1).
Clark & Watson (1995) recommend that those items with highly skewed or unbalanced
distributions should be considered for deletion from the scale. However, the statistical
significance of skewness and kurtosis values (i.e., when compared to a z distribution)
may not be meaningful in a large sample. Field (2009) cautions that with samples of 200
or more, the standard error is reduced such that standard extreme cutoff values for z are
invalid (recall, n = 213 in the present study), although relative magnitude of the skew and
kurtosis values may still provide information about the shape o f the distribution
7 Screening for assumptions was carried out with groupings of variables appropriate to each stage of analysis (e.g., SE items for factor analyses vs. all variables to be included in validation analyses). Cleaning and screening were also carried out within known groups as necessary for analyses.

65SINGING EXPERIENCE SCALE
(Tabachnick & Fidell, 2007). Thus, I decided to flag only the most extreme skew and
kurtosis values for consideration. By these guidelines, most items performed well,
demonstrating variety in responses and fairly normal distributions (see Table 6). The
following items, however, may warrant consideration for deletion from the scale as they
demonstrated poor performance on two or more of the above criteria:
Item 1)1 sing or hum a tune Item 2) I take singing lessons Item 4) I enjoy singing Item 9) I dislike singing (R)Item 12) I get paid to sing Item 15) Singing is part of my job Item 17) I avoid singing (R)

66SINGING EXPERIENCE SCALE
Table 6
Descriptive Statistics for the Singing Experience Scale — Testing Version Items
Item Range M (Var) Skew Kurtosis1) sing or hum a tune 1-5 3.96 0.66) -0.99 2.082) take singing lessons 1-5 1.97 1.45) 1.05 0.063) use my whole body to sing 1-5 3.26 1.49) -0.29 -0.774) enjoy singing 1-5 4.42 0.85) -1.74 2.765) sing with a choir 1-5 3.08 2.84) -0.09 -1.696) sing every day 1-5 3.71 1.32) -0.64 -0.437) am taught singing techniques 1-5 2.72 2.18) 0.11 -1.438) Singing is exercise for me 1-5 2.67 2.03) 0.17 -1.319) dislike singing (R) 1-4 1.33 0.44) 2.08 3.7810 I sing with others 1-5 3.46 1.20) -0.57 -0.2811 I sing for an hour or more at a time 1-5 3.00 1.77) -0.25 -1.2212 I get paid to sing 1-5 1.56 1.06) 1.81 2.2813 I express myself through singing 1-5 3.22 1.88) -0.34 -1.0814 I’ll only sing when I’m alone (R) 1-5 2.35 1.15) 0.39 -0.5815 Singing is part of my job 1-5 1.55 1.35) 2.08 3.0516 Singing is important to me 1-5 4.03 1.66) -1.11 -0.0217 I avoid singing (R) 1-4 1.64 0.83) 1.14 0.0718 I sing in front of others 1-5 3.31 1.14) -0.47 -0.3419 Singing changes my breathing 1-5 3.52 1.68) -0.45 -0.9220 Singing makes me uncomfortable (R) 1-5 2.08 1.07) 0.71 -0.2121 Singing is part of who I am 1-5 3.73 2.16) -0.71 -0.9822 When I sing, I like to harmonize 1-5 3.38 2.12) -0.51 -1.1123 I sing onstage 1-5 2.78 2.00) -0.02 -1.4224 I breathe deeper to sing 1-5 3.52 1.77) -0.69 -0.6625 I need to sing 1-5 3.59 1.63) -0.53 -0.8126 I prefer to sing with others 1-5 3.33 1.60) -0.25 -0.9327 I sing as part of a performance 1-5 2.94 2.19) -0.16 -1.4528 I sing for two or more hours every week 1-5 3.36 2.61) -0.43 -1.4429 I avoid singing in public (R) 1-5 2.29 1.70) 0.74 -0.6430 I am more comfortable singing in a group 1-5 3.28 1.56) -0.21 -0.92Note. (R) denotes items that would be reverse-scored; however, for ease of interpretation, scores for reverse-score items are presented here as they were responded to by participants (i.e., they have not been reversed) and for all items a score of 1 -Never, 2 = Rarely, 3 = Sometimes, 4 = Often, 5 = Always; standard deviation for all skew scores = 0.17, standard deviation for all kurtosis scores = 0.33; some items are abbreviated; items in bold are values of concern.

67SINGING EXPERIENCE SCALE
Correlations. DeVellis (2003) suggests that high inter-item correlations are
desirable in a scale and indicative of high item reliability. Examination of the bivariate
correlations between items revealed that most items were significantly positively
correlated at the p < 0.05 level (see Appendix G)8. However, the following SE items
failed to correlate significantly with three or more other items:
Item 9) I dislike singing (R)Item 15) Singing is part of my jobItem 30) I am more comfortable singing in a group than by myself
Item 30 in particular was of concern because it only correlated significantly with
10 of the other 29 items. Further, item 30 displayed negative correlations with other items
when all other correlations were positive. This suggests that item 30 may be different in
some way from the other items, or measuring something other than what was intended
during its design. I also noted that some items displayed very high bivariate correlations
(>0.8), suggesting that some of the items may be multicollinear (Tabachnick & Fidell,
2007). These pairs of items were: 1) items 11 and 23; 2) items 11 and 28; 3) items 28 and
12; 4) items 23 and 27; 5) items 21 and 13; 6) items 21 and 16. However, the
relationships between items required further analyses before decisions regarding
inclusion or exclusion of items could be made.
Factor analyses. The SE-TV items (all 30) were subjected to identical principal
components analysis (PCA) and exploratory factor analysis (EFA) using principal axis
factoring as the extraction method. The PCA and EFA produced identical factor loading
patterns (see Appendix H for PCA output), suggesting that the EFA results may be
8 Unfortunately a 30x30 table was too large to fit in text in APA style.

68SINGING EXPERIENCE SCALE
considered robust despite potential violation of assumptions of normality and
multicollinearity among the SE items. Thus, only the EFA results are reported here.
Initially, four factors were extracted using the SPSS default Kaiser’s criterion
(eigenvalues >1). However, Field (2009) notes that this criterion may not be reliable
when the sample size is greater than 200 (n = 213 in the present study) and the number of
variables is 30 or more (30 items were entered for factor extraction); Kaiser’s criterion
often overestimates the number of factors to be retained (Zwick & Velicer, 1986). Thus, I
decided to use parallel analysis, a method recommended by O’Connor (2000) as well as
Zwick and Velicer (1986), to confirm the number of factors to retain (see Appendix I for
parallel analysis output)9. In accordance with the results of the parallel analysis, three
factors were retained and, as the factors were expected to be significantly correlated,
oblique rotation (using Oblimin) was applied (see Table 7).
The resultant model had a Kaiser-Meyer Olkin value of 0.93 and the Bartlett’s
Test of Sphericity was significant, x2 (435) = 6036.52, p < .01, suggesting that the sample
size was more than sufficient and the data were factorable (Field, 2009; Tabachnick &
Fidell, 2007; also see general discussion). However, as noted in the item analyses,
multicollinearity may be present among the items, as the R matrix determinant was <
0.00001 (determinant = 1.93 x 10'13; Tabachnick & Fidell, 2007). The appropriateness of
oblique rotation was confirmed by the factor correlation matrix, as Factor 1 and Factor 3
were correlated r\y = 0.52; Tabachnick and Fidell (2007) recommend oblique rotation if
any factor correlations exceed 0.32. Other factors were not highly correlated (rn = 0.12;
r23 = 0.18).
9 Note that an SPSS syntax file obtained from O’Connor (2000) was used to performparallel analysis and generate the eigenvalues for comparison.

69SINGING EXPERIENCE SCALE
Nineteen items appeared to load clearly on Factor 1 which accounted for 52.12%
of the variance. Three items loaded clearly on Factor 2 which accounted for 5.90% of the
variance. Four items loaded clearly on Factor 3 which accounted for 5.02% of the
variance. Four items were split between loading on Factor 1 and Factor 3 (see Table 7 for
factor loadings). However, upon closer examination, it appeared as though Factors 2 and
3 were spurious.
All three items loading on Factor 2 performed poorly in the item analyses,
demonstrating poor distribution characteristics (items 9 and 15) or irregular correlational
patterns (item 30). Discarding item 30, Factor 2 appears to be measuring professional
status, but factors defined by only two items are not considered reliable (Tabachnick &
Fidell, 2007; Zwick & Velicer, 1986). Similarly, the four items that loaded solely on
Factor 3 (items 1,4,6, 9) all demonstrated poor distribution characteristics. Further, the
items loading on Factor 3 did not seem to form a cogent theoretical grouping (even taking
into consideration those items with split loadings). Variables that are unrelated to the
general set of variables often load on later factors (Clark & Watson, 1995; Tabachnick &
Fidell, 2007). Further, such variables, accounting for little variance in the data, are
unreliable (Tabachnick & Fidell, 2007). Thus, I determined that Factor 2 and Factor 3
were likely unreliable due to the grouping of variables associated with them, and the
relatively small amount o f variance (5%) they each accounted for. As a result, I
determined that the Singing Experience Scale may in fact be a singular scale, not
comprised of five subscales as I had originally hypothesized.

70SINGING EXPERIENCE SCALE
Table 7
Exploratory Factor Analysis Pattern Matrix
Factor 1 Factor 2 Factor 3
1) I sing or hum a tune .03 .13 .642) I take singing lessons .56 .29 . 0 1
3) I use my whole body to sing .59 .18 .264) I enjoy singing .23 -.09 .725) I sing with a choir .93 -.16 - . 1 1
6 ) I sing every day . 1 0 . 1 1 .627) I am taught singing techniques .83 .15 -.068 ) Singing is exercise for me .77 . 1 0 .089) I dislike singing (R) -.06 -.07 .6810) I sing with others .82 -.07 .061 1 ) 1 sing for an hour or more at a time .81 .04 . 1 1
12) I get paid to sing .42 .75 - . 1 1
13) I express myself through singing .60 .09 .3314) I’ll only sing when I’m alone (R) .59 .09 -.0615) Singing is part of my job . 2 2 .68 - . 0 2
16) Singing is important to me .44 - . 0 2 .6017) I avoid singing (R) .40 - . 1 0 .3918) I sing in front of others .67 .16 .1619) Singing changes my breathing .64 -.17 . 2 0
20) Singing makes me uncomfortable (R) .44 . 1 1 .2421) Singing is part of who I am .59 .06 .4122) When I sing, I like to harmonize .78 -.07 .1623) I sing onstage .91 .17 -.0724) I breathe deeper to sing .70 -.19 . 2 1
25) I need to sing .45 .05 .5326) I prefer to sing with others .84 -.32 -.0827) I sing as part of a performance .91 .05 -.0728) I sing for two or more hours every week .73 . 0 2 .2329) I avoid singing in public (R) .60 .09 .1630) I am more comfortable singing in a group .35 -.50 -.17Note. Retaining three factors and applying oblique rotation. Highest loadings (per item) are in boldface, some items are slightly abbreviated.

71SINGING EXPERIENCE SCALE
Reliability analyses and the resultant scale. Based on the combination of item
analyses and factor analyses, I decided to discard items 1,4, 6 ,9 , 12, 15, 30 from the
Singing Experience Scale (SE) before continuing with the analyses (see Table 8 for the
resultant scale). These items both performed poorly and loaded on Factors 2 or 3, thus
potentially detracting from the reliability and structure of the SE. However, future
researchers using the SE may wish to include these items in their scale in order to
determine whether they replicate the patterns observed here. Items that loaded on both
Factor 1 and Factor 3 (items 16, 17, 21, 25) were retained, but it is interesting to note that
three of these items related to the meaning or significance of singing (items 16, 21, 25).
Reliability analyses were run on the set of 23 retained items in order to examine
scale reliability and determine whether any further items should be considered for
deletion (i.e., should they detract significantly from overall scale reliability; DeVellis,
2003)'°. Cronbach’s a = 0.97 for the new scale and the change with item deletion was no
greater than 0 .0 0 2 , insufficient to justify item deletion.
I decided to score the resultant 23-item Singing Experience Scale (SE) by
summing the items. Thus, the potential (and observed) range was 23 - 110, where 23
indicated low levels of singing experience and 1 1 0 indicated high singing experience.
The mean score for the whole sample fell into the middle of this range (M= 76.49, SD =
23.93) and the distribution did not display significant skew or kurtosis (skew = -0.45,
SAkew = 0.167; kurtosis = -1.05, SAurt= 0.332). Interestingly, a visual inspection of the
distribution suggested potential bimodality, indicating that it might be possible to create a
10 An EFA was also run on this set of 23 items in accordance with the recommendations of Worthington and Whittaker (2006) in order to ensure that the deletion of items did not alter the factor structure (it did not). Using parallel analysis criterion, only one reliable factor emerged.

72SINGING EXPERIENCE SCALE
meaningful dichotomous split of the sample, using the SE (however, this was not
appropriate for the current analyses; see general discussion).
Table 8
Singing Experience Scale Items Retained or Discarded for Scale Reliability and Validation Analyses
Items Retained2) I take singing lessons3) I use my whole body to sing5) I sing with a choir7) I am taught singing techniques8 ) Singing is exercise for me10) I sing with others1 1 ) 1 sing for an hour or more at a time13) I express myself through singing14) I’ll only sing when I’m alone (R)16) Singing is important to me17) I avoid singing (R)18) I sing in front of others19) Singing changes my breathing20) Singing makes me feel uncomfortable or embarrassed (R)21) Singing is part of who I am22) When I sing, I like to harmonize with others23) I sing onstage24) I breathe deeper to sing25) I need to sing26) I prefer to sing with others27) I sing as part of a performance28) I sing for two or more hours every week29) I avoid singing in public (R)
Items Discarded1) I sing or hum a tune4) I enjoy singing6 ) I sing every day9) I dislike singing (R)12) I get paid to sing15) Singing is part of my job30) I am more comfortable singing in a group than by myself
Note. (R) refers to items that are reverse-scored.

73SINGING EXPERIENCE SCALE
Demographic variables were also examined for potential relationships with the
Singing Experience Scale (SE). The SE did not demonstrate significant associations with
gender t (211) = 0.29, p > 0.05, ethnicity F (4, 208) = 1.18,/? > 0.05, education
(Spearman’s rho = 0.1 \ ,p > 0.05), or income (Spearman’s rho = 0.12,/? > 0.05).
However, the SE did demonstrate a significant correlation with age (r = 0.37,/? < 0 .0 1 ).
Relationships between the SE and other variables were considered during the process of
scale validation.
Scale validation. The validity of the 23-item Singing Experience Scale (SE) was
evaluated using known-group validation and examination of its relationship to other
variables.
Descriptive statistics. The known groups differed on age t (211) = - 3.22, p <
0.05; confirmed by non-parametric test U,p< 0.05), with choir members demonstrating
a slightly higher average age (general population Mage = 42.76, SD = 15.92; choir
members Mage = 50.77, SD = 16.13). The groups were quite similar with respect to
gender, the highest level of education completed, household income, and ethnicity (a
description of these demographic characteristics can be found in Table 9).
Validation measures were also examined for group differences (see Table 10 for
descriptive statistics). Only Perceived Singer Status (PSS) demonstrated a significant
difference across groups, with choir members (M — 4.79, SD = 0.41) reporting
significantly higher agreement with the statement “I am a singer” than the general
population (M= 3.37, SD = 1.44), t (205) = -11.09, p < 0.01 (Levene’s test indicated
unequal variances F= 104.64, p <0.01, so degrees of freedom were adjusted from 211 to
205). Due to non-normality of the PSS variable distribution within groups, the difference

74SINGING EXPERIENCE SCALE
Table 9
Frequencies o f Demographic Variables for Total Sample and Known Groups.
Total Sample General Population Choir MembersN % N % N %
GenderMale 61 28.6 45 28.7 16 28.6Female 152 71.4 1 1 2 71.3 40 71.4
EducationHigh School 2 2 10.3 13 8.3 9 16.1College 37 17.4 32 20.4 5 8.9Undergraduate degree 84 39.4 60 38.2 24 42.9Graduate degree 70 32.9 52 33.1 18 32.1
Household Income0 - $24,999 23 1 0 . 8 2 0 12.7 3 5.4$25,000 - $49,999 26 1 2 . 2 19 1 2 . 1 7 12.5$50,000-$74,999 37 17.4 29 18.5 8 14.3$75,000 - $99,999 33 15.5 24 15.3 9 16.1$100,000-$124,999 28 13.1 19 1 2 . 1 9 16.1$125,000 - $149,999 28 13.1 2 1 13.4 7 12.5$150,000-$174,999 1 2 5.6 9 5.7 3 5.4$175,000-$199,999 9 4.2 3 1.9 6 10.7$200,000 - $224,999 7 3.3 4 2.5 3 5.4$225,000 - $249,999 1 0.5 0 0 1 1 . 8
$250,000 or more 9 4.2 9 5.7 0 0
EthnicityCaucasian 193 90.6 144 91.7 49 87.5African 1 0.5 1 0 . 6 0 0
Asian 7 3.3 4 2.5 3 5.4Middle Eastern 2 0.9 2 1.3 0 0
Other 1 0 4.7 6 3.8 4 7.1Note. % refers to the percentage accounted for within each sample.
was confirmed using the non-parametric Mann-Whitney U test U= 1820,/? < 0.01. This
observation is consistent with the expectation that choir members would be more likely to
consider themselves singers than members o f the general population. PSS also correlated
significantly with self-rated health (r = 0.14,/? < 0.05) and the Accident Control subscale
of the Health Behavior Checklist (r = 0.14,/? < 0.05), but not with any other health

75SINGING EXPERIENCE SCALE
behavior or well-being measures". Correlations between health and well-being validation
scales reflected expected strengths and directions (e.g., PA and NA were negatively
correlated, Watson et al., 1988; health behavior subscales demonstrated relationships
similar to those observed by Vickers et al., 1990; see Appendix J).
Table 10
Descriptive Statistics for Validation Measures Across Total Sample and Known Groups.
Total Sample General Population Choir Members{n =213) (n =157) (n =56)
Measure_________M (SD)______________M (SD)______________ M (SD)PSS 3.74 (1.40) 3.37* *(1.44) 4.79*!“(0.41)PA 36.98 (6.04) 37.21 (6.06) 36.05 (5.93)NA 18.48 (5.88) 18.50 (5.77) 18.45 (6 .2 2 )VS 4.98 (1.17) 4.99 ( 1 .2 2 ) 4.95 ( 1 .0 1 )FS 48.29 (6 .6 8 ) 48.52 (6.25) 48.29 (4.51)SRH 5.36 (0.92) 5.32 (0.92) 5.48 (0.93)HBC-WB 3.50 (0.62) 3.49 (0.61) 3.54 (0.64)HBC-AC 3.19 (0.69) 3.20 (0.70) 3.19 (0 .6 8 )HBC-TR 2.57 (0.71) 2.57 (0.73) 2.59 (0.67)HBC-SR 2.53 (0.57) 2.53 (0.58) 2.50 (0.52)Note. PSS= Perceived Singer Status, PA = Positive Affect, NA = Negative Affect, VS = Vitality Scale, FS = Flourishing Scale, SRH = Self-rated Health, HBC-WB = Wellness Behavior Subscale of the Health Behavior Checklist, HBC-AC = Accident Control Subscale of the Health Behavior Checklist, HBC-TR = Traffic Risk Subscale of the Health Behavior Checklist, HBC-SR = Substance Risk Subscale of the Health Behavior Checklist, ** means are significantly different at/? < .01.
Known groups. The means of the known groups (general population vs. choir
members) on the Singing Experience Scale (SE) were examined. As expected, choir
members exhibited higher scores on the SE (M = 95.41, SD = 8.66) than members o f the
general population (M = 69.75, SD = 24.03) with a mean difference of 25.67. This
difference was significant, t (211) = -11.46,/; < 0.01; although Levene’s test for Equality
of Variances was significant F (211, 2) = 71.47, p < 0.01, the degrees of freedom did not
11 Note, however, that the correlation between perceived singer status and self-rated health may be unreliable as these were both single-item measures.

76SINGING EXPERIENCE SCALE
change. The result was confirmed with a non-parametric Mann-Whitney U test (U =
1680.5,p < 0.01). This supported hypothesis number two and suggested that the SE has
some validity for differentiating between groups on the basis of singing experience.
Perceived singer status. The relationship between the Singing Experience Scale
(SE) and perceived singer status (PSS) was examined using correlational analysis for the
total sample as well as for each known group. As expected, the SE showed a significant
positive relationship with PSS in all groups (p < 0.01), indicating that the SE has
construct validity with respect to perceived singer status. However, it is worth noting that
the magnitude of the correlation within the choir members group was significantly
smaller (r choir= 036, p < 0.01) than the correlations within the general population (r oen
Pop = 0.84, p < 0.01) or total sample (r tot - 0.86,/? < 0.01). This may have been due to the
limited range of scores on perceived singer status within the choir member group.
Health. Correlations between the Singing Experience Scale (SE) and self-rated
health (SRH), as well as each of the Health Behavior Checklist subscales (Wellness
Behaviors - HBC-WB; Accident Control - HBC-AC; Traffic Risk - HBC-TR; Substance
Risk - HBC-SR) were calculated for the total sample as well as each known group.
Examination of bivariate plots for the assumption of linearity suggested that the
correlations observed within the choir members group may be more reliable as those plots
demonstrated clearer evidence of a linear relationship between the SE and each health
variable. Exploratory moderated regressions were also run for each health variable to: a)
determine whether SE was related to each health variable when age, gender, and income
were controlled for (recall, relationships between these demographics and health have
been previously demonstrated, e.g., Dunn et al., 2006; Denton et al., 2004; Prus, 2011),

77SINGING EXPERIENCE SCALE
and b) examine a possible interaction between SE and known group. A Bonferroni-
reduced significance level of p = 0 . 0 1 was used for the regression analyses in order to
adjust for running multiple regressions with similar dependent variables.
Self-rated health. The SE demonstrated no significant correlations with self-rated
health in any group (see Table 11). Similarly, none of the regression analyses for SRH
were significant (see Table 12a). The homogeneity of error variance assumption was not
violated for this moderation analysis, as the error ratio (1:1.04) fell below DeShon and
Alexander’s rule of thumb (1:1.5 maximum) and Bartlett’s test was non-significant (M =
0.03, p > 0.05; Aguinis, Petersen, & Pierce, 1999). These results suggests that singing
experience is unrelated to health, but the single-item global measure of health may have
been too broad to capture any effect. More specific measures of health may be needed to
examine whether singing experience may relate to certain aspects of physical health (e.g.,
breathing; see general discussion).
Health behaviors. The HBC-WB exhibited significant positive correlations with
SE in all groups and the HBC-SR demonstrated significant negative correlations with SE
in all groups (see Table 11). Further, the magnitude of these correlations were larger in
the choir member group. These patterns were consistent with previous research
suggesting that singers may be more likely to practice healthy behaviors and avoid
alcohol (Kenny, Davis & Oates, 2004). The significant positive correlations between SE
and HBC-AC, as well as the significant negative correlations between SE and HBC-TR,
were unexpected. Novel findings, these correlations would seem to suggest a potential
relationship between singing experience and risk management (see general discussion).
None of the Step 2 or Step 3 regression analyses for the Health Behavior Subscales

78SINGING EXPERIENCE SCALE
revealed a significant R Square Change value at the p = 0.01 level (see Tables 12a and
12b). However, the R Square Change value for the regression of HBC-AC was significant
at thep = 0.05 level (AR2 = 0.03,/? =0.03; see Table 12a). No moderation analyses were
even marginally significant. The homogeneity of error variance assumption was not
violated for these moderation analyses, as the error ratios (1:1.05-1.33) fell below
DeShon and Alexander’s rule of thumb (1:1.5 maximum) and Bartlett’s tests were non
significant (Mwb = 0.05; Mac - 0.15; M tr = 0.60; Msr = 1.56, all p > 0.05; Aguinis et al.,
1999). Thus, the correlational analyses with health behaviors appeared to support the
construct validity of the SE, but the regression analyses suggested that singing experience
may retain little or no association with health behavior once age, gender and income are
accounted for (see general discussion).
Table 11
Pearson Correlations Between Singing Experience Scale and Health and Well-being Validation Measures
SETotal Sample in = 213)
General Population (« = 157)
Choir Members {n = 56)
HealthSelf-Rated Health .13 .13 -.05HBC-WB .18** .18* .28*HBC-AC .2 1 ** .25** .30*HBC-TR -.14* -.17* -.18HBC-SR -.17* -.17* -.30*
Well-beingPositive Affect .18* .24** .46**Negative Affect -.13 -.17* -.07Vitality Scale .15* .17* .37**Flourishing Scale .09 .09 .40**
Note. HBC-WB = Wellness Behavior Subscale of the Health Behavior Checklist, HBC- AC = Accident Control Subscale of the Health Behavior Checklist, HBC-TR = Traffic Risk Subscale of the Health Behavior Checklist, HBC-SR = Substance Risk Subscale of the Health Behavior Checklist. *p < .05 (2-tailed). **p < .01 (2-tailed)
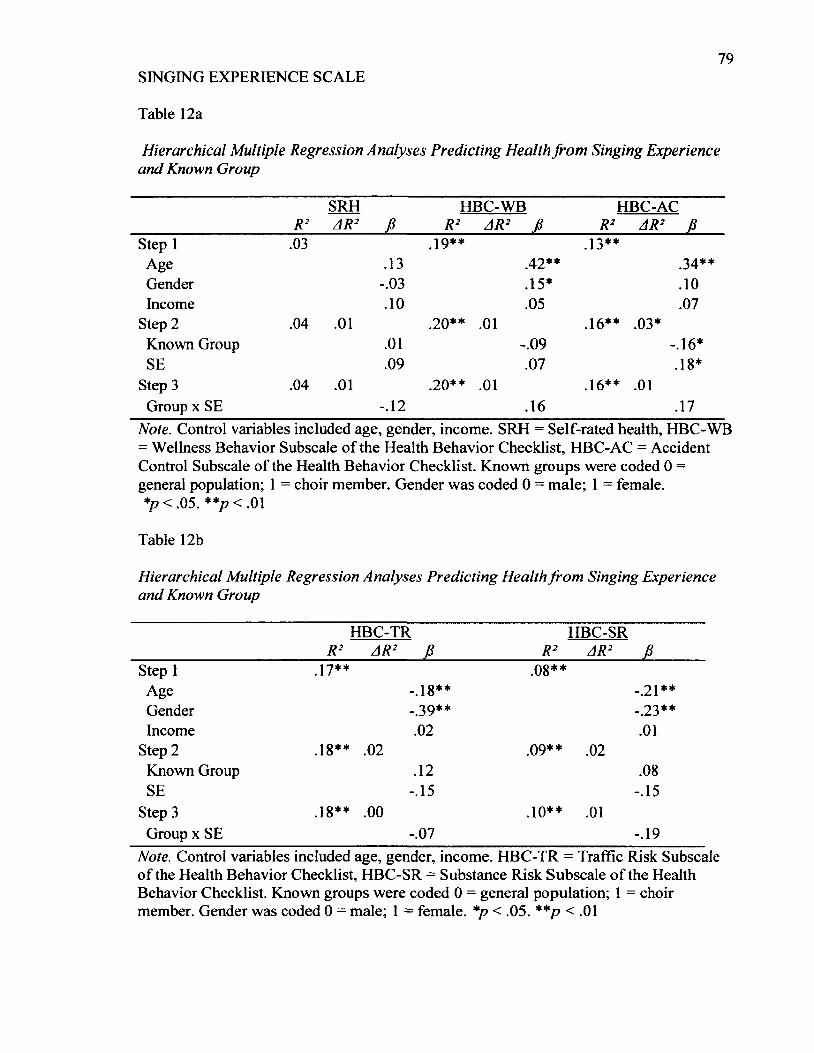
79SINGING EXPERIENCE SCALE
Table 12a
Hierarchical Multiple Regression Analyses Predicting Health from Singing Experience and Known Group
R2SRHAR2 f i
HBC-WBR2 AR2 f i
HBC-AC R2 AR2 f i
Step 1 .03 19** .13**Age .13 .42** .34**Gender -.03 .15* . 1 0
Income . 1 0 .05 .07Step 2 .04 . 0 1 .2 0 ** . 0 1 .16** .03*Known Group . 0 1 i o so -.16*SE .09 .07 .18*
Step 3 .04 . 0 1 .2 0 ** . 0 1 .16** . 0 1
Group x SE - . 1 2 .16 .17Note. Control variables included age, gender, income. SRH = Self-rated health, HBC-WB = Wellness Behavior Subscale of the Health Behavior Checklist, HBC-AC = Accident Control Subscale of the Health Behavior Checklist. Known groups were coded 0 = general population; 1 = choir member. Gender was coded 0 = male; 1 = female.*p < .05. **p < .01
Table 12b
Hierarchical Multiple Regression Analyses Predicting Health from Singing Experience and Known Group
HBC-TR HBC-SRR2 AR2 f i R2 AR2 f i
Step 1 17** .08**Age l 0
0 * * -.2 1 **Gender _ 3 9 ** -.23**Income . 0 2 . 0 1
Step 2 .18** . 0 2 Q9** . 0 2
Known Group . 1 2 .08SE -.15 -.15
Step 3 .18** . 0 0 .1 0 ** . 0 1
Group x SE -.07 -.19Note. Control variables included age, gender, income. HBC-TR = Traffic Risk Subscale of the Health Behavior Checklist, HBC-SR = Substance Risk Subscale of the Health Behavior Checklist. Known groups were coded 0 = general population; 1 = choir member. Gender was coded 0 - male; 1 = female. *p < .05. **p < .01

80SINGING EXPERIENCE SCALE
Well-being. Correlations between the Singing Experience Scale (SE) and each
well-being measure were calculated for the total group as well as for the general
population and choir members. Examination of bivariate plots for the assumption of
linearity suggested that the correlations observed within the choir members group may be
more reliable as those plots demonstrated clearer evidence of a linear relationship
between the SE and each well-being variable. Exploratory moderated regressions were
also run for each well-being variable to: a) determine whether SE was related to each
health variable when age, gender, and income were controlled for (recall, relationships
between these demographics and well-being have been previously demonstrated, e.g.,
Mahan & Estes, 2012; Mentzakis & Moro, 2009; Nolen-Hoeksema & Rusting, 1999),
and b) examine a possible interaction between SE and known group. Similar to the health
measure regressions, a Bonferroni-reduced significance level ofp = 0.01 was used.
Positive affect. Positive affect (PA) demonstrated significant positive correlations
with the SE in all groups, although the magnitude of this relationship was substantially
larger in choir members (see Table 11). The regression analyses revealed that SE did
contribute significantly to the prediction of PA beyond control variables (AR2 = 0.06, p <
0.01), such that PA and SE increased together (SE fi - 0.25, p < 0.01), though the effect
size of this association was relatively small ( f 2= 0.06; Cohen, 1992). Moderation
analyses confirmed that the relationship between SE and PA differed between known
groups, as the addition of the interaction term Group x SE was significant (AR2 = 0.03; p
< 0.01; see Table 13). Although the homogeneity of error variance assumption was not
violated, suggesting that the moderation analysis was reliable (error variance ratio 1:1.24;
Bartlett’s test M = 0.94, p > 0.05; Aguinis et al., 1999), the effect size of the moderation

81SINGING EXPERIENCE SCALE
was small ( f 2= 0.03; Cohen, 1992). A simple slopes analysis confirmed that the slope for
each group was significantly different from zero, t Gen Pop (150) = 27, p < 0.01; t choir (49)
- 8.39, p < 0.01, but as can be seen in Figure 1, the relationship between SE and PA was
much stronger for choir members. This differential relationship could be due to choir
membership or to singer status (recall, choir members scored higher on the PSS, a
measure of singer status). Further study is needed with comparisons to known non-singer
groups to test whether choir membership or singer status may be responsible for the
differential relationship between singing experience and positive affect observed here.
40
Gen Pop
™ C h o i r
High SELow SE
Figure 1. Simple slope graph of two-way interaction between known groups and singing
experience for positive affect. Low SE and High SE were defined as 1 SD below and 1 SD
above the mean on the Singing Experience Scale.
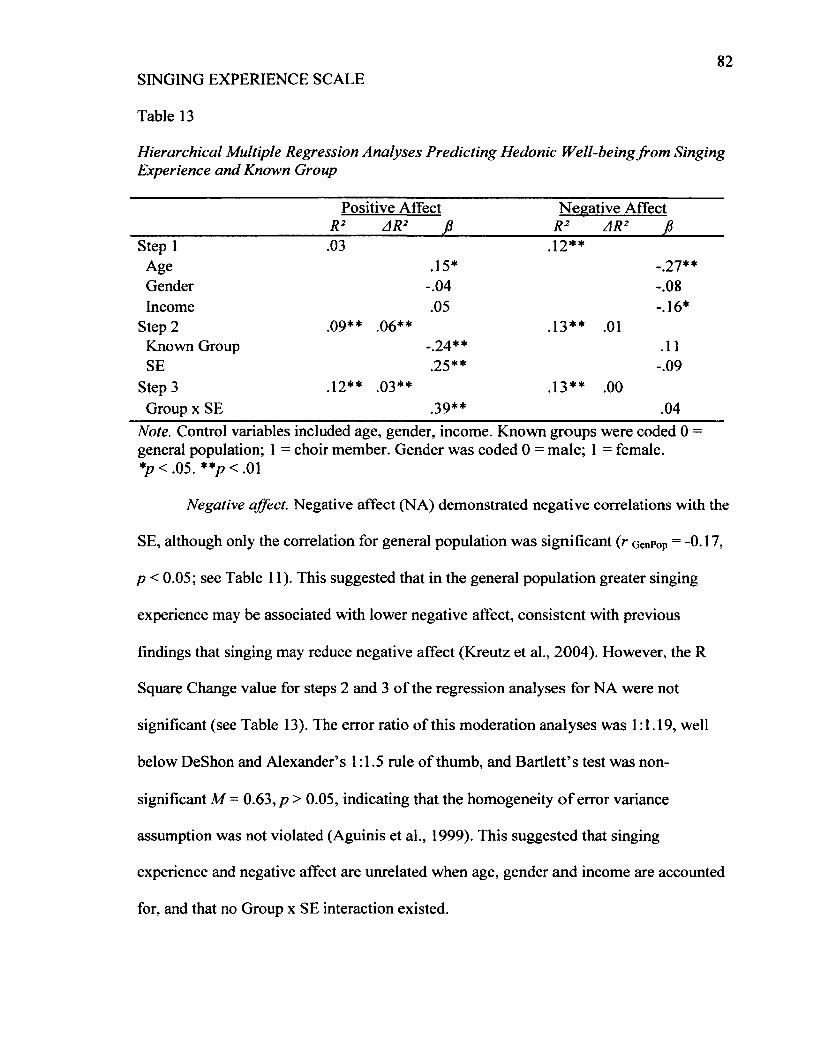
82SINGING EXPERIENCE SCALE
Table 13
Hierarchical Multiple Regression Analyses Predicting Hedonic Well-being from Singing Experience and Known Group
Positive Affect Negative AffectR2 AR2 f i R2 AR2 f i
Step 1 .03 .1 2 **Age .15* -.27**Gender -.04 1 o 0
0
Income .05 -.16*Step 2 09** .06** .13** . 0 1
Known Group -.24** . 1 1
SE .25** -.09Step 3 1 2 ** 03** .13** . 0 0
Group x SE .39** .04Note. Control variables included age, gender, income. Known groups were coded 0 = general population; 1 = choir member. Gender was coded 0 = male; 1 = female.*p < .05. * * p < m
Negative affect. Negative affect (NA) demonstrated negative correlations with the
SE, although only the correlation for general population was significant (r GenPop = -0.17,
p < 0.05; see Table 11). This suggested that in the general population greater singing
experience may be associated with lower negative affect, consistent with previous
findings that singing may reduce negative affect (Kreutz et al., 2004). However, the R
Square Change value for steps 2 and 3 of the regression analyses for NA were not
significant (see Table 13). The error ratio of this moderation analyses was 1:1.19, well
below DeShon and Alexander’s 1:1.5 rule of thumb, and Bartlett’s test was non
significant M = 0.63, p > 0.05, indicating that the homogeneity o f error variance
assumption was not violated (Aguinis et al., 1999). This suggested that singing
experience and negative affect are unrelated when age, gender and income are accounted
for, and that no Group x SE interaction existed.

83SINGING EXPERIENCE SCALE
Vitality. The Vitality Scale (VS) was significantly positively correlated with the
SE in all groups (see Table 11), indicating that greater singing experience was associated
with greater levels of vitality. However, the magnitude of the correlation within the choir
members group was larger (r choir= 0.37, p < 0.01) than the correlations within the
general population (r GenPop = 0.17,p < 0.05) or total sample (r Tot = 0.15,/? < 0.05),
suggesting a potential interaction between SE and known group. The R Square Change
value for steps 2 and 3 of the regression analyses for VS were not significant (see Table
14), indicating that singing experience and vitality were not significantly related after
controlling for age, gender and income and that no Group x SE interaction existed.
However, this moderation analyses may not have been reliable, as the error variance ratio
1:1.64 exceeded DeShon and Alexander’s rule of thumb (1:1.5 maximum), and Bartlett’s
test was significant M = 4.59, p < 0.05), indicating that the homogeneity of error variance
assumption was violated (see general discussion for further discussion; Aguinis et al.,
1999).
Flourishing. The Flourishing Scale (FS) was only significantly correlated with the
SE in the choir member group (r Choir = 0.40,/? < 0.01). This suggested that choir
members with high levels of singing experience were more likely to report high levels of
flourishing. This is consistent with previous research suggesting that choral singing may
be associated with this type of well-being (Busch & Gick, 2012). This relatively strong
relationship (compared to r Gen Pop = 0.09,/? > 0.05) also suggested a strong possibility of
a Group x SE interaction. None of the regression analyses, however, were significant at
the p = 0.01 level (see Table 14). Thus, singing experience was not significantly related
to flourishing after controlling for age, gender and income. It is worth noting that the R

84SINGING EXPERIENCE SCALE
Square Change for Step 3 of the analyses was almost significant at the p = 0.05 level (AR2
= 0.02, AF[\ , 206] = 3.67, p = 0.06) signaling a strong trend towards a significant Group
x SE interaction. However, this moderation analyses was likely unreliable due to clear
violation of the homogeneity of error variance assumption (Aguinis et al., 1999). The
error variance ratio 1:2.27 far exceeded DeShon and Alexander’s rule of thumb (1:1.5
maximum), and Bartlett’s test was highly significant M = 11.80, p < 0.01 (see general
discussion).
Table 14
Hierarchical Multiple Regression Analyses Predicting Eudaimonic Well-being from Singing Experience and Known Group
Vitality Scale Flourishing ScaleR2 AR2 fi____________ R2 AR2 f i
Step 1 .06** .04*Age .17* . 1 1
Gender . 1 1 .16*Income . 1 2 . 1 2
Step 2 .08** . 0 2 .05* . 0 1
Known Group -.14 - . 1 0
SE .17 . 1 1
Step 3 09** . 0 1 .07* . 0 2
Group x SE .26 .28Note. Control variables included age, gender, income. Known groups were coded 0 = general population; 1 = choir member. Gender was coded 0 = male; 1 = female.*p < .05. **p < .01
General Discussion
The goal of the present study was to develop a new scale measuring variation in
singing experience relevant to health and well-being outcomes with demonstrable
characteristics of validity and reliability. Previous research has suggested that singing
may be beneficial for physical health as well as for psychological and social well-being,

85SINGING EXPERIENCE SCALE
but the evidence is limited by methodological weaknesses and inconsistencies in the
definition and description of singer and non-singer populations (Clift et al., 2010; Gick,
2011). In the present study, a combination of literature review and focus group feedback
led to the development of a theoretical model based on the biopsychosocial model of
Engel (1977). Using this model, potential scale items were generated with the goal of
relating variation in singing experience to health and well-being outcomes. Expert
feedback was obtained to refine the theoretical model and potential items prior to testing
in the target population. Testing in the target population consisted of several analyses,
including examination of item characteristics, factor analysis, and construct validation
using health and well-being measures.
The resultant scale - the Singing Experience Scale (SE) — consisted of a singular
23-item scale model with high reliability (Cronbach’s a = 0.97; Tabachnick & Fidell,
2007) that may be scored by summing item responses. Although the scale was originally
hypothesized to consist of five subscales, the single factor model discovered may be
considered highly reliable due to the reliability of the exploratory factor analysis (EFA).
As Guadagnoli and Velicer (1988) note, moderate to high factor loadings (0.6 - 0.8)
facilitates reliable factor analysis results with smaller sample sizes (e.g., n less than or
equal to 150). The average loading observed on Factor 1 during the EFA was 0.55, close
to the moderate range, supporting the reliability of my factor model with n =213.
Further, the high Kaiser-Meyer Olkin value of the EFA (KMO = 0.93) indicated that,
despite having to delete many participants due to missing data, a sufficiently large sample
(n = 213) was retained for a highly reliable analysis (Field, 2009; Tabachnick & Fidell,
2009).

86SINGING EXPERIENCE SCALE
The validity of the Singing Experience Scale (SE) was substantiated at each stage
of this project. First and foremost, using the combination of literature review and focus
group feedback to develop the theoretical basis and items ensured that the SE had
relevance within the context of previous research as well as in the target population
(Clark & Watson, 1995; DeVellis, 2003; Gehlbach & Brinkworth, 2011). The content
validity of the SE was further enhanced by using feedback from several singing research
experts (n = 12) to refine the scale (DeVellis 2003; Gehlbach & Brinkworth, 2011;
Simms, 2008; Worthington & Whittaker, 2006). Finally, during large scale testing, the
construct validity of the SE was evaluated from several angles.
The Singing Experience Scale (SE) performed well on known groups validation,
demonstrating the expected pattern of higher scores amongst choir members than
amongst members of the general population. The SE also demonstrated a strong positive
correlation with perceived singer status, which is consistent with the idea that individuals
who consider themselves singers are likely to have more singing experience. Finally, the
SE demonstrated significant correlational relationships with several aspects of health and
well-being. Consistent with Kenny, Davis, and Oates’ (2004) findings relating singing
with health behaviors, the SE demonstrated significant relationships with measures of
health behavior in expected directions, correlating positively with wellness behaviors and
negatively with substance use. Similarly consistent with several studies relating singing
to increased positive mood (e.g., Busch & Gick, 2012; Clift & Hancox, 2001; Valentine
& Evans, 2001), the SE demonstrated a strong positive correlation with positive affect.
The SE also demonstrated a significant positive relationship with vitality, which has been
suggested in previous research (Busch & Gick, 2012). Further, the SE appears to be

87SINGING EXPERIENCE SCALE
making a contribution to the measurement of singing experience in relation to health and
well-being. Despite a strong correlation with perceived singer status (PSS), the SE
exhibited more (and stronger) correlational relationships with health and well-being
outcomes than did PSS. Altogether, these findings support the construct validity of the
SE (Clark & Watson, 1995; DeVellis, 2003).
One could argue that because the histogram of the Singing Experience Scale (SE)
suggested potential bimodality, singer vs. non-singer definitions are valid and the SE is
unnecessary. I would disagree. Even should further research with the SE reveal that the
bimodal pattern is replicable, the SE would remain a very valuable measurement tool. For
example, the SE could be used as a means to distinguish between singer vs. non-singer
populations; the continuous nature of the SE would reduce the risk of misclassification
error (Streiner, 2002) and increase stability in measurement over time. With the
dichotomous classifications used to date an individual could be classified as a singer
when they are truly a non-singer, and something as simple as joining a choir could alter
one’s position from non-singer to singer. The continuous nature o f the SE may also
permit researchers to: a) use larger and more varied populations of participants as they
would no longer be limited to those who clearly fit into either singer or non-singer
categories, and b) consider more nuanced relationships between singing experience and
other variables (e.g., curvilinear relationships). Further, the SE may facilitate
generalization across studies if researchers utilize this measure in place of the disparate
measures used to date to describe samples or define singer vs. non-singer populations.
Finally, as a multi-item measure of singing experience, the SE combines several aspects
of singing-related variation into a single score. This allows researchers to use this
88SINGING EXPERIENCE SCALE
variation in their analyses without worrying about the issue of multicollinearity that
including several different individual measures would cause (Tabachnick & Fidell, 2007).
Thus, the SE could facilitate measurement and testing of singing-related experience both
within and across varied populations.
For example, as the exploratory analyses carried out in Study 2 suggested, the
relationships between singing experience and well-being may differ between choir
members and the general population. Singing experience demonstrated a stronger positive
relationship with positive affect for choir members than for the general population (see
Figure 1). These findings are consistent with previous research indicating both perceived
and quantitative increases in mood associated with choral singing (Busch & Gick, 2012;
Clift & Hancox, 2001). However, these results are novel in that they suggest that choir
members could be deriving more benefit from singing than the general population.
Alternatively, as the causal direction of the relationship cannot be determined from the
present cross-sectional analyses, choir members could be more prone to singing when
experiencing positive moods than the general population. Either case represents a group
difference. Such a difference could stem from some unique relationship between choral
singing and positive affect (e.g., perhaps due to group membership), or it could be related
to the regularity of singing (i.e., weekly rehearsals) experienced by choir members.
Recall that Sapir et al. (1996) contrasted singers and non-singers on mood and found no
differences between groups, but Sapir et al. (1996) defined singers as voice majors, not
choir members. As my general population sample included a wide range of individuals
with respect to singing experience, it is difficult to determine what the cause of the choir
member vs. general population difference may be.

89SINGING EXPERIENCE SCALE
Similarly, flourishing exhibited a strong positive correlation with the SE but only
in the choir member group (see Table 11). This could reflect the social benefits of choral
singing, or suggest that choir members are more likely to experience purpose or meaning
in association with their singing experience than members of the general population. This
would be consistent with Busch & Gick’s (2012) finding that, among choir members,
singing is related to feelings of personal growth (a form of eudaimonic well-being).
However, the moderated regression for flourishing was only marginally significant and
may not be reliable due to low power (see limitations) and violation of the assumption of
homogeneity of error variance (Aguinis et al., 1999).
Limitations and Future Research
The exploratory regression analyses performed in Study 2 may have suffered from
low power, as determined by post-hoc analysis. Based on the findings from the regression
for positive affect, wherein the effect sizes for both the addition o f SE in Step 2 ( f 2=
0.06) and the moderation effect in Step 3 ( f 2= 0.03) were determined to be small, the
effect sizes in all other regressions might reasonably be expected to be similarly small.
Thus, given the number of predictors in Steps 2 and 3 of the hierarchical regression
equation, the sample size (n = 213) may have been too small to generate sufficient power
(P > 0.80; Cohen, 1992). A sample size three times that used here (minimum 600-700
participants) is usually required to reliably detect such small effects (Cohen, 1992). The
moderation analyses for vitality and flourishing were also likely unreliable due to
violations of the assumption of homogeneity of error variance, likely related to the large
difference in sample sizes for the known groups (general population n= 157; choir
members n = 56; Aguinis et al., 1999). Thus, larger sample sizes and equal distribution of

90SINGING EXPERIENCE SCALE
participants across group should be used for similar regression analyses in the future in
order to ensure reliable results. Despite these potential limitations, however, the
exploratory regression analyses strongly suggested that relevant demographic variables
should be considered (and perhaps controlled for) in future research in singing. This was
evidenced by the fact that most of the significant relationships (as measured by
correlations) between singing experience and the health and well-being measures became
non-significant once age, gender, and income were controlled for (in regression
analyses). These finding suggested that singing experience may not account for much - if
any - variation in health and well-being beyond demographic variables.
Initial research with the SE, however, should first and foremost include further
testing in order to confirm and improve the reliability and validity of the scale. The
exceptionally high Cronbach’s alpha (a = 0.97) obtained for the 23-item SE suggests that
the scale may be shortened (i.e., items deleted) without sacrificing reliability (DeVellis,
2003). Thus, future research might further evaluate the performance of highly related or
similar items in order to determine which items perform best and which could be deleted.
Further, Cronbach’s alpha is only one means of measuring scale reliability; the SE should
be evaluated on other forms of reliability (e.g., test-retest). Factor analyses should also be
repeated, ideally with all 30 items, to determine whether the factor loading pattern is
replicated in different samples (e.g., in different age groups, within and across
populations with varied singing experience). Factors that were discarded in the present
model could alternatively be kept and items revised in order to encourage the
development of subscales. Confirmatory factor analysis could also be employed to
determine whether or not the originally proposed subscales emerge from the SE. Future

91SINGING EXPERIENCE SCALE
researchers who choose to use the 23-item scale should consider asking participants about
whether or not they sing professionally, as all items measuring this important aspect of
singing experience were discarded from the 23 item SE.
Ultimately, there are many potential research avenues suggested by the present
study and for which the Singing Experience Scale (SE) may be a valuable tool. Although
the SE did not demonstrate a significant relationship with self-rated health, this does not
necessarily mean that singing experience is unrelated to health. Future researchers may
wish to employ more specific measures of health known to be related to singing that
could not be used in the present study (e.g., breathing measures or immune indicators).
Also, the scale validation analyses in Study 2 revealed significant correlational
relationships between singing experience and health behaviors in all groups, including the
general population. Previous evidence of a relationship between singing and health
behaviors had only been found among professional opera singers (Kenny, Davis, &
Oates, 2004). Further, the significant correlations between singing experience and
accident control as well as traffic risk subscales were novel findings. This suggests that
singing may be related to various types of health behaviors. As Kenny, Davis, and Oates
(2004) suggested, professional singers may practice more positive health behaviors in
order to maintain the health of their voices, but further research is necessary to explore
whether such a relationship exists for amateur singers. Alternative explanations for the
relationship between singing experience and health behavior found in the present study
could include an external variable that relates strongly to both singing and positive health
behaviors and / or the consideration of singing itself as a form o f health behavior. Further
92SINGING EXPERIENCE SCALE
research is required to determine the nature of the relationship between singing and health
behavior.
Future researchers may also wish to explore the differential relationships between
the Singing Experience Scale (SE) and well-being (i.e., positive affect and flourishing)
displayed by the known groups. Longitudinal studies using the SE to measure singing
experience and its relationships to health and well-being before and after singing
interventions may help to determine whether or not singing is beneficial, and whether this
effect would apply for everyone (i.e., whether the effect is influenced by initial levels of
singing experience). Singing experience may be related to increased health or well-being,
but perhaps this relationship only exists for individuals who choose to pursue singing in
the first place (e.g., choir members). Longitudinal designs would also better serve the
purpose of discovering the nature or direction of the relationships among singing, health,
and well-being.
Conclusion
The present study resulted in the development of a new scale - the Singing
Experience Scale (SE) - with demonstrable qualities of high internal consistency
reliability, as well as content and construct validity. This scale may contribute to future
research in singing, health and well-being by describing variation in singing experience
related to health and well-being outcomes and facilitating the measurement of such
variation in a consistent and statistically useful way.
SINGING EXPERIENCE SCALE
References
Aguinis, H., Petersen, S. A., & Pierce, C.A. (1999). Appraisal of the homogeneity of error
variance assumption and alternatives to multiple regression for estimating
moderating effects of categorical variables. Organizational Research Methods,
2(4), 315-339.
Bailey, B.A. & Davidson, J.W., (2002). Adaptive characteristics o f group singing:
perceptions from members of a choir for homeless men. Musicae Scientiae, 6,
221-256.
Bailey, B.A., & Davidson, J.W. (2003) Amateur group singing as a therapeutic agent.
Nordic Journal o f Music Therapy, 12, 18-32.
Bailey, B.A. & Davidson, J. W. (2005). Effects of group singing and performance for
marginalized and middle-class singers. Psychology o f Music, 33, 269-303.
DOI: 10.11770/0305735605053734.
Bannan, N. & Montgomery-Smith, C. (2008). ‘Singing for the brain’: Reflections on the
human capacity for music arising from a pilot study of group singing. Journal o f
the Royal Society for the Promotion o f Health, 128(2), 73- 78.
DOL10.1177/1466424007087807
Beck, R.J., Cesario, T.C., Yousefi, A., & Enamoto, H. (2000). Choral singing,
performance perception, and immune system change in salivary immunoglobulin
A and cortisol. Music Perception, 18, 87-106. Retrieved from
http://repositories.cdlib.org/clta/teaching/20000315RB
Beck, R., J., Gottfried, T.L., Hall, D.J., Cisler, C.A., & Bozeman, K.W. (2006).

94SINGING EXPERIENCE SCALE
Supporting the health of college solo singers: the relationship of positive emotions
and stress to changes in salivary IgA and cortisol during singing, Journal for
Learning through the Arts: A Research Journal on Arts Integration in Schools
and Communities, 2(1), Article 19. Retrieved from
http://repositories.cdlib.org/clta/lta/vol2/issl/artl9
Benassi-Wercke, M.E., Queiroz, M., Araujo, R.S., Bueno, O.F.A., & Oliveira, M.G.M.
(2012). Musicians’ working memory for tones, words, and pseudowords. The
Quarterly Journal o f Experimental Psychology, 65, 1161-1171.
DOI: 10.1080/17470218.2011.644799.
Bonilha, A.G., Onoffe, F., Vieira, M.L., Prado, M.Y.A., & Martinez, J.A.B. (2009).
Effects of singing classes on pulmonary function and quality of life of COPD
patients. International Journal o f COPD, 4, 1-8. Retrieved from:
http://www.dovepress.com/effects-of-singing-classes-on-pulmonary-function-
and-quality-of-life-o-peer-reviewed-article-COPD
Booth-Kewley, S. & Vickers, R.R. (1994). Associations between major domains of
personality and health behaviors. Journal o f Personality, <52(3), 281-298.
DOLlO.l 111/j. 1467-6494.1994.tb00298
Broomhead, P., Skidmore, J.B., Eggett, D.L., Mills, M.M. (2012). The effects of a
positive mindset trigger word pre-performance routine on the expressive
performance of junior high age singers. Journal o f Research in Music Education,
60, 62-80. DOLlO.l 177/0022429411435363.
Busch, S. & Gick, M. (2012). A Quantitative Study of Choral Singing and Psychological
Well being. Canadian Journal o f Music Therapy 18,45-61.

SINGING EXPERIENCE SCALE
Chong, H.J. (2010). Do we all enjoy singing? A content analysis o f non-vocalists’
attitudes towards singing. The Arts in Psychotherapy, 37, 120-124.
DOI: 10.1016/j .aip.2010.01.001
Clark, L.A. & Watson, D. (1995). Constructing validity: Basic issues in objective scale
development. Psychological Assessment, 1, 309-319.
Clift, S.M., & Hancox, G. (2001). The perceived benefits of singing: findings from
preliminary surveys of a university college choral society. The Journal o f the
Royal Society for the Promotion o f Health, 121(4), 248-256.
DOI: 10.1177/146642400112100409
Clift, S., Hancox, G., Morrison, I, Hess, B., Kreutz, G, & Stewart, D. (2007). Choral
singing and psychological wellbeing: Findings from English choirs in a cross
national survey using the WHOQOL-BREF. Proceedigs o f the International
Symposium on Performance Science, 201-207. Utrecht, The Netherlands
European Association of Conservatoires (AEC). Retrieved from:
http://www.performancescience.org/ISPS/ISPS2007/Proceedings
Clift, S., Hancox, G., Morrison, I., Hess, B., Kreutz, G, & Stewart, D. (2009). What do
singers say about the effects of choral singing on physical health? Findings from a
survey of choristers in Australia, England, and Germany. In: Louhivuori, J.,
Eerola, T., Saarikallio, S., Himberg, T. and Eerola, P-S. (Eds) Proceedings o f the
7 th Triennial Conference o f European Society for the Cognitive Sciences o f Music
(ESCOM 2009) Jyvaskyla, Finland
Clift, S., Nicol, J., Raisbeck, M., Whitmore, C., & Morrison, I. (2010). Group singing,
wellbeing and health: A systematic mapping of research evidence. The University

96SINGING EXPERIENCE SCALE
o f Melbourne Refereed E-Journal, 2, 1-25.
Cohen, J. (1992). A power primer. Psychological Bulletin, 112( 1), 155-159.
Cohen, M. (2009). Choral singing and prison inmates: influences o f performing in a
prison choir. The Journal o f Correctional Education, 60( 1), 52-65.
Denton, M., Prus, S. & Walters, V. (2004). Gender differences in health: A Canadian
study of the psychosocial, structural and behavioral determinants of health. Social
Science and Medicine, 58, 2585-2600. D01:10.1016/j.socscimed.2003.09.008.
DeVellis, R.F. (2003). Scale development: Theory and applications. Thousand Oaks,
California: Sage Publications, Inc.
Dunn, J.R., Veenstra, G. & Ross, N. (2006). Psychosocial and neo-material dimensions
of SES and health revisited: Predictors of self-rated health in a Canadian national
survey. Social Science and Medicine, 62, 1465-1473.
DOI: 10.1016/jsocscimed.2005.07.038.
Engel, G.L. (1977). The need for a new medical model: A challenge for biomedicine.
Science, 196, 129-136.
Engen, R. (2005) The singer’s breath: implications for treatment o f persons with
emphysema. Journal o f Music Therapy, 42(\), 20-48.
Eriksson, I., Unden, A., & Elofssen, S. (2001). Self-rated health: Comparisons between
three different measures: Results from a population study. International Journal
o f Epidemiology, 30, 326-333.
Fabrigar, L.R., Wegener, D.T., MacCallum, R.C., & Strahan, E.J. (1999). Evaluating the
use of exploratory factor analysis in psychological research. Psychological
Methods, 4(3), 272-299. DOI:1082-989X/99

97SINGING EXPERIENCE SCALE
Faulkner, R., & Davidson, J.W. (2006). Men in chorus: Collaboration and competition in
homo-social vocal behavior. Psychology o f Music, 34, 219-237.
Field, A. (2009). Discovering statistics using SPSS (3rd ed.). Los Angeles: Sage
Publications Limited.
Gehlbach, H. & Brinkworth, M.E. (2011). Measure twice, cut down error: A process for
enhancing the validity of survey scales. Review o f General Psychology, 15(4),
380-387. DOI: 10.1037/a0025704.
Gick, M.L. (2011). Singing, health and well-being: A health psychologist's review.
Psychomusicology, 21, 176-207.
Grape, C., Sandgren, M., Hansson, L.O, Ericson, M., Theorell, T. (2003). Does singing
Promote well-being?: An empirical study of professional and amateur singers
during a singing lesson. Integrative Physiological & Behavioral Science, 35(1),
65-74.
Grape, C., Theorell, T., Wikstrom, B. M., & Ekman, R. (2009). Choir singing and
fibrinogen, VEGF, cholecystokinin, and motilin in IBS patients. Medical
Hypothesis, 72, 223-225.
Guadagnoli, E. & Velicer, W.F. (1988). Relation of sample size to the stability of
component patterns. Psychological Bulletin, 103(2), 265-275. DOI: 0033-2909/88
Hillman, S. (2002). Participatory singing for older people: a perception of benefit. Health
Education, 102(4), 163- 171. DOLlO.l 108/09654280210434237
Kenny, D.T., Davis, P., & Oates, J. (2004). Music performance anxiety and occupational
stress amongst opera chorus artists and their relationship with state and trait
anxiety and perfectionism. Anxiety Disorders, 18, 757-777'.

SINGING EXPERIENCE SCALE
Kenny, D.T. & Faunce, G. (2004). The impact of group singing on mood, coping and
perceived pain in chronic pain patients attending a multidisciplinary pain clinic.
Journal o f Music Therapy, 41, 241-58.
Kreutz, G., Bongard, S. Rohrmann, S., Hodapp, V., & Grebe, D. (2004). Effects of choir
singing or listening on secretory immunoglobulin A, cortisol, and emotional state.
Journal o f Behavioral Medicine, 27, 623-635. DOI: 10.1007/s 10865-004-0006-9
Lally, E. (2009). ‘The power to heal us with a smile and a song’: Senior well-being,
music-based participatory arts and the value of qualitative evidence. Journal o f
Arts and Communities, 1, 25-44. DOI: 10.1386/jaac. 1.1.25/1
Lesta, B. & Petocz, P. (2006). Familiar group singing: addressing mood and social
behaviour of residents with dementia displaying sundowning. Australian Journal
o f Music Therapy, 17, 2-17.
Leveque, Y., Giovanni, A., & Schon, D. (2012). Pitch-matching in poor singers: Human
model advantage. Journal o f Voice, 26(3), 293-298.
DOI: 10.1016/j .j voice.2011.04.001.
Mentzakis, E. & Moro, M. (2009). The poor, the rich and the happy: Exploring the link
between income and subjective well-being. The Journal o f Socio-Economics, 38,
147-158. DOI: 10.1016/j.socec.2008.07.010.
Mahan, E.A. & Estes, D. (2012) Age-related differences in lay concepts of well-being
and experienced well-being. Journal o f Happiness Studies, 13, 79-101.
DOI: 10.1007/s 10902-011 -9251 -0.
Martin, P. & Bateson, P. (1993) Measuring behavior: An introductory guide. New York,
New York: Cambridge University Press.

99SINGING EXPERIENCE SCALE
Miiunpalo, S, Vuori, I., Oja, P., Pasanen, M., Urpoonen, H. (1997). Self-rated health
status as a health measure: The predictive value of self-reported health status on
the use of physician services and on mortality in the working-age population.
Journal o f Clinical Epidemiology, 50(5), 517-528.
Mitchell, P. A. (1991). Research note. Adult singers: The beginning stages of learning to
sing. Psychology o f Music, 19, 74-76. Retrieved from
http://joumals2.scholarsportal.info.proxy.library.carleton.ca/joumal.xqy?uri=/030
57356/vl9i0001/
Mizener, C.P. (1993). Attitudes of children toward singing and choir participation and
assessed singing skill. Journal o f Research in Music Education, 41, 233-245.
Moussard, A ., Bigand, E., Belleville, S. & Peretz, I. (2012). Music as an aid to learn new
verbal information in Alzheimer’s disease. Music Perception, 29, 521-531.
DOI:10.1525/MP.2012.29.5.521
Nolen-Hoeksema, S. & Rusting, C.L. (1999). Gender differences in well-being. In
Kahneman D., Diener, E., Shwarz, N. (Eds.) Well-being: The foundations o f
hedonic psychology. (330-350). New York: Russell Sage Foundation.
O’Connor, B. (2000). SPSS and SAS programs for determining the number of
components using parallel analysis and Velicer’s MAP test. Behavior Research
Methods Instruments, & Computers, 32(3), 396-402.
Pai, I., Lo, S., Wolf, D., & Kajieker, A. (2008). The effect of singing on snoring and
daytime somnolence. Sleep and Breathing, 12, 265-268.
DOI: 10.1007/s11325-007-0159-1
Petty, B.E. (2012). Health information-seeking behaviors among classically trained

100SINGING EXPERIENCE SCALE
singers. Journal o f Voice, 26, 330-335. D01:10.1016/j.jvoice.2011.05.009.
Phyland, D.J., Oates, J., & Greenwood, K.M. (1999). Self-reported voice problems
among three groups of professional singers. Journal o f Voice, 13, 602-611.
Retrieved from http://joumals2.scholarsportal.info.proxy.library.carleton.ca/
journal. xqy?uri=/08921997/v 13i0004/
Prakup, B. (2012). Acoustic measures of the voices of older singers and nonsingers.
Journal o f Voice, 26, 341-350. D01:10.1016/j/jvoice.2011.05.007.
Prus, S.G. (2011). Comparing social determinants of self-rated health across the United
States and Canada. Social Science and Medicine, 73, 50-59.
DOI: 10.1016/j .socscimed.2011.04.010.
Richards, H. & Durrant, C. (2003). To sing or not to sing: A study on the development of
‘non-singer’ in choral activity. Research Studies in Music Education, 20, 78-89.
Retrieved from http://joumalsl.scholarsportal.info.proxy.library.carleton.ca/
joumal.xqy?uri=/1321103X
Rust, J. & Golombok, S. (2009). Modern psychometrics: The science o f psychological
assessment (3rd ed). New York, New York: Routledge.
Ryan, R.M. & Deci, E.L. (2001). On happiness and human potential: A review of
research on hedonic and eudaimonic well-being. Annual Review o f Psychology,
42, 141-166. DOI -.0066-4308/01 /0201-0141
Sapir, S., Mathers-Schmidt, B., & Larson, G.W. (1996). Singers’ and non-singers’ vocal
health, vocal behaviors, and attitudes towards voice and singing: indirect findings
from a questionnaire. European Journal o f Disorders o f Communication, 31, 193-
209. DOI: 10.3109/13682829609042221

SINGING EXPERIENCE SCALE
Silber, L. (2005). Bars behind bars: the impact of a women’s prison choir on social
harmony. Music Education Research, 7, 251-271.
DOI: 10.1080/14613 800500169811
Simms, L.J. (2008). Classical and modem methods of psychological scale construction.
Social and Personality Psychology Compass, 2, 414-433.
DOI: 10.1111/j. 1751 -9004.2007.00044.x
Stacey, R., Brittain, K., & Kerr, S. (2002). Singing for health: An exploration of the
issues. Health Education, 102, 156-162. DOLlO.l 108/09654280210434228.
Streiner, D.L. (2002). Breaking up is hard to do: The heartbreak o f dichotomizing
continuous data. Research Methods in Psychiatry, 47 ,262-265.
Tabachnick, B.G., & Fidell, L.S. (2007). Using multivariate statistics (5th ed).
Boston:Pearson.
Unwin, M.M., Kenny, D.T. & Davis, P. J. (2002). The effects o f group singing on mood.
Psychology o f Music, 30, 175-185. DOLlO.l 177/0305735602302004
Valentine, E., & Evans, C. (2001). The effects of solo singing, choral singing and
swimming on mood and physiological indices. British Journal o f Medical
Psychology, 74, 115-120. Retrieved from http://www.bpsjoumals.co.uk/
Vickers, R.R., Conway, T.L., & Hervig, L.K. (1990). Demonstration of replicable
dimensions of health behaviors. Preventive Medicine, 19, 377-401.
Wakita, T., Ueshima, N., Noguchi, H. (2012). Psychological distance between categories
in the Likert scale: Comparing different numbers o f options. Educational and
Psychological Measurement, 72, 533-546. DOLlO.l 177/0013164411431162

102SINGING EXPERIENCE SCALE
Wendrich, F., Brauchle, G., & Staudinger, R. (2010). Controlled induction of negative
and positive emotions by means of group singing. Music and Medicine, 2, 144-
149. DOI: 10.1177/1954862110373548
Wilson, S.J., Abbott, D.F., Lusher, D., Gentle, E.C., & Jackson, G.D. (2010). Finding
your voice: A singing lesson from functional imaging. Human Brain Mapping,
32, 2115-2130. DOI: 10.1002/hbm.21173.
Wise, G.W., Hartmann, D.J., & Fisher, B.J. (1992). Exploration o f the relationship
between choral singing and successful aging. Psychological Reports, 70, 1175-
1183.
Worthington, R.L. & Whittaker, T.A. (2006) Scale development research: A content
analysis and recommendations for best practices. The Counseling Psychologist, 34
(6 ), 806-838. DOI: 10.1177/0011000006288127.
Zwick, W.R., & Velicer, W.F. (1986). Comparison of five rules for determining the
number of components to retain. Psychological Bulletin, 99(3), 432-442.
DOL0033-2909/86

103SINGING EXPERIENCE SCALE
Appendix A
Focus Group Responses
Imagine that you have a friend who you would feel comfortable calling 'a singer How would you describe this person?
MusicalConfident performingSings comfortably around othersGood at singingFeels happier singingLooks for opportunities to singBetter able to appreciate the finer things about other people’s talent Singing takes up a substantial proportion of his/ her time Good entertainer Committed to singing
- Puts the time aside to singIs easily reminded of particular songs Sings professionally (i.e. for money)Others appreciate when this person sings Enjoys singing for other people
- Sings at every opportunityWhat might distinguish this person from someone you would not call a singer?
Sings wellPuts more time into singing that someone else who may be good at it/ enjoy it Has singing-related goals/ ambitions
- Singing is more important to his/ her identity Is known for singing wellPuts more of a commitment into singingThis person may dedicate less time to other aspects of his/ her life in order to sing
- Defines him/herself as someone who singsSinging badly would be detrimental to his/ her self-esteem Seeks opportunities to sing
How would you describe this person?The person engages in singingThe person can carry a tune, sing in tune (although not necessarily perfectly)The person sings regularly or frequently (as opposed to a one-off)The person has done some singing in public although not necessarily as a performance - e.g., belongs to a choir or informal singing group, or a formal singing group; sings solo informally at parties, song circles, publicly, or in informal or formal performance Other people also agree that the person is a singer
What might distinguish this person from someone you would not call a singer?The singer engages in singing; the non-singer does not

104SINGING EXPERIENCE SCALE
The singer can carry a tune, sing in tune (although not necessarily perfectly); the nonsinger doesn’t sing in tuneThe singer sings regularly or frequently, while the non-singer does not The singer has done some singing in public although not necessarily as a performance - e.g., belongs to a choir or informal singing group, or a formal singing group; sings solo informally at parties, song circles, publicly, or in informal or formal performance; the non-singer has never done any of this but might sing only in the shower at home, for example, or only when others are not aroundOther people also agree that the singer is a singer and the non-singer is not
To describe my friend who is a singer I would call her versatile, friendly, intelligent, open-minded and perceptive.
She might be distinguished from non-singers as there are those who are less open to new experiences, as she has studied classical music in many languages and is always ready to accept a challenge. And another way she might be distinguished from non-singers is through being perceptive of the way things go together, not unlike harmonies in a chorus, but also generalized to other things such as concepts and situations.
I would describe “a singer” as something more than someone who sings or someone that is good at singing. For example, I would describe a singer as someone who has good tone and rhythm and who has performed in a formal setting (at a concert, in a band, in a choir). If someone had a great voice but only sings in the shower, I would consider them to be ‘“a good singer” but not “a singer”.
someone who has formal training in singing, has been 'invited' to sing and/or been paid to sing.
Someone who can carry a tune!
I wanted my write-in to be "They can perform before an audience with a song-or-venue- appropriate blend of technical skill and interpretive/emotive power" but that's too long for the write-in spot.
I play several instruments, some of them quite well (especially the short time I've been playing them), and I've a pretty grasp of music theory and have taught myself to read music.
Do I consider myself a musician, generally, or a violinist (my fave and best) specifically?
Hell no.
In my mind, to be considered a musician or singer, you have to be better at it, more committed to it, than the rest of us. Many if not most humans are capable of music, but

105SINGING EXPERIENCE SCALE
then again, many if not most humans are capable of science - but most are no more scientists than we are musicians/singers, even if we read scientific articles every day or play and study music every day.
I'm not saying you have to perform in front of audience, but you have to have that level of ability. That takes some talent and a lot work (or, for the very rare few, a lot of talent and a little practice).
It is that level of work, that level of commitment, that, for me, takes someone across the divide between musically-interested-or-inclined and musician/singer (as the case may be).
Perhaps we lack a general term for the great many of us who play or sing better and more often than the rest, but not often enough or with too little commitment to cross that divide.
Do note that I would consider someone a musician or singer no matter what their day job, what they do to get paid, if they have crossed that divide, if they are capable of a performance as described above. They would be a singer who happens to have multiple talents and another job.
The answers above are, I suppose, much more nailed down than my ethereal definition of a singer: one who feels that (s)he must sing. Like the difference between people who feel like they want to play music versus people who feel like they have to play music.
Always has a song in his / her heart which sometimes explodes into everyday life (endorsed by 2 1 )
Singing makes him / her feel better when they’ve had a bad day (endorsed by 16)
Hums a lot or sings quietly throughout the day (endorsed by 10)
They can perform before an audience (endorsed by 10)
Sings lines from songs when triggered by a word or phrase in daily conversation (endorsed by 8 )
Life is not complete unless they have chances to sing (endorsed by 5)
Sings along with the radio at least once a day (endorsed by 3)
Yodels in the morning (endorsed by 1)
How would you describe this person?Although many people like to sing, I wouldn't classify everyone who sings as a "singer". Even if someone has natural singing ability, if they lack passion as a singer then I

106SINGING EXPERIENCE SCALE
wouldn't really consider them to be a "true singer". I would describe this type of person as someone who has a passion for singing and more so, if they sing music that they created themselves.What might distinguish this person from someone you would not call a singer?What might distinguish this person from a non singer would be their passion and creative input vs. someone who sings just because they can.
Perhaps a 'singer' includes both training and the confidence to sing. If I were to imagine a friend that I would call a singer, I would imagine someone who had formal training. If a friend was confident in their ability to sing, however had no previous training, I would also consider them a singer. On the other hand, there may be someone who has been taking vocal lessons for many years but do not have confidence in their ability. I may be less likely to consider this person to be a 'singer'.
Whether with others or alone they start singing or happily humming a tune
She is not a trained singer, nor has she had formal music training, but somehow she has this natural ability to sing. She often sings when we drive together, or just randomly while we're walking. Usually, when she's singing in the car she's singing more loudly, and when she's in a more public setting she sings quieter, and doesn't sing an entire song, she just sings a verse or two (which makes me think she's singing the rest of the song in her head). Other times she sings in a more formal setting - at a friend's wedding, open mic night, that kind of thing. She has the most beautiful voice; her singing has actually brought me to tears in the past (of course it was a combination of her voice and the song, but still).What I think distinguishes her from someone I would not call a singer, is that she sounds amazing, and when you watch/listen to her, you can tell that she genuinely loves to sing - she sways while she sings, and often closes her eyes. Somehow, when she closes her eyes while singing, I feel as though mine are closed too and that everything around me just melts away, even though my eyes are wide open. She really gets into the song and it seems as though she's singing with so much emotion, she isn't just singing the lyrics. Her voice is very soothing and pleasant, whereas maybe someone who isn't a singer isn't all that lovely to listen to, and doesn't sing with a lot of emotion.
The answer:Pretty, smart, funny. Motherly. Musically inclined (has an ear for music not just singing).

SINGING EXPERIENCE SCALE
Appendix B
Proposed Subscales and Associated Items for the
Singing Experience Scale
* Note that (R) refers to items that would be reverse-scored.
Singing behavior1) I often sing or hum a tune2) I sing every chance I get3) I avoid singing (R)4) I sing at least a couple of hours per week5) I sing on a regular basis6 ) I can sing for hours at a time
Skill / professional / performance7) I have taken voice lessons8 ) I have received vocal training9) I have earned income from singing10) I have been paid to sing11) I've been told that I'm a good singer12) I can carry a tune when I sing13) I'm a good singer14) I have sung in front of others15) I have sung onstage16) I have sung as part of a performance17) I have been told that I shouldn’t sing (R)18) I avoid singing in public (R)
Physical experience19) I use my whole body to sing20) Singing is exercise for me21) I get physically involved when I'm singing22) Singing changes my breathing)23) I breathe deeper to sing24) I do breathing exercises when I sing
Psychological experience25) I enjoy singing26) I like to sing27) I dislike singing (R)28) I express myself through singing29) I feel that singing is important to me30) I feel that singing is a part of who I am31) I feel like I have to sing
Social experience32) I have sung with a choir
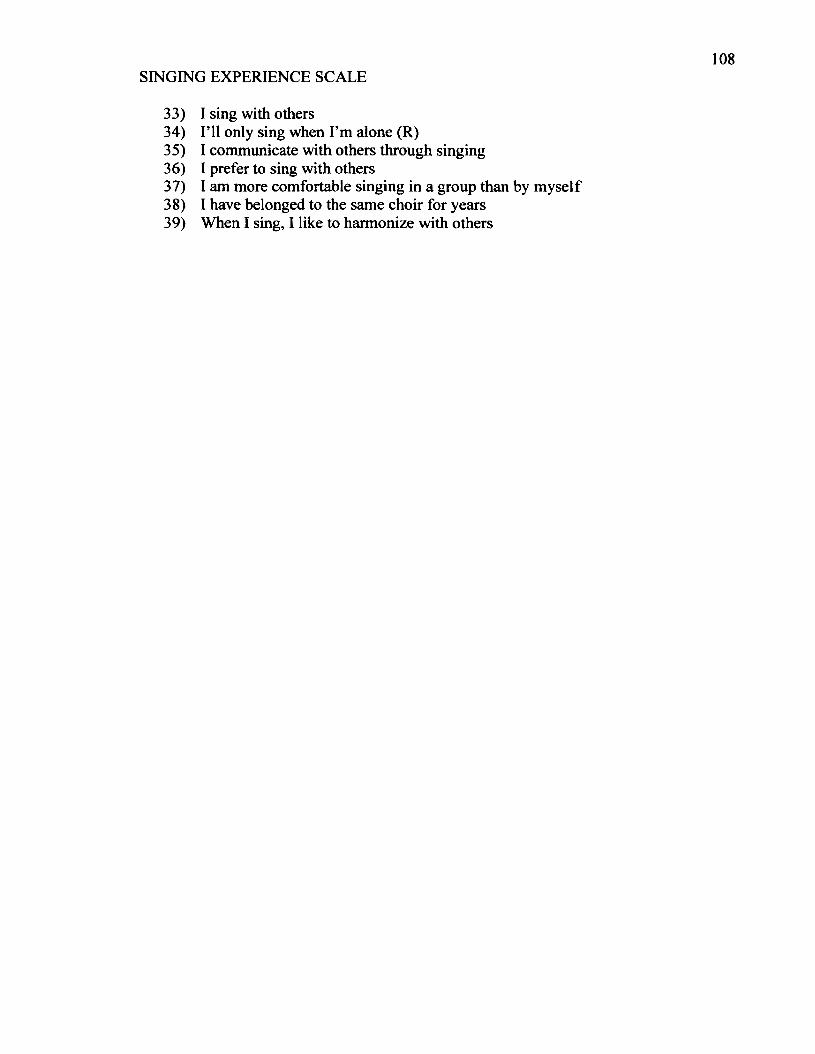
SINGING EXPERIENCE SCALE
33) I sing with others34) I’ll only sing when I’m alone (R)35) I communicate with others through singing36) I prefer to sing with others37) I am more comfortable singing in a group than by myself38) I have belonged to the same choir for years39) When I sing, I like to harmonize with others

SINGING EXPERIENCE SCALE
Appendix C
Study 1 - Expertise Questionnaire
Please indicate the nature of your involvement with singing research:
Researcher
_ Student researcher
- * Musician
K J Other (please list) u
Please rate your level of involvement with singing research:
W Singing research is a passing interest
Other (please list) t—1
Please indicate how long you have been involved in singing research:
' • ■ ■ J under 1 year
« ' 1-2 years
W 2-5 years
W 5 or more years
Other (please list)
Please indicate your primary area of expertise:
■ w Psychology
> Sociology
* \ J Education
W Music
Singing research is my primary area of interest
w ’ Singing research is one of several areas I'm interested in

SINGING EXPERIENCE SCALE110
Appendix D
Study 1 - Description of Theoretical Model Provided for Expert Feedback
I am in the process of developing a new questionnaire that will measure singing experience. I originally set out to define what it means to be a singer, but through literature review and focus group feedback, I have found that a singer is defined primarily by their singing experience. By singing experience I mean two things:1 ) how much and what kinds of singing they have done (training, performance, how often they sing, etc.); and2 ) the nature of their experience while singing (enjoyment, skill, etc.)Based on this, for my new measure, I have decided to measure individuals' singing experience from several different angles as a means of describing someone as a singer.
Singing may be considered a complex biological (e.g., involving physical process like breathing), psychological (e.g., affecting mood), and social activity (e.g., communication aspects). Thus, I am using the biopsychosocial model from health psychology (which suggests that health and well-being are the results of interactions between biological, psychological and social factors) to guide my scale development (see Gick, 2011 for a review and further discussion). Following from this model. I wish to include some additional aspects of the singing experience that may not be necessary to defining a singer, but are meaningful in the context of singing, health and well-being research.
My questionnaire (tentatively called the Singing Experience Scale) will measure several different aspects of singing experience. 1 expect that these aspects will emerge as subscales as I continue the development of my scale, and they are:1) Singing behaviour (e.g., how often one sings)2) Singing skill, professional status, and performance (e.g., whether one has vocal training, earns income from singing, sings publicly)3) Physical experience of singing (e.g., breathing changes, singing as exercise)4) Psychological experience of singing (e.g., enjoyment, attitudes towards singing)5) Social experience of singing (e.g.. choral / group singing involvement)
Each aspect will be measured using a series of questions and with a continuous response format (i.e.. Likert scale from 1 to 5). Future research may use the different aspects of this scale alone or in combination to describe singers and their experience in / of singing.
Do you have any comments or suggestions on this basis for the new measure?

I l lSINGING EXPERIENCE SCALE
Appendix E
Singing Experience Scale - Testing Version
You will now be asked about your experience with singing. These experiences may include formal experiences like in a choir or voice lessons, but we also wish to know about your experience singing in less formal situations such as karaoke or when you sing along with the radio or in the shower. Basically, in answering these questions, we want you to think about any and all kinds of singing you may do.
Please indicate how often you experience each of the following, using this scale:1 = Never 2 = Rarely 3 = Sometimes 4 = Often 5 = Always
1) I sing or hum a tune2) I take singing lessons3) I use my whole body to sing4) I enjoy singing5) I sing with a choir6 ) I sing every day7) I am taught singing techniques8 ) Singing is exercise for me9) I dislike singing (R)10) I sing with others1 1 ) 1 sing for an hour or more at a time12) I get paid to sing13) I express myself through singing14) I’ll only sing when I’m alone (R)15) Singing is part of my job16) Singing is important to me17) I avoid singing (R)18) I sing in front of others19) Singing changes my breathing20) Singing makes me feel uncomfortable or embarrassed (R)21) Singing is part of who I am22) When I sing, I like to harmonize with others23) I sing onstage24) I breathe deeper to sing25) I need to sing26) I prefer to sing with others27) I sing as part of a performance28) I sing for two or more hours every week29) I avoid singing in public (R)30) I am more comfortable singing in a group than by myself
* Note that (R) refers to reverse-score items.* Items here are mixed (in the order they were presented to participant)

SINGING EXPERIENCE SCALE112
Appendix F
Study 2 Measures
Demographic Variables
1) Please indicate your gender:O Male O Female
2) Please indicate your age (in years):
3) Please indicate the highest level of education you have completed:O Grade school O High school O CollegeO Undergraduate degree O Graduate degree
4) Please indicate your approximate household income (before taxes) per year:O 0 - $24,999 O $25,000-$49,999 O $50,000-$74,999 O $75,000 -$99,999 O $100,000-$124, 999 O $125,000-$149,999 O $150,000-$174,999 O $175,000-$199,999 O $200,000 - $224,999 O $225,000 - $249,999 O $250,000 or more
5) Please indicate your ethnicityO Caucasian O African O AsianO Middle Eastern O HispanicO Other (please specify)________________

SINGING EXPERIENCE SCALE
Perceived Singer Status
Please indicate your agreement with the following statement:
I am a singer
O Strongly Disagree O DisagreeO Neither Agree nor Disagree O AgreeO Strongly Agree
Self-Rated Health.
How would you rate your health?
1 2 3 4 5o o o o oVerypoor
6 7O O
Excellentcould not be better

114SINGING EXPERIENCE SCALE
Health Behaviour Checklist
Indicate your agreement with each statement using the following scale.
1 = Strongly Disagree2 = Disagree3 = Neither agree nor disagree4 = Agree5 = Strongly Agree
1. I eat a balanced diet.2. I get enough sleep.3. I keep emergency numbers near the phone.4. I choose my spare time activities to help me relax.5. I take chances when crossing the street, etc.6 . I have a first aid kit in my home.7. I destroy old or unused medicines.8 . I see a doctor for regular checkups.9. I pray or live by principles of religion.1 0 . 1 avoid getting chilled.1 1 . 1 watch my weight.12.1 carefully obey traffic rules so I won't have accidents.13.1 watch for possible signs of major health problems (e.g., cancer, □ hypertension,
heart disease).14.1 exercise to stay healthy.15.1 cross the street against the stop light.16.1 avoid high crime areas.17.1 don't smoke.18.1 don't take chemical substances which might injure my health (e.g. Dfood
additives, drugs, stimulants).19.1 check the condition of electrical appliances, the car, etc. to avoid □ accidents.20 .1 stay away from places where I might be exposed to germs.2 1 . 1 fix broken things around my home right away.2 2 . 1 see a dentist for regular checkups.23 .1 limit my intake of foods like coffee, sugar, fats, etc.24 .1 avoid over-the-counter medicines.25 .1 take vitamins.26 .1 do not drink alcohol.27 .1 wear a seat belt when in a car.28 .1 cross busy streets in the middle of the block.29 .1 avoid areas with high pollution.30 .1 discuss health with friends, neighbors, and relatives.31.1 gather information on things that affect my health by watching □ television and
reading books, newspapers, or magazine articles.32 .1 use dental floss regularly.33.1 speed while driving.

115SINGING EXPERIENCE SCALE
34.1 brush my teeth regularly.35 .1 take health food supplements (e.g. protein additives, wheat germ, Gibran,
lecithin).36 .1 learn first aid techniques.37 .1 get shots to prevent illness.38 .1 take more chances doing things than the average person.39 .1 drink after driving.40 .1 engage in activities or hobbies where accidents are possible (e.g. □ motorcycle
riding, skiing, using power tools, sky or skin diving, hang-gliding, etc.).

116SINGING EXPERIENCE SCALE
PAN AS
Directions
This scale consists of a number of words that describe different feelings and emotions. Read each item and then circle the appropriate answer next to that word. Indicate to what extent you feel this way in general.
Use the following scale to record your answers.
(1) = Very slightly (2) = A little (3) = Moderately (4) = Quite a bit (5) = Extremely or not at all
Very slightly or not at all A little
Moderately Quite a bitExtremely
t» Interested 1 2 3 4 ‘
2. Distressed 1 2 3 4 5
3. Excited 1 2 3 4 ^ 5
4. Upset 1 2 3 4 5
5. Strong ' 1 2 3 4 5
6. Guilty 1 2 3 4 5
7. Scared ' " ~ 1 2 3 4 ' '' 5
8 . Hostile 1 2 3 4 5
9. Enthusiastic I ' - % ■ - $ . ' ' 4 5
10. Proud 1 2 3 4 5
11* Itriteblc I 2 3 ' 4- , 5
12. Alert 1 2 3 4 5
13. Ashamed 1 2 3 4 5
14. Inspired 1 2 3 4 5
IS. Nervous 1 2 3 4 5
16. Determined 1 2 3 4 5
17. Attentive '' I 2 X ' . . 4 ^ , 518. Jittery 1 2 3 4 5
19. Ae$W '' ' • / " ' 4.7 v •2/ : ' . * * / , 4 - 5
20. Afraid l 2 3 4 5

117SINGING EXPERIENCE SCALE
Vitality Scale
Please respond to each of the following statements by indicating the degree to which the statement is true for you in general. Use the following scale:
1 2 3 4 5 6 7not at all somewhat
true true very true
1. I feel alive and vital. ___
2. Sometimes I feel so alive I just want to burst. __________
3. I have energy and spirit. __________
4. I look forward to each new day. __________
5. I nearly always feel alert and awake._____________ __________
6 . I feel energized. __________
Flourishing Scale
Below are eight statements with which you may agree or disagree. Using the 1-7 scale below, indicate your agreement with each item by indicating that response for each statement.
7. Strongly agree6 . Agree5. Slightly agree4. Mixed or neither agree nor disagree3. Slightly disagree2. Disagree 1. Strongly disagree
1 . 1 lead a purposeful and meaningful life
2. My social relationships are supportive and rewarding
3 .1 am engaged and interested in my daily activities
4 .1 actively contribute to the happiness and well-being of others
5 .1 am competent and capable in the activities that are important to me
6 . 1 am a good person and live a good life
7 .1 am optimistic about my future
8 . People respect me

SINGING EXPERIENCE SCALE118
Appendix G - Pearson Correlations between Singing Experience Scale Items by Item Number
1 2 3 4 5 6 7 8 9 10 11 12 13 14 15 16 17 18 19 20 21 22 23 24 25 26 27 28 292 .283 .45 .564 .56 .38 .555 .24 .48 .57 .486 .62 .33 .48 .58 .297 .33 .70 .62 .47 .71 .348 ,32 .62 .71 .50 .69 .39 .749 .39 .20 .33 .60 .16 .37 .24 .2810 .36 .43 .66 .55 .72 .42 .66 .65 .2611 .43 .54 .70 .56 .76 .45 .70 .73 .27 .7512 .26 .46 .46 .23 .24 .24 .48 .40 .09 .35 .4413 .49 .52 .67 .60 .60 .50 .65 .71 .31 .65 .68 .4214 .14 .31 .39 .30 .46 .20 .42 .40 .11 .48 .46 .27 .4115 .26 .33 .33 .17 .10 .31 .33 .29 .10 .24 .25 .73 .28 .2416 .56 .48 .68 .77 .57 .59 .61 .67 .49 .64 .68 .35 .76 .35 .2317 .31 .25 .44 .54 .46 .34 .40 .42 .45 .50 .53 .19 .50 .48 .08 .5618 .41 .44 .61 .56 .59 .45 .57 .62 .30 .74 .69 .47 .62 .55 .34 .60 .5219 .34 .45 .57 .50 .60 .40 .57 .63 .25 .60 .60 .22 .62 .35 10 .62 .40 .5220 .24 .33 .52 .49 .41 .31 .42 .48 .30 .45 .51 .31 .48 .50 .23 .52 .60 .52 .3121 .50 .51 .69 .67 .66 .55 .66 .72 .37 .64 .76 .41 .81 .44 .26 .81 .58 .65 .63 .5622 .40 .48 .61 .58 .71 .41 .67 .66 .33 .72 .77 .34 .67 .50 .22 .67 .58 .67 .64 .52 .7723 .38 .54 .67 .51 .75 .37 .75 .72 .20 .73 .80 .52 .68 .52 .34 .64 .51 .73 .57 .51 .71 .7724 .28 .44 .60 .53 .63 .36 .60 .66 .35 .64 .70 .27 .63 .35 .10 .65 .52 .55 .81 .44 .70 .72 .6325 .56 .43 .68 .68 .53 .55 .58 .65 .44 .64 .69 .38 .72 .37 .30 .79 .57 .62 .59 .49 .78 .66 .65 .6526 .19 .33 .47 .41 .65 .24 .58 .56 .18 .75 .59 .16 .51 .39 .09 .53 .44 .54 .57 .35 .51 .67 .62 .62 .5127 .34 .47 .60 .50 .76 .36 .72 .71 .18 .72 .78 .42 .68 .51 .28 .65 .46 .69 .59 .50 .70 .74 .89 .63 .62 .6428 .43 .51 .70 .57 .73 .57 .68 .73 .29 .74 .84 .38 .74 .45 ,25 .70 .55 .69 .64 .53 .80 .77 .74 .71 .71 .57 .7229 .27 .42 .54 .53 .53 .29 .54 .53 .33 .57 .56 .36 .50 .60 .25 .56 .63 .68 .41 .68 .56 .66 .64 .52 .56 .49 .58 .5730 -.05 -.05 .01 .09 .28 -.01 .15 .05 -.02 .24 .13 -.23 .05 .05 -.20 .07 .03 -.01 .18 -.06 .02 .16 .08 .20 01 .51 .17 09 .01Note. Items in bold were not significant. All ot ter correlations were significant at minimum (p < .05). Underlined items denote potential multicollinearity.

119SINGING EXPERIENCE SCALE
Appendix H
Principal Components Pattern Matrix Retaining Three Factors with Oblique Rotation
Factor 1 Factor 2 Factor 31 ) 1 sing or hum a tune .03 .15 .712) I take singing lessons .60 .33 -.033) I use my whole body to sing .63 .18 .254) I enjoy singing .29 -.09 .715) I sing with a choir .93 -.18 - . 1 2
6 ) I sing every day . 1 1 . 1 2 . 6 8
7) I am taught singing techniques .85 .14 -.078 ) Singing is exercise for me .80 . 1 0 .069) I dislike singing (R) -.08 -.09 .791 0 ) 1 sing with others .84 -.09 .051 1 ) 1 sing for an hour or more at a time .83 .03 . 1 0
12) I get paid to sing .44 .74 - . 1 1
13) I express myself through singing .64 .09 .3114) I’ll only sing when I’m alone (R) .65 . 1 0 -.1315) Singing is part of my job .24 .76 -.0416) Singing is important to me .50 - . 0 1 .5617) I avoid singing (R) .43 - . 1 2 .4118) 1 sing in front of others .70 .17 .1419) Singing changes my breathing .67 - . 2 0 .1820) Singing makes me uncomfortable (R) .47 .14 .2321) Singing is part of who I am .64 .05 .3822) When I sing, I like to harmonize .81 -.08 .1523) I sing onstage .91 .15 -.0624) I breathe deeper to sing .73 - . 2 2 .1925) I need to sing .50 .05 .5026) I prefer to sing with others .85 -.37 - . 1 0
27) I sing as part of a performance .91 .03 -.0728) I sing for two or more hours every week .76 . 0 2 . 2 1
29) I avoid singing in public (R) .64 .09 .1330) I am more comfortable singing...group .39 - . 6 6 - . 2 1
Note. Items in bold demonstrate similar loading pattern as EFA.Some items are slightly abbreviated

120SINGING EXPERIENCE SCALE
Appendix I
Parallel Analysis
Comparison o f Observed Eigenvalues with Eigenvalues Generated by Parallel Analysis
PCA Observed EFA Observed Parallel AnalysisEigenvalues Eigenvalues 1000 Iterations Eigenvalues15.96 15.96 1.782 . 2 0 2 . 2 0 1.671.90 1.90 1.581.43 1.43 1.510.94 0.94 1.440.79 0.79 1.380.64 0.64 1.33
Note:1) Observed eigenvalues for PCA and EFA are identical.2) First 3 observed eigenvalues for PCA and EFA analyses exceed the average eigenvalues generated from 1000 iterations of random samples with 30 variables and 213 cases; thus, only the first 3 factors should be retained (Tabachnick & Fidell, 2007).3) SPSS syntax for performing parallel analysis obtained from O’Connor (2000).

SINGING EXPERIENCE SCALE121
Appendix J
Pearson Correlations Between Validation Measures for Total Sample
PA NA VS FS SRH HBCWB HBCAC HBCTR HBC_SR
PSS .09 - . 1 0 .04 . 0 1 .14* . 1 0 .14* - . 1 1 - . 1 1
PA -.31** 6 9 ** .54** 40** .40** .26** .09 -.16*NA -.50** -.40** -.37** -.2 0 ** -.27** .14* . 1 2
VS .63** .48** .34** .27** 0 -.14*FS .28** .27** .16* -.04 -.09SRH .27** .15* .05 0
HBCWB .45** -.14* -.2 2 **HBCAC . 19** -.40**HBCTR .35**
Note. PSS= Perceived Singer Status, PA = Positive Affect, NA = Negative Affect, VS = Vitality Scale, FS = Flourishing Scale, SRH = Self-rated Health, HBCWB = Wellness Behavior Subscale of the Health Behavior Checklist, HBCAC = Accident Control Subscale of the Health Behavior Checklist, HBCTR = Traffic Risk Subscale of the Health Behavior Checklist, HBC SR = Substance Risk Subscale of the Health Behavior Checklist, *p <.05, **p < .01.