Embed Size (px)
Citation preview
Beyond Beyond p-Values: p-Values: Characterizing Education Characterizing Education
Intervention Effects in Intervention Effects in
Meaningful WaysMeaningful Ways Mark Lipsey, Kelly Puzio, Cathy Yun, Michael Mark Lipsey, Kelly Puzio, Cathy Yun, Michael Hebert, Kasia Steinka-Fry, Mikel Cole, Megan Hebert, Kasia Steinka-Fry, Mikel Cole, Megan
Roberts, Karen Anthony, Matthew BusickRoberts, Karen Anthony, Matthew BusickVanderbilt UniversityVanderbilt University
And also Howard Bloom, Carolyn Hill, & Alison Black And also Howard Bloom, Carolyn Hill, & Alison Black
IES Research ConferenceWashington, DC
June 2010
Intervention research model
Compare treatment (T) sample with control (C) sample on education outcome measure
Description of the intervention effect that results from this comparison:Means on outcome measure for T and C
samples; difference between meansp-values for statistical significance of the
difference between
Problem to be addressed
The native statistical findings that represent the effect of an intervention on an education outcome often provide little insight into the nature, magnitude, or practical significance of the effect
Practitioners, policymakers, and even researchers have difficulty knowing whether the effects are meaningful
Example Intervention: vocabulary-building program Samples: fifth graders receiving (T) and not receiving (C) the program Outcome: CAT5 reading achievement test Mean score for T: 718 Mean score for C: 703 Difference between T and C means: 15 points p-value: <.05 [! Note– not an indicator of magnitude of effect!]
Questions: Is this a big effect or a trivial one? Do the students read a lot better
now, or just a little better? If they were poor readers before, is this a big enough effect to now
make them proficient readers? If they were behind their peers, have they now caught up?
Someone intimately familiar with the CAT5 scoring may be able to look at the means and answer such questions, but most of us haven’t a clue.
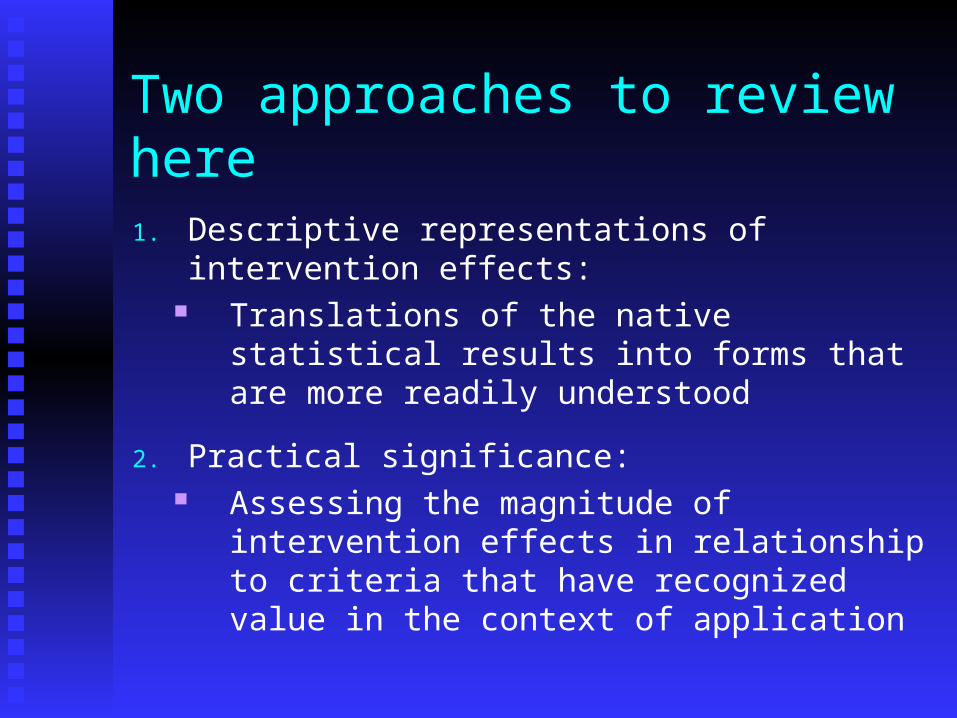
Two approaches to review here
1. Descriptive representations of intervention effects:
Translations of the native statistical results into forms that are more readily understood
2. Practical significance: Assessing the magnitude of intervention
effects in relationship to criteria that have recognized value in the context of application
Useful Descriptive Representations of Intervention Effects
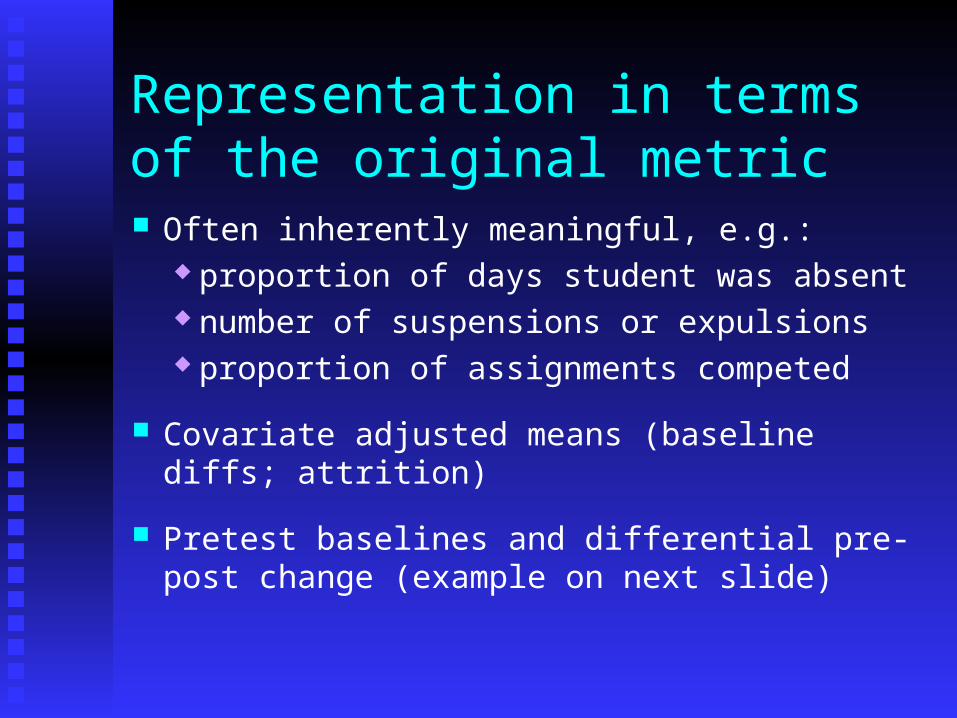
Representation in terms of the original metric Often inherently meaningful, e.g.:
proportion of days student was absent number of suspensions or expulsions proportion of assignments competed
Covariate adjusted means (baseline diffs; attrition)
Pretest baselines and differential pre-post change (example on next slide)
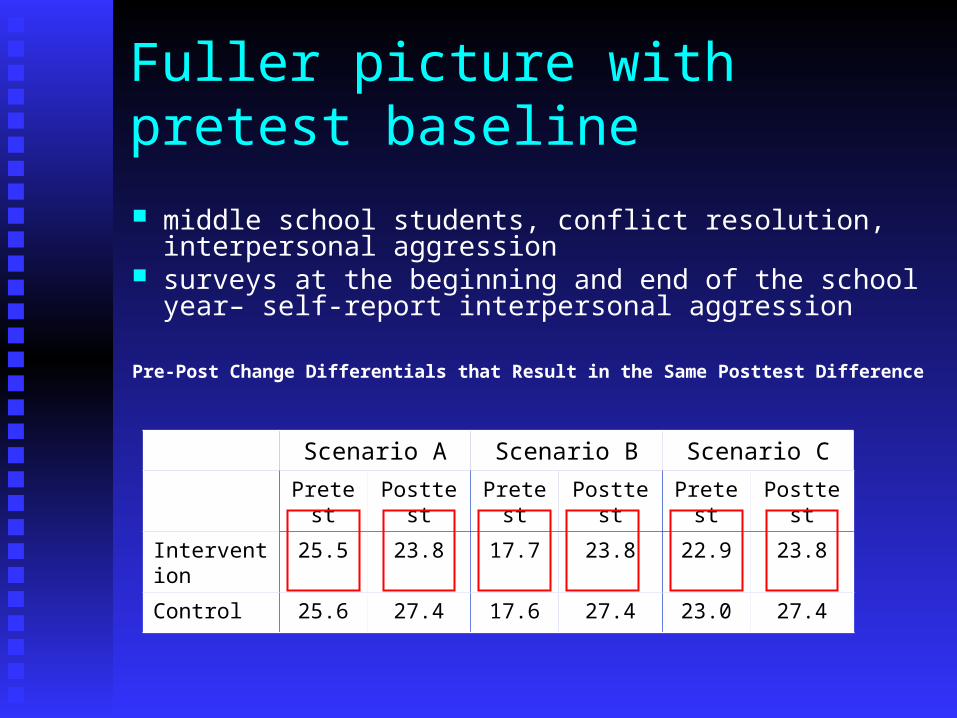
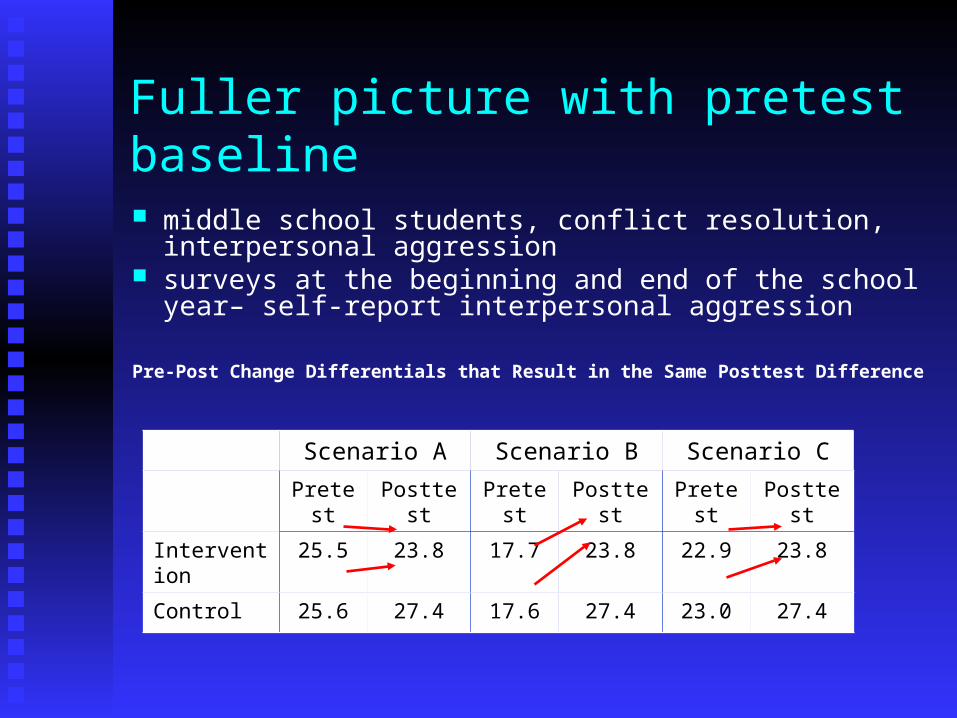
Fuller picture with pretest baseline
middle school students, conflict resolution, interpersonal aggression
surveys at the beginning and end of the school year– self-report interpersonal aggression
Pre-Post Change Differentials that Result in the Same Posttest Difference
Scenario A Scenario B Scenario C
Pretest Posttest Pretest Posttest Pretest Posttest
Intervention 25.5 23.8 17.7 23.8 22.9 23.8
Control 25.6 27.4 17.6 27.4 23.0 27.4
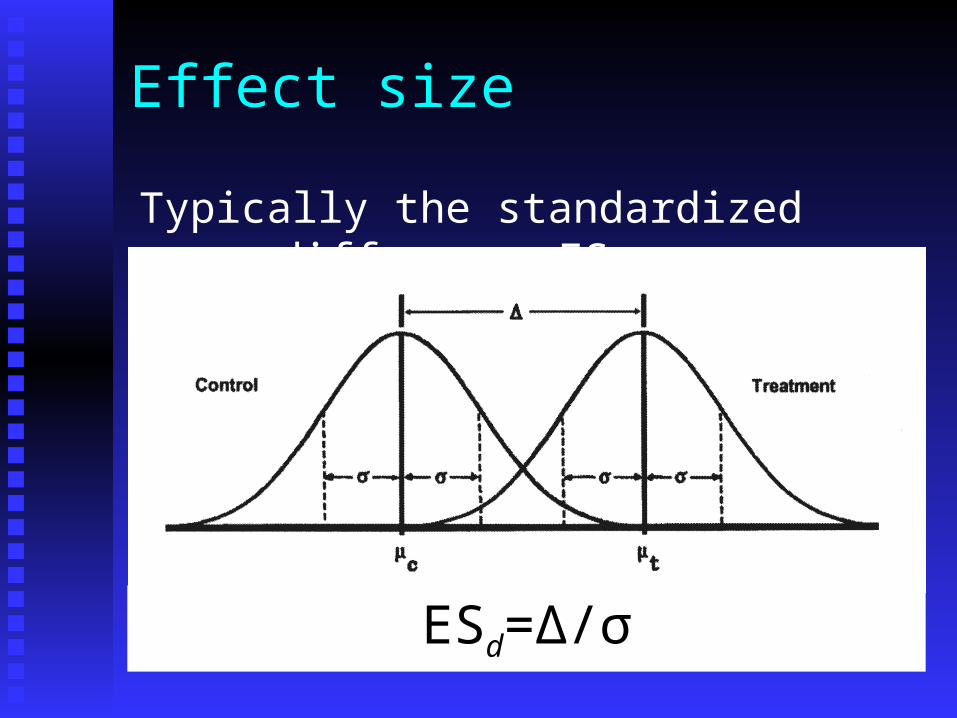
Effect size
Typically the standardized mean difference ES
ESd=Δ/σ
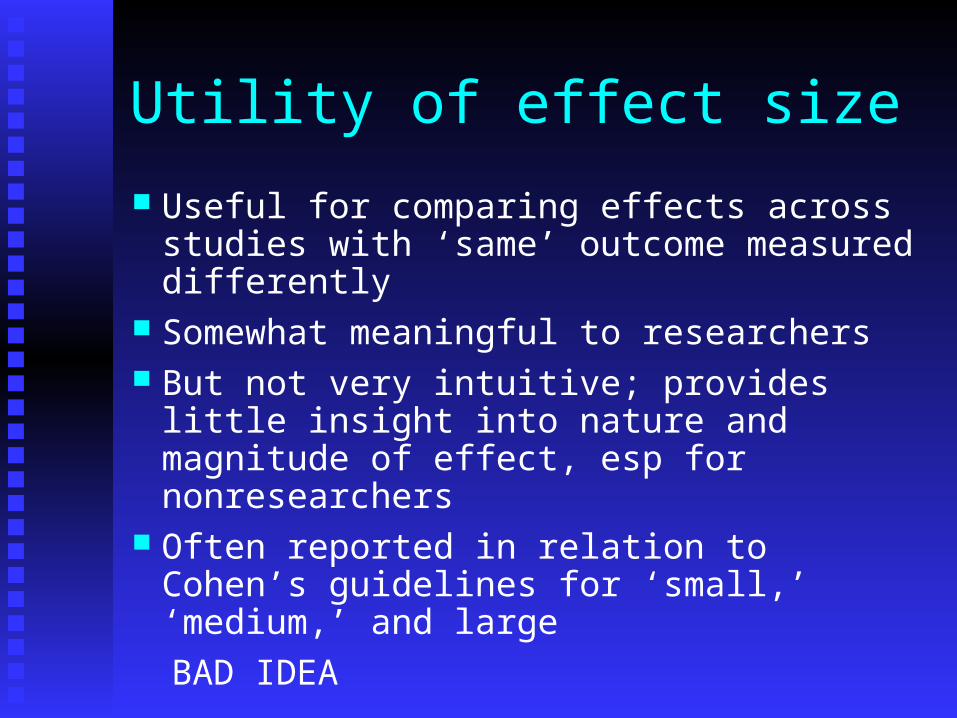
Utility of effect size
Useful for comparing effects across studies with ‘same’ outcome measured differently
Somewhat meaningful to researchers But not very intuitive; provides little insight
into nature and magnitude of effect, esp for nonresearchers
Often reported in relation to Cohen’s guidelines for ‘small,’ ‘medium,’ and large
BAD IDEA
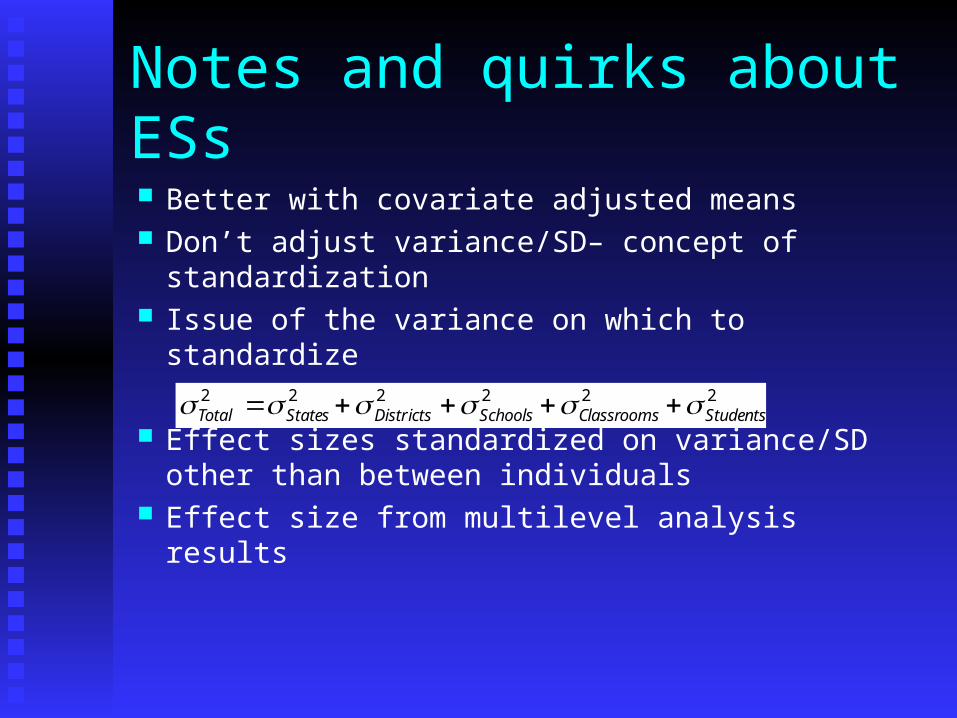
Notes and quirks about ESs
Better with covariate adjusted means Don’t adjust variance/SD– concept of
standardization Issue of the variance on which to standardize
Effect sizes standardized on variance/SD other than between individuals
Effect size from multilevel analysis results
222222StudentsClassroomsSchoolsDistrictsStatesTotal
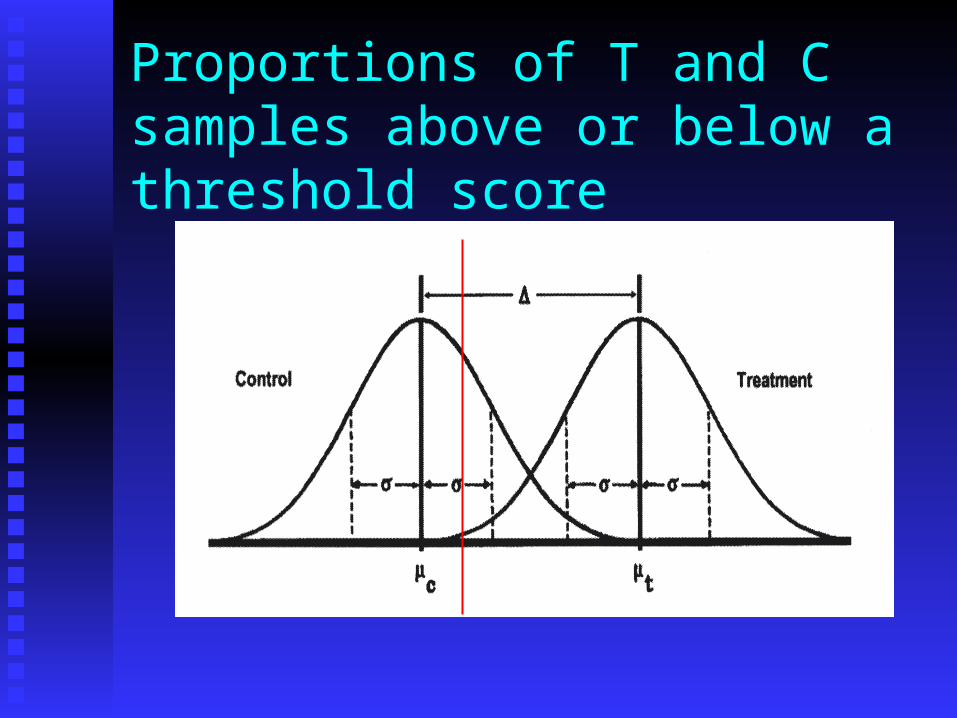
Proportions of T and C samples above or below a threshold score
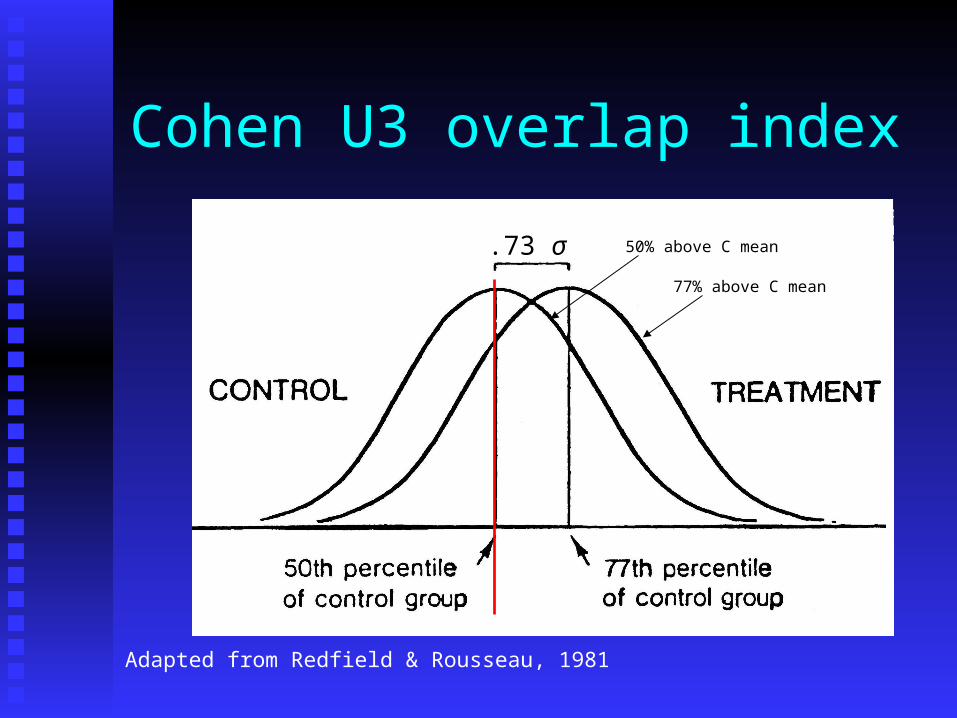
Cohen U3 overlap index
Adapted from Redfield & Rousseau, 1981
.73 σ 50% above C mean
77% above C mean
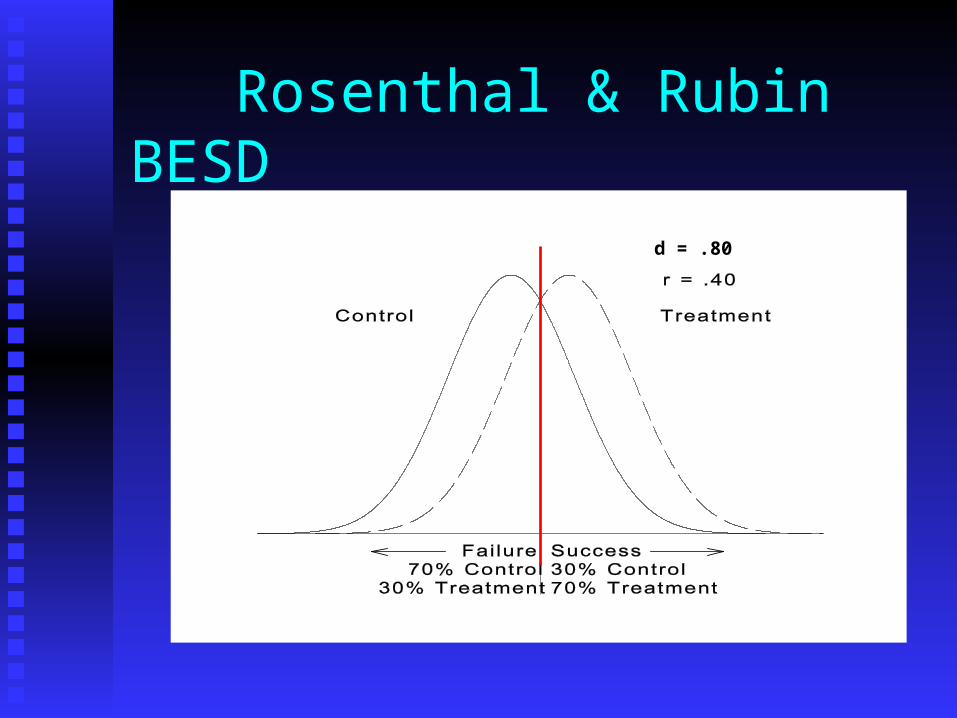
Rosenthal & Rubin BESD
d = .80
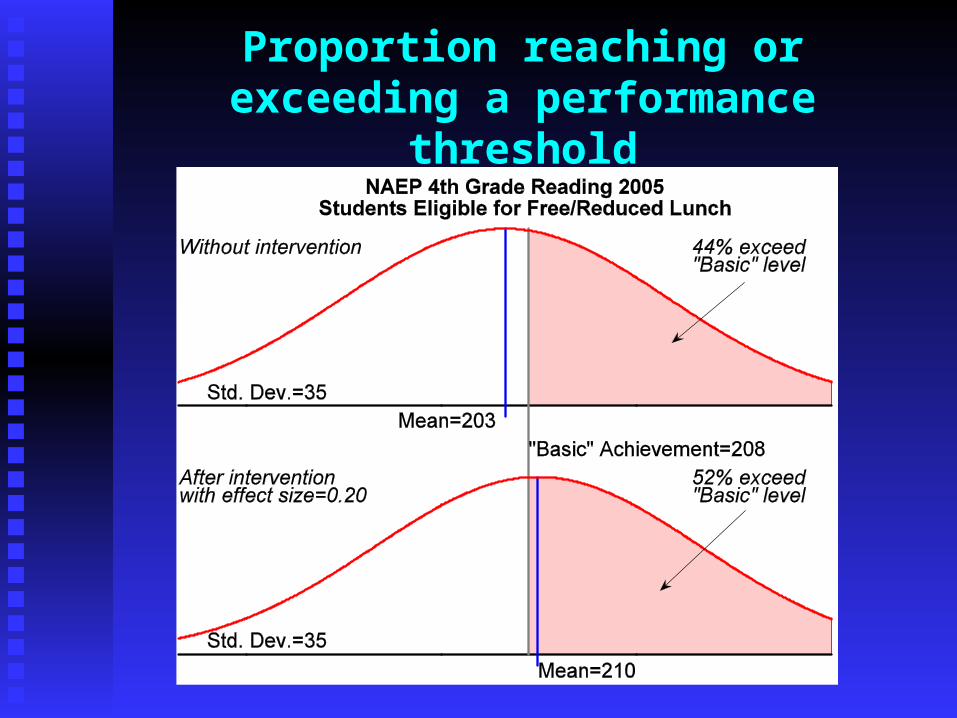
Proportion reaching or exceeding a performance threshold
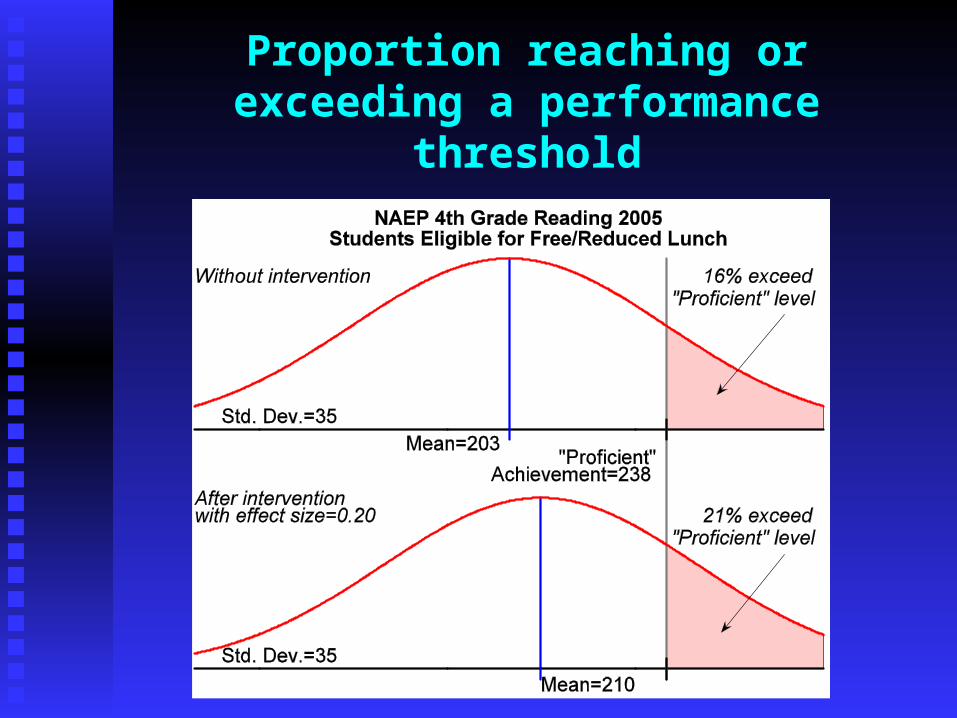
Proportion reaching or exceeding a performance threshold
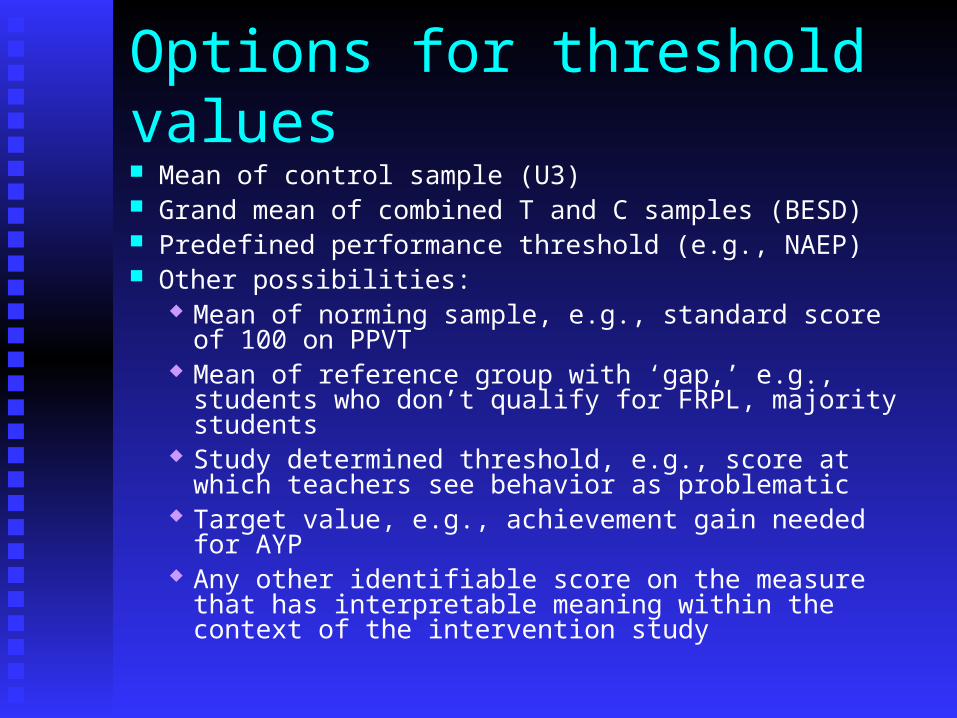
Options for threshold values Mean of control sample (U3) Grand mean of combined T and C samples (BESD) Predefined performance threshold (e.g., NAEP) Other possibilities:
Mean of norming sample, e.g., standard score of 100 on PPVT
Mean of reference group with ‘gap,’ e.g., students who don’t qualify for FRPL, majority students
Study determined threshold, e.g., score at which teachers see behavior as problematic
Target value, e.g., achievement gain needed for AYP Any other identifiable score on the measure that has
interpretable meaning within the context of the intervention study
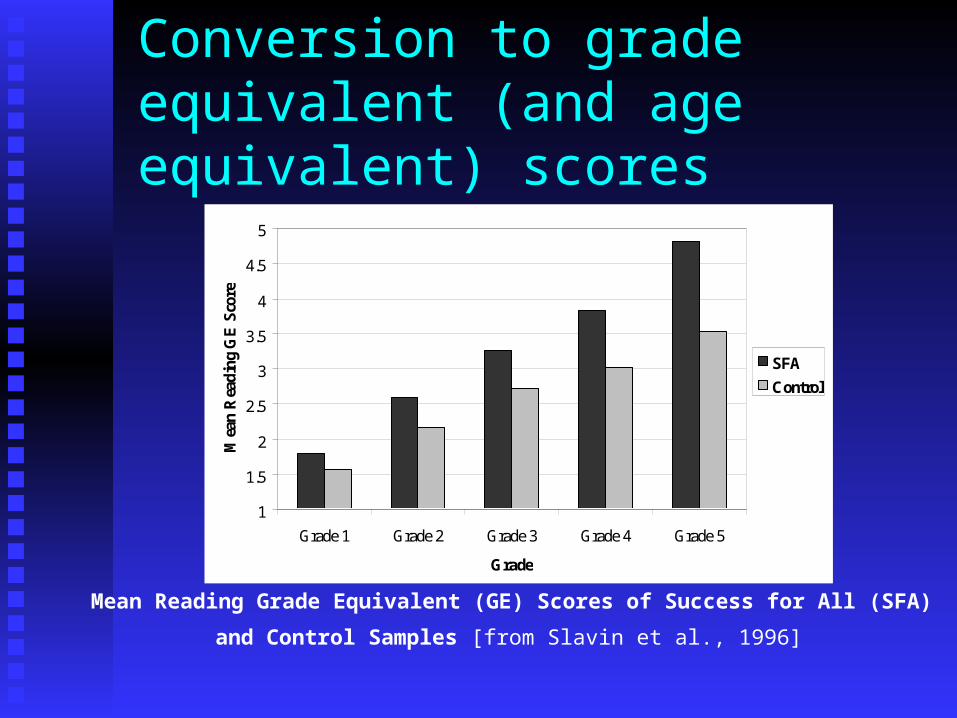
Conversion to grade equivalent (and age equivalent) scores
1
1.5
2
2.5
3
3.5
4
4.5
5
Grade 1 Grade 2 Grade 3 Grade 4 Grade 5
Grade
Mea
n R
ead
ing
GE
Sco
re
SFA
Control
Mean Reading Grade Equivalent (GE) Scores of Success for All (SFA)
and Control Samples [from Slavin et al., 1996]
Characteristics and quirks of grade equivalent scores Provided (or not) by test developer [Note: could be
developed by researcher for context of intervention study]
Vary from X.0 to X.9 over 9 month school year Not criterion-referenced; estimates from empirical
norming sample Imputed where norming data are thin, esp for students
outside grade range Nonlinear relationship to test scores, e.g., given GE
difference in early grades is larger score difference than in later grades, but greater within variation in later grades
Practical Significance: Criterion Frameworks for
Assessing the Magnitude of Intervention Effects
Practical significance must be judged in reference to some
external standard relevant to the intervention context
E.g., compare effect found in study with:E.g., compare effect found in study with: Effects others have found on similar Effects others have found on similar
measures with similar interventionsmeasures with similar interventions Normative expectations for change Normative expectations for change Policy-relevant performance gapsPolicy-relevant performance gaps Intervention costs (not discussed here)Intervention costs (not discussed here)
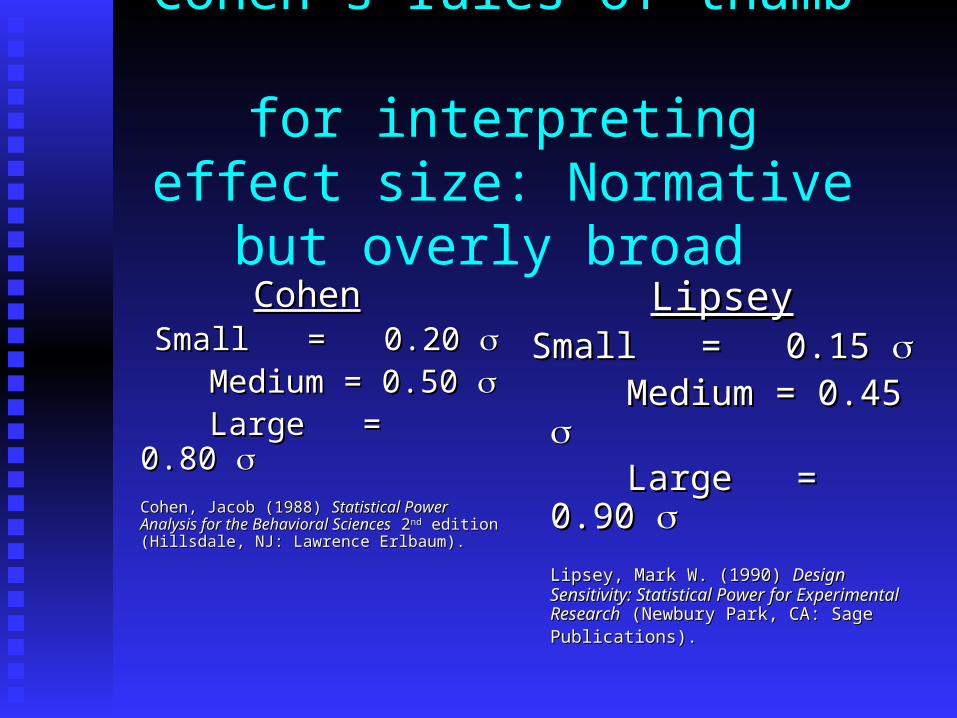
Cohen’s rules of thumb for interpreting effect size:
Normative but overly broad
CohenCohen Small = 0.20 Small = 0.20
Medium = 0.50 Medium = 0.50 Large = 0.80 Large = 0.80
Cohen, Jacob (1988) Cohen, Jacob (1988) Statistical Power Statistical Power Analysis for the Behavioral SciencesAnalysis for the Behavioral Sciences 2 2ndnd edition (Hillsdale, NJ: Lawrence edition (Hillsdale, NJ: Lawrence Erlbaum).Erlbaum).
LipseyLipseySmall = 0.15 Small = 0.15
Medium = 0.45 Medium = 0.45 Large = 0.90 Large = 0.90
Lipsey, Mark W. (1990) Lipsey, Mark W. (1990) Design Design Sensitivity: Statistical Power for Sensitivity: Statistical Power for Experimental ResearchExperimental Research (Newbury Park, (Newbury Park, CA: Sage Publications).CA: Sage Publications).
Effect sizes for achievement from random assignment studies of
education interventions 124 random assignment studies124 random assignment studies 181 independent subject samples181 independent subject samples 831 effect size estimates831 effect size estimates
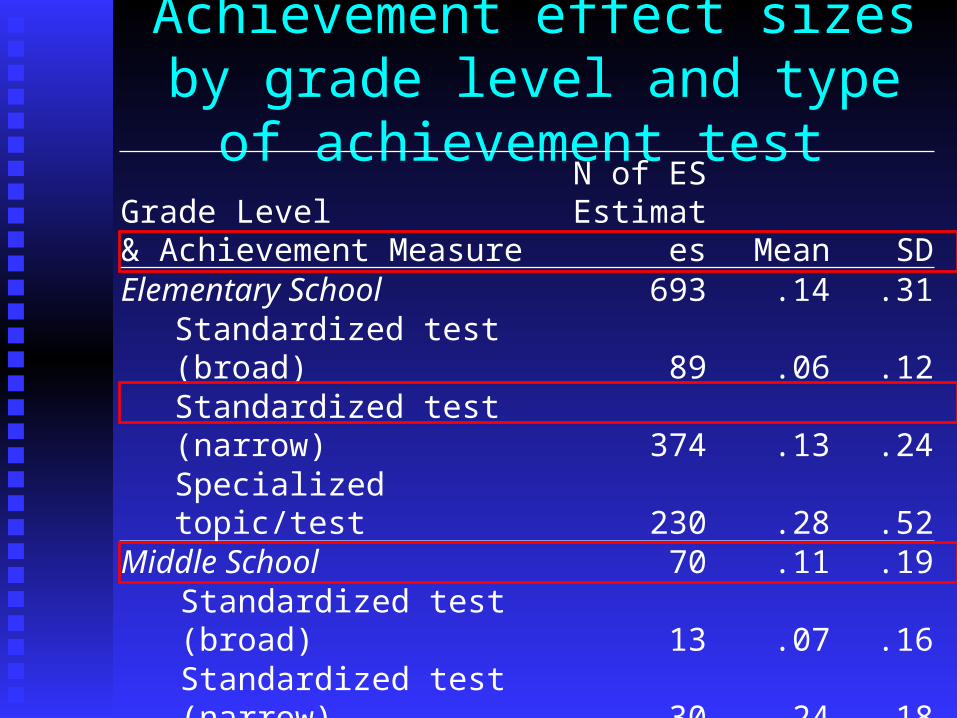
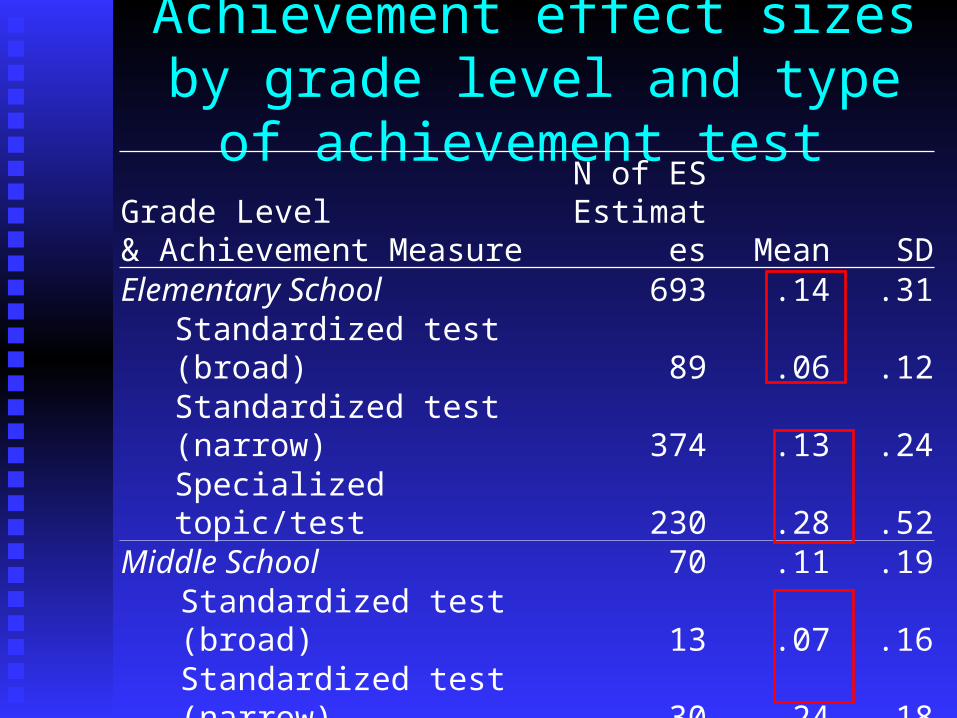
Achievement effect sizes by grade level and type of achievement test
Grade Level & Achievement Measure
N of ES Estimates Mean SD
Elementary School 693 .14 .31Standardized test (broad) 89 .06 .12Standardized test (narrow) 374 .13 .24Specialized topic/test 230 .28 .52
Middle School 70 .11 .19Standardized test (broad) 13 .07 .16Standardized test (narrow) 30 .24 .18Specialized topic/test 27 .14 .28
High school 68 .10 .20Standardized test (broad) -- -- --Standardized test (narrow) 22 .05 .06Specialized topic/test 43 .38 .28
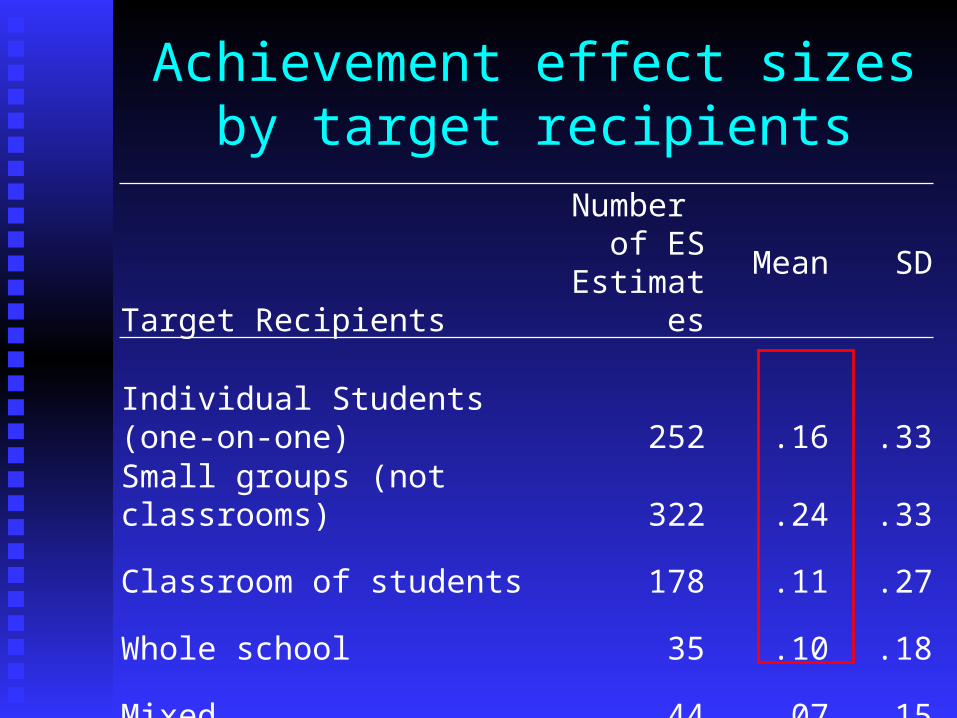
Achievement effect sizes by target recipients
Target Recipients
Number of ES
EstimatesMean SD
Individual Students (one-on-one) 252 .16 .33
Small groups (not classrooms) 322 .24 .33
Classroom of students 178 .11 .27
Whole school 35 .10 .18
Mixed 44 .07 .15
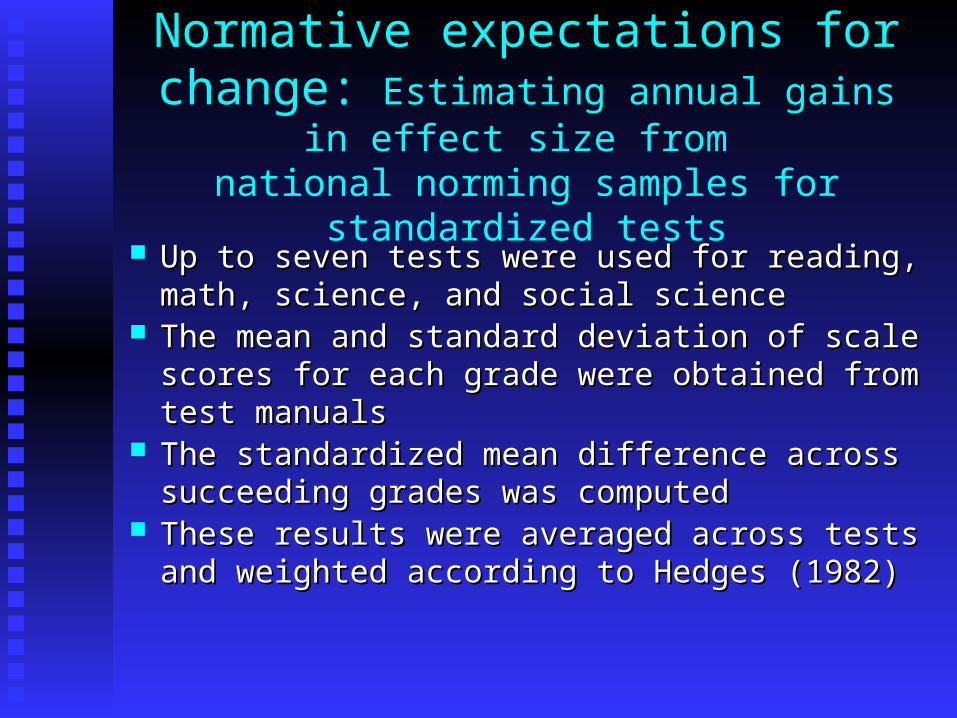
Normative expectations for change: Estimating annual gains in effect size from
national norming samples for standardized tests
Up to seven tests were used for reading, math, Up to seven tests were used for reading, math, science, and social sciencescience, and social science
The mean and standard deviation of scale scores The mean and standard deviation of scale scores for each grade were obtained from test manualsfor each grade were obtained from test manuals
The standardized mean difference across The standardized mean difference across succeeding grades was computedsucceeding grades was computed
These results were averaged across tests and These results were averaged across tests and weighted according to Hedges (1982)weighted according to Hedges (1982)
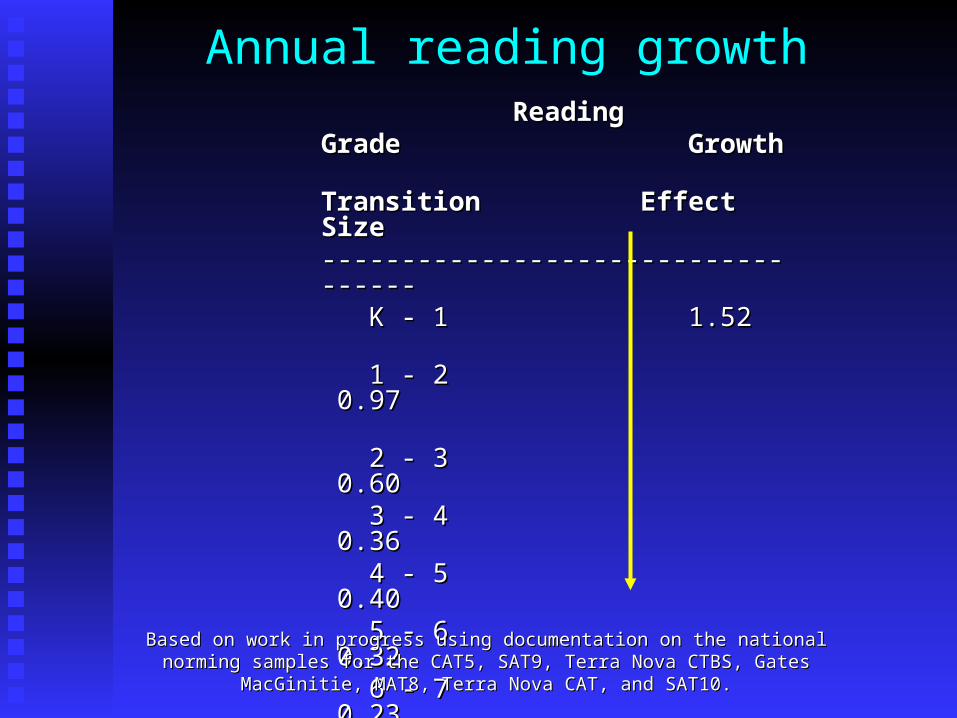
Annual reading growthReadingReading
Grade Growth Grade Growth Transition Effect Size Transition Effect Size ---------------------------------------------------------------------- K - 1 K - 1 1.52 1.52 1 - 2 0.97 1 - 2 0.97 2 - 3 0.60 2 - 3 0.60 3 - 4 0.36 3 - 4 0.36 4 - 5 0.40 4 - 5 0.40 5 - 6 0.32 5 - 6 0.32 6 - 7 0.23 6 - 7 0.23 7 - 8 0.26 7 - 8 0.26 8 - 9 0.24 8 - 9 0.24 9 - 10 0.19 9 - 10 0.19 10 - 11 0.19 10 - 11 0.19 11 - 12 0.06 11 - 12 0.06 ----------------------------------------------------------------------------------------------------Based on work in progress using documentation on the national norming samples for the CAT5, Based on work in progress using documentation on the national norming samples for the CAT5,
SAT9, Terra Nova CTBS, Gates MacGinitie, MAT8, Terra Nova CAT, and SAT10.SAT9, Terra Nova CTBS, Gates MacGinitie, MAT8, Terra Nova CAT, and SAT10.
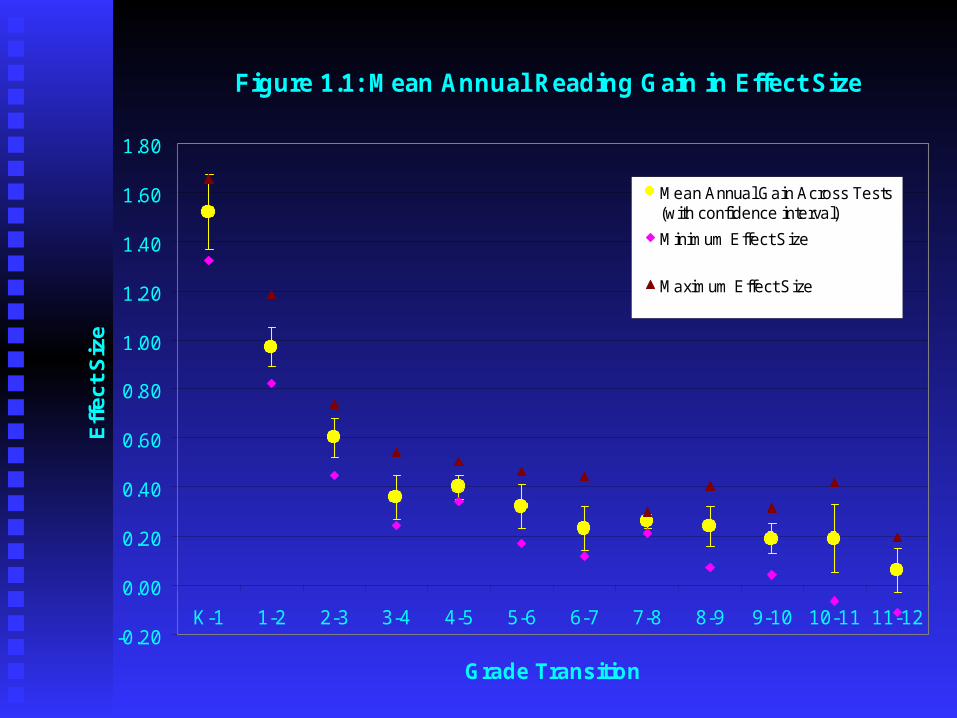
Figure 1.1: Mean Annual Reading Gain in Effect Size
-0.20
0.00
0.20
0.40
0.60
0.80
1.00
1.20
1.40
1.60
1.80
K-1 1-2 2-3 3-4 4-5 5-6 6-7 7-8 8-9 9-10 10-11 11-12
Grade Transition
Eff
ec
t S
ize
Mean Annual Gain Across Tests(with confidence interval)
Minimum Effect Size
Maximum Effect Size
Policy-relevant demographic performance gaps
Effectiveness of interventions can be judged Effectiveness of interventions can be judged relative to the sizes of existing gaps across relative to the sizes of existing gaps across demographic groupsdemographic groups
Effect size gaps for groups may vary across Effect size gaps for groups may vary across grades, years, tests, and districtsgrades, years, tests, and districts
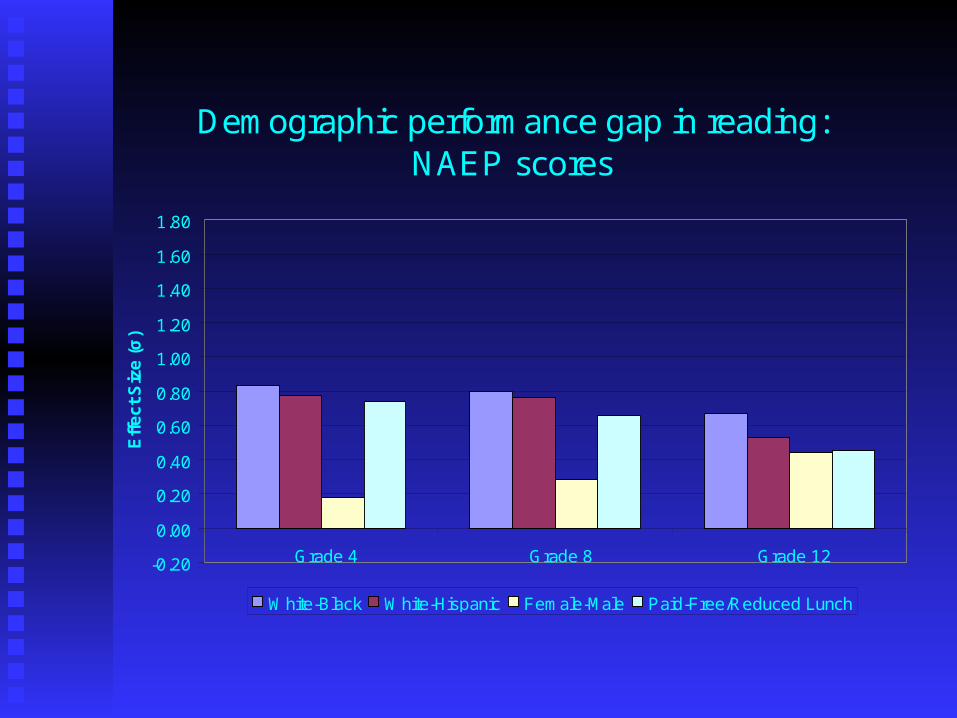
Demographic performance gap in reading: NAEP scores
-0.20
0.00
0.20
0.40
0.60
0.80
1.00
1.20
1.40
1.60
1.80
Grade 4 Grade 8 Grade 12
Eff
ec
t S
ize
(σ
)
White-Black White-Hispanic Female-Male Paid-Free/Reduced Lunch
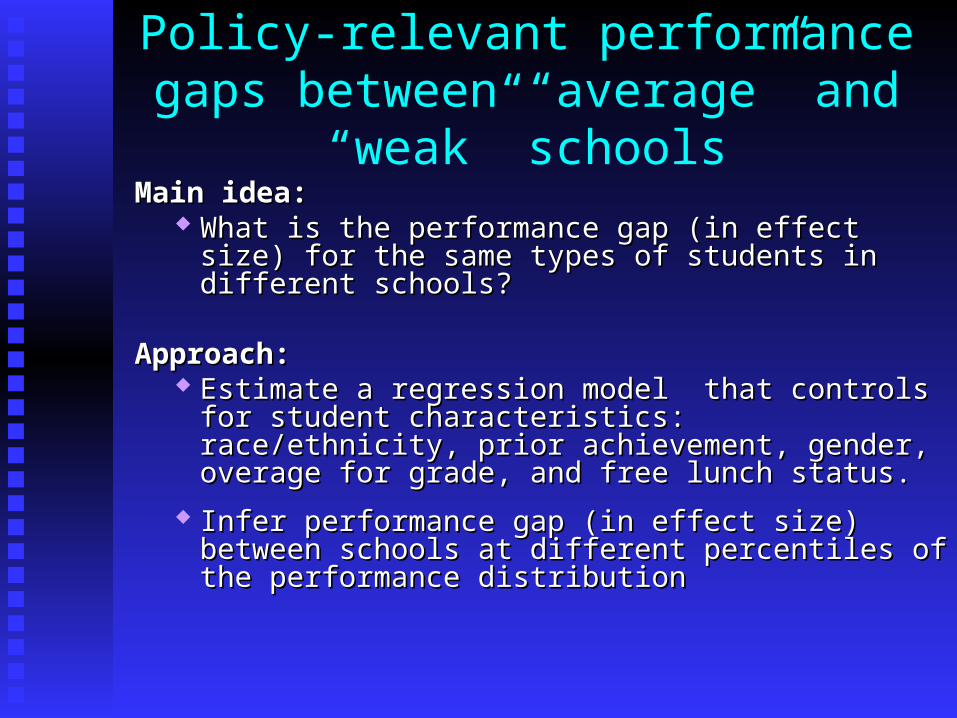
Policy-relevant performance gaps between “average” and “weak” schools
Main idea:Main idea: What is the performance gap (in effect size) for the What is the performance gap (in effect size) for the
same types of students in different schools?same types of students in different schools?
Approach:Approach: Estimate a regression model that controls for student Estimate a regression model that controls for student
characteristics: race/ethnicity, prior achievement, characteristics: race/ethnicity, prior achievement, gender, overage for grade, and free lunch status.gender, overage for grade, and free lunch status.
Infer performance gap (in effect size) between schools Infer performance gap (in effect size) between schools at different percentiles of the performance distributionat different percentiles of the performance distribution
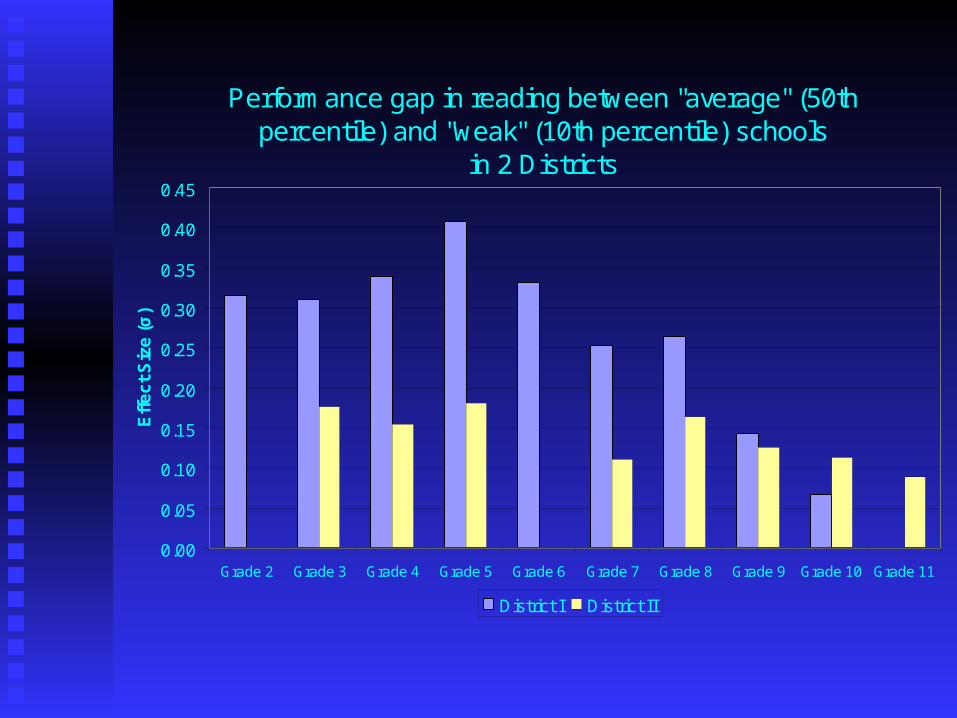
Performance gap in reading between "average" (50th percentile) and "weak" (10th percentile) schools
in 2 Districts
0.00
0.05
0.10
0.15
0.20
0.25
0.30
0.35
0.40
0.45
Grade 2 Grade 3 Grade 4 Grade 5 Grade 6 Grade 7 Grade 8 Grade 9 Grade 10 Grade 11
Eff
ec
t S
ize
(σ
)
District I District II
In conclusion … The native statistical form for intervention effects The native statistical form for intervention effects
provides little understanding of their nature or magnitudeprovides little understanding of their nature or magnitude
Translating the effects into a more descriptive and Translating the effects into a more descriptive and intuitive form makes them easier to understand and assess intuitive form makes them easier to understand and assess for practitioners, policymakers, and researchersfor practitioners, policymakers, and researchers
There are a number of easily applied translations that There are a number of easily applied translations that could be routinely used in reporting intervention effectscould be routinely used in reporting intervention effects
The practical significance of those effects, however, The practical significance of those effects, however, requires that they be compared with some criterion requires that they be compared with some criterion meaningful in the intervention contextmeaningful in the intervention context
Assessing practical significance is more difficult but, Assessing practical significance is more difficult but, there are a number of approaches that may be appropriate there are a number of approaches that may be appropriate depending on the intervention and outcome constructdepending on the intervention and outcome construct