Embed Size (px)
Citation preview

BEYOND INVESTMENT ILLUSIONS
1
When it comes to
your financial future,
perception is everything.
Investment Illusion vs. Investment Reality
2
ILLUSION
3
Looking For What’s Not Really There?

ILLUSION
4
INDEX PAST PERFORMANCE IS NOT INDICATIVE OF FUTURE RESULTS. Assumes reinvestment of capital gains and dividends and no taxes.Data Source: Morningstar, 12/14.S&P 500 Index is a market capitalization-weighted price index composed of 500 widely held common stocks. The S&P 500 Index is unmanaged and unavailable for direct investment.
Volatility Must Be FearedShort-term Volatility: S&P 500 Index Quarterly Returns % (12/31/74–12/31/14)
1Q75 1Q77 1Q79 1Q81 1Q83 1Q85 1Q87 1Q89 1Q91 1Q93 1Q95 1Q97 1Q99 1Q01 1Q03 1Q05 1Q07 1Q09 1Q11 1Q13-30.00
-20.00
-10.00
0.00
10.00
20.00
30.00

REALITY
5
$999,029
Long-term Growth: Growth of a $10,000 investment in S&P 500 Index (12/31/74–12/31/14)
Volatility Should Be Expected
12/1/1974 12/1/1979 12/1/1984 12/1/1989 12/1/1994 12/1/1999 12/1/2004 12/1/2009 12/1/2014$0
$200,000
$400,000
$600,000
$800,000
$1,000,000
$1,200,000
INDEX PAST PERFORMANCE IS NOT INDICATIVE OF FUTURE RESULTS. Assumes reinvestment of capital gains and dividends and no taxes.Data Source: Thomson Reuters, 12/14.S&P 500 Index is a market capitalization-weighted price index composed of 500 widely held common stocks. The S&P 500 Index is unmanaged and unavailable for direct investment.

12/1/1974 12/1/1979 12/1/1984 12/1/1989 12/1/1994 12/1/1999 12/1/2004 12/1/2009 12/1/20140
200,000
400,000
600,000
800,000
1,000,000
1,200,000
1,400,000
1,600,000
REALITY
6
1T-Bills are guaranteed as to the timely payment of principal and interest by the U.S. Government and generally have lower risk-and-return than bonds and equity. Equity investments are subject to market volatility and have greater risk than T-Bills and other cash investments.INDEX PAST PERFORMANCE IS NOT INDICATIVE OF FUTURE RESULTS. Assumes reinvestment of capital gains and dividends and no taxes.S&P 500 Index is a market capitalization-weighted price index composed of 500 widely held common stocks. The S&P 500 Index is unmanaged and unavailable for direct investment.Data Source: Thomson Reuters, 12/14.
Hypothetical Growth of $10,000 invested in S&P 500 Index (12/31/74–12/31/14)
Two Approaches To Volatility$1,391,696
$663,608
Opportunistic: Added $2,000 every time the market dropped 8% or more in a month.
Apprehensive: Moved $2,000 into 30-Day US T-Bills1 every time the market dropped 8% in a month.

ILLUSION
7
Sometimes things aren’t as they appear
ILLUSION
8
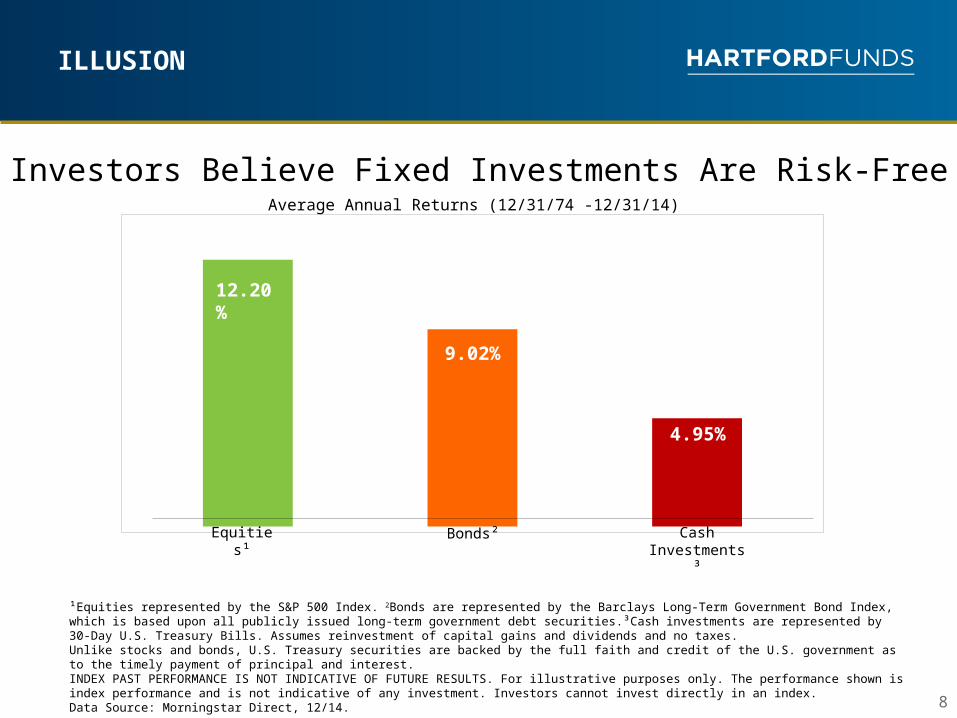
Investors Believe Fixed Investments Are Risk-FreeAverage Annual Returns (12/31/74 -12/31/14)
Equities¹ Bonds² Cash Investments³
12.20%
9.02%
4.95%
¹Equities represented by the S&P 500 Index. 2Bonds are represented by the Barclays Long-Term Government Bond Index, which is based upon all publicly issued long-term government debt securities.³Cash investments are represented by 30-Day U.S. Treasury Bills. Assumes reinvestment of capital gains and dividends and no taxes. Unlike stocks and bonds, U.S. Treasury securities are backed by the full faith and credit of the U.S. government as to the timely payment of principal and interest.INDEX PAST PERFORMANCE IS NOT INDICATIVE OF FUTURE RESULTS. For illustrative purposes only. The performance shown is index performance and is not indicative of any investment. Investors cannot invest directly in an index.Data Source: Morningstar Direct, 12/14.

REALITY
9
Every Investment Carries It’s Own RiskInflation-adjusted Average Annual Returns*
(12/31/74-12/31/14) AVERAGE ANNUAL INFLATION (CPI) RATE WAS 3.85%*
8.02%
4.96%
1.04%
¹Equities represented by the S&P 500 Index. ²Bonds are represented by the Barclays Long-Term Government Bond Index, which is based upon all publicly issued long-term government debt securities. ³Cash investments are represented by the Ibbotson SBBI U.S. 30 Day Treasury Bill Index, an unweighted index which measures the performance of one-month maturity U.S. Treasury Bills.Assumes reinvestment of capital gains and dividends, and historical CPI. Taxes are not taken into account. Had taxes been included, the performance figures would have been lower. Consumer Price Index (CPI) is an index representing the rate of inflation of U.S. consumer prices as determined by the U.S. Bureau of Labor Statistics based on the cost of a variety of goods and services.INDEX PAST PERFORMANCE IS NOT INDICATIVE OF FUTURE RESULTS. For illustrative purposes only. The performance shown is index performance and is not indicative of any investment. Investors cannot invest directly in an index.Data Source: Morningstar Direct, 12/14.
Equities¹ Bonds² Cash Investments³

REALITY
10
Every Investment Carries Its Own Risk
Based on the inflation-adjusted rates on the previous slide, how many years will it take to reach your investment goals? How long will it take for $100,000 to become $200,000?
Years to Double Your Money250 50 75
Equities9 Years
CashInvestments
67 Years14 YearsBonds
This hypothetical illustration is based on a mathematical formula and not intended to predict or project the performance of any investment.
Cash Investments 67 Years
Bonds 14 Years
Equities 9 Years

REALITY
11
Other types of risk beside volatility exist and have had a significant impact on many investors’ goals.
1. Inflation Risk
2.Tax Risk
3.Longevity Risk
ILLUSION
12
Bulls And Bears Are Predictable

ILLUSION
13
Bulls and Bears Are PredictableMarket Cycles: Hypothetical Growth of $10,000 invested in S&P 500 Index (1/31/1950–12/31/2014)
INDEX PAST PERFORMANCE IS NOT INDICATIVE OF FUTURE RESULTS. For illustrative purposes only. The performance shown is index performance and is not indicative of any investment. Investors cannot invest directly in an index.Data Source: Morningstar Direct, 12/14.
$10,000,000
$1,000,000
$100,000
$10,000
$1,000
BullsBears
1/31/50 1960 1970 1980 1990 2000 2010 12/31/14
$10,798,213
REALITY
14
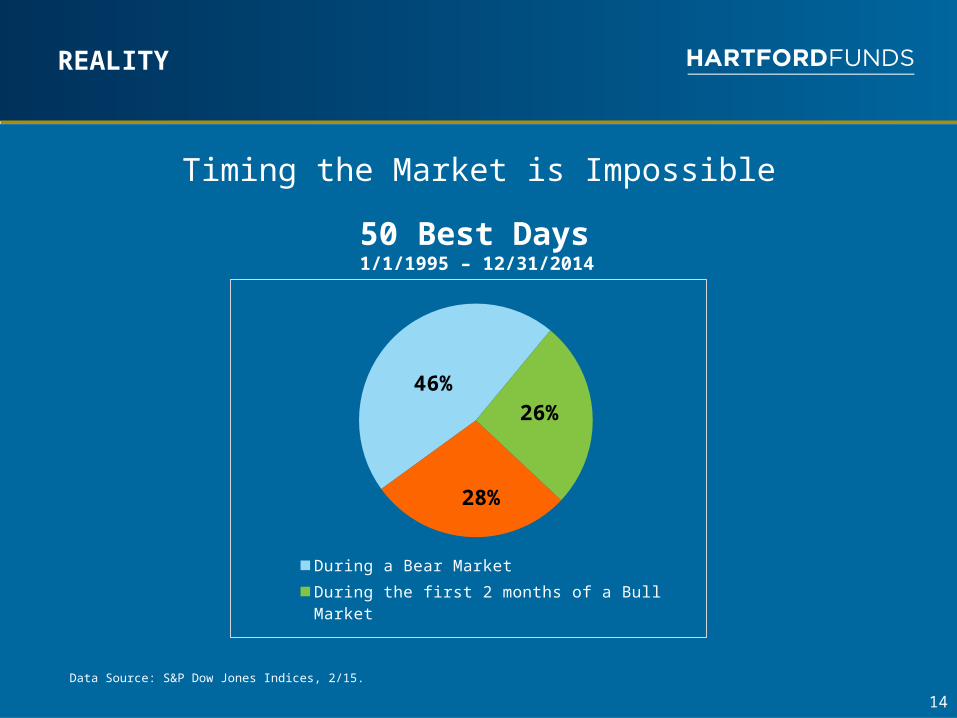
Timing the Market is Impossible
Data Source: S&P Dow Jones Indices, 2/15.
50 Best Days1/1/1995 – 12/31/2014
46%26%
28%
During a Bear Market
During the first 2 months of a Bull Market
During the rest of a Bull Market
REALITY
15
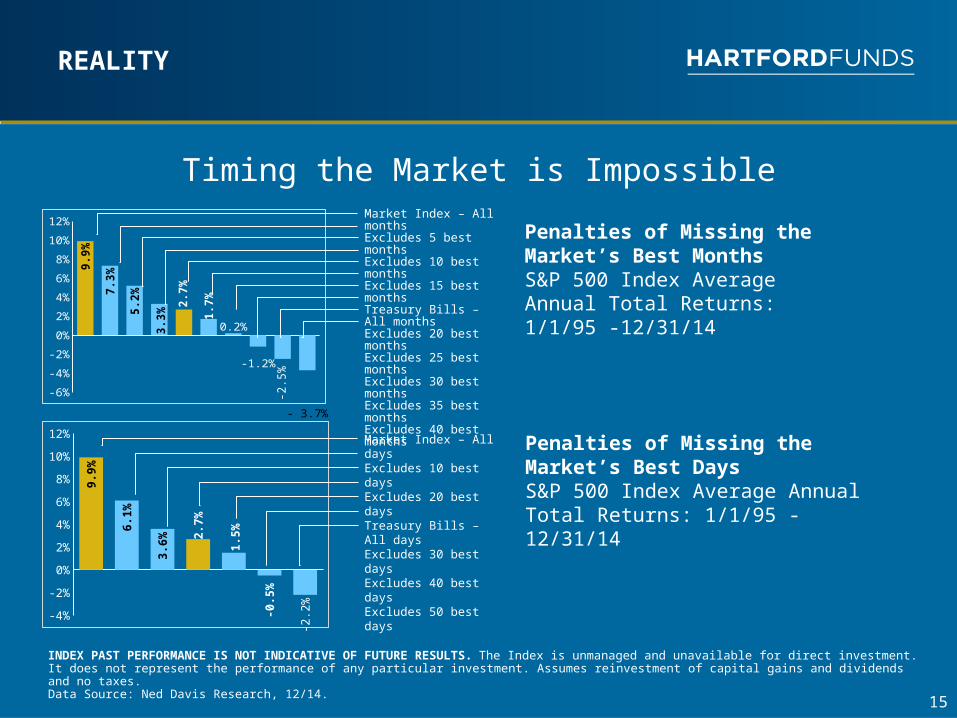
Timing the Market is Impossible
INDEX PAST PERFORMANCE IS NOT INDICATIVE OF FUTURE RESULTS. The Index is unmanaged and unavailable for direct investment. It does not represent the performance of any particular investment. Assumes reinvestment of capital gains and dividends and no taxes.Data Source: Ned Davis Research, 12/14.
Penalties of Missing the Market’s Best MonthsS&P 500 Index Average Annual Total Returns: 1/1/95 -12/31/14
Penalties of Missing the Market’s Best DaysS&P 500 Index Average Annual Total Returns: 1/1/95 -12/31/14
-6%
-4%
-2%
0%
2%
4%
6%
8%
10%
12%
9.9
%
7.3
%
5.2
%
3.3
%
2.7
%
1.7
%
0.2%
-1.2%
-2.5
%
- 3.7%
Market Index – All monthsExcludes 5 best monthsExcludes 10 best monthsExcludes 15 best monthsTreasury Bills – All monthsExcludes 20 best monthsExcludes 25 best monthsExcludes 30 best monthsExcludes 35 best monthsExcludes 40 best months
-4%
-2%
0%
2%
4%
6%
8%
10%
12%
9.9
%
6.1
%
3.6
% 2.7
%
1.5
%
-0.5
%
-2.2
%
Market Index – All daysExcludes 10 best daysExcludes 20 best daysTreasury Bills – All daysExcludes 30 best daysExcludes 40 best daysExcludes 50 best days

ILLUSION
Investing In Winners Can Be EasyStaying on course can be difficult
16
ILLUSION
17
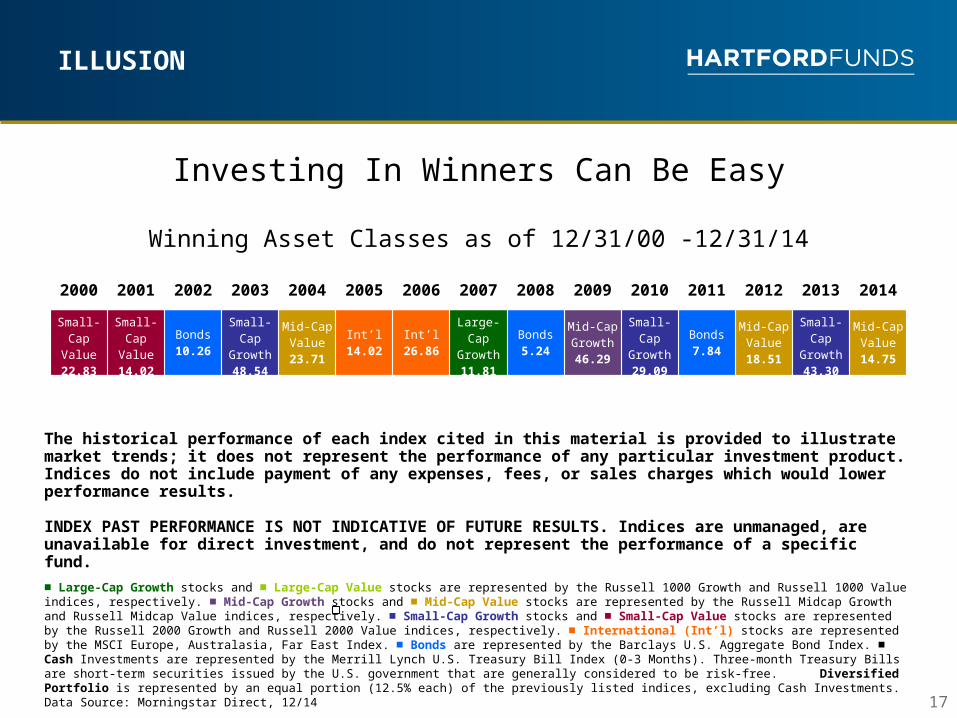
Investing In Winners Can Be Easy
Winning Asset Classes as of 12/31/00 -12/31/14
The historical performance of each index cited in this material is provided to illustrate market trends; it does not represent the performance of any particular investment product. Indices do not include payment of any expenses, fees, or sales charges which would lower performance results.
INDEX PAST PERFORMANCE IS NOT INDICATIVE OF FUTURE RESULTS. Indices are unmanaged, are unavailable for direct investment, and do not represent the performance of a specific fund.
■ Large-Cap Growth stocks and ■ Large-Cap Value stocks are represented by the Russell 1000 Growth and Russell 1000 Value indices, respectively. ■ Mid-Cap Growth stocks and ■ Mid-Cap Value stocks are represented by the Russell Midcap Growth and Russell Midcap Value indices, respectively. ■ Small-Cap Growth stocks and ■ Small-Cap Value stocks are represented by the Russell 2000 Growth and Russell 2000 Value indices, respectively. ■ International (Int’l) stocks are represented by the MSCI Europe, Australasia, Far East Index. ■ Bonds are represented by the Barclays U.S. Aggregate Bond Index. ■ Cash Investments are represented by the Merrill Lynch U.S. Treasury Bill Index (0-3 Months). Three-month Treasury Bills are short-term securities issued by the U.S. government that are generally considered to be risk-free. Diversified Portfolio is represented by an equal portion (12.5% each) of the previously listed indices, excluding Cash Investments.Data Source: Morningstar Direct, 12/14
2000 2001 2002 2003 2004 2005 2006 2007 2008 2009 2010 2011 2012 2013 2014
Small-CapValue22.83
Small-Cap Value14.02
Bonds10.26
Small-CapGrowth48.54
Mid-CapValue23.71
Int’l14.02
Int’l26.86
Large-CapGrowth11.81
Bonds5.24
Mid-CapGrowth46.29
Small-CapGrowth29.09
Bonds7.84
Mid-CapValue18.51
Small-CapGrowth43.30
Mid-Cap Value14.75

2000 2001 2002 2003 2004 2005 2006 2007 2008 2009 2010 2011 2012 2013 2014Small-Cap
Value22.83
Small-Cap Value14.02
Bonds10.26
Small-CapGrowth48.54
Mid-CapValue23.71
Int’l14.02
Int’l26.86
Large-CapGrowth11.81
Bonds5.24
Mid-CapGrowth46.29
Small-CapGrowth29.09
Bonds7.84
Mid-CapValue18.51
Small-CapGrowth43.30
Mid-CapValue14.75
Mid-CapValue19.18
Bonds8.44
Cash1.71
Small-Cap Value46.03
Small-Cap Value22.25
Mid-CapValue12.65
Small-Cap Value23.48
Int’l11.63
Cash1.75
Large-CapGrowth37.21
Mid-Cap Growth26.38
Large-CapGrowth
2.64
Small-Cap Value18.05
Mid-CapGrowth35.74
Large-CapValue13.45
Bonds11.63
Cash4.10
Mid-CapValue-9.64
Mid-CapGrowth42.71
Int’l20.70
Mid-CapGrowth12.10
Large-CapValue22.25
Mid-CapGrowth11.43
Small-Cap Value-28.92
Small-CapGrowth34.47
Mid-CapValue24.75
Large-CapValue0.39
Int’l17.90
Small-Cap Value34.52
Large-CapGrowth13.05
Large-CapValue7.01
Mid-CapValue2.33
Small-Cap Value-11.43
Int’l39.17
Large-CapValue16.49
DiversifiedPortfolio
7.26
Mid-CapValue20.22
Small-CapGrowth
7.05
DiversifiedPortfolio-29.07
Mid-CapValue34.21
Small-Cap Value24.50
Cash0.07
Large-CapValue17.51
Large-CapGrowth33.48
Mid-CapGrowth11.90
Cash5.98
DiversifiedPortfolio
-5.30
DiversifiedPortfolio-13.98
Mid-CapValue38.07
Mid-CapGrowth15.48
Large-CapValue7.05
DiversifiedPortfolio
15.00
Bonds6.97
Large-CapValue-36.85
Int’l32.46
DiversifiedPortfolio
16.87
DiversifiedPortfolio
-1.36
Mid-CapGrowth15.81
Mid-CapValue33.46
DiversifiedPortfolio
7.16DiversifiedPortfolio
-0.44
Large-CapValue-5.59
Large-Cap Value-15.52
DiversifiedPortfolio
31.05
Small-CapGrowth14.31
Large-CapGrowth
5.26
Small-CapGrowth13.35
Cash4.81
Large-CapGrowth-38.44
DiversifiedPortfolio
25.66
Large-CapGrowth16.71
Mid-CapValue-1.38
Large-CapGrowth15.26
Large-CapValue32.53
Bonds5.97
Mid-CapGrowth-11.75
Small-CapGrowth-9.23
Int’l-15.66
Large-CapValue30.03
DiversifiedPortfolio
13.87
Small-Cap Value4.71
Mid-Cap Growth10.66
DiversifiedPortfolio
4.70
Mid-CapValue-38.44
Small-Cap Value20.58
Large-CapValue15.51
Mid-CapGrowth-1.65
Small-CapGrowth14.59
DiversifiedPortfolio
26.04
Small-CapGrowth
5.60
Int’l-13.96
Mid-CapGrowth-20.15
Mid-CapGrowth-27.41
Large-CapGrowth29.75
Large-CapGrowth
6.30
Small-CapGrowth
4.15
Large-CapGrowth
9.07
Large-CapValue-0.17
Small-CapGrowth-38.54
Large-CapValue19.69
Int’l8.21
Small-CapGrowth-2.91
DiversifiedPortfolio
13.54
Int’l23.29
Small-CapValue4.22
Large-CapGrowth-22.42
Large-CapGrowth-20.42
Large-CapGrowth-27.88
Bonds4.10
Bonds4.34
Cash2.99
Cash4.79
Mid-CapValue-1.42
Int’l-43.06
Bonds5.93
Bonds6.54
Small-Cap Value-5.50
Bonds4.21
Cash0.05
Cash0.03
Small-CapGrowth-22.43
Int’l-21.21
Small-CapGrowth-30.26
Cash1.07
Cash1.25
Bonds2.43
Bonds4.33
Small-Cap Value-9.78
Mid-CapGrowth-44.32
Cash0.14
Cash0.13
Int’l-11.73
Cash0.07
Bonds-2.02
Int’l-4.48
REALITY
18
INDEX PAST PERFORMANCE IS NOT INDICATIVE OF FUTURE RESULTS. Indices are unmanaged and do not represent the performance of a specific fund. You cannot invest directly in the indices. ■ Large-Cap Growth stocks and ■ Large-Cap Value stocks are represented by the Russell 1000 Growth and Russell 1000 Value indices, respectively. ■ Mid-Cap Growth stocks and ■ Mid-Cap Value stocks arerepresented by the Russell Midcap Growth and Russell Midcap Value indices, respectively. ■ Small-Cap Growth stocks and ■ Small-Cap Value stocks are represented by the Russell 2000 Growth and Russell 2000 Value indices, respectively. ■ International (Int’l) stocks are represented by the MSCI Europe, Australasia, Far East Index. ■ Bonds are represented by the Barclays U.S. Aggregate Bond Index. ■ Cash Investments are represented by the Merrill Lynch U.S. Treasury Bill Index (0-3 Months). Three-month Treasury Bills are short-term securities issued by the U.S. government that are generally considered to be risk-free. ■ Diversified Portfolio is represented by an equal portion (12.5% each) of the previously listed indices, excluding Cash Investments.Data Source: Morningstar, 12/14.
The historical performance of each index cited in this material is provided to illustrate market trends; it does not represent the performance of any particular investment product. Indices do not include payment of any expenses, fees, or sales charges which would lower performance results.
Annual Returns of Asset Classes (12/31/00 -12/31/14)
Chasing Winners Is A Losing Battle
$0
$50,000
$100,000
$150,000
$200,000
$250,000
$300,000
$350,000
REALITY
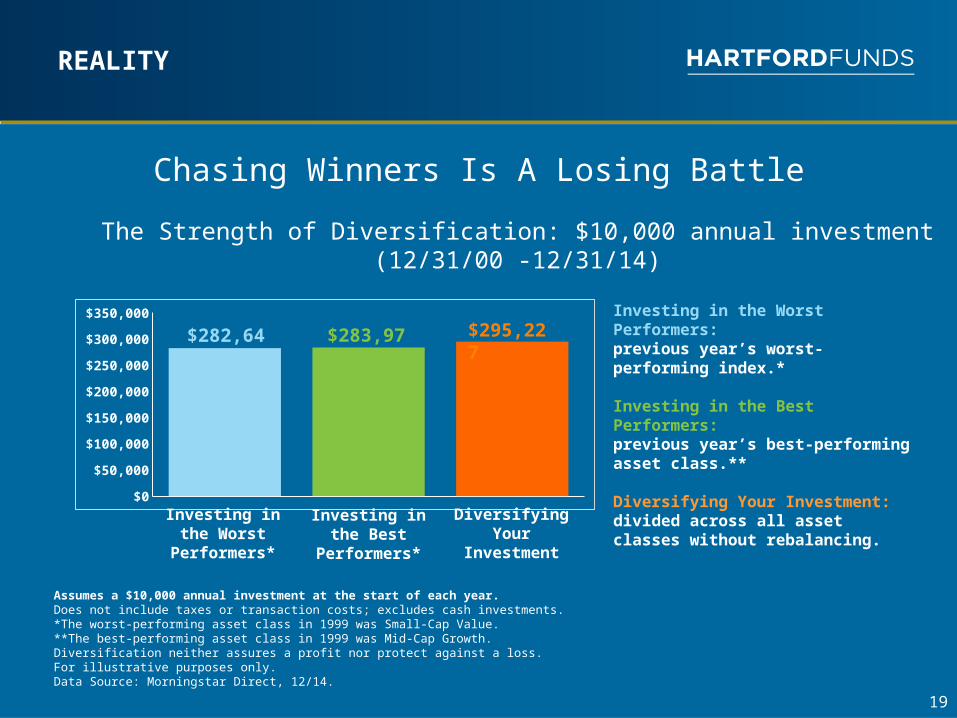
Chasing Winners Is A Losing Battle
Investing in the Worst Performers: previous year’s worst-performing index.*
Investing in the Best Performers: previous year’s best-performing asset class.**
Diversifying Your Investment: divided across all asset classes without rebalancing.
The Strength of Diversification: $10,000 annual investment(12/31/00 -12/31/14)
Assumes a $10,000 annual investment at the start of each year.Does not include taxes or transaction costs; excludes cash investments.*The worst-performing asset class in 1999 was Small-Cap Value. **The best-performing asset class in 1999 was Mid-Cap Growth.Diversification neither assures a profit nor protect against a loss.For illustrative purposes only.Data Source: Morningstar Direct, 12/14.
Investing in the Worst
Performers*
Diversifying Your Investment
Investing in the Best
Performers*
$282,642 $283,972 $295,227
19

Getting Beyond the Illusions
20
Don’t Go It Alone
Create A Strategy 5+ year strategy Goals and time frame Rate of return
An investment representative can help: Find investments for your financial goals Minimize the effects of “emotional investing” Educate you on the market and its history
Income strategy Estate planning
Getting Beyond the Illusions
21
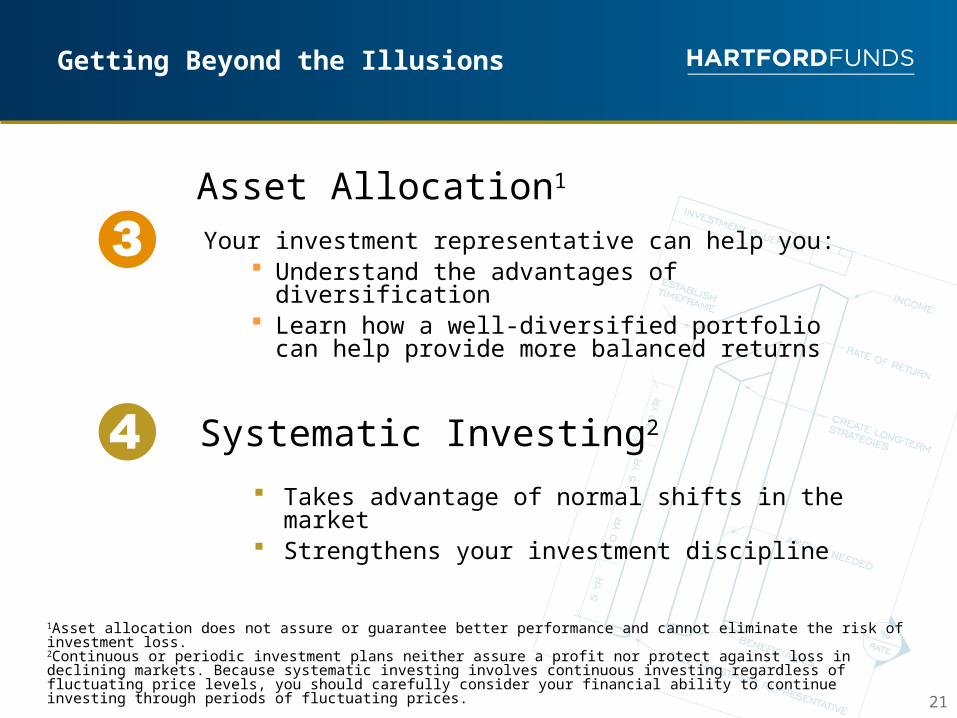
Asset Allocation1
Your investment representative can help you: Understand the advantages of diversification Learn how a well-diversified portfolio can help provide
more balanced returns
Systematic Investing2
Takes advantage of normal shifts in the market Strengthens your investment discipline
1Asset allocation does not assure or guarantee better performance and cannot eliminate the risk of investment loss.
2Continuous or periodic investment plans neither assure a profit nor protect against loss in declining markets. Because systematic investing involves continuous investing regardless of fluctuating price levels, you should carefully consider your financial ability to continue investing through periods of fluctuating prices.

22
A Clearer Perspective

23
The after-effects of your investment decisions:Stare at the pictureunwa veringly for 30 seconds . . .

Index Descriptions:
Dow Jones Industrial Average is price-weighted average of 30 significant stocks traded on the New York Stock Exchange and the Nasdaq.
S&P 500 Index is an unmanaged list of 500 widely held U.S. common stocks frequently used as a measure of U.S. stock market performance.
Barclays U.S. Aggregate Bond Index is comprised of government securities, mortgage-backed securities, asset-backed securities, and corporate securities to simulate the universe of bonds in the market.
Barclays Long-Term U.S. Treasury Total Return Index includes all publicly issued, U.S. Treasury securities that have a remaining maturity of 10 or more years, are rated investment grade, and have $250 million or more of outstanding face value.
All investments are subject to risk, including the possible loss of principal. Fixed income securities are subject to interest-rate risk (the risk that the value of an investment decreases when interest rates rise) and credit risk (the risk that the issuing company of a security is unable to pay interest and principal when due) and call risk (the risk that an investment may be redeemed early). Unlike stocks and bonds, U.S. Treasury securities are backed by the full faith and credit of the U.S. government as to the timely payment of principal and interest. Diversification does not ensure a profit or protect against a loss in a declining market.
Investors should carefully consider the investment objectives, risks, charges, and expenses of Hartford Funds before investing. This and other information can be found in the prospectus and summary prospectus, which can be obtained by calling 888-843-7824 (retail) or 800-279-1541 (institutional). Investors should read them carefully before they invest.Hartford Funds are underwritten and distributed by Hartford Funds Distributors, LLC.
All information and representations herein are as of 12/14, unless otherwise noted. SEM_VOA 104863-3 2/1525