Embed Size (px)
Citation preview

Beyond Country-Level Governance:
Does Firm-Level Corporate Governance Quality Matter in Dividend Policy? Bin Chang
University of Ontario Institute of Technology
Oshawa, Ontario, Canada
Shantanu Dutta
University of Ontario Institute of Technology
Oshawa, Ontario, Canada
Samir Saadi
University of Ottawa
Ottawa, Ontario, Canada
PengCheng Zhu
University of San Diego
San Diego, California, USA
Abstract
We examine the impact of firm-level and the country-level corporate governance on corporate dividend
policies. Based on a large sample of firms representing 29 different countries, we find that (i) firms with
better corporate governance tend to pay higher dividends and (ii) country level shareholder rights is
associated with higher dividend payouts. These findings are consistent with La Porta et al.’s (2000)
‘outcome model’. Moreover we find that country-level and firm-level corporate governance environment
complement each other. In countries with better shareholder rights, better firm-level corporate governance
is associated with even higher dividend payouts.
Key Words: Dividend policy; International corporate governance; Firm value
Contact co-author: Bin Chang, [email protected], 647 291 7811.

Beyond Country-Level Governance:
Does Firm-Level Corporate Governance Quality Matter in Dividend Policy?
I. Introduction
Country-level governance is defined by the level of shareholder right protection, and the
enforcement of those rights with a country’s laws, culture and norms, and institutions. It is well
documented that country-level governance affects cross-country differences in business practices
and financial policies. For example, it affects international business relation (Abdi & Aulakh,
2012), the development of code of good governance (Haxhi & Hans, 2010), foreign direct
investment (Luo, Chung, & Sobczak, 2009), IPO underpricing (Boulton, Smart, & Zutter, 2010),
and dividend policy (Shao, Kwok, guedhami, 2013). On the other hand, firm-level governance,
defined as the mechanism within a corporation to ensure minority shareholders receive an
appropriate return on their investment, affects firm decisions within a country, as found by
single-country studies. However, there is a lack of published research on whether firm-level
governance has a role beyond country-level governance in determining firm policies
internationally. In this research, we fill the gap by examining one of the most important financial
policies: dividend policy.
Despite numerous theoretical and empirical studies, a lack of consensus persists among
financial economists on why firms pay dividends (Brealey, Myers, and Allen 2008). This lack of
consensus is not only for firms in the US, but also for firms worldwide. In order to explain firms’
dividend policy, more recent studies have attempted to explain a corporate dividend policy in the
context of agency theory (La Porta et al. 2000; Borokhovich et al., 2005). According to agency
theory, a reduction in free cash flow, for instance, dividend payout, alleviates agency costs by
reducing the possibility of private benefit extraction by opportunistic managers and compelling a
firm to go to market for additional funding, which in turn subjects managers to more external
scrutiny (Jensen, 1986; Easterbrook,1984). Regarding the relation between governance and
dividend, La Porta et al. (2000) propose an outcome hypothesis suggesting a positive relation and
a substitution hypothesis suggesting a negative relation. Although theories do not differentiate
between country- and firm- governance, empirical studies are based on either (i) a cross-country
sample using a country-level governance variable or (ii) a country-specific sample using a firm-
specific governance variable. Studies based on a cross-country sample generally support a

positive relation between governance and dividend (La Porta et al. 2000)1, whereas country-
specific studies yield mixed results.
A joint investigation of country and firm governance on dividend becomes possible,
owing to the recent availability of firm-level governance data across countries are constructed in
a comparable manner. We use a sample of 28,686 firm-years observations from 6,151 unique
firms across 29 countries from 2003 to 2009 with firm-level ISS governance index constructed
from variables in ISS database. 2 Prior studies using country-level governance variables
implicitly assume that all firms’ corporate policies are impacted equally by country-level
governance quality irrespective of a firm’s own governance practices. Instead, our sample shows
that there are considerable variations in firm-level governance scores within each country (Table
1d). Even among the well-studied US firms, ISS governance ranges between 8 and 38. This
finding suggests we should consider firm governance in international studies.
The central idea in this paper is to investigate whether firm-level governance affects
firms’ dividend payouts even when country-level governance is controlled. First, our results
show that after controlling for country-level variables, firms with better corporate governance
pay higher dividends. This finding is in line with the outcome hypothesis. Second, we find that
the interaction between firm-level governance quality and country-level governance quality is
positive and significant in determining dividend policy. This implies that in countries with better
corporate governance environment, stronger firm-level governance mechanisms lead to even
more dividend payouts. This result reinforces the prediction of ‘outcome hypothesis’ in our
sample of international firms. Third, we find that dividend payments are associated with higher
firm value. This indirectly shows the benefits of having stronger internal governance mechanism,
which promotes dividend payouts. Lastly, we study total payout, the sum of dividend and stock
repurchase, and find that both country and firm governance play positive role in total payout
although the interaction effect does not prevail. Our results are robust to the consideration of
1 Brockman and Unlu (2009) carry out a detailed cross-country analysis by examining the relationship between
creditor rights and dividend policy. They hypothesize that the relationship between creditor rights and dividend
policy will be governed by the substitution hypothesis and they find support for it. However, in line with La Porta et
al. (2000) they recognize that the outcome hypothesis “explains the empirical linkages between the agency costs of
equity, minority shareholder rights and observed dividend payouts” (p. 277). 2 As Aggarwal et al. (2009) state, ISS governance index provides a firm-level governance measure that is
comparable across countries. A number of prior studies have shown that the ISS governance index reveals relevant
information on a firm’s corporate governance practices (Aggarwal et al. 2009; Aggarwal et al. 2011; Jiraporn et al.
2011).

endogeneity issues, alternative dividend payout measures, more control variables, and different
econometric methods. Our study contributes to the corporate dividend payout literature in a
number of ways. First, we show that in a cross-country empirical setup, a firm-specific
governance mechanism plays a significant role in payout decisions beyond country-level
variables. Second, this study helps to understand the great differences of dividend policies
around the world.
The remainder of this paper is organized as follows. Section II presents relevant literature
and conjectures. Section III describes our sample and variables. Section IV analyzes our
empirical findings. Section V presents robustness tests, and Section VI concludes the study.
II. Relevant Literature and Conjectures
A. Corporate Governance and Dividend Policy
The dividend literature proposes various theories to explain the dividend puzzle. These
include bird-in-the-hand, tax preference and dividend clientele, signaling, catering and agency
theory. But as noted by Aivazian et al. (2003) signaling and agency theory are the main key
theories in explaining the dividend puzzle. Ross (1977), Bhattacharya (1979), John and Williams
(1985), and Miller and Rock (1985), among others, argue that dividends mitigate information
asymmetry between management and shareholders. These models propose that dividend
payments convey private information about a firm’s future profitability under the condition that a
firm pays dividends on a regular basis. In other words, only good quality firms with high cash
flow expectations will pay dividends. Several studies support the signaling explanation,
including Kalay and Lowenstein (1986), and Nissim and Ziv (2001). However, other recent
studies, including Denis and Osobov (2008), cast doubt on signaling theory as being inconsistent
with the “dividend disappearance” phenomenon observed by Fama and French (2001). Casting
further doubt on the signaling explanation, Amihud and Li (2006) argue that the information
content of dividends has fallen since the mid-1970s, which has discouraged firms from using
dividends as a means of communicating with shareholders. The lack of success of conventional
theories in explaining firms’ dividend policy made academicians and practitioners interested in
an agency explanation.
Although our inclusion of firm-specific variables will partially address the issues relevant
to signaling theory, our research primarily focuses on agency theory in explaining dividend

policy. Agency theory focuses on the separation of principal (owner) and agents (manager) and
its consequences on shareholder wealth. The potential agency costs associated with the
separation of management and ownership induce a conflict-mitigation role for dividend
payments. Two competing hypotheses explain the dynamics between agency problem and
dividend policy: “outcome hypothesis” and “substitution hypothesis”, as termed by La Porta et
al. (2000)
1. Outcome hypothesis: As Jensen (1986) shows, the availability of free cash flow may
lead to the extraction of private benefits by managers. Thus, firms with better corporate
governance are likely to restrict this opportunistic behavior by distributing more cash to the
shareholders. In other words, firms with better corporate governance practices that ensures
stronger shareholders right will pay more dividends (La Porta et al. 2000). Under this view,
dividend payouts are “an effective system of legal protection to shareholders” (p. 5). La Porta et
al. (2000) examine 4,000 firms from 33 different countries and find support for the outcome
hypothesis. Grullon and Michaely (2007) use product market competition as a corporate
governance measure and also find support for outcome hypothesis.
2. Substitution hypothesis: According to the second view, firms with poor governance
practices and weaker shareholder rights need to pay higher dividends to maintain good a
reputation with shareholders. In the U.S. context, several recent papers find support for the
substitution hypothesis. Officer (2006) uses firms with large boards, CEO/Chairman duality, and
low ownership by insiders and institutional investors as a proxy for poor governance. Jiraporn
and Ning (2006) and John and Knyazeva (2006) use the Gompers, Ishii, and Metrick (2003)
index, and Grinstein and Michaely (2005) use institutional holding as a proxy for corporate
governance. Results of these studies support the “substitution hypothesis.” Hu and Kumar (2004)
also find that both the likelihood and the level of payouts are significantly and positively
(negatively) related to factors that increase (decrease) the executive entrenchment level. They
use CEO characteristics, compensation structure and board characteristics to test the
entrenchment hypothesis.3
B. Cross-Country Analysis
3 For a detailed literature review, see Dutta and Saadi (2009).

Doidge, Karolyi, and Stulz (2007) show that country characteristics significantly
influences a firm’s costs and benefits in implementing measures to improve their own
governance and transparency. La Porta et al. (2000) examine 4,000 firms from 33 different
countries and report that firms operating in countries with stronger legal protection to minority
shareholders pay higher dividends. Mitton (2004) uses firm-specific corporate governance
ratings developed by Credit Lyonnais Securities Asia (CLSA) for 365 firms from 19 emerging
markets to study the impact of firm-level corporate governance mechanisms on dividend
payouts. His evidence is consistent with the outcome model of dividends in that firms with
stronger corporate governance practices have higher dividend payouts. In another cross-country
study, Faccio et al. (2001) extend support for the outcome model. They study the dividend
policies of firms from East Asia and Western Europe. Unlike U.S. firms, a family or a large
shareholder controls a large number of firms operating in these two regions. Their results show
that firms pay more dividends in Western Europe compared to the firms in East Asia despite
having a similar ownership structure. In Western Europe, minority shareholders have better legal
protection, which helps them to extract more dividends. Brockman and Unlu (2009) examine the
effect of country-level creditor rights on dividend policy. Using a large sample from 52
countries, they find that in countries with poor creditor rights, both the probability and amount of
dividend payouts decrease significantly. Brockman and Unlu conclude that creditors persuade
managers to adopt a more restrictive dividend payout policy as a substitute for weak creditor
rights to mitigate a firm’s agency cost of debt.
Other studies show that tax systems (Lasfer and Alzahrani, 2009) and national culture
(Shao, Kwok, and Guedhami, 2009) also affect firms’ dividend policy significantly. Licht,
Goldschmidt and Schwartz (2005) argue that a country’s legal and institutional environment
should reflect its underlying cultural value. The Shao et al. (2009) study shows that legal
protection’s effects on dividends are weaker or even inconsistent when cultural variables are
included. Therefore, it appears that the choice of financial markets is likely to play a role in the
relation between dividend policy and corporate governance.
C. Interplay between Country-Level and Firm-Level Corporate Governance
As presented in the former sections, prior studies examining the relation between
corporate governance and dividend policy have adopted one of the following two approaches: (i)

single-country analysis with firm-specific governance data (e.g. Officer, 2006; Jiraporn and
Ning, 2006; Jiraporn et al. 2011; John and Knyazeva, 2006; Grinstein and Michaely 2005; Chang
and Dutta 2012) or (ii) international study with country-level governance data (e.g., La Porta et
al., 2000; Faccio et al., 2001; Brockman and Unlu, 2009; Ferris, Jayaraman, and Sabherwal,
2009). Country-level governance is defined by the level of shareholder rights protection and the
enforcement of those rights with a country’s laws, norms, and institutions. Firm-level
governance is the mechanism within a corporation. The interaction between country-level and
firm-level governance is investigated by Aggarwal et al. (2009). They find that the U.S. scores
high on country-level governance environment and U.S. firms also score high on firm-level
governance (second only to Canada). However, in countries with low country-level governance,
most firms have lower firm-level governance than U.S. firms, but a small portion of them
achieve the U.S. standards. Therefore, the mere consideration of the effect of the country-level
governance environment may not present a holistic view of the governance impact on firm-level
dividend policy. In fact, as country-specific studies have shown, firms with dissimilar corporate
governance standards adopt different dividend policy, showing the importance of firm-specific
governance environment. Accordingly, we expect that firm-level corporate governance will
affect the dividend payout of a firm internationally.
Furthermore, we anticipate that the influence of firm-level corporate governance on
dividend policy would depend on country-level governance setup. However, the nature of this
interaction is not clear as there are two competing viewpoints. According to the first view, in
countries with high country-level governance, firms with low corporate governance cannot
always pay out too little or skip payout as it would draw attention from shareholder activists.
This will lead to a negative interaction between country and firm-level governance quality in
terms of their influence on dividend payout. According to the second view, in countries with
poor country-level governance, managers can pay little or even no dividends as they can take
advantage of weaker legal environment and do not need to cater to minority shareholder
interests. This will be manifested as a positive interaction between country and firm-level
governance quality.
III. Data and variable descriptions
A. Data

We begin our sample construction by matching the Compustat Global Industrial database
to the Compustat Global Issues database. We require that each firm-year observation in the
annual Global Industrial file has (1) consolidated accounting statements, (2) membership in a
non-regulated industry (i.e., we also exclude regulated utilities (SIC codes 4900–4949) and
financial institutions (SIC codes in the 6000 range)), and (3) all the data fields required for
subsequent analyses. After applying these filters, we obtain a sample of 426,433 firm-year
observations from 37,901 unique firms across 29 countries during the period 2003–2009. We
then join this sample with the ISS International database. The total sample size drops to 28,686
with 6,151 unique firms. We also construct a subsample to test the valuation impact of creditor
rights using the approach of Fama and French (1998). Because this method requires a five-year
lagged firm-specific data, we lose another 11,141 firm-year observations due to missing data in
the prior years. This subsample contains 17,545 firm-year observations from 4,022 unique firms
across 29 countries during the period 2003–2009.
For the U.S. and Canadian firms we obtain financial accounting variables from
Compustat North America database. For the non-U.S. and non-Canadian firms, we obtain annual
financial accounting variables and stock price information from Compustat Global Industrial and
Compustat Global Issues databases respectively. We collect country-level variables through
various sources. We obtain creditor rights, shareholder rights, and legal origin from Djankov,
McLiesh, and Shleifer (2007) and Djankov, La Porta, Lopez-de-Silanes, and Shleifer (2008) –
two studies that update the La Porta, Lopez-de-Silanes, Shleifer, and Vishny (1998) database.
We obtain rule-of-law measures from Kaufmann, Kraay, and Mastruzzi (2003). We construct
stock market and financial intermediary development measures (Demirguc-Kunt and Levine,
1996) from the World Development Indicators (WDI) database developed by the World Bank.
Foreign exchange information is also obtained from the WDI database.
B. Variables
In this section, we define all the variables used in our empirical tests. Since most
variables are from accounting statements, data items shown in the parentheses apply to
Compustat Global Industrial file, unless otherwise stated. We describe our dependent and
independent variables in the following subsections.
1. Dependent variables

We primarily use two different empirical setups. First, we examine the impact of
corporate governance on the dividend payouts using Tobit regression, as well as fixed- and
random-effect model specifications. In line with earlier studies, we measure dividend payout –
the primary dependent variable — by scaling total dividends paid by total assets (Aivazian et al.,
2003; Brockman and Unlu, 2009). As robustness tests, we also use total revenue and net income
as the scaling variable. The results are consistent with the main findings and are reported in the
robustness test section.4 Second, we examine how markets value the dividend payments in the
context of a firm’s corporate governance structure. Following previous studies (Pinkowitz, Stulz,
and Williamson, 2003) we use market value of firm scaled by book value of total assets as the
dependent variable.
2. Independent variables
Our independent variables are grouped into two categories: firm-specific variables and
country-level variables. The main firm-specific governance variables are the ISS governance
index (ISS41), as well as the four major components of this index. We follow Aggarwal et al.
(2009) to construct these indices. The overall ISS governance index is computed by summing
four major component variables: board (24 attributes), audit (3 attributes), anti-takeover (6
attributes) and compensation and ownership (8 attributes).
Our country-level measures include shareholder right index, common-law origin dummy,
financial development of a country and per capita gross domestic product (GDP) indicators. We
follow Brockman and Unlu (2009) and Djankov et al. (2008) to obtain shareholder right (AD)
index. The AD measures the strength of minority shareholder rights protection. Common-law
origin dummy is an indicator variable designating the legal system in a country. La Porta et al.
(1998) show that common law countries have the strongest legal protection of investors. We
follow Demirguc-Kunt and Levine (1996) to use market capitalization of publicly listed stocks to
GDP to measure financial development. For the per capita GDP indicator variable, we use the
logarithm transformed per capita GDP of each country based on the World Development
Indicator database (Morck, Yeung and Yu, 2000). We also collect the tax penalty measure from
4 Few studies use other variables to measure the levels of a firm’s dividend payment – namely dividend payout ratio
(dividends/net income), dividend yield (dividends/share price), and dividend to book value of equity. However, as
suggested by Brockman and Unlu (2009) and Aivazian et al. (2003) among others, we will mainly focus on the
dividends-to-assets ratio and dividends-to-sales ratio because of the following reasons: dividend payout ratios can be
unstable and non-normal as earnings get close to zero; dividend yield incorporates market perceptions and pricing
effects that are often beyond management control; and deflating dividend by the book value of equity could be more
sensitive to accounting distortions (Aivazian et al., 2003).
Jacob and Jacob (2013) to control for the different tax rates between dividends and capital gains
in various countries.
We follow Brockman and Unlu (2009) and use six variables to control for firm-specific
characteristics. These widely used controls include firm life cycle (proxied by the retained
earnings to total assets), book value of equity to assets ratio (book equity), return on assets, sales
growth, firm size (log of total assets), and cash holdings to total assets. All of our firm-specific
variables are computed at fiscal year-end.
IV. Empirical Results
A. Summary Statistics
We provide summary statistics and a correlation matrix for the main sample in Panel A of
Table 1. The mean dividend-to-assets ratio is about 1%. The average firm-level governance
index value is about 21.7; and the average shareholder's right index value is close to 3.23. The
correlation table shows that the dividend-to-assets is positively correlated with both firm-level
governance index (ISS41) and the country-level shareholder right protection index (i.e., The AD
index). The results show preliminary evidence supporting the outcome hypothesis.
In Panel B we present the distribution of firms across countries. Our sample includes
mainly developed countries. The top three are the USA (19,567), Japan (3,237), The United
Kingdom (1,338). Our sample also includes a few developing countries, such as China, India,
Brazil, and Turkey. We note that over 68% of our sample firm-years are from the United States.
The large presence of U.S. firms in our data is mainly due to the ISS data availability. This said,
in the robustness section, we show that our results remain qualitatively the same after excluding
U.S. firms. In Panel C we present the distribution of firms across industries. Our sample spans
across 44 different industries. The top three industries are business service (3,602), electronic
equipment (2,002), and retail (1,876).
In Panel D we present the firm-level governance statistics for each country. We find that
there is a considerable level of variation in firm-level governance scores in each country.
Overall, the firm-level governance scores range from 7 to 38. This statistic reasserts our earlier
view that a single country-level governance statistic might not be adequate to fully explain the
relationship between governance and dividend policy. Panel D also shows the country’s
shareholder right index. The median is 3.50, and 12 countries have above median AD.

_ _ _ _ _ _ _ _ _ _ _ _ _ _ _ _
Insert Table 1 here
_ _ _ _ _ _ _ _ _ _ _ _ _ _ _ _
B. Corporate governance and dividend payouts
In this section, we examine the relationship between corporate governance and the
dividend payment amount. In the following section, we present the results of Tobit regressions
including control variables. We show additional estimation methods and more control variables
in the robustness test section.
1. Multivariate analysis: corporate governance and dividend pay amounts
In line with the main objective of this study, we first examine the corporate governance
impact on the dividend pay amount and the dynamics between country- and firm-level
governance structures. To investigate whether the corporate governance mechanisms affect
dividend payouts, we estimate several specifications of the following model. Further, as many of
the firms in our sample do not pay dividends, we use Tobit regression models to carry out our
analysis.
Dividend_to_assetsi,t = α1 + α2Retained_Earningsi,t + α3 Book-to-Equityi,t + α4 ROAi,t + α5
Sales_Growthi,t + α6 Firm_Sizei,t + α7 Cashi,t + α8 ISS41i,t-1 + α9 ADi,t + α10 ISS41i,t-1 * ADi,t + α11
PCAPGDPi,t + α12 Financial_Marketi,t + α13 Div_Tax_Penaltyi,t
ISS41 denotes the firm level corporate governance (Aggarwal et al., 2009), whereas AD
denotes the strength of shareholders’ rights in a country that serves as a proxy for country-level
governance quality (Djankov et al., 2008; Brockman and Unlu, 2009). One of the advantages of
using the ISS index is that it captures the yearly variations of the governance measures. Unlike
the country-level governance index, such as the shareholder right index, the ISS index varies
year by year between 2003 and 2009. In order to control for the endogeneity bias of ISS index, in
line with Booth, Chang and Zhou (2013), we use one year lag ISS index variable in the

regression model. We also carry out other tests to address endogeneity biases that are reported
later in this study.
Table 2 shows the panel data regression (random effect) models to test the impact of
country-level and firm-level governance impact on the dividend payment amount. The dependent
variable is the cash dividend divided by the total assets ratio. We first present the model only
with control variables (Model 1). Consistent with the literature, we find that more mature firms –
denoted by firm life cycle variable (higher retained earnings to assets), better performing firms
(higher ROA) and firms with higher cash holding tend to pay more dividends. Further, firms
with better sales growth pay lower dividends. For the country-level variables, we find that firms
in a country with a higher dividend tax penalty tend to pay lower dividends, which is consistent
with the findings in Jacob and Jocob (2013). However, firms in higher per capita GDP countries
in our sample tend to pay higher dividends, similar to the country level findings in Shao et al.
(2010).
Model 2 in Table 2 tests the country corporate governance impact on the dividend
payment. The shareholder right index (AD) is positive and significant at 1%. It supports the
outcome hypothesis that stronger corporate governance is associated with higher dividend
payments. In Model 3 we include the firm corporate governance index (ISS41), we find both the
firm-level governance index and the country-level governance index are positive and significant
at a 1% level. It further supports the outcome model and shows the importance for both firm-
level governance and country-level governance impact on the corporate dividend policy. It
implies that minority shareholders receive more dividends as the firm- and country-level
governance quality improves. In all the models, we include the same firm-control variables and
country-control variables. We also include the year dummies and industry dummies variables to
control for the heterogeneity in the multiple-year and industry sample.
_ _ _ _ _ _ _ _ _ _ _ _ _ _ _ _
Insert Table 2 here
_ _ _ _ _ _ _ _ _ _ _ _ _ _ _ _
Next, we examine the interaction between firm-governance (ISS41) and the country
governance index (shareholders’ rights denoted by AD index). Model 4 presents the relevant
results that include an interaction term ‘ISS41 × Shareholders’ rights’ to examine the dynamics
between country- and firm-level corporate governance. Our results show that the interaction term

is positive and significant at 1% level. It implies that stronger country-level governance quality
helps minority shareholders to receive more dividends if the firm operates under stronger
governance structure.
Overall, our results support the prediction of outcome hypothesis both for the firm and
country-level governance quality. Further, we find that country-level governance quality do not
overshadow the importance of firm-level governance mechanism at the international level. It
justifies the investments by a number of international firms on improving their firm-level
governance quality that is recognized by market participants. Finally, our results shed light on
how country- and firm-level governance quality interacts in firms’ payout decisions. We find that
these two governance mechanisms complement each other, which reinforces the importance of
investing and improving governance quality both at the macro (country) level and micro (firm)
level.
2. Economic significance: corporate governance and dividend amounts
We examine the economic significance of these results in Figure 1. In the graph, we plot
the predicted dividend payout ratios against ISS41 based on the Tobit model (Model 3) from
Table 2. We evaluate all independent variables at their sample medians and evaluate the fixed
effects for the year 2009 and the business service industry. All else being equal, as the ISS41
index increases from 7 to 38 (i.e., our sample range of the ISS index values), the predicted
payout ratio increases from 0.99% to 1.58% of firm assets. In relative terms, a change from
0.99% to 1.58% implies a 60% increase in dividend payout ratios.
_ _ _ _ _ _ _ _ _ _
Insert Figure 1 here
_ _ _ _ _ _ _ _ _ _ _ _ _ _ _ _
C. Valuation impact of dividend payment and firm corporate governance
Results presented in the preceding sections show support for the outcome hypothesis that
better corporate governance facilitates more dividend payouts. This is consistent with the main
argument of agency theory which contends higher dividend payout reduces the agency problem
between corporate insiders and outsiders. As La Porta et al. (2000) posit, “by paying dividends,
insiders return corporate earnings to investors and hence no longer capable of using these
earnings to benefit themselves” (p. 4). Therefore, in order to be consistent with the prediction of

outcome model, we should observe that market values dividend payments more favorably. We
examine this important issue in this section as it will provide an important link between our
empirical result supporting outcome hypothesis and the market expectations about dividend
payouts.
Accordingly, we test the dividend payment impact on firm valuation by following the
method in Pinkowitz, Stulz, and Williamson (2003) and Fama and French (1998). The market
value of equity model is specified as follows:
where Xi,t is the level of variable X in year t divided by the level of assets in year t; dXt is the
change in the level of X from year t − 1 to year t, Xt − Xt−1, divided by assets in year t; dXt+1 is
the change in the level of X from year t to year t+1, Xt+1 − Xt, divided by assets in year t; V is the
market value of the firm calculated at fiscal year-end as the sum of the market value of equity,
the book value of short-term debt, and the book value of long-term debt; NA is net assets defined
as total assets minus liquid assets and L corresponds to liquid asset holdings. E is earnings before
extraordinary items plus interest, deferred tax credits, and investment tax credits; RD is research
and development (R&D) expense. I is interest expense; and D is dividends defined as common
dividends paid. When R&D is missing, we set it equal to zero.
Since our paper focuses on the level of dividend payment and its impact on firm
valuation, we specifically test the coefficient of Dit in the model. Positive coefficient suggests a
positive impact of dividend payment on firm value while negative value suggests the opposite.
_ _ _ _ _ _ _ _ _ _ _ _ _ _ _ _
Insert Table 3 here
_ _ _ _ _ _ __ _ _ _ _ _ _ _ _
Table 3 shows the results of the test for our third hypothesis. Model 1 tests the Fama and
French (1998) model without the governance variables and country control variables. The model
is estimated based on the firm fixed effect5. We find that dividend payment amount has a
5 We choose not to use the Fama-Macbeth regression method here for several reasons (Peterson, 2009). First, our
sample contains firm-year panel data structure. There exists both cross-sectional and time-series autocorrelations.
Using Fama-Macbeth regression assumes that the yearly data are independent, which is not the case for our repeated

positive impact on firm value. The regression coefficient of Dit (β = 2.224, p < 0.01) is positive
and significant at a 1% level. It suggests that in our sample firms, international investors
generally valuate positively for high dividend payment. In model 2 we control for year, industry
and country dummy and obtain qualitatively similar results.
In order to make sure that the results are not driven by the country-level characteristics,
such as legal system and financial development, we control for the common law (vs. civil law)
legal system, financial market development, per capita GDP of the country and dividend tax
penalty in the subsequent regression model (Model 3). Our results are robust to the inclusion of
these additional controls. We find that the regression coefficient of Dit (β = 6.643, p < 0.01)
remains positive and significant at a 1% level. Further, our results show that common law
country firms and countries with better financial market development tend to have higher firm
values. However, firms with higher shareholder right index and per capita GDP tend to be
associated with lower firm value.
The above results, which show positive valuation effect of payouts, justify why a firm
with better corporate governance would pay higher dividends. These findings are in line with the
prediction of agency theory. According to the agency theory, in a firm with poor corporate
governance structure there is a higher risk that managers would extract private benefits and
would not invest extra cash in profitable business. In this context, Easterbrook (1984) focuses on
two forms of agency costs: (i) monitoring cost of managers, (ii) risk-aversion of managers, and
shows that dividend payouts could reduce such agency costs. It is costly for a firm to implement
an effective monitoring mechanism for its managers. Furthermore, as managers often have
substantial wealth tied up in their firms, they are likely to be risk-averse. Both a lack of
monitoring and a risk-averse attitude of managers would lead to lower returns for the investors.
As Easterbrook (1984) argues, dividend payments alleviate these problems. Dividend payouts
would compel a firm to go to market for external funding in subsequent periods, which subjects
the firm’s management to external scrutiny. Suppliers of additional funds would monitor
managers’ effectiveness and the risk-taking aptitude. If the managers are opportunistic and not
taking adequate risk, the new security price will reflect this (Gompers et al., 2003).
measures for the sample firms. Second, the time span of our sample is short. In our sample, we have seven years of
data, which will allow us to get average estimation of a coefficient based on only seven data points. Thus, the
average estimation of the yearly regression coefficients might not be accurate. Thus, Fama-Macbeth regression
might be less useful in corporate finance research with a shorter time span. We test our models using both fixed-
effect and random-effect models that are standard to analyze panel data structure.

D. ISS Corporate Governance Components
One of the criticisms for a broad based governance index is that the individual
components are arbitrarily chosen without any sound theoretical justification (Chhaochharia and
Laeven, 2009). Further, once the components of put together in the governance index, it is not
possible to observe the role and relative importance of different aspects of governance quality. In
order to address this issue, we follow Aggarwal et al. (2009) and examine the four major
components of the ISS corporate governance and test their impact on the corporate dividend
payment respectively.
In the ISS governance index used in this study there are 41 governance attributes that
cover four broad subcategories: (1) Board (24 attributes), (2) Audit (3 attributes), (3) Anti-
takeover (6 attributes), and (4) Compensation and Ownership (8 attributes). As Aggarwal et al.
(2009) explain, each category refers to a specific set of governance attributes, “Board attributes
attempts to capture the aspects of the functioning of the board of directors that relate to board
independence, composition of committees, size, transparency, and how work is conducted; Audit
includes questions regarding the independence of the audit committee and the role of auditors;
Anti-takeover provisions are from the firm’s charter and bylaws and refer to dual-class structure,
role of shareholders, poison pill, and blank check preferred; and Compensation and Ownership
deals with executive and director compensation issues related to options, stock ownership, and
loans, and how they are determined and monitored” (pp. 3141–3142).
As it is evident from the description of different sub-indices, various governance
components might affect the dividend payout differently. The board of directors is the most
visible and influential control mechanism for corporate governance. The board members can
directly influence a firm’s dividend policy as the board has to approve the same. Hu and Kumar
(2004) examine the relation between board independence and dividend payout; consistent with
the outcome model, they find that an independent board is associated with higher dividend
payments. Similarly, a better audit quality (Audit) in a firm imposes more control on the
managers and may compel them to pay higher dividends.
The Compensation and Ownership governance component brings in some other
interesting perspectives. According to one view, entrenched managers are likely to pay higher
dividends in order to protect themselves from disciplinary actions (Core, Holthausen and

Larcker, 1999; Hu and Kumar, 2004). Therefore it is expected that a better compensation policy
in a firm will be associated with lower dividend payments. Hu and Kumar (2004) find empirical
support for this argument. Further, Lambert, Lanen and Larcker (1989) argue that managers
holding a substantial level of stock options will be less likely to pay dividends as standard option
models show that dividend payments reduce option value. Lambert et al. (1989) and Fenn and
Liang (2001) find support for this argument. However, on the other hand, a higher score for
Compensation and Ownership sub-index’ refers that a firm’s compensation and ownership
structure is more aligned with shareholders’ interests. In such firms, managers are likely to pay
higher dividends to the shareholders which are more favorably valued by the market participants
(as shown in the previous section).
For the Anti-takeover component, the expected relationship with dividend payment is less
clear, as those components refer to the overall quality of a firm’s governance practices and do
not directly refer to any internal decision-making groups. The Anti-takeover component
primarily includes the criteria that deal with shareholders’ involvement in the decision-making
process, their power to call special meetings or the extent of anti-takeover provision adoption by
the firms. A higher score for the Anti-takeover component implies greater shareholder
involvement and prevalence of less restrictive anti-takeover provisions in the firm. There are two
views on how Anti-takeover component could affect dividend payments. According to the first
view, higher shareholder involvement could force managers to pay more dividends.
Alternatively, higher shareholder involvement and less restrictive anti-takeover provision would
enforce more monitoring of managers and increase the possibility of takeover which in turn
would act as a disciplining force for managers. Under such conditions, shareholders are likely to
rely less on dividend payments to restrict the wasteful use of cash by managers.
_ _ _ _ _ _ _ _ _ _ _ _ _ _ _ _
Insert Table 4 here
_ _ _ _ _ _ __ _ _ _ _ _ _ _ _
Table 4 (Panel A) shows the Tobit models for each sub-index and their impact on the
dividend payment ratio. Model 1 shows the board impact on dividend payment. Consistent with
the overall governance index and earlier studies (Hu and Kumar, 2004), we find board has a
positive and significant impact on the dividend payment (β = 0.014, p < 0.01). Model 2 shows

the audit index has positive and significant impact on the dividend payment (β = 0.023, p <
0.01). It implies that better audit quality exerts more monitoring pressure on managers, which in
turns result in more dividend payments. Model 3 shows a negative impact of anti-takeover index
on the dividend payment (β = -0.014, p < 0.01). Perhaps, in the firms with more investor friendly
anti-takeover provisions and greater shareholder involvement in firms’ strategic decision making
process, ned to reply less on dividend payments to discipline managers. Model 4 presents the
result for compensation index. We find that the coefficient for compensation index is positive
and significant at 1% level (β = 0.026, p < 0.01). It implies that in firms where the compensation
and ownership structure are more aligned with investors’ interests, managers are more willing to
pay dividends. Finally, we combine all sub-indices in one model (Model 5). The regression
coefficients of all sub-indices with the exception of audit index remain significant.
Overall, our results show that different governance components that are categorized
under varied constructs or themes are also associated with dividend payouts. This analysis is
useful in a number of ways. First, the effectiveness of various governance sub-indices in
explaining dividend payouts increases the reliability of overall governance index and the
inclusion of various seemingly arbitrary constituents. Second, it reveals that all governance
attributes are not homogeneous and do not affect investors expectation and managerial actions in
the same way.
Subsequently, we examine how country-level governance quality moderates the relation
between firm-level governance structure and dividend payouts. In order to examine this aspect,
we control for interaction terms (governance sub-index*country level governance quality) in the
regression models. The results are presented in Table 4 (Panel B). We find that for two sub-
indices (namely, board index and audit index), the interaction term is positive and significant.
Like overall governance index, results for these sub-indices show complementary effect of
country-level governance quality in terms of dividend payouts.
E. Robustness tests
Our main finding in the paper is the positive relation between international firm-level
governance and dividend payment amount. We also test the interaction between firm-level
governance and country-level governance and find a complementary effect between the two
levels of governance on dividend payment. In order to make sure that our results are not driven

by certain data outliers and confounding variables, we perform several robustness tests in the
following section.
1. More country-level control variables
For the brevity of the paper, we only report the main control variables in the previous
sections. Now we add more control variables into the models, which include legal system and
national culture measures. More specifically, we include the common law (vs. civil law) dummy
variable and the Hofstede (1980) culture measures, such as power distance, individualism,
masculinity, and uncertainty avoidance in the models. We also include the year dummies and
industry dummies along with the same firm-level and country-level control variables as we have
used in the main analysis.
Table 5 reports the analysis after including the legal system variable (Models 1 and 2)
and the culture variables (Models 3 and 4). Model 1 and 3 show that, after controlling for these
additional variables, both firm-level governance variable (ISS41) and country-level shareholder
right protection variable (AD) remain positive and statistically significant. The results confirm
that better corporate governance is associated with higher dividend payment. Model 2 and 4 test
the interaction between firm-governance and country governance. The regression coefficients are
positive and statistically significant.
_ _ _ _ _ _ _ _ _ _ _ _ _ _ _ _
Insert Table 5 here
_ _ _ _ _ _ _ _ _ _ _ _ _ _ _ _
2. Alternative measures of dividend payment amount
In the main analysis, we show the impact of international corporate governance on
dividend payment scaled by total assets. In order to make sure that our results are not affected by
the scaling variable of the dividend measure, we also choose net income and total sales as the
denominator to scale the dividend payment. One drawback of using net income is that the
dividend ratio is only meaningful for positive earning firms. We thus eliminate the negative
earning firm-year observations from our sample to perform this test. The sample size varies for
the different dividend payment measures due to the data availability in the Compustat Global
database.

Table 6 shows the results using dividend to earnings ratio (in Models 1 and 2) as well as
the dividend to sales ratio (in Models 3 and 4) as the dependent variables of the Tobit models. By
controlling for the same firm-level and country-level characteristics, we confirm the main
findings in the paper that both firm-level governance and country-level governance have a
positive impact on the firm dividend payment amount. Models 1 and 3 show the regression
coefficients for the main effect of ISS41 and shareholder right index are both positive and
significant at a 1% level. Using different measures of dividend payment also confirms the
positive interaction between the firm-level governance and country-level governance. Models 2
and 4 both show the positive and significant regression coefficients for the interaction terms.
_ _ _ _ _ _ _ _ _ _ _ _ _ _ _ _
Insert Table 6 here
_ _ _ _ _ _ _ _ _ _ _ _ _ _ _ _
3. Additional analysis on creditor rights and impact on dividend payment
Although our paper focuses on shareholder rights protection and related corporate
governance impact on dividend payment, it does fall into a larger topic of governance and
dividend policy, such as the extension to creditors’ rights in Brockman and Unlu (2007). In order
to show that our results also confirm with this extension of the broader literature on governance,
we test our firm-level governance measures with the credit rights impact on dividend payment.
First, we follow Brockman and Unlu (2007) and test the country-level creditor rights
impact on the corporate dividend payment amount. Table 7 Model 1 shows the Tobit model
results. Our results confirm their finding that the firms in the countries with stronger creditor
rights tend to pay more dividends. We then test the interaction between the firm-governance and
the country’s creditor rights. The Tobit model in Model 2 shows a positive coefficient and
significant at 1%. It does confirm a significant complementary effect between the firm-level and
country-level governance structure in terms of corporate dividend payment.
_ _ _ _ _ _ _ _ _ _ _ _ _ _ _ _
Insert Table 7 here
_ _ _ _ _ _ _ _ _ _ _ _ _ _ _ _
4. Various estimation methods

Our main analyses so far are primarily based on the panel data regression (random effect)
model which is appropriate for our sample with both firm-level and time-level dimensions.
However, we also note that the dividend payment measure has a truncated distribution feature.
As a robustness check, we run the tobit models6. We could have used fixed-effect in Tobit
regressions, but this is “not advisable econometrically as unconditional fixed-effects Tobit
estimates are not unbiased” (Jiraporn et al. (2011) p. 267). Table 8 shows the results based on
these methodologies. Model 1 presents the tobit model with the firm-level control variables only.
We find cash holdings and book value of equity to assets lost statistical significance in the fixed-
effect model. However, we still find the firm-level governance variable (ISS41) remains positive
and significant (β = 0.070, p < 0.01). Model 2 adds the country-level governance variables
(including the shareholder right index). Since these variables do not vary by year or firm, we
present the random-effect model results. Both firm-level governance (ISS41) and country-level
governance (AD) have positive and significant impact on the dividend payment amount. Model 3
shows the random effect for the interaction between the firm-level and country-level governance
variables. The results confirm the positive interaction between the two governance measures.
Our main findings are supported by using the panel data regression methods.
_ _ _ _ _ _ _ _ _ _ _ _ _ _ _ _
Insert Table 8 here
_ _ _ _ _ _ _ _ _ _ _ _ _ _ _ _
As a further robustness check, we also use the multi-level models (considering firm-level
variables as the level 1 variables and country-level variables as the level 2 variables). We use the
xtmixed package in STATA (Rabe-Hesketh and Skrondal, 2008) to perform the multi-level
analysis to examine the interaction between firm-level governance and the country-level
governance variables. We find similar results as reported earlier in the paper.
In addition, we also employed the traditional pooled OLS regression with clustered
standard errors by firm and country. The results are also similar to the main findings in the paper
and are available upon request.
6 To address the truncated distribution issue, we also tried the logistic transformation using ln [x/(1-x)] and run the
pooled OLS regression and panel data regression. Our main hypotheses are still supported and statistical
significance is similar. For the brevity of the paper, we do not report the results in tables. The results are available
upon request.

5. Correction for the sample selection bias
As we mentioned above, our sample may not represent a general firm in the international
countries due to the limitation of the sample firms covered by the ISS database. This leads to
non-random sample selection problem (Reeb, Sakakibara, and Mahmood, 2012). In order to
correct for the sample selection bias, we follow the Heckman (1979) two-steps method in these
robustness tests.
First we download all firms in the countries and industries that are covered in our study
(see Panel B and C in Table 1) from the Compustat Global and North American database. There
are 135,587 firm-year observations (and 29,040 unique firms) with the complete information of
the key financial variables we examine in the study, such as dividend-to-assets ratio, retained
earnings, returns on assets, equity to assets, sales growth, cash holdings and firm size. We then
create a dummy variable which is 1 for the firm-year observations that were included in our main
analysis (Compustat and ISS matched) and 0 for the rest of Compustat sample. We regress the
dummy variable on the firm characteristics, year dummies, country dummies and industry
dummies. We estimate the predicted value of the probit model and include this value (i.e.,
probability of the observation included in our sample) in the second stage of the models (i.e., the
Tobit models that test the impact of firm and country governance on dividend payment amount).
We found that the sample firms covered by the ISS dataset have substantially different firm
characteristics than the general firms in the Compustat Global database. More specifically, we
find that our samples tend to pay more dividends, have larger size, more retained earnings (i.e.,
more mature), slower growth, more equity, and more cash holdings than the general firms in
those 29 countries.
Subsequently we run the second stage of the model by including the Inverse Mill’s Ratio
(IMR) as an additional control variable in the dividend payment models. We find the IMR
variable is highly significant, which suggests the need to control for the sample selection bias in
our sample. After controlling for the IMR, both governance variables remain positive and
significant at a 1% level. It confirms our main finding in the paper that better corporate
governance is associated with higher dividend payment in the international firms. We further
tests the interaction term between the firm-governance and country governance variables. The
interaction term is still positive and significant at a 1% level after controlling for the sample

selection bias. It again supports our main finding stated in previous sections. The results are not
presented for brevity.
6. Other possible endogenous bias
In the analysis so far, we focus on the one-way impact of corporate governance on the
dividend policy. One may argue that both dividend policy and corporate governance are
endogenously determined and that there is another effect from dividend policy to corporate
governance. However, the other effect is unlikely because dividends are more at managerial
discretion than corporate governance. A significant change of corporate governance needs the
approval of shareholders and takes much longer than dividend decisions. Therefore, the direction
is more likely to be that corporate governance affects dividends rather than the other way around.
This assumption is supported by the literature. John and Knyazeva (2006) report empirical
evidence supporting that causality likely goes from governance to dividend payouts. Ciceksever,
Kale, and Ryan (2006) report that managers take governance structure as predetermined.
Notwithstanding the above arguments, we attempt to address this potential endogeneity
bias in two ways. First, in all analyses, we use a one-year lagged ISS41 index for each firm to
test its impact on the dividend payment amount. Our results so far suggest that the lagged
variable has significant impact on the dividend policy. Second, we follow Jiraporn et al. (2011)
and use the two-stage least squares (2SLS) approach. We regress firm-level governance on an
instrument in the first stage and then use the predicted value from the first stage as an
independent variable in the second stage. The instrument must be correlated with corporate
governance, but not correlated with dividends except through the channel of other independent
variables. We follow John and Knyazeva (2006), John and Kadyrzhanova (2008), and Jiraporn et
al. (2011) to employ country-industry-median ISS41 index as our instrument. The country-
industry median is correlated with corporate governance due to peer effect as firms compare
themselves to the median. But the country-industry-median ISS41 index is uncorrelated to the
dividend policy because a firm’s dividend decision may be related to its own corporate
governance, but unlikely to be correlated with other firms’ governance.
Table 9 (Panel A) reports the 2SLS results. Model 1 shows the first-stage regression
results. The country-industry-median ISS41 index is highly positive and significant, implying
that it significantly explains firm-level governance, consistent with the findings in John and

Kadyrzhanova (2008). Model 2 and Model 3 show the second-stage regression with the ratio of
dividends to total assets to be the dependent variable. Model 2 shows the coefficient of predicted
firm-level ISS41 index is positive and significant, confirming our earlier findings. In addition,
the shareholder right index is also positive and significant. Both suggest that firm-level and
country-level governance have a positive impact on the dividend payment amount. Model 3 adds
the interaction between the predicted firm-level ISS41 index and the country’s shareholder right
index to the independent variables. The coefficient of the interaction term confirms the positive
sign and statistical significance that we found in the analysis before. In other words, the 2SLS
regression models confirm earlier findings.
Another type of endogeneity is simultaneity. Both dividend payouts and governance
quality could be simultaneously determined by omitted variables, causing a spurious association
between dividend payouts and governance quality. To control simultaneity, we apply two
approaches. One is a fixed-effects regression, which assigns a dummy variable to each firm. In
this way, firm-specific variables that are not included in the regression are controlled. This is
already tested in Model 1 in Table 8 and similar results are reported. The second approach
includes lagged dividend payouts as an independent variable in the regression models. The
lagged dividend payouts should catch the unobservable firm-specific characteristics that may be
omitted in the models. As shown in Model 1 in Table 9 (Panel B), the results again confirm
earlier findings. To sum up, all the robustness tests obtain similar results – corporate governance
affects dividend payout positively.
_ _ _ _ _ _ _ _ _ _ _ _ _ _ _ _
Insert Table 9 here
_ _ _ _ _ _ _ _ _ _ _ _ _ _ _ _
7. Exclusion of U.S. firms
Since 68% of our sample is composed of U.S. firms (due to the over-representation of
U.S. firms in the ISS database), we repeat our analysis excluding the U.S. firms from our
international firm sample. We perform the same Tobit model as in the main analysis in the
previous section. In the results, shown in Table 10 below, the regression coefficients of the firm-
level governance and country-level governance remain positive and statistically significant. The
interaction between the two governance variables is positive and significant. This suggests that
our main results are not driven by a single-country data.

_ _ _ _ _ _ _ _ _ _ _ _ _ _ _ _
Insert Table 10 here
_ _ _ _ _ _ _ _ _ _ _ _ _ _ _ _
8. Individual measures of corporate governance
So far in our analysis, we have considered the overall governance index (ISS41) and its
sub components while examining the impact of corporate governance on dividend payouts. This
approach allows us to compare and contrast the overall governance quality of the firms across
different countries. However, some other studies have questioned the validity of an overarching
governance index and recommended using important individual governance characteristics
instead (e.g., Bebchuk, Cohen, and Ferrell, 2009; Daines, Gow, and Larcker, 2010).
Accordingly, we follow Aggarwal et al. (2011) and examine the seven individual governance
attributes that have been most studied in the literature and among policy makers. These items are
highlighted in Appendix 1 and include: board independence (item 3), board size (item 4),
CEO/chairman separation (item 7), and the absence of a staggered board (item 12); the
independence of firm auditors (item 26), and ratification of auditors (item 27); and the existence
of multiple share classes (item 28). Table 11 presents the relevant results.
_ _ _ _ _ _ _ _ _ _ _ _ _ _ _ _
Insert Table 11 here
_ _ _ _ _ _ _ _ _ _ _ _ _ _ _ _
Out of these seven individual governance mechanisms, we find that four factors show
significant association with dividend payout (board independence, board size, CEO/chairman
separation, and the absence of a staggered board; and the existence of multiple share classes).
However, we find that single class stock variable show negative association. These results again
indicate that all governance factors are not homogeneous and affect dividend payouts different.
Overall, we find that majority of the significant governance factors have a positive impact on
dividend payout.
9. Consideration of share repurchases

Another way of distributing cash by firms is through share repurchases. While share
repurchase has become more popular over the years, non-U.S. firms do not repurchase shares as
much as U.S. firms do (Lee and Suh, 2009). Furthermore, it is still debated whether share
repurchase is used as a substitution for cash dividend payments as a number of studies report that
firms repurchasing shares also pay dividends (Denis and Osobov, 2008). Notwithstanding this
debate, in order to ensure the robustness of our results, we repeat our main analysis by
considering total dividend payment (cash dividend plus share repurchase) as the dependent
variable. We follow Bliss, Cheng and Denis (2013) in order to create the stock repurchase and
total dividend payout variable. Table 12 presents the relevant results.
_ _ _ _ _ _ _ _ _ _ _ _ _ _ _ _
Insert Table 12 here
_ _ _ _ _ _ _ _ _ _ _ _ _ _ _ _
Model 1 presents the basic regression model with the control variables; Model 2 includes
the impact of country-level governance variable (shareholders’ rights); Model 3 adds the effect
of firm-level governance variable (ISS41), while Model 4 includes the interaction effect between
country- and firm-level governance variable. Based on Model 2 and Model 3 results we find that
both country- and firm-level governance quality affect the dividend payout significantly and
positively. These results confirm our earlier findings that stronger governance structure is
associated with higher dividend payout. However we find that the interaction effect is not
significant once we consider the total divided as a dependent variable. There could be a number
of reasons for observing this insignificant interaction effect. First, stock repurchase is less
prevalent among international firms (other than U.S. firm) hence there is less power in the test.
Second, stock repurchase is discretionary and hence there might not be any systematic interplay
between country- and firm-level governance structure in terms of influencing the payout
decisions.
V. Conclusions
We examine the effect of firm-level corporate governance on dividend policies of a large
sample of firms representing 29 different countries. Consistent with Aggarwal et al. (2009), we
use ISS governance index (with 41 attributes) as a measure of firm-specific governance quality.
We find that, after controlling for country-level governance quality, firms with better corporate

governance tend to pay higher dividends. This finding is consistent with the outcome hypothesis
as presented by La Porta et al. (2000). Earlier international studies on the same subject matter
used country-level governance variables and found that country-level governance quality (such
as legal system, creditor rights) affect a firm’s dividend policy. However, our results show that
country-level variables alone do not explain the overall governance effect on a firm’s dividend
policy. Instead, our sample shows a significant variation in firm-level governance quality within
each country. It is expected that these firms would have different approaches with regard to their
dividend policies. Our results confirm this prediction.
While country-level governance quality and firm-specific governance structure both
affect a firm’s dividend policy independently, we argue that there will be interdependence
between these two levels of governance environment. In fact, our results show that in a country
with a better legal environment (i.e., better governance quality), firm-specific governance
structure has a higher influence on dividend payouts. This is an interesting result, as it shows that
in countries with better governance quality, minority shareholders extract more cash dividends
from firms with better internal governance structure.
Finally, we also examine how markets value dividend payouts in the context of a firm’s
governance structure. Our results show that investors value dividends at premium in the firms
with weaker firm-level corporate governance. Overall our findings suggest the following: (i)
internationally, firms with better governance pay higher dividends; (ii) country-level and firm-
level governance quality complement each other in dividend payouts; (iii) consistent with the
agency theory, shareholders value dividends more favorably. Our results are robust to a set of
country-level and firm-level control variables. While this study presents some useful and
interesting evidences, the results should be viewed with caution. Given that ISS database covers
primarily large firms, the sample used in this study is biased towards large firms.

References
Abdi, M., & Aulakh, P. 2012. Do country-level institutional frameworks and interfirm
governance arrangements substitute or complement in international business
relationships. Journal of International Business Studies, 43(5): 477–497.
Aggarwal, R., I. Erel; R. Stulz; and R. Williamson. “Differences in Governance Practices
between U.S. and Foreign Firms: Measurement, Causes, and Consequences.” Review of
Financial Studies, 22 (2009), 3131–3169.
Aggarwal, R.; I. Erel; M. Ferreira; and P. Matos. “Does Governance Travel Around the World?
Evidence from Institutional Investors.” Journal of Financial Economics, 100 (2011),
154–181.
Aivazian, V.; L. Booth; and S. Cleary. “Do Emerging Market Firms Follow Different Dividend
Policies from U.S. Firms.” Journal of Financial Research, 26 (2003), 371–387.
Amihud, Y., and K. Li. “The Declining Information Content of Dividend Announcements and
the Effect of Institutional Holdings.” Journal of Financial and Quantitative Analysis, 41
(2006), 637–660.
Booth, L.; B. Chang; and J. Zhou. “Import Competition and Disappearing Dividend.” Journal of
International Business Studies, 44 (2013), 138–154.
TJ Boulton, SB Smart, CJ Zutter. 2010. IPO underpricing and international corporate
governance. Journal of International Business Studies 41 (2), 206-222.
Bhattacharya, S. “Imperfect Information, Dividend Policy and the Bird in the Hand Fallacy.”
Bell Journal of Economics, 10 (1979), 259–270.
Bliss, B.; Y. Cheng; and D.J. Denis. “Corporate payout, cash retention, and the supply of credit:
evidence from the 2008-09 credit crisis.” University of Pittsburgh working paper (2013).
Borokhovich, K. A.; K. R. Brunarski; Y., Harman; and J. B. Kehr. “Dividends, Corporate
Monitors and Agency Costs.” Financial Review, 40 (2005), 37–65.
Brealey, R. A.; S. C. Myers,; and F. Allen. Principles of Corporate Finance. McGraw-Hill/Irwin
(2008).
Brockman, P., and E. Unlu. “Dividend Policy, Creditor Rights, and the Agency Costs of Debt.”
Journal of Financial Economics, 92 (2009), 276–299.
Chang, B., and S. Dutta. “Dividends and Corporate Governance.” The IUP Journal of Applied
Finance, 18(2012), 5–30.

Core, J. E.; R. W. Holthausen; and D. F. Larcker. “Corporate Governance, Chief Executive
Officer Compensation, and Firm Performance.” Journal of Financial Economics, 51
(1999), 371–406.
Demirguc-Kunt, A., and R. Levine. “Stock Market Development and Financial Intermediaries:
Stylized Facts.” World Bank Economic Review, 10 (1996), 291–321.
Denis, D. J., and I. Osobv. “Why Do Firms Pay Dividends? International Evidence on the
Determinants of Dividend Policy.” Journal of Financial Economics, 89 (2008), 62–82.
Djankov, S.; C. McLiesh; and A. Shleifer. “Private Credit in 129 Countries.” Journal of
Financial Economics, 84 (2007), 299–329.
Djankov, S.; R. La Porta; F. Lopez-de-Silanes; and A. Shleifer. “The Law and Economics of
Self-dealing.” Journal of Financial Economics, 88 (2008), 430–465.
Doidge, C., G. A. Karolyi; and R. M. Stulz. “Why do Countries Matter So Much for Corporate
Governance?” Journal of Financial Economics, 86 (2007), 1–39.
Dutta, S., and S. Saadi. “Dividend Policy and Corporate Governance.” In H.K. Baker (Ed.), The
Blackwell Companion to Dividends and Dividend Policy. Blackwell Publishing, Boston,
(2009), 447–462.
Easterbrook, F. H. “Two Agency-cost Explanations of Dividends.” American Economic Review
74 (1984), 650–659.
Faccio, M.; L. H. P. Lang; and L. Young. “Dividends and Expropriation.” American Economic
Review, 91(2001), 54–78.
Fama, E. F.; and K. R. French. “Disappearing Dividends: Changing Firm Characteristics or
Lower Propensity to Pay?” Journal of Financial Economics, 60 (2001), 3–43.
Fama, E. F., and M. C. Jensen. “Separation of Ownership and Control.” Journal of Law and
Economics, October (1983), 301–326.
Fama, E. F., and K. R. French. “Taxes, Financing Decisions, and Firm Value.” Journal of
Finance, 53 (1998), 819–843.
Fenn, G.W., and N. Liang. “Corporate Payout Policy and Managerial Stock Incentives.” Journal
of Financial Economics, 60 (2001), 45–72.
Ferris, S.; N. Jayaraman; and S. Sabherwal. “Catering Effects in Corporate Dividend Policy: The
International Evidence.” Journal of Banking and Finance, 33 (2009), 1730–1738.

Gompers, P., J., Ishii, and A. Metrick. “Corporate Governance and Equity Prices.” Quarterly
Journal of Economics, 118 (2003), 107–155.
Grinstein, Y., and A. Palvia. “Executive Loans, Corporate Governance, and Firm Performance:
Evidence from Banks.” Working Paper, Cornell University (2006).
Grullon, G., and Michaely, R. “Corporate Payout Policy and Product Market Competition.”
Working Paper, Cornell University (2007).
Ilir Haxhi and Hans van Ees. 2010. Explaining diversity in the worldwide diffusion of codes of
good governance. Journal of international business studies, 41( 4), 710-726.
Heckman, J. “Sample Selection Bias as a Specification Error.” Econometrica 47 (1979), 153–61.
Hofstede, G. Culture’s Consequences: International Differences in Work-Related Values.
Beverly Hills, CA: Sage (1980).
Hu, A., and P. Kumar. “Managerial entrenchment and payout policy.” Journal of Financial and
Quantitative Analysis, 39 (2004), 759–790.
Jacob, M., and Jacob, M. "Taxation, dividends, and share repurchases: Taking evidence global."
Journal of Financial and Quantitative Analysis, 48 (2013), 1241-1269.
Jensen, M. C. “Agency Costs of Free Cash Flow, Corporate Finance, and Takeovers.” American
Economic Review, 76 (1986), 323–329.
Jiraporn, P., and Y. Ning. “Dividend Policy, Shareholder Rights, and Corporate Governance.”
Journal of Applied Finance, 16 (2006), 24–36.
Jiraporn, P.; J. Kim; and Y. S. Kim. “Dividend Payouts and Corporate Governance Quality: An
Empirical Investigation.” The Financial Review, 46 (2011), 251–279.
John, K.; and A. Knyazeva. “Payout Policy, Agency Conflicts and Corporate Governance.”
Working Paper, New York University (2006).
John, K.; and D. Kadyrzhanova. “Peer Effects in Corporate Governance.” Working Paper, New
York University (2006).
John, K., and J. Williams. “Dividends, Dilution, and Taxes: A Signaling Equilibrium.” Journal
of Finance, 40 (1985), 1053–1070.
Kalay, A., and U. Lowenstein. “The Informational Content of the Timing of Dividend
Announcements.” Journal of Financial Economics, 16 (1986), 373–388.
Kaufmann, D.; A. Kraay; and M. Mastruzzi. “Governance Matters III: Governance Indicators for
1996–2002.” Working Paper, World Bank Policy Research (2003).

Khanna, T.; Kogan, J; and K. Palepu. “Globalization and Similarities in Corporate Governance:
A Cross Country Analysis.” The Review of Economics and Statistics, 88 (2006), 69-90.
La Porta, R.; Lopez-De-Salinas; F., Shleifer, A.; and R. Vishny. Law and Finance.” Journal of
Political Economy, 106 (1998), 1113–1155.
La Porta, R.; F. Lopez-De-Salinas; A. Shleifer; and R. Vishny. “Agency Problems and Dividend
Policy around the World.” Journal of Finance, 55 (2000), 1–33.
Lambert, R.A.; N. L. William; and D. F. Larcker. “Executive Stock Option Plan and Corporate
Dividend Policy.” Journal of Financial and Quantitative Analysis, 24 (1989), 409–425.
Lasfer, M.; and M. Alzahrani. “The Impact of Taxation on Dividends: A Cross-country
Analysis.” Financial Management Association Meeting, Dallas, Texas (2008).
Lee, B.S.; and J. Suh. “Cash Holdings and Share Repurchase: International Evidence.” Journal
of Corporate Finance 17:5 (2011), 1306-1329.
Licht, A. N.; C. Goldschmidt; and S. H. Schwartz. “Culture, Law, and Corporate Governance.”
International Review of Law and Economics, 25 (2005), 229–255.
Luo, Xiaowei Rose, Chi-Nien Chung, and Mike Sobczak. 2009. How Do Corporate Governance
Model Differences Affect Foreign Direct Investment in Emerging Economies? Journal of
International Business Studies 40: 444-467.
Mitton, T. “Corporate Governance and Dividend Policy in Emerging Markets.” Emerging
Market Reviews, 5 (2004), 409–426.
Morck R.; B. Yeung; and W. Yu. “The Information Content of Stock Markets: Why do
Emerging Markets have Synchronous Stock Price Movements?” Journal of Financial
Economics, 58 (2000), 215–260.
Nissim, D., and A. Ziv, “Dividend Changes and Future Profitability.” Journal of Finance, 56
(2001), 2111–2133.
Officer, M. “Dividend Policy, Dividend Initiations, and Governance.” Working Paper,
University of Southern California (2006).
Peterson, M. A. “Estimating Standard Errors in Finance Panel Data Sets: Comparing
Approaches.” Review of Financial Studies, 22 (2009), 435–480.
Pinkowitz, L.; R. Stulz; and R. Williamson. “Does the Contribution of Corporate Cash Holdings
and Dividends to Firm Value Depend on Governance? A Cross-country Analysis.”
Journal of Finance, 61(2006), 2725–2751.

Rabe-Hesketh, S and A. Skrondal, (2008). Multilevel and Longitudinal Modeling Using Stata.
Second Edition, Stata Press (2008).
Reeb, D.; M. Sakakibara; and I. P. Mahmood. 2012. “From the editors: Endogeneity in
international business research.” Journal of International Business Studies, 43(2012),
211–218.
Ross, S. “The Determination of Financial Structure: The Incentive-signaling Approach.” Bell
Journal of Economics, 8 (1977), 23–40.
Shao, L.; C.C.Y. Kwok; and O. Guedhami. “National Culture and Dividend Policy?” Journal of
International Business Studies, 41 (2010), 1391-1414.
Zheng, X.; S. E. Ghoul; O. Guedhami and C.C.Y. Kwok. “Collectivism and Corruption in Bank
Lending” Journal of International Business Studies, 44 (2013), 363–390.

Table 1: Sample Description
Panel A. Descriptive statistics and correlations
Table 1 Panel A shows the descriptive statistics of the main variables in the study. Dividend to assets is the ratio of
the cash dividend divided by the total assets for each sample firm in each fiscal year-end between 2003 and 2009;
ISS41 is based on the 41 corporate governance measures of each sample firms in each year during the sample
period; AD is the shareholders' right index for each sample country collected from Djankov, La Porta, Lopez-de-
Silanes, and Shleifer (2008). Firm life cycle is the ratio of retained earnings divided by the total assets; book equity
is the ratio of book value of equity divided by total assets; ROA is the return on total assets; sales growth measures
the yearly percentage change in the revenue for each sample firm; cash holding is the percentage of cash assets
divided by total assets; country per capita GDP is collected for each sample from the World Development Indicator
database for each sample year between 2003 and 2009; Financial market development is the ratio of stock market
capitalization divided by the GDP of the country in each sample year; dividend tax penalty is collected from Jacob
and Jacob (2013) to capture the tax rate difference between dividend and capital gain in various countries; common
law is a dummy variable which equals 1 if the country has a common law system, otherwise the variable equals 0
(such as civil law system); the four culture measures are taken from the Hofstede website (http://geert-
hofstede.com/), including power distance, individualism, masculinity and uncertainty avoidance. We show the mean
and standard deviation statistics for each variable in the following table. We also report the Pearson correlation
coefficient between each pair of variables in the table. Variables 1 2 3 4 5 6 7 8 9 10 11 12 13 14 15 16 17
1 Dividend to assets 1.000
2 ISS41 0.062 1.000
(0.000) 3 Shareholder's right 0.311 0.210 1.000
(0.000) (0.000) 4 Firm life cycle 0.347 0.039 0.102 1.000
(0.000) (0.000) (0.000)
5 Book equity -0.029 -0.006 -0.094 0.020 1.000
(0.000) (0.325) (0.000) (0.001)
6 ROA 0.315 -0.023 0.134 0.434 0.047 1.000
(0.000) (0.000) (0.000) (0.000) (0.000) 7 Sales growth -0.077 -0.014 -0.006 -0.068 0.051 0.176 1.000
(0.000) (0.019) (0.307) (0.000) (0.000) (0.000)
8 Firm size 0.247 0.033 0.230 0.366 -0.356 0.377 -0.020 1.000
(0.000) (0.000) (0.000) (0.000) (0.000) (0.000) (0.001)
9 Cash holding -0.119 0.022 -0.135 -0.218 0.440 -0.242 0.030 -0.359 1.000
(0.000) (0.000) (0.000) (0.000) (0.000) (0.000) (0.000) (0.000) 10 Country per capita GDP -0.285 0.202 -0.308 0.026 0.140 -0.117 0.025 -0.215 0.142 1.000
(0.000) (0.000) (0.000) (0.000) (0.000) (0.000) (0.000) (0.000) (0.000)
11 Financial market development -0.004 0.047 0.173 -0.019 0.096 0.027 0.097 -0.093 0.053 0.164 1.000
(0.476) (0.000) (0.000) (0.001) (0.000) (0.000) (0.000) (0.000) (0.000) (0.000)
12 Dividend tax penalty -0.058 -0.104 -0.262 -0.033 -0.051 0.008 -0.031 0.125 -0.026 -0.202 -0.246 1.000
(0.000) (0.000) (0.000) (0.000) (0.000) (0.151) (0.000) (0.000) (0.000) (0.000) (0.000) 13 Common law -0.195 0.548 -0.167 -0.150 0.129 -0.133 0.115 -0.412 0.135 0.300 0.181 -0.299 1.000
(0.000) (0.000) (0.000) (0.000) (0.000) (0.000) (0.000) (0.000) (0.000) (0.000) (0.000) (0.000)
14 Culture - power distance 0.030 -0.329 0.104 0.048 -0.026 0.051 -0.064 0.228 -0.043 -0.157 0.040 0.119 -0.591 1.000
(0.000) (0.000) (0.000) (0.000) (0.000) (0.000) (0.000) (0.000) (0.000) (0.000) (0.000) (0.000) (0.000)
15 Culture - individualism -0.168 0.523 -0.341 -0.157 0.083 -0.128 0.101 -0.395 0.118 0.257 0.063 -0.243 0.899 -0.697 1.000
(0.000) (0.000) (0.000) (0.000) (0.000) (0.000) (0.000) (0.000) (0.000) (0.000) (0.000) (0.000) (0.000) (0.000) 16 Culture - masculinity -0.099 -0.221 0.048 0.108 0.034 -0.000 -0.056 0.109 0.011 0.340 -0.112 -0.021 -0.237 0.353 -0.402 1.000
(0.000) (0.000) (0.000) (0.000) (0.000) (0.977) (0.000) (0.000) (0.071) (0.000) (0.000) (0.000) (0.000) (0.000) (0.000)
17 Culture - uncertainty avoidance 0.014 -0.449 -0.075 0.104 -0.078 0.063 -0.110 0.315 -0.090 -0.098 -0.374 0.278 -0.744 0.602 -0.697 0.591 1.000
(0.021) (0.000) (0.000) (0.000) (0.000) (0.000) (0.000) (0.000) (0.000) (0.000) (0.000) (0.000) (0.000) (0.000) (0.000) (0.000)
Mean 0.01 21.731 3.232 0.392 0.517 0.006 0.084 6.48 0.181 10.462 119.495 0.009 0.777 41.964 82.117 63.718 52.313
S.D. 0.015 5.626 0.558 0.369 0.205 0.126 0.207 2.042 0.179 0.211 50.536 0.074 0.416 7.864 17.074 14.498 17.19

Panel B. Sample descriptions by country
Panel B shows the count of sample observations by the 29 sample countries and the seven sample years. The full
sample of the study contains 28,686 firm-year observations.
Country / Year 2003 2004 2005 2006 2007 2008 2009
Grand
Total
Australia 50 50 73 75 68 54 54 424
Austria 13 11 10 11 11 14 13 83
Belgium 16 12 17 17 18 19 17 116
Canada 128 124 105 102 95 115 118 787
China
6 5 11
Denmark 20 19 16 16 14 20 14 119
Finland 25 25 24 26 26 27 31 184
France 72 64 61 62 61 60 55 435
Germany 72 63 55 55 52 61 59 417
Hong Kong 9 10 28 29 27 23 23 149
India 1 2 1 1
5
Ireland 10 8 15 17 16 17 15 98
Israel 1
2 3 1 2 2 11
Italy 37 25 31 32 30 36 26 217
Japan 396 407 462 465 459 532 516 3,237
Korea
10 9 29 48
Netherlands 42 39 33 36 34 33 31 248
New Zealand 11 11 12 12 8 10 13 77
Norway 18 20 13 12 11 14 14 102
Philippines 1 1
2
Portugal 11 9 9 8 8 10 11 66
Singapore 32 32 33 31 32 38 33 231
Spain 22 14 32 32 30 30 22 182
Sweden 32 33 27 27 27 32 29 207
Switzerland 42 43 40 43 41 43 39 291
Thailand
1 1 2
Turkey
32 32
United Kingdom 28 30 199 285 273 287 236 1,338
United States 3,093 2,953 2,877 2,819 2,586 2,666 2,573 19,567
Grand Total 4,182 4,005 4,175 4,216 3,938 4,159 4,011 28,686

Panel C. Sample description by industry
Panel C shows the count of sample observations by the 44 sample industries and the seven sample years. The full
sample contains 28,686 firm-year observations. The industry classification is based on Fama and French (1993).
Industry / Year 2003 2004 2005 2006 2007 2008 2009
Grand
Total
Agriculture 16 16 10 10 10 14 12 88
Aircraft 26 26 29 28 28 31 32 200
Alcoholic Beverages 13 13 13 14 14 15 13 95
Apparel 67 66 67 66 67 67 63 463
Automobiles and Trucks 93 89 91 98 95 100 97 663
Business Services 569 519 529 528 469 508 480 3,602
Business Supplies 61 58 60 58 56 55 57 405
Candy and Soda 15 18 21 24 23 21 20 142
Chemicals 132 128 135 133 135 140 137 940
Coal 7 6 7 9 9 10 10 58
Computers 228 201 196 187 160 175 164 1,311
Construction 75 72 89 97 94 95 101 623
Construction Materials 97 92 107 108 100 95 99 698
Consumer Goods 87 80 91 89 86 81 75 589
Defense 8 9 9 9 9 8 7 59
Electrical Equipment 57 56 60 61 57 63 58 412
Electronic Equipment 293 295 296 294 270 281 273 2,002
Entertainment 62 56 61 58 53 59 57 406
Fabricated Products 9 11 9 9 9 9 8 64
Food Products 78 73 81 87 87 88 83 577
Healthcare 64 66 68 69 66 77 67 477
Machinery 189 176 180 177 162 181 173 1,238
Measuring and Control Equip 107 111 103 104 103 105 96 729
Medical Equipment 158 153 148 154 134 140 136 1,023
Miscellaneous 48 47 55 55 48 45 49 347
Nonmetallic Mining 25 26 27 33 35 43 44 233
Personal Services 40 37 40 40 38 41 42 278
Petroleum and Natural Gas 158 152 168 174 172 206 199 1,229
Pharmaceutical Products 264 259 266 271 241 234 244 1,779
Precious Metals 15 13 11 13 13 21 26 112
Printing and Publishing 39 42 43 52 50 50 39 315
Recreational Products 46 45 43 43 37 39 36 289
Restaurants, Hotel, Motel 89 87 94 87 79 90 75 601
Retail 268 262 278 281 266 264 257 1,876
Rubber and Plastic Products 39 35 35 32 31 33 28 233
Shipbuilding, Railroad Equip 11 10 11 13 11 14 16 86
Shipping Containers 16 15 17 18 18 17 18 119
Steel Works, Etc. 85 80 80 75 76 86 89 571
Telecommunications 156 150 154 157 145 149 150 1,061
Textiles 19 17 20 19 17 16 13 121
Tobacco Products 31 26 27 29 27 28 24 192
Transportation 138 140 154 162 156 174 166 1,090
Utilities 25 26 29 28 24 28 26 186
Wholesale 159 146 163 163 158 163 152 1,104
Grand Total 4,182 4,005 4,175 4,216 3,938 4,159 4,011 28,686

Panel D. Firm-level governance statistics by country
Panel D shows the dispersion of the firm-level governance measure (ISS41) by 29 sample countries and the
corresponding country-level governance measure (shareholder's right index “AD”) for each country. The first
column shows the number of firm-year observations; column 2 shows the mean value of the firm-level governance
measure by country; the third and fourth columns show the minimum and maximum values of the firm-level
governance measures in each country; the fifth column shows the standard deviation of the ISS41 governance
measure in each country; the last column shows the shareholder's right index measure for each sample country.
Country
Number of
Observations
ISS41 -
Mean
ISS41 -
Min
ISS41 -
Max
ISS41 - Std
Dev
Shareholders'
rights index
Australia 424 18.46 10 26 2.16 4.00
Austria 83 17.24 11 29 3.38 2.50
Belgium 116 14.98 10 21 2.54 2.00
Canada 787 23.99 15 32 3.08 4.00
China 11 20.27 17 24 1.95 1.00
Denmark 119 15.83 10 23 3.10 4.00
Finland 184 19.52 11 28 4.39 3.50
France 435 17.63 8 25 2.94 3.00
Germany 417 17.48 11 27 3.24 2.50
Hong Kong 149 17.09 7 29 3.06 5.00
India 5 23.20 19 27 3.90 5.00
Ireland 98 21.90 9 32 5.63 4.00
Israel 11 19.82 16 25 3.28 4.00
Italy 217 15.97 9 24 3.05 2.50
Japan 3,237 14.66 11 23 1.62 3.50
Korea 48 19.10 13 24 2.99 3.50
Netherlands 248 17.83 10 26 3.91 3.00
New Zealand 77 17.29 13 23 2.00 4.00
Norway 102 15.29 10 26 3.46 3.50
Philippines 2 23.50 21 26 3.54 3.00
Portugal 66 13.30 9 18 1.93 2.50
Singapore 231 17.17 9 23 2.93 5.00
Spain 182 16.68 9 22 3.40 5.00
Sweden 207 16.83 10 24 3.79 3.50
Switzerland 291 19.63 11 32 4.51 3.00
Thailand 2 15.00 15 15 0.00 4.00
Turkey 32 15.63 8 19 2.30 2.00
United Kingdom 1,338 20.47 11 27 2.77 5.00
United States 19,567 23.70 8 38 5.17 3.00
Grand Total 28,686 21.73 7 38 5.63 3.23

Table 2. International Corporate Governance and Dividend Payment
Table 2 shows the panel data regression (random effect) models to test the impact of country-level and firm-level
governance impact on the dividend payment amount. The dependent variable is the cash dividend divided by the
total assets ratio. Model (1) shows the regression with only control variables. Model (2) tests the country-level
governance (proxied by the shareholders' right index “AD”) impact on the corporate dividend payment. Finally,
Model (3) includes the firm-level governance measure (“ISS41”) and tests its impact on the corporate dividend
payment after controlling for the country-level governance as well as the other control variables in the model. All
models include year and industry fixed effects. Robust standard errors are reported in the parentheses. *, **, and ***
denote statistical significance
at the 10%, 5%, and 1% levels, respectively.
Panel Data Regression Models (1) (2) (3) (4)
Cash Dividend / Assets Model Model Model Model
ISS41 X Shareholders' rights
0.011***
(0.004)
ISS41
0.009*** -0.024**
(0.002) (0.011)
Shareholders' rights
4.621*** 4.745*** 4.512***
(0.185) (0.188) (0.203)
Firm life cycle 0.734*** 0.734*** 0.734*** 0.734***
(0.029) (0.029) (0.029) (0.029)
Book equity 0.166*** 0.166*** 0.169*** 0.166***
(0.047) (0.047) (0.047) (0.047)
ROA 0.822*** 0.822*** 0.824*** 0.826***
(0.060) (0.060) (0.060) (0.060)
Sales growth -0.256*** -0.256*** -0.254*** -0.255***
(0.026) (0.026) (0.026) (0.026)
Firm size -0.016** -0.016** -0.024*** -0.023***
(0.008) (0.008) (0.008) (0.008)
Cash holding 0.022 0.022 0.020 0.022
(0.054) (0.054) (0.054) (0.054)
Country per capita GDP 4.356*** 4.356*** 4.501*** 4.424***
(0.322) (0.322) (0.324) (0.325)
Financial market development -0.001*** -0.001*** -0.001*** -0.001***
(0.000) (0.000) (0.000) (0.000)
Dividend tax penalty -0.567*** -0.567*** -0.645*** -0.772***
(0.101) (0.101) (0.102) (0.111)
Constant -40.830*** -59.314*** -61.357*** -59.826***
(3.234) (3.824) (3.859) (3.894)
Year dummy Yes Yes Yes Yes
Industry dummy Yes Yes Yes Yes Country dummy Yes Yes Yes Yes
Observations 28,686 28,686 28,686 28,686
Number of firms 6,151 6,151 6,151 6,151
Chi-square statistics 5,127.69 5,127.69 5,163.20 5,177.71

Table 3. Dividend and Governance Impact on Firm Value
Table 3 tests the impact of dividend payment on firm value. Xt is the variable X in year t divided by the total assets
in year t. dXt is the change in the variable X from year t−1 to year t divided by total assets in year t. It is calculated as
((Xt − Xt−1)/At). dXt+1 is the change in the variable X from year t+1 to year t divided by assets in year t. It can be
calculated as ((Xt+1 − Xt)/At). A is the book value of total assets. V is the market value of the equity plus the book
value of debt. E is earnings defined as earnings before extraordinary items plus interest plus deferred tax credits plus
investment tax credits. NA is net assets, which is defined as total assets minus cash. RD is research and development
expense. We replace any missing value of the R&D with zero. I is interest expense. D is cash dividends. L is liquid
assets, defined as cash and cash equivalent assets. Standard errors are in parentheses. Model 1 tests the impact of
cash dividend payment (Di,t) on the firm value. Model 2 interact the cash dividend payment with the firm-level
corporate governance measure (ISS41). Model 3 includes the country-level control variables, such as the
shareholders' right index (AD), per capita GDP, financial market development and legal system and dividend tax
penalty. *, **, and *** denote statistical significance at the 10%, 5%, and 1% levels, respectively.
Dependent variable (1) (2) (3)
Firm value Model Model Model
Ei,t 1.167*** 1.018*** 0.933***
(0.066) (0.062) (0.062)
dEi,t 0.342*** 0.298*** 0.256***
(0.058) (0.055) (0.055)
dEi,t+1 1.277*** 1.116*** 1.049***
(0.054) (0.051) (0.051)
dNAi,t 0.462*** 0.276*** 0.283***
(0.034) (0.032) (0.032)
dNAi,t+1 0.147*** 0.065*** 0.073***
(0.026) (0.024) (0.024)
dLi,t 0.975*** 0.876*** 0.851***
(0.053) (0.050) (0.050)
dLi,t+1 0.685*** 0.772*** 0.774***
(0.050) (0.047) (0.047)
RDi,t 5.372*** 4.393*** 4.286***
(0.137) (0.147) (0.146)
dRDi,t 2.718*** 2.039*** 1.875***
(0.350) (0.332) (0.329)
dRDi,t+1 11.285*** 9.450*** 8.841***
(0.321) (0.308) (0.306)
Ii,t -2.549*** -4.298*** -4.732***
(0.596) (0.586) (0.586)
dIi,t+1 3.133*** -0.035 -1.902**
(0.894) (0.853) (0.857)
Di,t 2.224*** 6.839*** 6.643***
(0.498) (0.511) (0.525)
dDi,t 8.903*** 2.242** 1.567
(1.157) (1.125) (1.153)
dVi,t+1 -0.370*** -0.377*** -0.349***
(0.007) (0.007) (0.007)
Country per capita GDP
0.279
(0.214)
Financial market development
0.004***
(0.000)
Common law
0.731***
(0.142)
Dividend tax penalty
-0.052
(0.066)
Constant 1.081*** 1.413*** -2.647
(0.016) (0.143) (2.229)
Year dummy No Yes Yes
Industry dummy No Yes Yes
Country dummy No Yes Yes
Observations 17,545 17,545 17,545
Number of firms 4,022 4,022 4,022
Chi-square 7,088.11 10,322.52 10,808.05

Table 4. Sub-governance Index Impact on Dividend Payment
Table 4 Panel A shows the panel data (random effect) regression models and tests the impact of the sub-categories
of firm-level governance index on the corporate dividend payment. The dependent variable is the cash dividend to
total assets ratio. We split the 41 items of the ISS governance measures into four sub-categories, including board
index, audit index, anti-takeover index and compensation index. Model (1) to (4) tests these sub-category
governance indices individually and control for the same firm-level and country-level variables in each model.
Model 5 include all sub-categories of the firm-level governance index to test their impact on the corporate dividend
payment. All models include year and industry fixed effects. Robust standard errors are reported in the parentheses.
*, **, and *** denote statistical significance at the 10%, 5%, and 1% levels, respectively.
Panel Data Regression Models (1) (2) (3) (4) (5)
Cash Dividend / Assets Model Model Model Model Model
Board index 0.014***
0.011***
(0.002)
(0.003)
Audit index
0.023***
0.006
(0.008)
(0.008)
Anti-takeover index
-0.014**
-0.028***
(0.007)
(0.007)
Compensation index
0.026*** 0.019***
(0.005) (0.005)
Shareholders' rights 4.334*** 4.410*** 4.463*** 4.369*** 4.295***
(0.150) (0.149) (0.148) (0.149) (0.150)
Firm life cycle 0.749*** 0.750*** 0.751*** 0.744*** 0.742***
(0.029) (0.029) (0.029) (0.029) (0.029)
Book equity 0.173*** 0.168*** 0.167*** 0.170*** 0.176***
(0.047) (0.047) (0.047) (0.047) (0.047)
ROA 0.823*** 0.824*** 0.819*** 0.827*** 0.829***
(0.060) (0.060) (0.060) (0.060) (0.060)
Sales growth -0.264*** -0.278*** -0.286*** -0.267*** -0.257***
(0.025) (0.025) (0.025) (0.025) (0.025)
Firm size -0.024*** -0.015* -0.013* -0.021*** -0.029***
(0.008) (0.008) (0.008) (0.008) (0.008)
Cash holding 0.028 0.030 0.033 0.033 0.029
(0.054) (0.054) (0.054) (0.054) (0.054)
Country per capita GDP 3.604*** 3.820*** 3.991*** 3.682*** 3.376***
(0.217) (0.214) (0.205) (0.213) (0.224)
Financial market development -0.002*** -0.002*** -0.002*** -0.002*** -0.002***
(0.000) (0.000) (0.000) (0.000) (0.000)
Dividend tax penalty -0.592*** -0.582*** -0.582*** -0.635*** -0.671***
(0.096) (0.096) (0.096) (0.097) (0.097)
Constant -50.588*** -52.993*** -54.827*** -51.474*** -47.996***
(2.588) (2.550) (2.464) (2.541) (2.653)
Year dummy Yes Yes Yes Yes Yes
Industry dummy Yes Yes Yes Yes Yes Country dummy Yes Yes Yes Yes Yes
Observations 28,686 28,686 28,686 28,686 28,686
Number of firms 6,151 6,151 6,151 6,151 6,151
Chi-square statistics 5,134.36 5,088.68 5,083.29 5,123.05 5,167.85

Table 4 Panel B shows the panel data regression (random effect) models and tests the interaction between each of
the four sub-categories of firm-level governance index and the country-level shareholders' right index. The
dependent variable is the cash dividend to total assets ratio. Model (1) to (4) tests the interaction effect of each sub-
category governance index. All models include year and industry fixed effects. Robust standard errors are reported
in the parentheses. *, **, and *** denote statistical significance at the 10%, 5%, and 1% levels, respectively.
Panel Data Regression Models (1) (2) (3) (4)
Cash Dividend / Assets Model Model Model Model
Shareholders' rights 4.118*** 4.366*** 4.692*** 4.348***
(0.165) (0.152) (0.204) (0.154)
Firm life cycle 0.771*** 0.772*** 0.774*** 0.765***
(0.030) (0.030) (0.030) (0.030)
Book equity 0.166*** 0.162*** 0.163*** 0.165***
(0.048) (0.048) (0.048) (0.048)
ROA 0.837*** 0.835*** 0.832*** 0.840***
(0.062) (0.062) (0.062) (0.062)
Sales growth -0.260*** -0.276*** -0.283*** -0.265***
(0.026) (0.026) (0.026) (0.026)
Firm size -0.024*** -0.015* -0.013* -0.022***
(0.008) (0.008) (0.008) (0.008)
Cash holding 0.034 0.035 0.038 0.038
(0.056) (0.056) (0.056) (0.056)
Country per capita GDP 3.582*** 3.833*** 4.021*** 3.708***
(0.223) (0.219) (0.211) (0.218)
Financial market development -0.002*** -0.002*** -0.002*** -0.002***
(0.000) (0.000) (0.000) (0.000)
Dividend tax penalty -0.734*** -0.634*** -0.586*** -0.694***
(0.105) (0.100) (0.100) (0.107)
Board index X Shareholders' rights 0.021***
(0.006)
Board index -0.050***
(0.019)
Audit index X Shareholders' rights
0.042***
(0.015) Audit index
-0.109**
(0.048) Anti-takeover index X Shareholders' rights
-0.052
(0.034)
Anti-takeover index
0.146
(0.102)
Compensation index X Shareholders' rights
0.009
(0.009)
Compensation index
-0.001
(0.028)
Constant -49.655*** -52.956*** -55.809*** -51.645***
(2.671) (2.615) (2.556) (2.604)
Year dummy Yes Yes Yes Yes
Industry dummy Yes Yes Yes Yes Country dummy Yes Yes Yes Yes
Observations 28,686 28,686 28,686 28,686
Number of firms 6,151 6,151 6,151 6,151
Chi-square statistics 5,070.25 5,020.59 5,013.77 5,047.81

Table 5. Robustness Test: More Country-Level Control Variables
Table 5 includes more country-level control variables and tests the robustness of the main effect and interaction
effect of the firm-level governance and the country-level governance impact on the corporate dividend payment. The
dependent variables are cash dividend divided by total assets. Panel data regression (random effect) model is used to
estimate the results. Model (1) and (2) control for legal system of each sample country (i.e., common law vs. civil
law). Model (3) and (4) also add the national culture measures (i.e., power distance, individualism, masculinity, and
uncertainty avoidance) as additional control variables. All models include year and industry fixed effects. Robust
standard errors are reported in the parentheses. *, **, and *** denote statistical significance at the 10%, 5%, and 1%
levels, respectively.
Panel Data Regression Models (1) (2) (3) (4)
Cash Dividend / Assets Model Model Model Model
ISS41 X Shareholders' rights
0.011***
0.011***
(0.004)
(0.004)
ISS41 0.009*** -0.024** 0.006*** -0.024**
(0.002) (0.011) (0.002) (0.011)
Shareholders' rights 4.745*** 4.512*** 3.483*** 1.615***
(0.188) (0.203) (0.394) (0.109)
Firm life cycle 0.734*** 0.734*** 0.752*** 0.734***
(0.029) (0.029) (0.029) (0.029)
Book equity 0.169*** 0.166*** 0.190*** 0.166***
(0.047) (0.047) (0.047) (0.047)
ROA 0.824*** 0.826*** 0.845*** 0.826***
(0.060) (0.060) (0.061) (0.060)
Sales growth -0.254*** -0.255*** -0.233*** -0.255***
(0.026) (0.026) (0.026) (0.026)
Firm size -0.024*** -0.023*** -0.025*** -0.023***
(0.008) (0.008) (0.008) (0.008)
Cash holding 0.020 0.022 -0.006 0.022
(0.054) (0.054) (0.055) (0.054)
Country per capita GDP 4.501*** 4.424*** 3.834*** 4.424***
(0.324) (0.325) (0.278) (0.325)
Financial market development -0.001*** -0.001*** -0.001*** -0.001***
(0.000) (0.000) (0.000) (0.000)
Dividend tax penalty -0.645*** -0.772*** -0.627*** -0.772***
(0.102) (0.111) (0.102) (0.111)
Common law -1.382*** -1.382*** -0.912 -0.785
(0.149) (0.149) (2.466) (0.362)
Culture - power distance
0.113 -0.411***
(0.089) (0.020)
Culture - individualism
0.049 -0.093***
(0.089) (0.009)
Culture - massiculinism
-0.108*** -0.086***
(0.006) (0.005)
Culture - uncertainty avoidance
0.260*** 0.215***
(0.016) (0.011)
Constant -59.975*** -58.444*** -63.766*** -35.922***
(3.840) (3.874) (11.158) (3.352)
Year dummy Yes Yes Yes Yes
Industry dummy Yes Yes Yes Yes
Country dummy Yes Yes Yes Yes
Observations 28,686 28,686 28,686 28,686 Number of firms 6,151 6,151 6,151 6,151
Chi-square statistics 5,163.20 5,177.71 5,400.74 5,177.71


Table 6. Robustness test: Alternative Measures of Dividend Payment
Table 6 tests the alternative measures of dividend payment by using dividend to earnings ratios and dividend to sales ratio respectively. Panel data regression
(random effect) is again used to handle the truncated distribution of the dividend measures. Model (1) tests the main effect of firm-level governance and country-
level governance and their impact on the dividend to earnings ratio. Model (2) tests the interaction effect of the firm-level governance and country-level
governance impact on the dividend to earnings ratio. Model (3) and (4) retest the same main effect and interaction effect on the dividend to sales ratio. The same
firm-level and country-level control variables are included in each model. All models include year and industry fixed effects. Robust standard errors are reported
in the parentheses. *, **, and *** denote statistical significance at the 10%, 5%, and 1% levels, respectively.
Panel Data Regression Models (1) (2) (3) (4)
model model model model
Dividend to Earnings Dividend to Earnings Dividend to Sales Dividend to Sales
ISS41 X Shareholders' rights
0.004***
0.018***
(0.001)
(0.004)
ISS41 0.002*** -0.011*** 0.006** -0.048***
(0.001) (0.003) (0.003) (0.014)
Shareholders' rights 1.029*** 0.938*** 4.912*** 4.523***
(0.054) (0.059) (0.229) (0.249)
Firm life cycle 0.082*** 0.083*** 0.650*** 0.652***
(0.008) (0.008) (0.036) (0.036)
Book equity -0.070*** -0.070*** 0.256*** 0.251***
(0.015) (0.015) (0.057) (0.057)
ROA -0.291*** -0.292*** 0.237*** 0.241***
(0.027) (0.027) (0.073) (0.073)
Sales growth -0.070*** -0.070*** -0.090*** -0.092***
(0.010) (0.010) (0.031) (0.031)
Firm size 0.002 0.002 0.059*** 0.059***
(0.002) (0.002) (0.010) (0.010)
Cash holding -0.072*** -0.071*** -0.073 -0.070
(0.017) (0.017) (0.066) (0.066)
Country per capita GDP 1.222*** 1.194*** 3.507*** 3.377***
(0.108) (0.108) (0.394) (0.396)
Financial market development -0.000*** -0.000*** -0.000 -0.000
(0.000) (0.000) (0.000) (0.000)
Dividend tax penalty -0.182*** -0.231*** -0.428*** -0.638***
(0.031) (0.034) (0.125) (0.135)
Constant -15.847*** -15.267*** -51.332*** -48.762***
(1.277) (1.285) (4.696) (4.737)
Year dummy Yes Yes Yes Yes
Industry dummy Yes Yes Yes Yes Country dummy Yes Yes Yes Yes
Observations 20,636 20,636 28,550 28,550
Number of firms 5,087 5,087 6,123 6,123
Chi-square statistics 4,591.49 4,607.97 4,783.20 4,804.39

Table 7. Firm Corporate Governance and Country’s creditor Right Impact on Dividend Payment
Table 7 tests the impact of creditor right on dividend payment. Model 1 and Model 2 present the panel data
regression (random effect) model and test the main effect and interaction effect of firm-level governance measure
(ISS41) and the country-level creditor right index. Firm-level and country-level control variables are included in all
models. All models include year, industry and country fixed effects. Robust standard errors are reported in the
parentheses. *, **, and *** denote statistical significance at the 10%, 5%, and 1% levels, respectively.
Panel Data Regression Models (1) (2)
Cash Dividend / Assets Model Model
ISS41 X Creditor's rights
0.012***
(0.002)
ISS41 0.009*** -0.012***
(0.002) (0.003)
Creditor's rights 2.372*** 0.171***
(0.094) (0.049)
Firm life cycle 0.734*** 0.770***
(0.029) (0.030)
Book equity 0.169*** 0.150***
(0.047) (0.047)
ROA 0.824*** 0.820***
(0.060) (0.061)
Sales growth -0.254*** -0.199***
(0.026) (0.026)
Firm size -0.024*** -0.006
(0.008) (0.008)
Cash holding 0.020 -0.014
(0.054) (0.055)
Country per capita GDP 4.501*** -1.423***
(0.324) (0.090)
Financial market development -0.001*** 0.000
(0.000) (0.000)
Dividend tax penalty -0.645*** -0.835***
(0.102) (0.102)
Constant -49.496*** 15.054***
(3.477) (0.956)
Year dummy Yes Yes
Industry dummy Yes Yes Country dummy Yes Yes
Observations 28,686 28,686
Number of firms 6,151 6,151 Chi-square statistics 5,163.20 4,094.84

Table 8. Robustness Test: Tobit Regression Methods
Table 8 shows the Tobit regression results for the main effect and interaction effect of the firm-level governance and
country-level governance impact on corporate dividend payment. The dependent variables in the models are cash
dividend to total assets ratio. Model 1 tests the control variables and impact on the dividend to assets measure.
Model 2 adds the country level shareholders' right index in the model; and Model 3 tests the main effect of both the
firm-level governance, ISS41, and country level shareholders' right index. Model 4 tests the interaction between the
firm-level governance and the country level shareholders' right index. Robust standard errors are reported in the
parentheses. *, **, and *** denote statistical significance at the 10%, 5%, and 1% levels, respectively.
Tobit Regression Models (1) (2) (3) (4)
Cash Dividend / Assets Model Model Model Model
ISS41 X Shareholders' rights
0.020***
(0.005)
ISS41
0.025*** -0.036**
(0.002) (0.015)
Shareholders' rights
4.585*** 4.944*** 4.510***
(0.249) (0.251) (0.274)
Firm life cycle 1.077*** 1.077*** 1.068*** 1.069***
(0.024) (0.024) (0.024) (0.024)
Book equity 0.139*** 0.139*** 0.136*** 0.137***
(0.045) (0.045) (0.045) (0.045)
ROA 1.989*** 1.989*** 2.016*** 2.016***
(0.071) (0.071) (0.071) (0.071)
Sales growth -0.565*** -0.565*** -0.555*** -0.556***
(0.038) (0.038) (0.038) (0.038)
Firm size -0.003 -0.003 -0.028*** -0.027***
(0.005) (0.005) (0.006) (0.006)
Cash holding 0.406*** 0.406*** 0.398*** 0.399***
(0.051) (0.051) (0.050) (0.050)
Country per capita GDP 4.423*** 4.423*** 4.831*** 4.689***
(0.541) (0.541) (0.541) (0.542)
Financial market development -0.001** -0.001** -0.001 -0.001
(0.001) (0.001) (0.001) (0.001)
Dividend tax penalty -0.624*** -0.624*** -0.827*** -1.061***
(0.167) (0.167) (0.168) (0.178)
Constant -41.584*** -59.926*** -65.676*** -62.843***
(5.428) (6.395) (6.404) (6.442)
Year dummy Yes Yes Yes Yes
Industry dummy Yes Yes Yes Yes
Country dummy Yes Yes Yes Yes
Observations 28,686 28,686 28,686 28,686
Chi-square statistics 12,832.71 12,832.71 12,949.23 12,964.97
Robust standard errors in parentheses
*** p<0.01, ** p<0.05, * p<0.10

Table 9. Robustness Test: Possible Endogenous Bias Corrections
Panel 9 A. Two-stage-least-square regression with instrumental variable
Table 9 presents the two-stage least squares (2SLS) models. Model (1) shows the first stage regress by using the
country-industry-median ISS41 index as the instrument variable and the firm-level ISS41 measure as the dependent
variable. The model also includes the firm-level and country-level control variables. Model (2) is the second-stage
regression. The ratio of dividends to total assets is the dependent variable. The firm-level ISS41 measure is predicted
from the first-stage regression. Model 3 is the second-stage regression for the interaction between the predicted firm-
level ISS41 index and the country’s shareholders' right index. All models include year and industry fixed effects.
Robust standard errors are reported in the parentheses. *, **, and *** denote statistical significance at the 10%, 5%,
and 1% levels, respectively.
2SLS Regression Models Stage 1 Stage 2 Main Effect Stage 2 Interaction Effect
Cash Dividend / Assets (1) Model (2) Model (3) Model
Industry Median ISS41 0.893***
(0.012)
ISS41 X Shareholders' rights
0.017**
(0.008)
ISS41
0.066*** -0.072***
(0.025) (0.026)
Shareholders' rights -2.444*** 5.527*** -0.004
(0.493) (0.452) (0.161)
Firm life cycle 0.245*** 1.053*** 1.112***
(0.062) (0.030) (0.025)
Book equity 0.210* 0.132*** 0.051
(0.116) (0.044) (0.046)
ROA -1.060*** 2.060*** 2.012***
(0.190) (0.080) (0.074)
Sales growth -0.490*** -0.540*** -0.601***
(0.097) (0.037) (0.038)
Firm size 0.986*** -0.068*** 0.015***
(0.013) (0.026) (0.005)
Cash holding 0.355*** 0.384*** 0.371***
(0.134) (0.052) (0.052)
Country per capita GDP -1.011 5.494*** -2.162***
(1.039) (0.709) (0.059)
Financial market development -0.001 -0.000 -0.001*
(0.001) (0.001) (0.000)
Dividend tax penalty 0.836*** -1.157*** -2.031***
(0.255) (0.273) (0.136)
Constant 13.917 -75.014*** 23.566***
(12.384) (8.960) (0.625)
Year dummy Yes Yes Yes
Industry dummy Yes Yes Yes Country dummy Yes Yes Yes
Observations 28,686 28,686 28,686
R-squared 0.711 0.356 0.309 Chi-square statistics . 17,095.34 13,185.81

Panel 9 B. Panel data regression with lagged dependent variable
Panel 9B shows the Panel data regression (random effect) by controlling the lagged variable of the cash dividend to
assets ratio. The dependent variable is the cash dividend to total assets in year t. We control the cash dividend to
total asset in year t-1 in the models. Model (1) tests the main effect of firm-governance and country governance
impact on the corporate dividend payment; Model (2) tests the interaction effect of firm-governance and country
governance impact on the corporate dividend payment. All models include year and industry fixed effects. Robust
standard errors are reported in the parentheses. *, **, and *** denote statistical significance at the 10%, 5%, and 1%
levels, respectively.
Panel Data Regression Models (1) (2)
Cash Dividend / Assets Model Model
Cash dividend / assets t-1 0.242*** 0.242***
(0.004) (0.004)
ISS41 X Shareholders' rights
0.009**
(0.004)
ISS41 0.011*** -0.016
(0.002) (0.011)
Shareholders' rights 4.028*** 3.835***
(0.176) (0.193)
Firm life cycle 0.696*** 0.697***
(0.027) (0.027)
Book equity 0.186*** 0.184***
(0.044) (0.044)
ROA 0.911*** 0.913***
(0.059) (0.059)
Sales growth -0.265*** -0.266***
(0.026) (0.026)
Firm size -0.012* -0.012*
(0.007) (0.007)
Cash holding 0.120** 0.121**
(0.050) (0.050)
Country per capita GDP 4.164*** 4.099***
(0.338) (0.339)
Financial market development -0.001*** -0.001***
(0.000) (0.000)
Dividend tax penalty -0.978*** -1.083***
(0.106) (0.115)
Constant -55.923*** -54.646***
(4.009) (4.044)
Year dummy Yes Yes
Industry dummy Yes Yes
Country dummy Yes Yes
Observations 28,389 28,389
Number of firms 6,118 6,118
Chi-square statistics 11,746.77 11,777.10

Table 10. Robustness Test: Subsample of Excluding US Firms
Table 10 shows the panel data regression (random effect) results after excluding the US firm observations from the
sample. The sample size drops to 8,708. The dependent variable is cash dividend to assets ratio. Model (1) tests the
main effect of firm-level governance and country-level governance impact on the dividend payment. Model (2) tests
the interaction effect between the firm-level governance and country-level governance impact on the dividend
payment. All models include year and industry fixed effects. Robust standard errors are reported in the parentheses.
*, **, and *** denote statistical significance at the 10%, 5%, and 1% levels, respectively.
Panel Data Regression Models (1) (2)
Cash Dividend / Assets Model Model
ISS41 X Shareholders' rights
0.012**
(0.005)
ISS41 0.021*** -0.015
(0.005) (0.020)
Shareholders' rights 0.250*** -0.128
(0.039) (0.102)
Firm life cycle 0.463*** 0.433***
(0.050) (0.049)
Book equity 0.463*** 0.268***
(0.118) (0.093)
ROA 3.443*** 9.186***
(0.200) (0.238)
Sales growth -0.478*** -0.951***
(0.061) (0.088)
Firm size -0.230*** -0.152***
(0.020) (0.012)
Cash holding -0.030 0.256*
(0.152) (0.137)
Country per capita GDP -1.286*** -1.705***
(0.112) (0.063)
Financial market development 0.000 0.002***
(0.000) (0.000)
Dividend tax penalty -0.720*** -1.815***
(0.113) (0.133)
Constant 14.071*** 18.945***
(1.162) (0.746)
Year dummy Yes Yes
Industry dummy Yes Yes Country dummy Yes Yes
Observations 8,708 8,708
Number of firms 1,853 1,853

Table 11. Impact of Individual Governance Attribute on the Dividend Payment
Table 11 shows the panel data regression (random effect model) and test the impact of seven individual governance attributes on the corporate dividend payment.
We follow Aggarwal et al. (2011) and examine these individual items including: board independence (in model 1), board size (model 2), CEO/chairman
separation (model 3), and the absence of a staggered board (model 4); the independence of firm auditors (model 5), and ratification of auditors (model 6); and the
existence of multiple share classes (model 7). All models include year, industry and country fixed effects. Robust standard errors are reported in the parentheses.
*, **, and *** denote statistical significance at the 10%, 5%, and 1% levels, respectively. Panel Data Regression Models (1) (2) (3) (4) (5) (6) (7)
Cash Dividend / Assets Model Model Model Model Model Model Model
Board Independence 0.055***
(0.014)
Board Size
0.065***
(0.020) Chairman/CEO separation
-0.010
(0.015)
Board Structure
0.049**
(0.020)
Audit Committee Independence
-0.014
(0.017) Auditor Ratification
0.012
(0.014)
Single Class Stock
-0.073**
(0.035)
Shareholders' rights 4.606*** 4.632*** 4.638*** 4.646*** 4.608*** 4.646*** 4.639***
(0.188) (0.188) (0.189) (0.188) (0.191) (0.189) (0.188)
Firm life cycle 0.752*** 0.757*** 0.756*** 0.757*** 0.756*** 0.757*** 0.756***
(0.030) (0.030) (0.030) (0.030) (0.030) (0.030) (0.030)
Book equity 0.161*** 0.161*** 0.161*** 0.162*** 0.161*** 0.162*** 0.163***
(0.048) (0.048) (0.048) (0.048) (0.048) (0.048) (0.048)
ROA 0.837*** 0.838*** 0.835*** 0.833*** 0.835*** 0.835*** 0.834***
(0.062) (0.062) (0.062) (0.062) (0.062) (0.062) (0.062)
Sales growth -0.254*** -0.254*** -0.255*** -0.255*** -0.255*** -0.255*** -0.254***
(0.026) (0.026) (0.026) (0.026) (0.026) (0.026) (0.026)
Firm size -0.018** -0.021** -0.017** -0.015* -0.017** -0.017** -0.017**
(0.008) (0.008) (0.008) (0.008) (0.008) (0.008) (0.008)
Cash holding 0.023 0.025 0.027 0.028 0.027 0.025 0.027
(0.056) (0.056) (0.056) (0.056) (0.056) (0.056) (0.056)
Country per capita GDP 4.299*** 4.374*** 4.387*** 4.365*** 4.353*** 4.404*** 4.389***
(0.330) (0.330) (0.330) (0.330) (0.332) (0.330) (0.330)
Financial market development -0.001*** -0.001*** -0.001*** -0.001*** -0.001*** -0.001*** -0.001***
(0.000) (0.000) (0.000) (0.000) (0.000) (0.000) (0.000)
Dividend tax penalty -0.586*** -0.581*** -0.590*** -0.548*** -0.587*** -0.604*** -0.585***
(0.103) (0.103) (0.103) (0.105) (0.103) (0.105) (0.103)
Constant -58.641*** -59.517*** -59.641*** -59.475*** -59.179*** -59.857*** -59.595***
(3.920) (3.913) (3.914) (3.914) (3.946) (3.926) (3.913)
Year dummy Yes Yes Yes Yes Yes Yes Yes
Industry dummy Yes Yes Yes Yes Yes Yes Yes
Country dummy Yes Yes Yes Yes Yes Yes Yes
Observations 28,686 28,686 28,686 28,686 28,686 28,686 28,686 Number of firms 6,151 6,151 6,151 6,151 6,151 6,151 6,151

Chi-square statistics 5,067.94 5,059.21 5,046.77 5,056.93 5,046.91 5,047.44 5,051.67
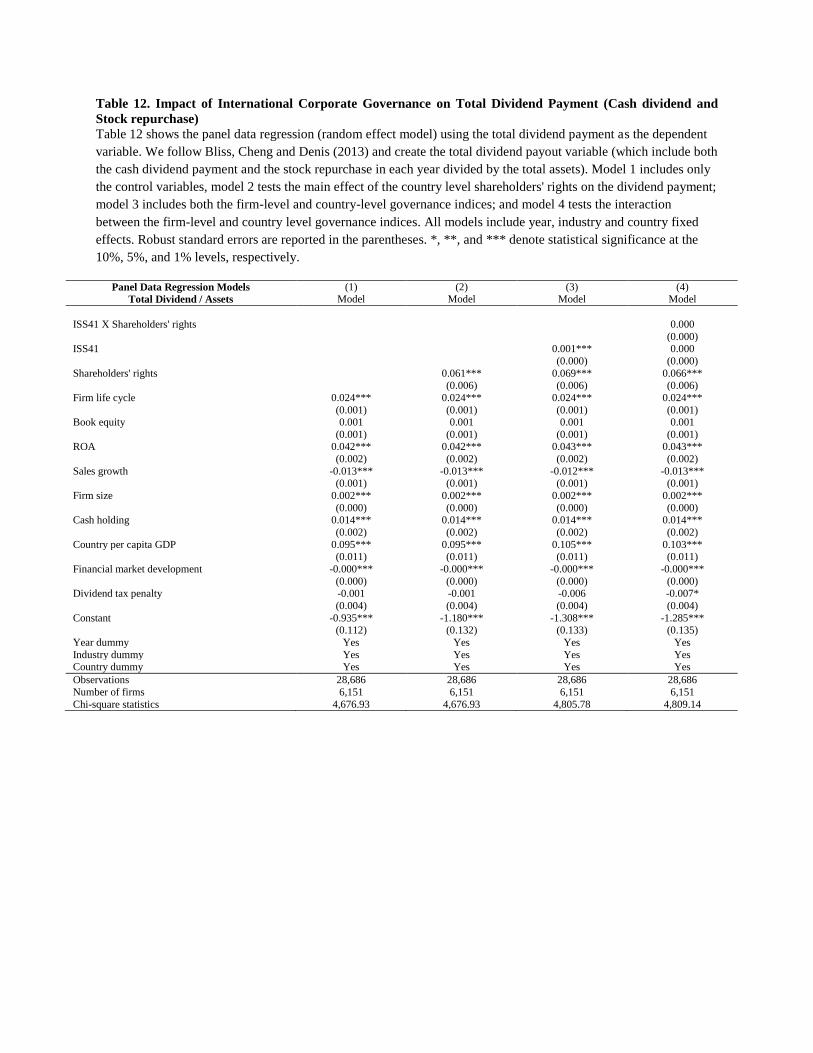
Table 12. Impact of International Corporate Governance on Total Dividend Payment (Cash dividend and
Stock repurchase)
Table 12 shows the panel data regression (random effect model) using the total dividend payment as the dependent
variable. We follow Bliss, Cheng and Denis (2013) and create the total dividend payout variable (which include both
the cash dividend payment and the stock repurchase in each year divided by the total assets). Model 1 includes only
the control variables, model 2 tests the main effect of the country level shareholders' rights on the dividend payment;
model 3 includes both the firm-level and country-level governance indices; and model 4 tests the interaction
between the firm-level and country level governance indices. All models include year, industry and country fixed
effects. Robust standard errors are reported in the parentheses. *, **, and *** denote statistical significance at the
10%, 5%, and 1% levels, respectively.
Panel Data Regression Models (1) (2) (3) (4)
Total Dividend / Assets Model Model Model Model
ISS41 X Shareholders' rights
0.000
(0.000)
ISS41
0.001*** 0.000
(0.000) (0.000)
Shareholders' rights
0.061*** 0.069*** 0.066***
(0.006) (0.006) (0.006)
Firm life cycle 0.024*** 0.024*** 0.024*** 0.024***
(0.001) (0.001) (0.001) (0.001)
Book equity 0.001 0.001 0.001 0.001
(0.001) (0.001) (0.001) (0.001)
ROA 0.042*** 0.042*** 0.043*** 0.043***
(0.002) (0.002) (0.002) (0.002)
Sales growth -0.013*** -0.013*** -0.012*** -0.013***
(0.001) (0.001) (0.001) (0.001)
Firm size 0.002*** 0.002*** 0.002*** 0.002***
(0.000) (0.000) (0.000) (0.000)
Cash holding 0.014*** 0.014*** 0.014*** 0.014***
(0.002) (0.002) (0.002) (0.002)
Country per capita GDP 0.095*** 0.095*** 0.105*** 0.103***
(0.011) (0.011) (0.011) (0.011)
Financial market development -0.000*** -0.000*** -0.000*** -0.000***
(0.000) (0.000) (0.000) (0.000)
Dividend tax penalty -0.001 -0.001 -0.006 -0.007*
(0.004) (0.004) (0.004) (0.004)
Constant -0.935*** -1.180*** -1.308*** -1.285***
(0.112) (0.132) (0.133) (0.135)
Year dummy Yes Yes Yes Yes
Industry dummy Yes Yes Yes Yes Country dummy Yes Yes Yes Yes
Observations 28,686 28,686 28,686 28,686
Number of firms 6,151 6,151 6,151 6,151
Chi-square statistics 4,676.93 4,676.93 4,805.78 4,809.14

Figure 1. Economic Significance of the Corporate Governance Impact on Dividend Payment Figure 1 shows the economic significance of predictions for dividend payment for the value range of firm-governance index within the sample (from value of 7 to 38). The figure is based on the Tobit model estimated as Model 3 in Table 8. All other independent variables are evaluated at the sample median. Year and industry dummies are evaluated for 2009 and for the largest industry in the sample (business service industry).

Appendix 1. 41 Items to Construct the ISS Governance Index
Sub-category A: Board items
1 All directors attended 75% of board meetings or had a valid excuse
2 CEO serves on the boards of two or fewer public companies
3 Board is controlled by more than 50% independent outside directors
4 Board size is at greater than five but less than 16
5 CEO is not listed as having a related-party transaction
6 Compensation committee composed solely of independent outsiders
7 Chairman and CEO positions are separated, or there is a lead director
8 Nominating committee composed solely of independent outsiders
9 Governance committee exists and met in the past year
10 Shareholders vote on directors selected to fill vacancies
11 Governance guidelines are publicly disclosed
12 Annually elected board (no staggered board)
13 Policy exists on outside directorships (four or fewer boards is the limit)
14 Shareholders have cumulative voting rights
15 Shareholder approval is required to increase/decrease board size
16 Majority vote requirement to amend charter/bylaws (not supermajority)
17 Board has the express authority to hire its own advisers
18 Performance of the board is reviewed regularly
19 Board-approved succession plan in place for the CEO
20 Outside directors meet without CEO and disclose number of times met
21 Directors are required to submit resignation upon a change in job
22 Board cannot amend bylaws without shareholder approval or can do soonly under limited circumstances
23 Does not ignore shareholder proposal
24 Qualifies for proxy contest defenses combination points
Sub-category B: Audit
25 Consulting fees paid to auditors are less than audit fees paid to auditors
26 Audit committee composed solely of independent outsiders
27 Auditors ratified at most recent annual meeting
Sub-category C: Anti-takeover provisions
28 Single class, common shares
29 Majority vote requirement to approve mergers (not supermajority)
30 Shareholders may call special meetings
31 Shareholders may act by written consent
32 Company either has no poison pill or a pill that is shareholder approved
33 Company is not authorized to issue blank check preferred
Sub-category D: Compensation and ownership
34 Directors are subject to stock ownership requirements
35 Executives are subject to stock ownership guidelines
36 No interlocks among compensation committee members
37 Directors receive all or a portion of their fees in stock
38 All stock-incentive plans adopted with shareholder approval
39 Options grants align with company performance and reasonable burn rate
40 Officers’ and directors’ stock ownership is at least 1% but not over 30% of total shares outstanding
41 Repricing prohibited