Embed Size (px)
Citation preview

BEYOND COAL


2012

Phase 2: Replace coal plants with clean energy (2010-2015)
Phase 1: Stop the rush to build new coal (2005-2012)• Stop 90% of all new plants• Build an anti-coal movement and infrastructure
We will win in three phases.
Phase 2: Replace coal plants with clean energy (2010-2015)• Retire 1/3 fleet (2020); reduce carbon and health impacts• Replace coal with clean energy, not natural gas• End coal exports
Phase 3: Accelerate deployment of clean energy (2015-2030)• Set up retirement of rest of coal fleet• Clean energy displaces coal

David and Charles Koch
Why coal?

318,000
338,000
358,000
Megawatts (MW)
Declining Coal Capacity (Existing Coal Capacity - Retirements and Announcements)
Since Jan 1 2010…
Duke Energy, Xcel & First Energy
TVA
AEP & San Antonio
GenOn, Dominion, LGE & Kentucky Utilities
First Energy
238,000
258,000
278,000
298,000
Jan 1 2010
Feb-10
Apr-10
Jun-10
Aug-10
Oct-10
Dec-10
Feb-11
Apr-11
Jun-11
Aug-11
Oct-11
Dec-11
Feb-12
Apr-12
Jun-12
Aug-12
Oct-12
Dec-12
Feb-13
Apr-13
Jun-13
Aug-13
Oct-13
Dec-13
Feb-14
Apr-14
Jun-14
Aug-14
Oct-14
Dec-14
Feb-15
Apr-15
Jun-15
Aug-15
Oct-15
Dec-15
Megawatts (MW)
First Energy

Coal’s share is plummeting.
52%
52%53%
53%52%
51%
52%53%
52%51%
52%51%
50%
51%50%
50%49% 49%
48%
44%45%
44%
46%
48%
50%
52%
54%
Coal
sha
re o
f gen
erat
ion
44%
42%
35.9%
34%
36%
38%
40%
42%
44%
1990
1991
1992
1993
1994
1995
1996
1997
1998
1999
2000
2001
2002
2003
2004
2005
2006
2007
2008
2009
2010
2011
Q1
2012
Coal
sha
re o
f gen
erat
ion
Sources: U.S. Energy Information Administration. Electric Power Monthly. February 2012. Released April 30, 2012. U.S. Energy Information Administration. Short Term Energy Outlook. Released May 8, 2012
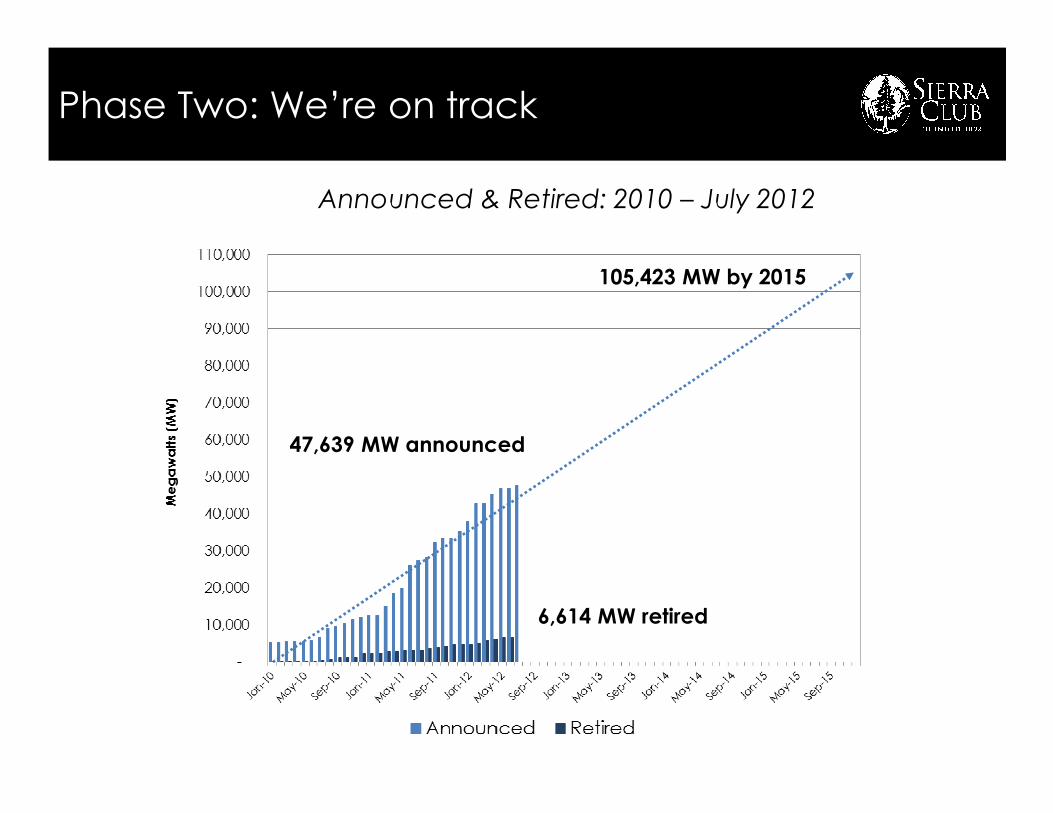
Phase Two: We’re on track
105,423 MW by 2015
Announced & Retired: 2010 – July 2012
47,639 MW announced
6,614 MW retired
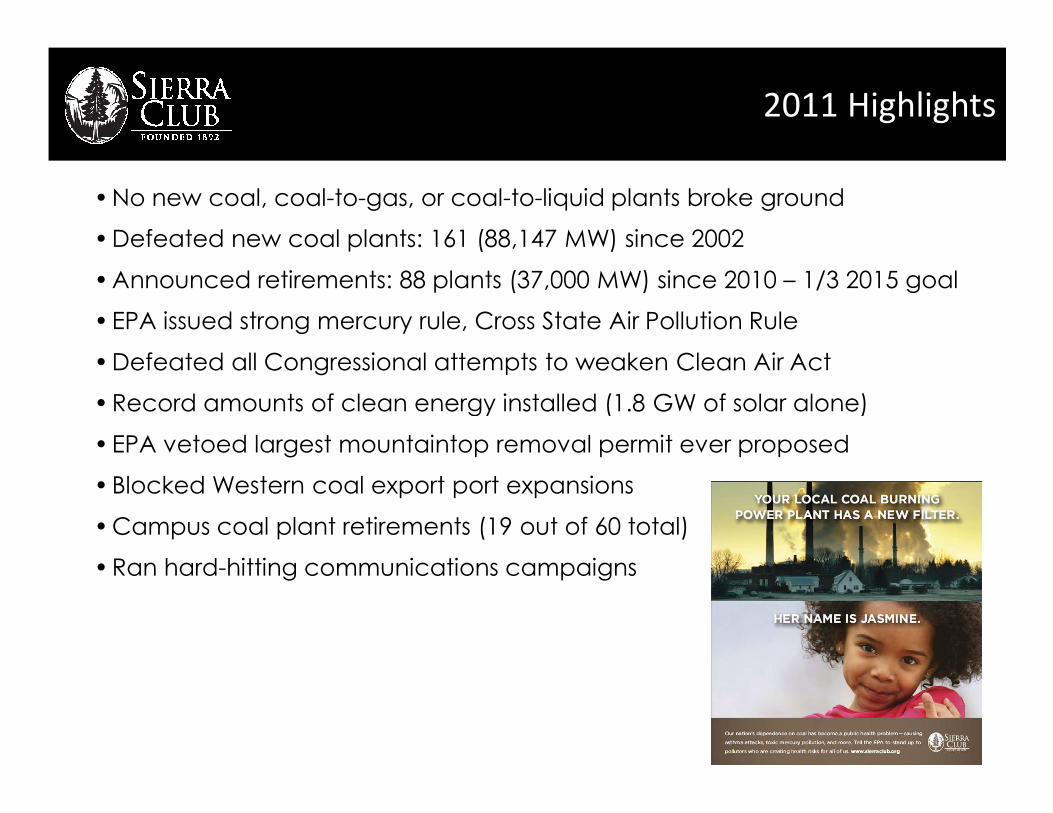
2011 Highlights
•No new coal, coal-to-gas, or coal-to-liquid plants broke ground
•Defeated new coal plants: 161 (88,147 MW) since 2002
•Announced retirements: 88 plants (37,000 MW) since 2010 – 1/3 2015 goal
•EPA issued strong mercury rule, Cross State Air Pollution Rule
•Defeated all Congressional attempts to weaken Clean Air Act
•Record amounts of clean energy installed (1.8 GW of solar alone)•Record amounts of clean energy installed (1.8 GW of solar alone)
•EPA vetoed largest mountaintop removal permit ever proposed
•Blocked Western coal export port expansions
•Campus coal plant retirements (19 out of 60 total)
•Ran hard-hitting communications campaigns

Emissions from Fossil-Fueled Power Plants as a Percent of Total U.S. Air Emissions
Why coal?
Source: U.S. EPA, “Reducing Toxic Pollution from Power Plants,” March 16, 2011, p. 6.Note: The figure includes emissions from oil-fired units as well as coal-fired, but oil-fired units account for only 1% of U.S. electric generation. Air emissions are not necessarily the major source of exposure for each of these pollutants.
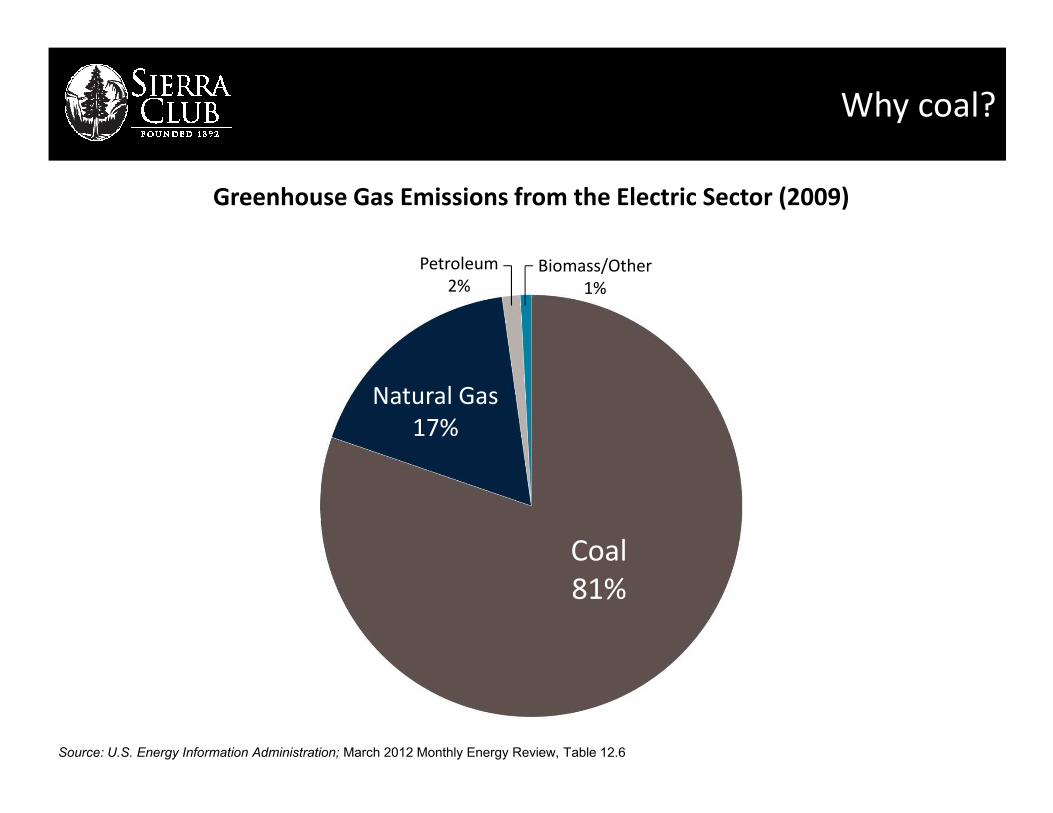
Greenhouse Gas Emissions from the Electric Sector (2009)
Petroleum 2%
Natural Gas
Biomass/Other 1%
Why coal?
Source: U.S. Energy Information Administration; March 2012 Monthly Energy Review, Table 12.6
Coal 81%
Natural Gas 17%

New coal defeated!
167 plants defeated (89,830 MW) Source: Sierra Club New Coal tracker, April 14th 2012

Age of Coal Power Plants in United States
Coal is vulnerable and the time is right
167*
*If not for the Beyond Coal Campaign 167 coal units would have been built generating over 86,000 MW
167*

New coal proposed
32 plants active (13,547 MW) Source: Sierra Club New Coal tracker, April 14th 2012
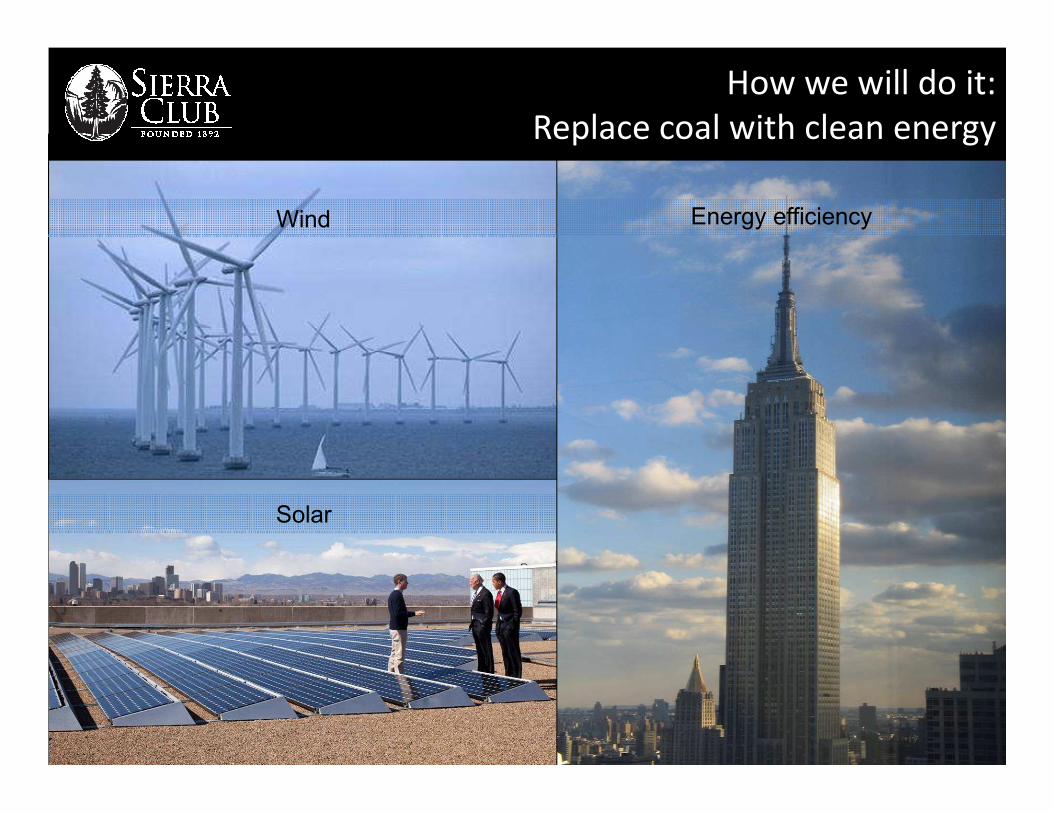
Energy efficiencyWind
How we will do it:Replace coal with clean energy
Solar

Our team of staff, volunteers, students, and allies have built this winning campaign

Our job:Show strong public support for EPA rules

EPA Rules Updates
§ Court upholds GHG rules
§ Court upholds SO2 air quality standard
§ Court upholds NOx air quality standard
19
§ Court upholds NOx air quality standard
§ EPA reconsider MATS for new sources
§ EPA delays final water intake rule until mid-
2013
2011 Highlights
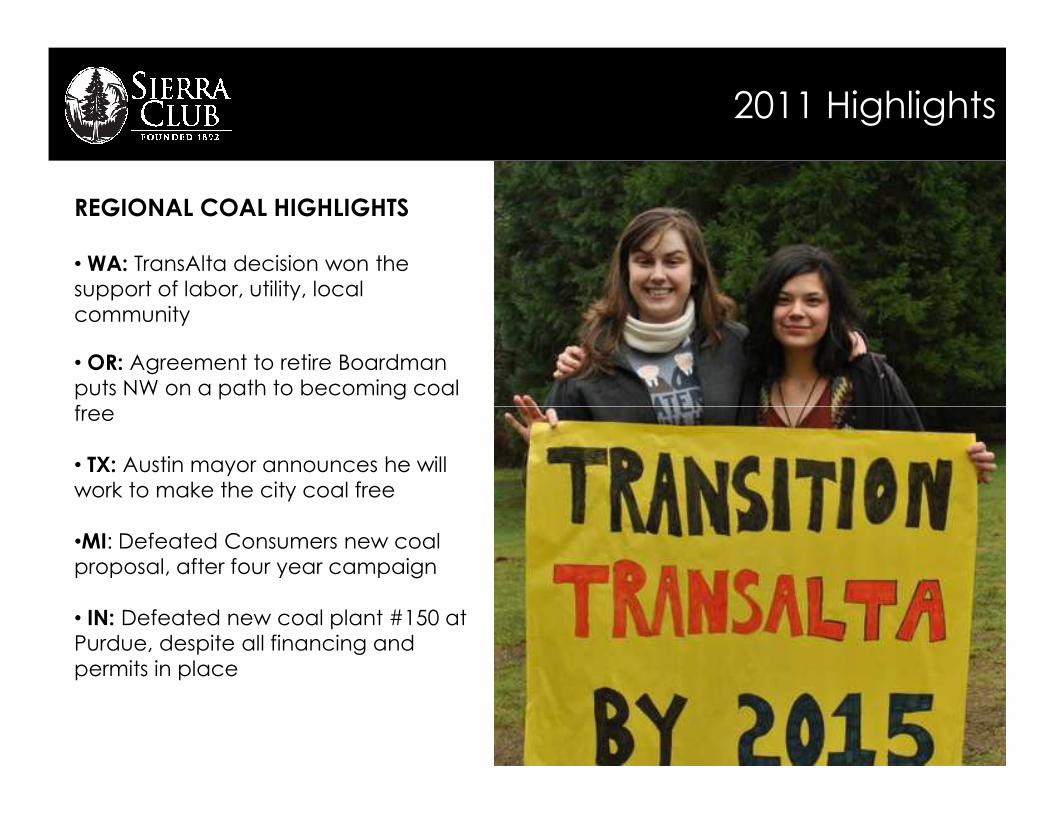
REGIONAL COAL HIGHLIGHTS
•WA: TransAlta decision won the support of labor, utility, local community
• OR: Agreement to retire Boardman puts NW on a path to becoming coal freefree
• TX: Austin mayor announces he will work to make the city coal free
•MI: Defeated Consumers new coal proposal, after four year campaign
• IN: Defeated new coal plant #150 at Purdue, despite all financing and permits in place

U.S. Job Market in Solar and Wind vs. Coal Plants and Coal Mining
Wind and solar provide more, safe jobs
Source: AWEA U.S. Wind Industry Annual Market Report 2010; Solar Foundation National Solar Jobs Census 2010; U.S. Bureau of Labor Statistics

Making mountaintop removal a thing of the past

Why coal?

Export image
Stopping the expansion of coal exports
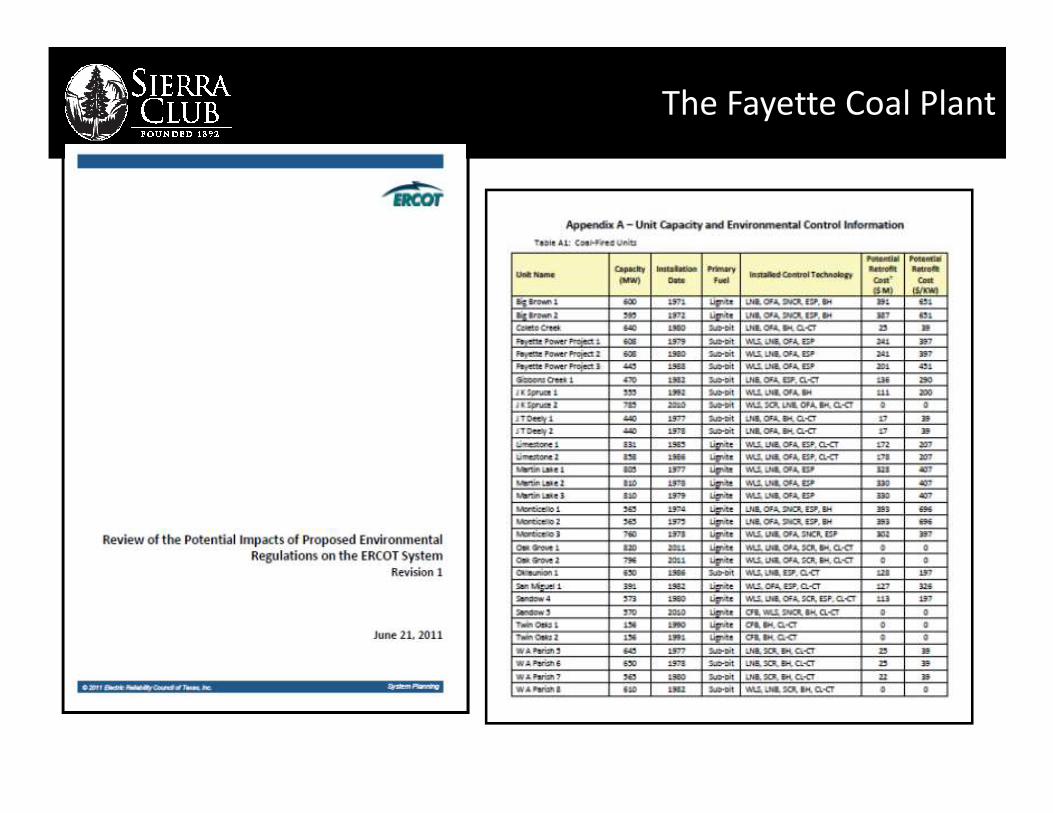
The Fayette Coal Plant
The Fayette Coal Plant
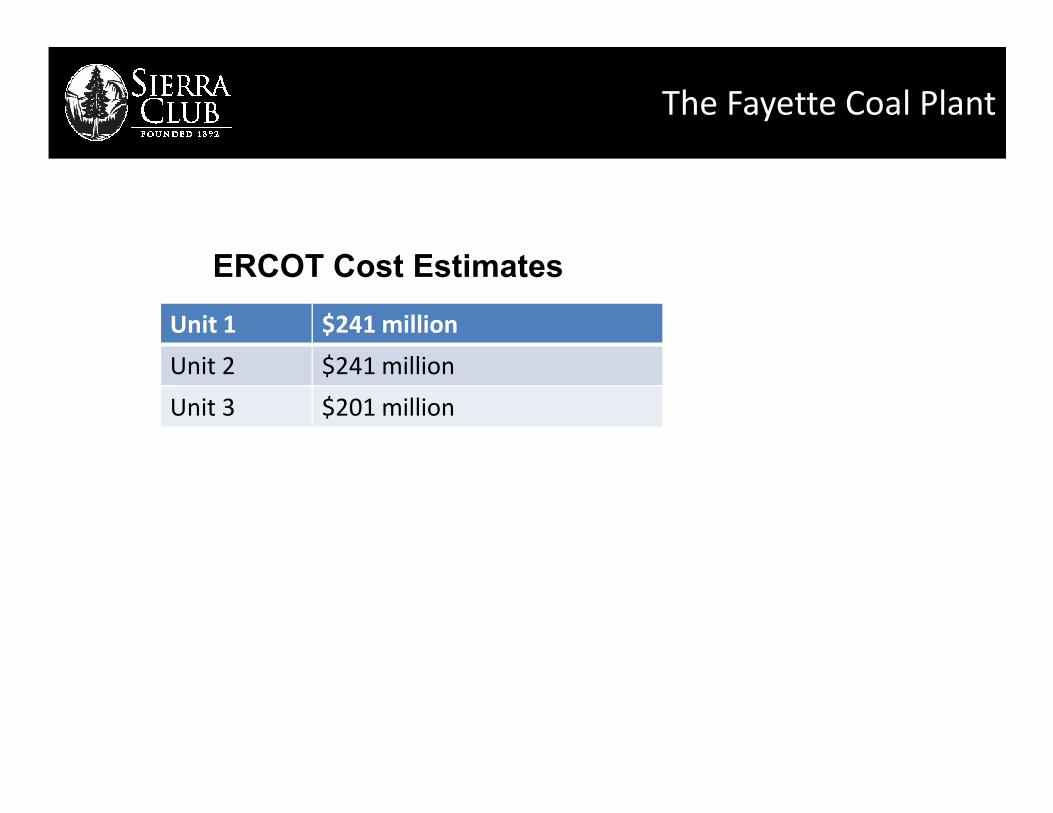
Unit 1 $241 million
Unit 2 $241 million
Unit 3 $201 million
ERCOT Cost Estimates
Unit 3 $201 million
The Fayette Coal Plant
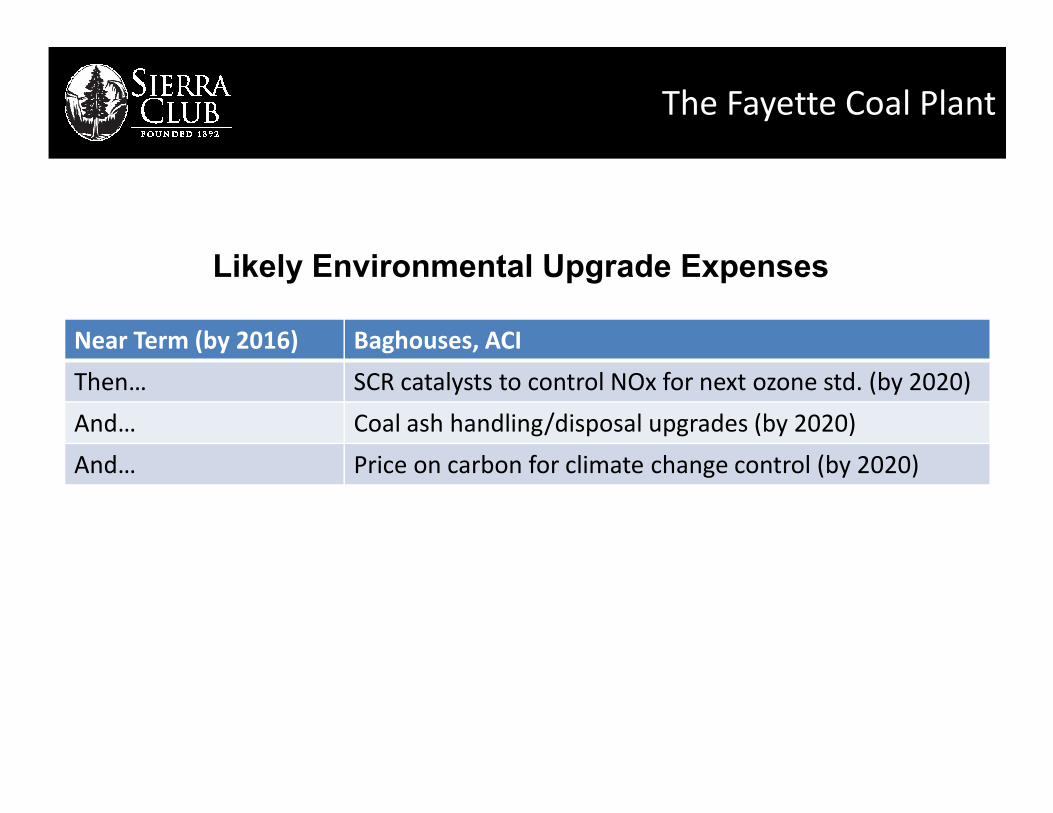
Near Term (by 2016) Baghouses, ACI
Then… SCR catalysts to control NOx for next ozone std. (by 2020)
And… Coal ash handling/disposal upgrades (by 2020)
Likely Environmental Upgrade Expenses
And… Coal ash handling/disposal upgrades (by 2020)
And… Price on carbon for climate change control (by 2020)

Nov 2010 NREL

Nov 2010 NREL
REN
EWA
BLE
ENER
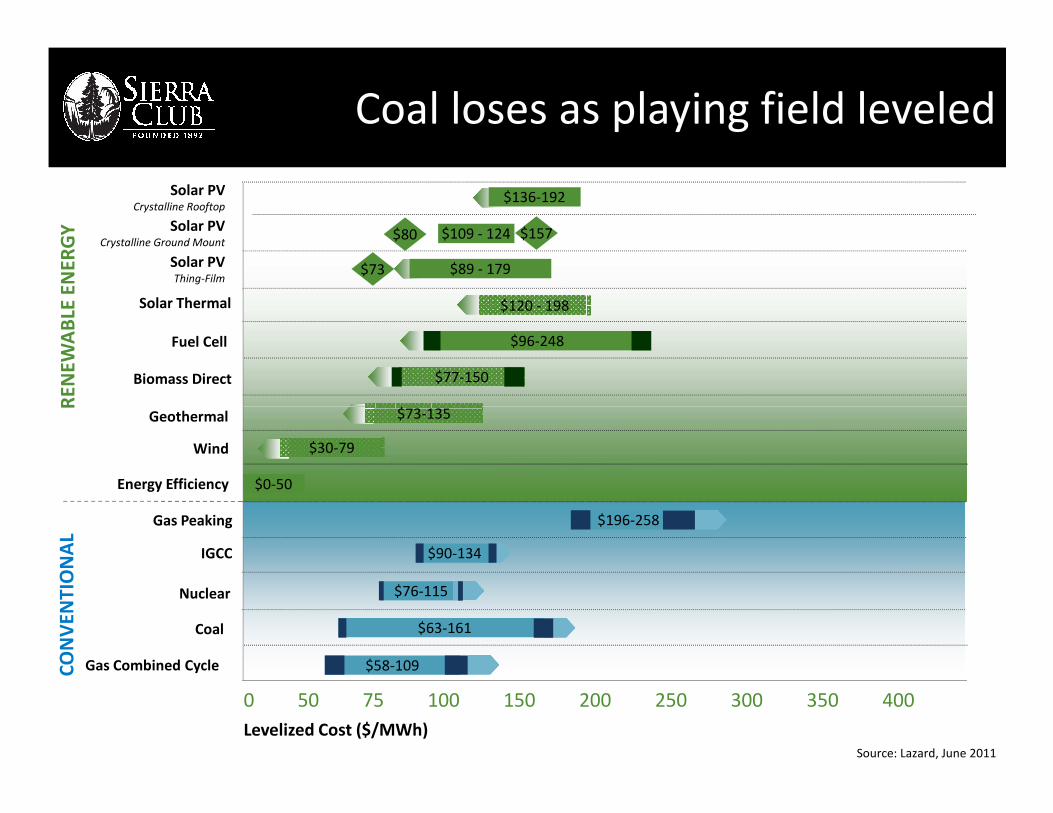
GY $109 - 124
$120 - 198
Geothermal
Fuel Cell
Solar Thermal
Coal loses as playing field leveled
Biomass Direct
$136-192
$96-248
Solar PVCrystalline Rooftop
Solar PVCrystalline Ground Mount
Solar PVThing-Film
$80 $157
$89 - 179$73
$77-150
$73-135
0 50 75 100 150 200 250 300 350 400Levelized Cost ($/MWh)
REN
EWA
BLE
ENER
GY
CON
VEN
TIO
NA
L
$58-109
Wind
Geothermal
Source: Lazard, June 2011
Gas Peaking
IGCC
Coal
$196-258
$90-134
$76-115
Energy Efficiency
$73-135
$30-79
$0-50
Nuclear
Gas Combined Cycle
$63-161

The Fayette Coal Plant
February 2012 Wind Energy - Cost Analysis

2012 Preview
•No new coal, coal-to-gas, coal-to-liquids plants break ground
•By the end of 2012, secure an additional 13,000 MW of announced retirements
•Successfully defend Mercury and Cross State Air Pollution rules
•EPA adopts greenhouse gas standards for new coal plants
•Extend federal incentives for clean energy
•Record deployment of wind, solar and geothermal (10,000 MW)
•No new coal export infrastructure constructed in Northwest and Alaska

Discussion:
- Feedback on Plan
- Next Steps