Embed Size (px)
Citation preview
BEYOND BORDERS INVESTMENT STRATEGIES
GLOBAL INVESTING USING COUNTRY FUNDS
NOVEMBER 18, 2016 1© BEYOND BORDERS INVESTMENT STRATEGIES, LLC 2014
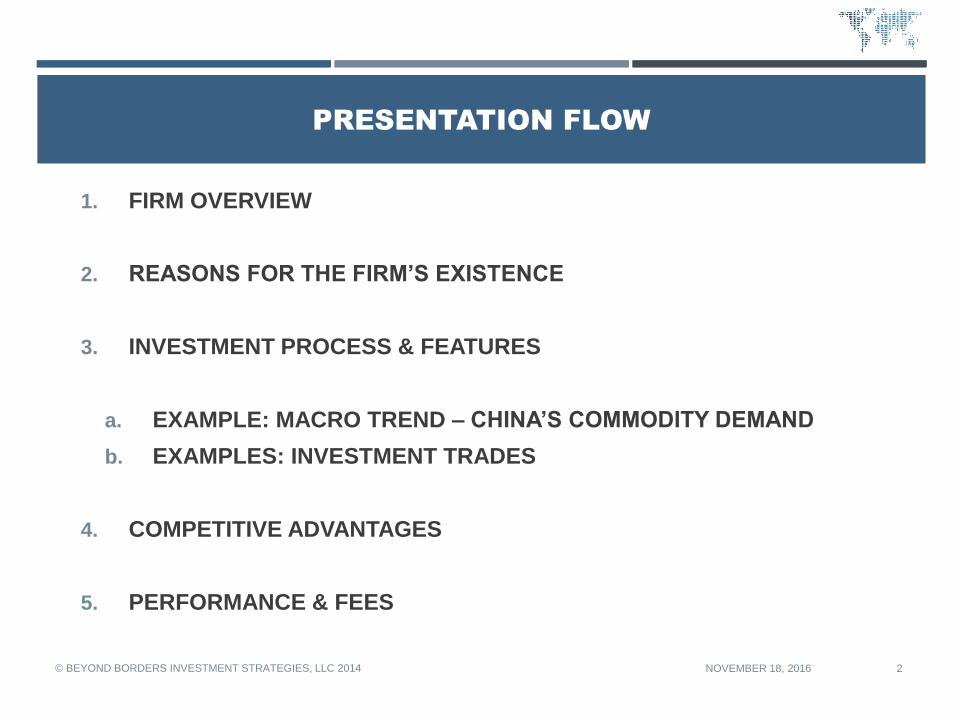
PRESENTATION FLOW
1. FIRM OVERVIEW
2. REASONS FOR THE FIRM’S EXISTENCE
3. INVESTMENT PROCESS & FEATURES
a. EXAMPLE: MACRO TREND – CHINA’S COMMODITY DEMAND
b. EXAMPLES: INVESTMENT TRADES
4. COMPETITIVE ADVANTAGES
5. PERFORMANCE & FEES
NOVEMBER 18, 2016© BEYOND BORDERS INVESTMENT STRATEGIES, LLC 2014 2

FIRM OVERVIEW
NOVEMBER 18, 2016© BEYOND BORDERS INVESTMENT STRATEGIES, LLC 2014 3
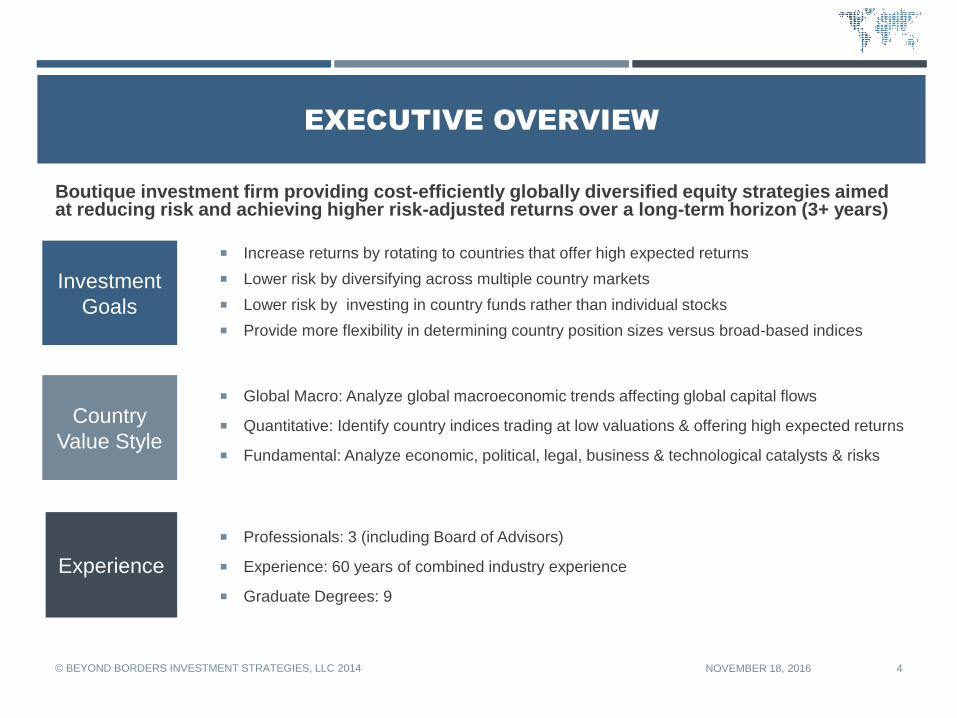
EXECUTIVE OVERVIEW
Boutique investment firm providing cost-efficiently globally diversified equity strategies aimed at reducing risk and achieving higher risk-adjusted returns over a long-term horizon (3+ years)
NOVEMBER 18, 2016© BEYOND BORDERS INVESTMENT STRATEGIES, LLC 2014 4
Investment
Goals
Professionals: 3 (including Board of Advisors)
Experience: 60 years of combined industry experience
Graduate Degrees: 9
Country
Value Style
Global Macro: Analyze global macroeconomic trends affecting global capital flows
Quantitative: Identify country indices trading at low valuations & offering high expected returns
Fundamental: Analyze economic, political, legal, business & technological catalysts & risks
Experience
Increase returns by rotating to countries that offer high expected returns
Lower risk by diversifying across multiple country markets
Lower risk by investing in country funds rather than individual stocks
Provide more flexibility in determining country position sizes versus broad-based indices
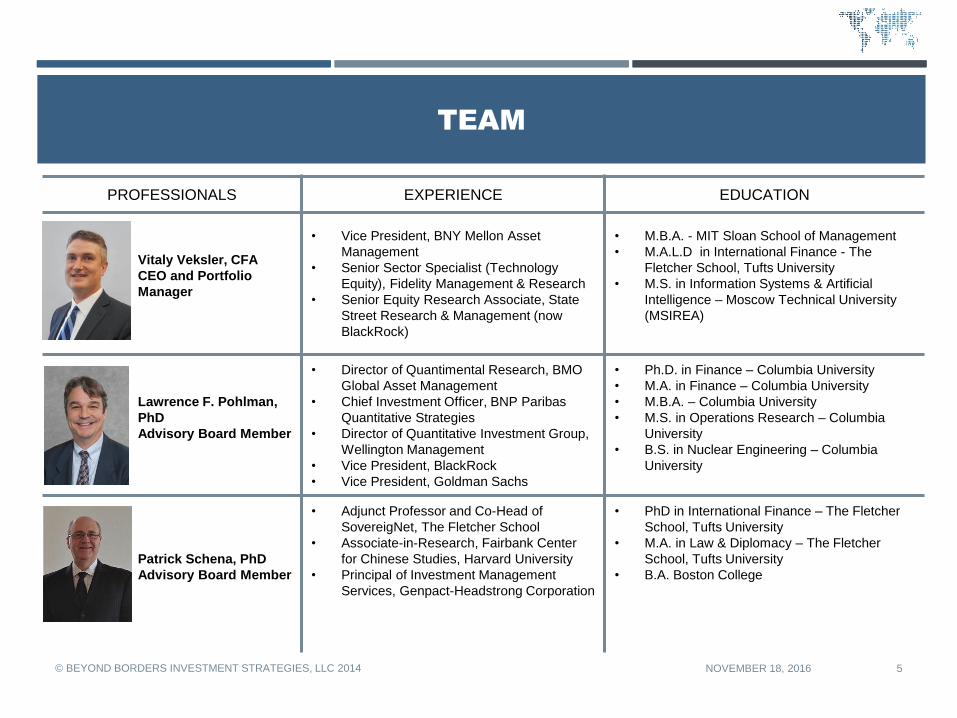
TEAM
PROFESSIONALS EXPERIENCE EDUCATION
Vitaly Veksler, CFA
CEO and Portfolio
Manager
• Vice President, BNY Mellon Asset
Management
• Senior Sector Specialist (Technology
Equity), Fidelity Management & Research
• Senior Equity Research Associate, State
Street Research & Management (now
BlackRock)
• M.B.A. - MIT Sloan School of Management
• M.A.L.D in International Finance - The
Fletcher School, Tufts University
• M.S. in Information Systems & Artificial
Intelligence – Moscow Technical University
(MSIREA)
Lawrence F. Pohlman,
PhD
Advisory Board Member
• Director of Quantimental Research, BMO
Global Asset Management
• Chief Investment Officer, BNP Paribas
Quantitative Strategies
• Director of Quantitative Investment Group,
Wellington Management
• Vice President, BlackRock
• Vice President, Goldman Sachs
• Ph.D. in Finance – Columbia University
• M.A. in Finance – Columbia University
• M.B.A. – Columbia University
• M.S. in Operations Research – Columbia
University
• B.S. in Nuclear Engineering – Columbia
University
Patrick Schena, PhD
Advisory Board Member
• Adjunct Professor and Co-Head of
SovereigNet, The Fletcher School
• Associate-in-Research, Fairbank Center
for Chinese Studies, Harvard University
• Principal of Investment Management
Services, Genpact-Headstrong Corporation
• PhD in International Finance – The Fletcher
School, Tufts University
• M.A. in Law & Diplomacy – The Fletcher
School, Tufts University
• B.A. Boston College
NOVEMBER 18, 2016© BEYOND BORDERS INVESTMENT STRATEGIES, LLC 2014 5
REASONS FOR THE FIRM’S EXISTENCE
NOVEMBER 18, 2016© BEYOND BORDERS INVESTMENT STRATEGIES, LLC 2014 6

INVESTORS’ PROBLEM: HOME COUNTRY BIAS
NOVEMBER 18, 2016© BEYOND BORDERS INVESTMENT STRATEGIES, LLC 2014 7
Investors could increase their total portfolio returns by investing in international equities
International equities outperformed for long periods (56% of time during the 21st century)
International diversification can reduce volatility of investment portfolios
Source: Datastream. International Equity returns are represented by those of MSCI ACWI ex USA Equal Weighted Index, US Equity
returns – by Standard & Poor's 500 Index. Data are from December 31, 1999 to September 30, 2016.
-80%-60%-40%-20%
0%20%40%60%80%
100%120%
De
c-9
9
Jun
-00
De
c-0
0
Jun
-01
De
c-0
1
Jun
-02
De
c-0
2
Jun
-03
De
c-0
3
Jun
-04
De
c-0
4
Jun
-05
De
c-0
5
Jun
-06
De
c-0
6
Jun
-07
De
c-0
7
Jun
-08
De
c-0
8
Jun
-09
De
c-0
9
Jun
-10
De
c-1
0
Jun
-11
De
c-1
1
Jun
-12
De
c-1
2
Jun
-13
De
c-1
3
Jun
-14
De
c-1
4
Jun
-15
De
c-1
5
Jun
-16
Ind
ex R
etu
rns, Y
oY
International & US Equities Outperformance Periods(Dec 31, 1999 - Sep 30, 2016)
Intl Equity US Equity
International Equity
OutperformanceUS Equity
Outperformance
INTERNATIONAL DIVERSIFICATION INCREASES
RISK-ADJUSTED RETURNS
NOVEMBER 18, 2016© BEYOND BORDERS INVESTMENT STRATEGIES, LLC 2014 8
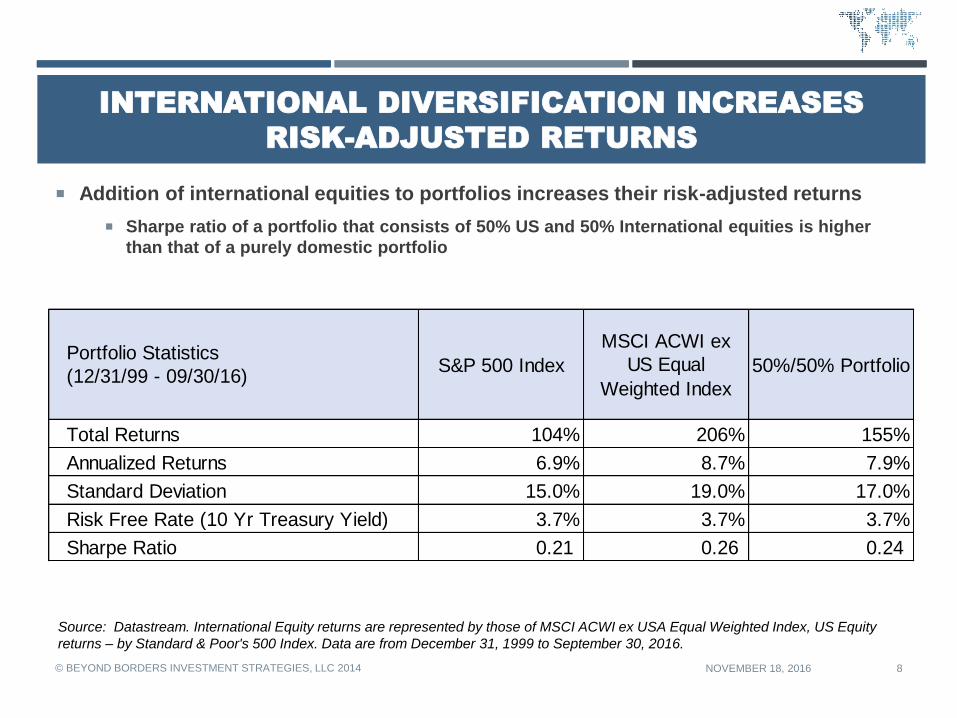
Addition of international equities to portfolios increases their risk-adjusted returns
Sharpe ratio of a portfolio that consists of 50% US and 50% International equities is higher
than that of a purely domestic portfolio
Source: Datastream. International Equity returns are represented by those of MSCI ACWI ex USA Equal Weighted Index, US Equity
returns – by Standard & Poor's 500 Index. Data are from December 31, 1999 to September 30, 2016.
Portfolio Statistics
(12/31/99 - 09/30/16)S&P 500 Index
MSCI ACWI ex
US Equal
Weighted Index
50%/50% Portfolio
Total Returns 104% 206% 155%
Annualized Returns 6.9% 8.7% 7.9%
Standard Deviation 15.0% 19.0% 17.0%
Risk Free Rate (10 Yr Treasury Yield) 3.7% 3.7% 3.7%
Sharpe Ratio 0.21 0.26 0.24

INVESTMENT PROCESS & FEATURES
NOVEMBER 18, 2016© BEYOND BORDERS INVESTMENT STRATEGIES, LLC 2014 9

NOVEMBER 18, 2016© BEYOND BORDERS INVESTMENT STRATEGIES, LLC 2014
10
INVESTMENT STRATEGY: COUNTRY ROTATION
Source: Datastream. Data are from January 1, 2006 to December 31, 2015.
Returns of Country Indices – Top Ten and Bottom Ten, US Dollars
Countries rotate from the Top Ten to the Bottom Ten, and anywhere in between, due to such
factors as:
Global sentiment and capital flows Regional attractiveness
Geopolitical crises Countries’ index valuations and investment sentiment
China 138% China 110% Colombia -19% Brazil 144% Thailand 63% Qatar 5% Turkey 66% UAE 63% China 49% Denmark 20%
Russia 74% Nigeria 108% Qatar -27% Russia 131% Philippines 59% Philippines 4% Nigeria 53% Argentina 62% Pakistan 33% Ireland 20%
Indonesia 70% Brazil 72% Japan -28% Indonesia 117% Colombia 58% Indonesia 3% Thailand 45% Finland 50% India 30% Japan 10%
Poland 59% India 71% Switzerland -28% Norway 107% Indonesia 52% US 2% Philippines 42% Ireland 42% Qatar 24% Belgium 6%
Philippines 57% Turkey 61% Chile -33% India 88% Argentina 52% Ireland -1% Poland 40% Pakistan 38% Philippines 23% China 5%
Singapore 52% Egypt 57% Argentina -34% Israel 88% Peru 50% Thailand -1% Greece 39% Denmark 37% Indonesia 20% Italy 4%
Spain 52% Finland 54% US -37% Taiwan 88% Chile 48% New Zealand -1% Pakistan 38% Greece 36% Egypt 20% Portugal 3%
Portugal 50% UAE 52% Peru -39% Chile 87% Sweden 33% Malaysia -2% Colombia 38% Singapore 34% Thailand 19% Israel 2%
Peru 47% Peru 46% Singapore -40% China 80% Malaysia 33% UK -3% Egypt 37% Spain 34% Turkey 18% Finland 2%
Ireland 46% Indonesia 46% Spain -40% Thailand 79% South Africa 32% Switzerland -5% New Zealand 31% Germany 32% Argentina 16% US 1%
US 15% US 16% US 32% US 14%
Canada 18% Belgium 10% Poland -59% Greece 30% UAE 0% Brazil -27% UAE 10% India -2% Malaysia -12% South Africa -22%
US 16% Argentina 9% India -62% Germany 29% Belgium -1% Argentina -29% Israel 9% China -4% Brazil -14% Malaysia -22%
Colombia 15% UK 9% China -63% Italy 29% France -6% Nigeria -30% Indonesia 6% Philippines -5% Poland -15% Canada -24%
Thailand 13% New Zealand 9% Austria -63% US 26% Ireland -7% Finland -31% Japan 5% Thailand -10% Norway -16% Nigeria -27%
South Korea 13% Italy 7% Norway -63% Switzerland 26% China -11% Poland -32% Singapore 4% Colombia -19% Austria -26% Turkey -30%
Egypt 11% Switzerland 6% Vietnam -66% UAE 15% Portugal -13% India -34% Spain 4% Peru -20% Colombia -26% Peru -30%
Pakistan 3% US 5% Greece -66% Finland 14% Italy -16% Turkey -36% China 4% Chile -21% Nigeria -32% Greece -30%
Japan 1% Sweden 3% Ireland -67% Qatar 10% Singapore -19% Austria -37% Qatar 1% Indonesia -22% Portugal -34% Egypt -31%
Turkey -3% Japan -6% Pakistan -68% Japan 3% Spain -19% Egypt -44% Brazil -2% Turkey -26% Greece -37% Colombia -39%
UAE -42% Ireland -16% Russia -72% Nigeria -35% Greece -38% Greece -53% Argentina -22% Brazil -27% Russia -43% Brazil -42%
2014 20152006 2007 2008 2009 2010 2011 2012 2013
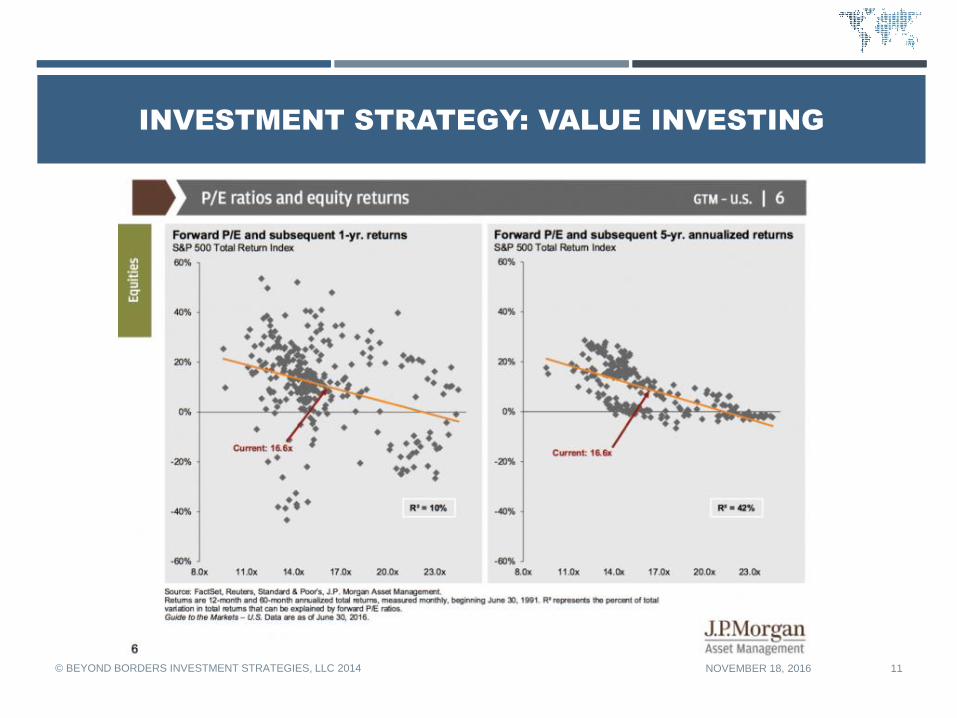
INVESTMENT STRATEGY: VALUE INVESTING
NOVEMBER 18, 2016© BEYOND BORDERS INVESTMENT STRATEGIES, LLC 2014 11

INVESTMENT STRATEGY: COUNTRY FUNDS AS BUILDING
BLOCKS
NOVEMBER 18, 2016© BEYOND BORDERS INVESTMENT STRATEGIES, LLC 2014 12
0%
50%
100%
150%
200%
250%
300%
350%
400%
450%
500%
Se
p-9
7
Dec-9
7
Ma
r-9
8
Jun
-98
Se
p-9
8
Dec-9
8
Ma
r-9
9
Jun
-99
Se
p-9
9
Dec-9
9
Ma
r-0
0
Jun
-00
Se
p-0
0
Dec-0
0
Ma
r-0
1
Jun
-01
Se
p-0
1
Dec-0
1
Ma
r-0
2
Jun
-02
Se
p-0
2
Dec-0
2
Ma
r-0
3
Jun
-03
Se
p-0
3
Dec-0
3
Ma
r-0
4
Jun
-04
Se
p-0
4
Dec-0
4
Ma
r-0
5
Jun
-05
Se
p-0
5
Dec-0
5
Ma
r-0
6
Jun
-06
Se
p-0
6
Dec-0
6
Ma
r-0
7
Jun
-07
Se
p-0
7
Yukos vs Russia's RTS Index
Yukos Russian RTS Index
CAGR = 15.7%
CAGR = -100%

NOVEMBER 18, 2016© BEYOND BORDERS INVESTMENT STRATEGIES, LLC 2014 13
INVESTMENT PROCESS
Our objective is to provide a cost-efficient way to alleviate the home country bias
thereby helping investors increase returns on their portfolios while decreasing risk
Superior
Returns
• Research global trends in economies,
commodities, politics, policy, etc.
GLOBAL MACRO ANALYSIS
• Identify countries with low current
valuations vs. historical
COUNTRY SELECTION
• Valuations
• Growth Indicators
• Dividends
EXPECTED RETURNS
COUNTRY CATALYSTS & RISKS
• Global Macroeconomic Trends
• Political Reasons
• Economic Reasons
• Legislative Reasons

Increasing Returns: Investors can increase their
portfolios’ returns by investing in international
equities as they can outperform US equities for
long periods (as it happened in the past)
Risk Management: We diversify the portfolios by
investing in 10-20 ETFs
Risk Management: Any country position should
not exceed an annual average of 10% of the
portfolio
Risk Management: We use ETFs because they
provide more diversification within countries and
are not heavily weighted to individual stocks
Cost Efficiency: ETFs are very inexpensive to
trade
NOVEMBER 18, 2016© BEYOND BORDERS INVESTMENT STRATEGIES, LLC 2014 14
PORTFOLIO MANAGEMENT
10-20 ETFs
Cost-efficient, diversified portfolio
We create client portfolios from single-country ETFs by rotating countries that trade at low
valuations and offer high expected returns into the portfolios to increase returns and manage risk
in the cost-efficient way

EXAMPLE: MACRO TREND – CHINA’S
COMMODITY DEMAND
NOVEMBER 18, 2016© BEYOND BORDERS INVESTMENT STRATEGIES, LLC 2014 15

NOVEMBER 18, 2016© BEYOND BORDERS INVESTMENT STRATEGIES, LLC 2014 16
GLOBAL MACRO ANALYSIS: CHINA IS TO CONTRIBUTE
MOST TO GLOBAL GROWTH
USA24%
China18%
Eurozone14%
Japan5%
ROW38%
ACTUAL GLOBAL GDP 2015
2.3%
6.1%
1.6%0.4%
4.2% 3.6%
REAL GDP GROWTH RATES2016-2020
USA China Eurozone
Japan ROW World
USA15%
China33%
Eurozone6%
Japan1%
ROW45%
CONTRIBUTION TO REAL GLOBAL GDP GROWTH - 2016-2020
Source: The International Monetary Fund, World Economic Outlook, April 12, 2016
NOVEMBER 18, 2016© BEYOND BORDERS INVESTMENT STRATEGIES, LLC 2014 17
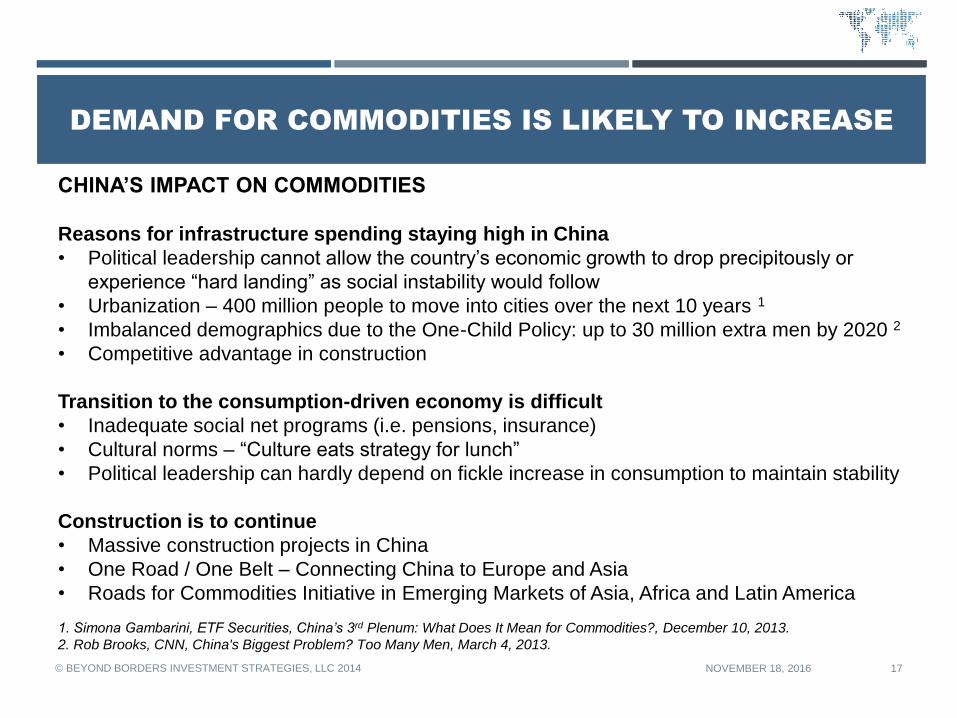
DEMAND FOR COMMODITIES IS LIKELY TO INCREASE
CHINA’S IMPACT ON COMMODITIES
Reasons for infrastructure spending staying high in China
• Political leadership cannot allow the country’s economic growth to drop precipitously or
experience “hard landing” as social instability would follow
• Urbanization – 400 million people to move into cities over the next 10 years 1
• Imbalanced demographics due to the One-Child Policy: up to 30 million extra men by 2020 2
• Competitive advantage in construction
Transition to the consumption-driven economy is difficult
• Inadequate social net programs (i.e. pensions, insurance)
• Cultural norms – “Culture eats strategy for lunch”
• Political leadership can hardly depend on fickle increase in consumption to maintain stability
Construction is to continue
• Massive construction projects in China
• One Road / One Belt – Connecting China to Europe and Asia
• Roads for Commodities Initiative in Emerging Markets of Asia, Africa and Latin America
1. Simona Gambarini, ETF Securities, China’s 3rd Plenum: What Does It Mean for Commodities?, December 10, 2013.
2. Rob Brooks, CNN, China's Biggest Problem? Too Many Men, March 4, 2013.
SLOW TRANSITION FROM INVESTMENT-DRIVEN TO
CONSUMPTION-DRIVEN GROWTH
No adequate social protection yet
Inadequate pension protection for older people
Cultural norms: Being frugal is glorious
NOVEMBER 18, 2016© BEYOND BORDERS INVESTMENT STRATEGIES, LLC 2014
18

NEW GROWTH ENGINES … THAT ARE VERY REMINISCENT OF
OLD ONES
Back to the old strengths: Construction of infrastructure in China
China’s 13th five-year economic plan (2016-2020): 2
Construction of 50 new airports and making international hubs out of domestic airports in Harbin, Kunming,
Urumqi, Shenzhen, Chongqing, Chengdu and Xi'an
Building a second train line to Tibet 3
Constructing 3,000 kilometers of new urban rail lines
Expanding the high-speed rail network from 20,000 to 30,000 kilometers, covering 80% of major cities
Construction and operation of 30,000 kilometers of new expressways
Investing over 800 billion yuan ($124 B) and 1.65 trillion yuan ($255 B) in railway and road construction
Building infrastructure abroad: Need for infrastructure in Asia ($8 trillion) 4
Developing goodwill and trade abroad
Launch of the Asian Infrastructure Investment Bank
Millions of extra men that China has due to gender skew caused by the One-Child Policy could be employed
NOVEMBER 18, 2016© BEYOND BORDERS INVESTMENT STRATEGIES, LLC 2014 19
Sources:
1. Qu Hongbin, HSBC, China Inside Out: Why Worries About China are Overblown, August 31, 2015.
2. King & Wood Mallesons, China's 13th Five Year Plan: Infrastructure, April 14, 2016. This source is for all comments in this paragraph unless
specifically stated otherwise.
3. The Economist, The National People’s Congress: Unlucky for Some, March 12, 2016
4. Lilian Karunungan, Bloomberg, ADB Sees East Asia Growth Risk on $8 Trillion Funding Challenge, September 25, 2013.

EXAMPLES: INVESTMENT TRADES
NOVEMBER 18, 2016© BEYOND BORDERS INVESTMENT STRATEGIES, LLC 2014 20
NOVEMBER 18, 2016© BEYOND BORDERS INVESTMENT STRATEGIES, LLC 2014 21
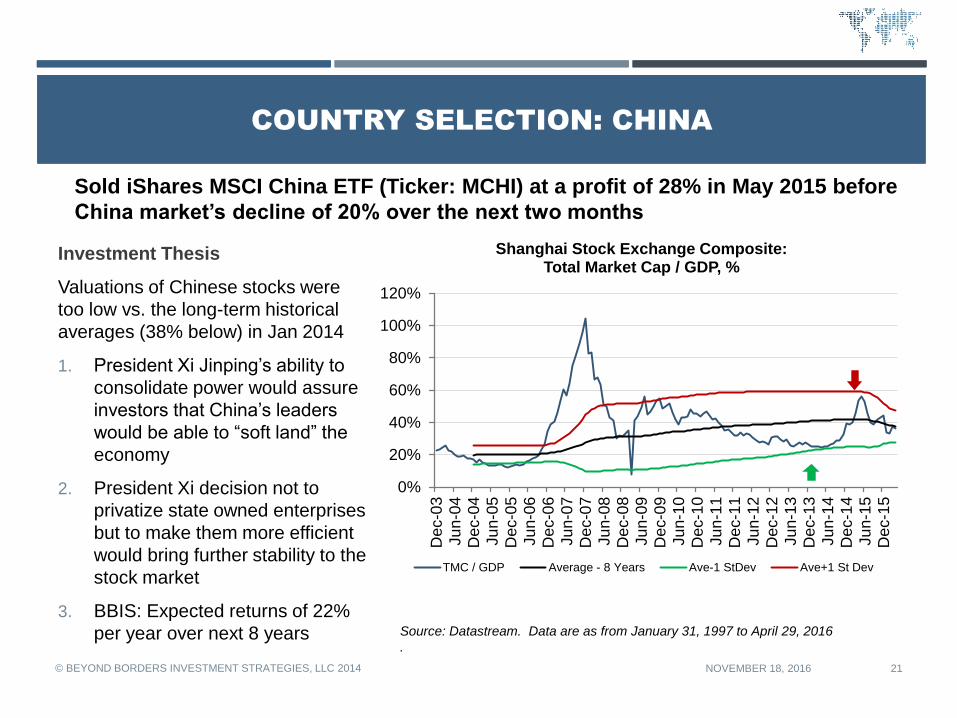
COUNTRY SELECTION: CHINA
Investment Thesis
Valuations of Chinese stocks were
too low vs. the long-term historical
averages (38% below) in Jan 2014
1. President Xi Jinping’s ability to
consolidate power would assure
investors that China’s leaders
would be able to “soft land” the
economy
2. President Xi decision not to
privatize state owned enterprises
but to make them more efficient
would bring further stability to the
stock market
3. BBIS: Expected returns of 22%
per year over next 8 years
Sold iShares MSCI China ETF (Ticker: MCHI) at a profit of 28% in May 2015 before
China market’s decline of 20% over the next two months
Source: Datastream. Data are as from January 31, 1997 to April 29, 2016
.
0%
20%
40%
60%
80%
100%
120%
Dec-0
3Ju
n-0
4D
ec-0
4Ju
n-0
5D
ec-0
5Ju
n-0
6D
ec-0
6Ju
n-0
7D
ec-0
7Ju
n-0
8D
ec-0
8Ju
n-0
9D
ec-0
9Ju
n-1
0D
ec-1
0Ju
n-1
1D
ec-1
1Ju
n-1
2D
ec-1
2Ju
n-1
3D
ec-1
3Ju
n-1
4D
ec-1
4Ju
n-1
5D
ec-1
5
Shanghai Stock Exchange Composite: Total Market Cap / GDP, %
TMC / GDP Average - 8 Years Ave-1 StDev Ave+1 St Dev

Investment Thesis
Egyptian stock market was trading at a
62% discount to its long-term historical
valuations due to the disarray in
Egypt’s economy caused by the
mismanagement under President
Morsi
1. President Fatah Al-Sisi would
restore stability needed to grow
Egypt’s economy
2. The value of Egyptian Pound
would recover after 13.8% drop
(vs. USD) during Morsi’s rule
3. BBIS: Expected returns of 31%
over the next 8 years
NOVEMBER 18, 2016© BEYOND BORDERS INVESTMENT STRATEGIES, LLC 2014 22
COUNTRY SELECTION: EGYPT
• Sold Market Vectors Egypt Index ETF (Ticker: EGPT) at a profit of about 18% at
the end of May 2015 due to the introduction of two new rules imposing 10% taxes
on capital gains and dividends
Source: Datastream. Data are as from December 31, 2003 to April 29, 2016
.
0%
10%
20%
30%
40%
50%
60%
70%
80%
Dec-0
3Ju
n-0
4D
ec-0
4Ju
n-0
5D
ec-0
5Ju
n-0
6D
ec-0
6Ju
n-0
7D
ec-0
7Ju
n-0
8D
ec-0
8Ju
n-0
9D
ec-0
9Ju
n-1
0D
ec-1
0Ju
n-1
1D
ec-1
1Ju
n-1
2D
ec-1
2Ju
n-1
3D
ec-1
3Ju
n-1
4D
ec-1
4Ju
n-1
5D
ec-1
5
Egypt Hermes Financial Index: Total Market Cap / GDP, %
TMC / GDP Average - 8 Years Ave-1 StDev Ave+1 St Dev

COMPETITIVE ADVANTAGES
NOVEMBER 18, 2016© BEYOND BORDERS INVESTMENT STRATEGIES, LLC 2014 23

NOVEMBER 18, 2016© BEYOND BORDERS INVESTMENT STRATEGIES, LLC 2014 24
COMPETITIVE ADVANTAGES OVER STOCK PICKERS
Source: MSCI for the number of companies in the index. The number is as of December 31, 2015.
BBIS does not have unknown investment biases and offers better
diversification benefits
No Unknown
Investment
Biases
Better
Diversification
BBIS
40 or so analysts needed to cover 1,837 stocks in
MSCI ACWI ex USA Value Weighted Index have stock
selection biases unknown to clients
Loudest & more sociable analysts have
disproportionately high weight of stock ideas in their
firms’ portfolios
One or two equities per country. Stock specific risks
are high
Many small countries are not represented in portfolios
Difficult to pick individual stocks that would outperform
in each or most countries as local investors in each
country have an informational edge
Competitors
Lower Risk
The same disciplined process is applied to analysis of
all 48 country ETFs
Clients need to understand only one investment
process
Wider diversification as each ETF has at least 20
stocks per country
Ability to invest in smaller countries, while long-term
weight of any country cannot exceed 10% of portfolio
Relatively easier to pick countries right (if one has an
investment process)

COMPETITIVE ADVANTAGES OVER GLOBAL INDICES
Index: Impossible to invest meaningful
percentages in 41 countries as their weight
within MSCI ACWI ex USA Value Weighted
Index is less than 39%
BBIS: The firm can invest meaningful
percentages via ETFs of up to 48 countries
Index: Weight of countries with high
valuations that offer relatively low expected
returns is high and is not flexible
BBIS: Flexibility in taking sizable positions
(up to 10%) in developed, emerging and
frontier countries
NOVEMBER 18, 2016© BEYOND BORDERS INVESTMENT STRATEGIES, LLC 2014 25
BBIS can invest meaningful amounts of capital in most countries while global indices’ composition
is dominated by several large countries and country weights are not flexible
Source: MSCI for index’s country weights. They are as of December 31, 2015.
18.3%
14.0%
7.3%
6.7%5.2%5.2%
4.7%
38.6%
Country Weights of MSCI ACWI ex US Value Weighted Index
Japan UK Germany France
Canada Korea Switzerland Rest of the World

PERFORMANCE AND FEES
NOVEMBER 18, 2016© BEYOND BORDERS INVESTMENT STRATEGIES, LLC 2014 26
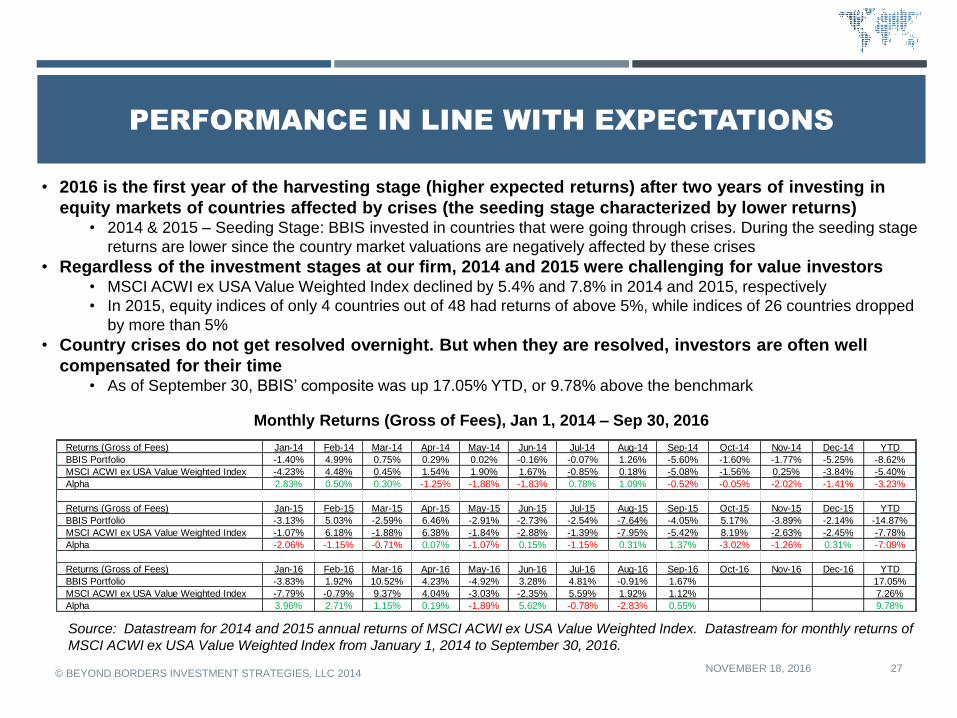
PERFORMANCE IN LINE WITH EXPECTATIONS
NOVEMBER 18, 2016© BEYOND BORDERS INVESTMENT STRATEGIES, LLC 2014 27
Source: Datastream for 2014 and 2015 annual returns of MSCI ACWI ex USA Value Weighted Index. Datastream for monthly returns of
MSCI ACWI ex USA Value Weighted Index from January 1, 2014 to September 30, 2016.
Monthly Returns (Gross of Fees), Jan 1, 2014 – Sep 30, 2016
• 2016 is the first year of the harvesting stage (higher expected returns) after two years of investing in
equity markets of countries affected by crises (the seeding stage characterized by lower returns)• 2014 & 2015 – Seeding Stage: BBIS invested in countries that were going through crises. During the seeding stage
returns are lower since the country market valuations are negatively affected by these crises
• Regardless of the investment stages at our firm, 2014 and 2015 were challenging for value investors• MSCI ACWI ex USA Value Weighted Index declined by 5.4% and 7.8% in 2014 and 2015, respectively
• In 2015, equity indices of only 4 countries out of 48 had returns of above 5%, while indices of 26 countries dropped
by more than 5%
• Country crises do not get resolved overnight. But when they are resolved, investors are often well
compensated for their time• As of September 30, BBIS’ composite was up 17.05% YTD, or 9.78% above the benchmark
Returns (Gross of Fees) Jan-14 Feb-14 Mar-14 Apr-14 May-14 Jun-14 Jul-14 Aug-14 Sep-14 Oct-14 Nov-14 Dec-14 YTD
BBIS Portfolio -1.40% 4.99% 0.75% 0.29% 0.02% -0.16% -0.07% 1.26% -5.60% -1.60% -1.77% -5.25% -8.62%
MSCI ACWI ex USA Value Weighted Index -4.23% 4.48% 0.45% 1.54% 1.90% 1.67% -0.85% 0.18% -5.08% -1.56% 0.25% -3.84% -5.40%
Alpha 2.83% 0.50% 0.30% -1.25% -1.88% -1.83% 0.78% 1.09% -0.52% -0.05% -2.02% -1.41% -3.23%
Returns (Gross of Fees) Jan-15 Feb-15 Mar-15 Apr-15 May-15 Jun-15 Jul-15 Aug-15 Sep-15 Oct-15 Nov-15 Dec-15 YTD
BBIS Portfolio -3.13% 5.03% -2.59% 6.46% -2.91% -2.73% -2.54% -7.64% -4.05% 5.17% -3.89% -2.14% -14.87%
MSCI ACWI ex USA Value Weighted Index -1.07% 6.18% -1.88% 6.38% -1.84% -2.88% -1.39% -7.95% -5.42% 8.19% -2.63% -2.45% -7.78%
Alpha -2.06% -1.15% -0.71% 0.07% -1.07% 0.15% -1.15% 0.31% 1.37% -3.02% -1.26% 0.31% -7.09%
Returns (Gross of Fees) Jan-16 Feb-16 Mar-16 Apr-16 May-16 Jun-16 Jul-16 Aug-16 Sep-16 Oct-16 Nov-16 Dec-16 YTD
BBIS Portfolio -3.83% 1.92% 10.52% 4.23% -4.92% 3.28% 4.81% -0.91% 1.67% 17.05%
MSCI ACWI ex USA Value Weighted Index -7.79% -0.79% 9.37% 4.04% -3.03% -2.35% 5.59% 1.92% 1.12% 7.26%
Alpha 3.96% 2.71% 1.15% 0.19% -1.89% 5.62% -0.78% -2.83% 0.55% 9.78%

INVESTMENT MANAGEMENT FEES
NOVEMBER 18, 2016© BEYOND BORDERS INVESTMENT STRATEGIES, LLC 2014 28
• Fees are charged as percentage of assets under management (AUM) at the end of each month
• Fees shown below are subject to change by written notice and are negotiable
• Fees are charged to the clients’ accounts automatically with the clients’ written authorization
Account SizeAnnual Fees,
% of AUM
$100,000 - $1,000,000 1.00%
$1,000,000 - $5,000,000 0.75%
Above $5,000,000 0.50%
To learn more about BBIS and how our
services can help you achieve
improved risk-adjusted returns through
our expert research and unique global
portfolio diversification strategy, please
contact us by email or phone.
Beyond Borders Investment Strategies, LLC
23 Kenwood Street, Suite 2
Brookline, MA 02446
Email: [email protected]
Phone: 617-817-2163
NOVEMBER 18, 2016© BEYOND BORDERS INVESTMENT STRATEGIES, LLC 2014 29
CONTACT

DISCLAIMER
The information, opinions, and other materials contained in this presentation is the property of Beyond Borders
Investment Strategies, LLC and may not be reproduced in any way, in whole or in part, without express authorization
of the firm in writing.
This document does not constitute an offer to sell or the solicitation of an offer to purchase any security or
investment product. Any such offer or solicitation may only be made by means of delivery of an Investment Advisory
Agreement. Such documentation must be received and reviewed prior to any investment decision. Any person
subscribing for an investment must be able to bear the risks involved and must meet the suitability requirements
relating to such investments. Some or all alternative investment programs may not be suitable for certain investors.
The indicative terms and other information included in this presentation are provided for discussion purposes and are
subject to completion or amendment.
The statements and statistics contained in this presentation have been prepared by Beyond Borders Investment
Strategies, LLC based on information from sources considered to be reliable. However, any analyses provided to
assist the recipient of this presentation in evaluating the matters described herein may be based on subjective
assessments and assumptions and may use one among alternative methodologies that produce different results.
There can be no assurance that the strategy described herein will meet its objectives generally, or avoid losses. Past
performance is no guarantee of future results.
The disclaimers and risks set forth at the conclusion of this presentation are an integral part of, and must be
considered together with, the information provided throughout this presentation.
NOVEMBER 18, 2016© BEYOND BORDERS INVESTMENT STRATEGIES, LLC 2014 30