Embed Size (px)
Citation preview
Beyond Accuracy: ROI-driven Data Analytics of Empirical DataGouri Deshpande
[email protected] of Calgary
Calgary, Canada
Guenther [email protected]
University of CalgaryCalgary, Canada
ABSTRACTBackground: The unprecedented access to data has rendered a re-markable opportunity to analyze, understand, and optimize theinvestigation approaches in almost all the areas of (Empirical) Soft-ware Engineering. However, data analytics is time and effort con-suming, thus, expensive, and not automatically valuable.
Objective: This vision paper demonstrates that it is crucial toconsider Return-on-Investment (ROI) when performing Data Ana-lytics. Decisions on "How much analytics is needed"? are hard toanswer. ROI could guide for decision support on the What?, How?,and How Much? analytics for a given problem.
Method: The proposed conceptual framework is validated throughtwo empirical studies that focus on requirements dependencies ex-traction in the Mozilla Firefox project. The two case studies are (i)Evaluation of fine-tuned BERT against Naive Bayes and RandomForest machine learners for binary dependency classification and(ii) Active Learning against passive Learning (random sampling) forREQUIRES dependency extraction. For both the cases, their analysisinvestment (cost) is estimated, and the achievable benefit from DAis predicted, to determine a break-even point of the investigation.
Results: For the first study, fine-tuned BERT performed superiorto the Random Forest, provided that more than 40% of trainingdata is available. For the second, Active Learning achieved higherF1 accuracy within fewer iterations and higher ROI compared toBaseline (Random sampling based RF classifier). In both the stud-ies, estimate on, How much analysis likely would pay off for theinvested efforts?, was indicated by the break-even point.
Conclusions: Decisions for the depth and breadth of DA of empir-ical data should not be made solely based on the accuracy measures.Since ROI-driven Data Analytics provides a simple yet effectivedirection to discover when to stop further investigation while con-sidering the cost and value of the various types of analysis, it helpsto avoid over-analyzing empirical data.
KEYWORDSData Analytics, Return-on-Investment, Requirements Engineering,Dependency extraction, BERT, Mozilla
Permission to make digital or hard copies of all or part of this work for personal orclassroom use is granted without fee provided that copies are not made or distributedfor profit or commercial advantage and that copies bear this notice and the full citationon the first page. Copyrights for components of this work owned by others than ACMmust be honored. Abstracting with credit is permitted. To copy otherwise, or republish,to post on servers or to redistribute to lists, requires prior specific permission and/or afee. Request permissions from [email protected] ’20, October 8–9, 2020, Bari, Italy© 2020 Association for Computing Machinery.ACM ISBN 978-1-4503-7580-1/20/10. . . $15.00https://doi.org/10.1145/3382494.3422159
ACM Reference Format:Gouri Deshpande and Guenther Ruhe. 2020. Beyond Accuracy: ROI-drivenData Analytics of Empirical Data. In ACM / IEEE International Symposiumon Empirical Software Engineering and Measurement (ESEM) (ESEM ’20),October 8–9, 2020, Bari, Italy. ACM, New York, NY, USA, 6 pages. https://doi.org/10.1145/3382494.3422159
1 INTRODUCTIONReturn-on-Investment (ROI) is of great interest in engineering andbusiness for arriving at decisions. This is true in Software Engi-neering (SE) as well. For example, Silverio et al. [16] evaluatedcost-benefit analysis for the adoption of software reference archi-tectures for optimizing architectural decision-making. Cleland etal. [8] studied the ROI of heterogeneous solutions for the improve-ment of the ROI of requirements traceability. Recent data explosionin the form of big data and advances in Machine Learning (ML)have posed questions on the efficiency and effectiveness of theseprocesses that have become more relevant. In this paper, we presenta retrospective evaluation of two empirical studies taken from thefield of requirements dependency analysis for the benefit of ROI.
Data Analytics in SE (also called "Software Analytics" by Bird etal. [6]) is a term widely used, sometimes with a slightly differentmeaning. We subsume all efforts devoted to collecting, cleaning,preparing, classifying, analyzing data, and interpreting the resultsas Data Analytics (DA). In SE, the goal of DA is to provide betterinsights into some aspects of the software development life-cycle,which could facilitate some form of understanding, monitoring, orimprovement of processes, products or projects.
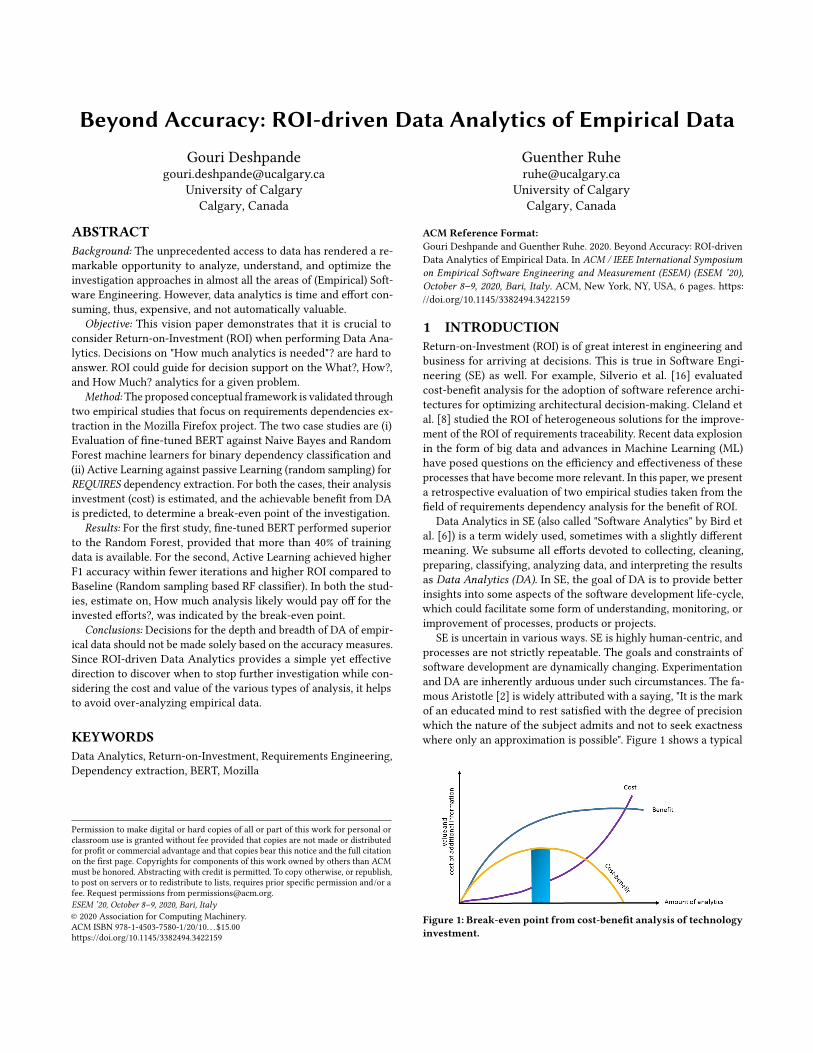
SE is uncertain in various ways. SE is highly human-centric, andprocesses are not strictly repeatable. The goals and constraints ofsoftware development are dynamically changing. Experimentationand DA are inherently arduous under such circumstances. The fa-mous Aristotle [2] is widely attributed with a saying, "It is the markof an educated mind to rest satisfied with the degree of precisionwhich the nature of the subject admits and not to seek exactnesswhere only an approximation is possible". Figure 1 shows a typical
Figure 1: Break-even point from cost-benefit analysis of technologyinvestment.
ESEM ’20, October 8–9, 2020, Bari, Italy Gouri Deshpande and Guenther Ruhe
ROI (cost-benefit) curve of technology usage. Following some phaseof increase, the curve reaches saturation, so, beyond that point, fur-ther investment does not pay off. We contemplate that a similarbehaviour holds true for applying DA. Our research hypothesisis that ROI-driven DA helps to determine the break-even point ofinvestment and thus optimizes resources spent in this process.
Paper structure: Section 2 discusses related work. The problemformulation is detailed in Section 3. Section 4 explains the empiricalROI investigation approach for the two problems. A discussion ofthe applicability of the results is elaborated in Section 5. Finally,Section 6, provides an outlook on future research.
2 RELATEDWORK2.1 ROI Analysis in Software EngineeringEvaluating the profitability of expenditure helps to measure successover a period of time thus takes the guesswork away from theconcrete decision-making process. For instance, Erdogmus et al.[15] analyzed the ROI of quality investment to bring its importancein perspective and posed important questions, “We generally wantto increase a software products quality because fixing existingsoftware takes valuable time away from developing new software.But how much investment in software quality is desirable? Whenshould we invest, and where?”.
Begel & Zimmermann [3] composed a set of 145 questions - basedon a survey with more than 200 developers and testers - that areconsidered relevant for DA at Microsoft. One of the questions:“Howimportant is it to have a software DA team answer this question?”,expected answer on a five-point scale (Essential to I don’t under-stand). Although it provides a sneak peek of the development andtesting environments of Microsoft, it does not prove any emphasison any form of ROI. Essentially, we speculate that the ROI aspectwas softened into asking for the perceived subjective importancethrough this question.
Boehm et al. [7] presented quantitative results on the ROI ofSystems Engineering based on the analysis of the 161 softwareprojects in the COCOMO II database. Van Solingen [29] analyzedthe ROI of software process improvement and took a macro per-spective to evaluate corporate programs targeting the improvementof organizational maturity. Ferrari et al. [17] studied the ROI fortext mining and showed that it has not only a tangible impact interms of ROI but also an intangible benefits - which occur fromthe investment in the knowledge management solution that is notdirectly translated into returns, but that must be considered in theprocess of judgment to integrate the financial perspective of analy-sis with the non-financial ones. A lot of benefits occurring from theinvestment in this knowledge management solution are not directlytranslated into returns, but they must be considered in the processof judgment to integrate the financial perspective of analysis withthe non-financial ones.
Ruhe and Nayebi [23] proposed the Analytics Design Sheet as ameans to sketch the skeleton of the main components of the DAprocess. The four-quadrant template provides direction to brain-storm candidate DA methods and techniques in response to theproblem statement and the data available. In its nature, the sheetis qualitative. ROI analysis goes further and adds a quantitativeperspective for outlining DA.
2.2 Empirical Analysis for RequirementsDependency Extraction
The extraction of dependencies among requirements is an activefield of SE research. The practical importance of the topic wasconfirmed by our survey [13]. More than 80% of the participantsagreed or strongly agreed that (i) dependency type extraction isdifficult in practice, (ii) dependency information has implicationson maintenance, and (iii) ignoring dependencies has a significantill impact on project success.
In the recent past, many empirical studies have explored di-verse computational methods that used natural language processing(NLP) [10] [24], semi-supervised technique [12], hybrid techniques[11] and deep learning [18]. However, none of the approaches con-sidered ROI to decide among techniques and the depth and breadthof their execution level.
3 CONCEPTUAL FRAMEWORK FORROI-DRIVEN DATA ANALYTICS
Differentmodels exist that provide guidance to performDA.Wieringa[30] provides a checklist for what he calls the design cycle and theempirical cycle. In this study, we use the term Scoping for definingthe problem and the analysis objectives. Scoping also means defin-ing the boundaries that help to exclude non-essential parts of theinvestigation. Analysis of the projected Return-on-Investment (ROI)serves as an input for scoping.
3.1 Research QuestionDA follows a resource and computation-intensive process consti-tuting data gathering and processing components that are the non-trivial proportion of the total research cost. Thus, it is essential toaccount for these to compute the overall cost-benefit and optimizeit further.
Our aim is to look at DA for empirical studies retrospectively(already conducted studies in the past). In particular, we are inter-ested in Requirements Dependency Analysis (RDA) based studies.Through this research, we define and validate the principal con-cepts needed for ROI-driven DA. Our research question is:
RQ: What are the benefits of ROI-driven Data Analytics in thestudies focusing on Requirements Dependency Analysis?
Justification: As for any investment, it is most important to knowhow much is enough. There is no incentive to invest in analyticsjust for the sake of performing some analysis. Although one cannotclaim exactness from this, it is worthwhile to get some form ofguidance on where (which techniques) and how far (how much ofit) one should go. To make the analysis concrete, we have selectedRDA as the area of our specific investigations.
3.2 Cost FactorsData processing is an umbrella term used to combine data collec-tion (𝐶𝑑𝑔 ), pre-processing (𝐶𝑝𝑝 ) and labeling (𝐶𝑙 ) under one hood,each one of which is a cost component. However, not all costs arefixed and some vary based on the solution approach used to tackleany decision problem. For example, supervised Machine Learning(ML) requires a large amount of annotated data, to begin with,
Beyond Accuracy: ROI-driven Data Analytics of Empirical Data ESEM ’20, October 8–9, 2020, Bari, Italy
Table 1: Parameters used for ROI computation
Symbol Meaning Unit
Cost
𝐶𝑑𝑔 Data gathering time Minutes𝐶𝑝𝑝 Pre-processing time Minutes𝐶𝑒 Evaluation time Minutes𝐶𝑙 Labeling time Minutes
𝐶𝑟𝑒𝑠𝑜𝑢𝑟𝑐𝑒 Human resource cost $ per hour
Benefit
𝐵𝑟𝑒𝑤𝑎𝑟𝑑 Value per TP $𝐵𝑝𝑒𝑛𝑎𝑙𝑡𝑦 Penalty per FN $
𝐵𝐹1𝑖𝑡𝑒𝑟𝑎𝑡𝑖𝑜𝑛 F1 difference Number𝑃𝑉𝑎𝑙𝑢𝑒 Projected value per 1% F1
improvement$
Others
𝐻 #Human resources Number𝑁𝑡𝑟𝑎𝑖𝑛 Size of the training set Number𝑁𝑡𝑒𝑠𝑡 Size of the test set Number𝑁 𝑁𝑡𝑟𝑎𝑖𝑛 + 𝑁𝑡𝑒𝑠𝑡 Number
whereas Active Learning acquires these annotations over a periodof time in iterations until a stopping condition for classificationoperation is reached [25]. Additionally, there is a cost associatedwith modeling and evaluation (𝐶𝑒 ).
3.3 Value FactorsThe value returns or “benefits” are defined based on the needs ofthe decision problem. In the context of dependency extraction, thebenefit could be modeled in terms of the ability of the ML model toidentify a larger number of dependencies correctly (higher # of TruePositives TP: 𝐵𝑟𝑒𝑤𝑎𝑟𝑑 ) while limiting misclassification (reduced #of False Negatives FN: 𝐵𝑝𝑒𝑛𝑎𝑙𝑡𝑦 ). Conversely, the benefit couldalso be determined based on the net value (𝑃𝑉𝑎𝑙𝑢𝑒) of change ofaccuracy (𝐵𝐹1𝑖𝑡𝑒𝑟𝑎𝑡𝑖𝑜𝑛) in every iteration, especially when usingActive Learning. Table 1 lists the relevant cost components andtheir corresponding units. These will be utilized to compute the𝑅𝑂𝐼 later for the two different problems in Section 4.4.
3.4 ROITo determine the ROI, we follow the simplest form of its calculationrelating to the difference between 𝐵𝑒𝑛𝑒 𝑓 𝑖𝑡 and 𝐶𝑜𝑠𝑡 to the amountof 𝐶𝑜𝑠𝑡 . Both 𝐵𝑒𝑛𝑒 𝑓 𝑖𝑡 and 𝐶𝑜𝑠𝑡 are measured as human effort inperson hours.
𝑅𝑂𝐼 = (𝐵𝑒𝑛𝑒 𝑓 𝑖𝑡 −𝐶𝑜𝑠𝑡)/𝐶𝑜𝑠𝑡 (1)
Costa et al. [9] distinguished the “hard ROI” from the “soft ROI”. Theformer refers to the direct additional revenue generated and costsavings. The latter improved productivity, customer satisfaction,technological leadership, and efficiencies.
4 ROI OF TECHNIQUES FOR REQUIREMENTSDEPENDENCY ANALYSIS
We have selected the area of requirements dependency analysis(RDA) to illustrate and initially validate our former conceptualframework. In what follows, we introduce the key terms needed toformulate two Empirical Analysis Studies called EAS 1 resp. EAS 2.
4.1 Problem statementFollowing are the definitions of dependency types that are usedto state the two studies. For a set of requirements 𝑅 and a pair ofrequirements (𝑟, 𝑠) 𝜖 𝑅 × 𝑅
1) An INDEPENDENT relationship is defined as the absence ofany form of relationship between a pair of requirements.
2) A DEPENDENT relationship is defined as the complement set ofINDEPENDENT. i.e., there exists at least one type of the depen-dency types such as REQUIRES, SIMILAR, OR, AND, XOR, valuesynergy, effort synergy etc. between 𝑟 and 𝑠 .
3) REQUIRES is a special form of DEPENDENT relationship. If𝑟 requires 𝑠 , or 𝑠 requires 𝑟 , then, 𝑟 and 𝑠 are in a REQUIRESrelationship
4) OTHER type of dependency is when (𝑟, 𝑠) is DEPENDENT andthe dependency type is not REQUIRES (could be any of the otherdependency types mentioned in (2))
Problem 1- Binary requirements dependency extraction: Fora given set 𝑅 of requirements and their textual description, the bi-nary requirements dependency extraction problem aims to classifyeach pair (r,s) 𝜖 𝑅 × 𝑅 as DEPENDENT or INDEPENDENT.
Problem 2- Specific requirements dependency extraction ofthe type REQUIRES: For a given set 𝑅 of requirements and theirtextual description, the REQUIRES dependency extraction problemaims to classify for each pair (r,s) 𝜖 𝑅×𝑅 if they are in a 𝑅𝐸𝑄𝑈 𝐼𝑅𝐸𝑆
relationship.
4.2 Empirical Analysis Studies (EAS)In this section, we formulate two Empirical Analysis Studies, EAS1 and EAS 2, to investigate the two problems explained above. Weaim to analyze and compare Bidirectional Encoder Representationsfrom Transformers (BERT), and Active Learning (AL), both provento be of interest in general and pre-evaluated for their applicabilityto the stated problems, with traditional ML. For the two studies, weexamine the (F1) accuracy and the ROI of the whole process of DA.
EAS 1: We compare two supervised classification algorithms:Naive Bayes (NB) and Random Forest (RF) - ML algorithms success-fully and prominently used for text classification[19] in the past,with a fine-tuned BERT model [14]. The analysis was performedfor an incrementally growing training set size to capture its impacton F1 accuracy and ROI.
BERT (Bidirectional Encoder Representations from Transform-ers) [14] is a recent technique published by researchers fromGoogle.BERT is applying bidirectional training of Transformer, a popularattention model, to language modeling, which claims to be state-of-the-art for NLP tasks. In this study scenario, we explore the question,“How does fine-tune BERT compare with traditional algorithmson an economical scale?” by comparing models’ effectiveness withincurred ROI.
EAS 2: Random sampling (Passive Learning) randomly selects atraining set - referred to as Baseline in the rest of the paper. ActiveLearning selects the most informative instances using various sam-pling techniques such as MinMargin and LeastConfidence [25]. Wecompare Baseline with AL using RF as a classifier for this scenario.The analysis was done by adding a few training samples in everyiteration concurrently to classify the unlabeled instances.
ESEM ’20, October 8–9, 2020, Bari, Italy Gouri Deshpande and Guenther Ruhe
Active Learning (AL) is a ML method that guides a selection ofthe instances to be labeled by an oracle (e.g., human domain expertor a program) [25]. While this mechanism has been proven to posi-tively address the question, “Can machines learn with fewer labeledtraining instances if they are allowed to ask questions?”, throughthis exploration, we try to answer the question,“Can machines learnmore economically if they are allowed to ask questions?” [26].
4.3 DataThe online bug tracking system Bugzilla [20] is widely used inopen-source software development. New requirements are loggedinto these systems in the form issue reports [27] [4] which helpsoftware developers to track them for effective implementation [28],testing, and release planning. In Bugzilla, feature requests are aspecific type of issue that is typically tagged as “enhancement” [21].We retrieved these feature requests or requirements from Firefoxand exported all related fields such as Title, Type, Priority, Product,Depends_on, and See_also.
Data collection: Collecting data from Bugzilla was a substantialeffort that was carried out in multiple rounds. We collected 3,704enhancements from Firefox using REST API through a python scriptsuch that each one of the enhancements considered for retrieval isdependent on at least another one in the dataset. The data spannedfrom 08/05/2001 to 09/08/2019.
Data preparation: The complete data was analyzed to eliminatespecial characters and numbers. Then dependent requirement pairswere created based on the depends_on (interpreted as REQUIRESdependency) field information for each one of the enhancements.Requirements with no dependency between them were paired togenerate INDEPENDENT class dataset. Further, sentence pairs thathad fewer than three words in them were filtered out resulting in3,373 REQUIRES, 219 OTHER and 21,358 INDEPENDENT pairs.
Pre-processing and feature extraction: The data was firstprocessed to eliminate stop words and then lemmatized followingthe traditional NLP pipeline [1]. For supervised and ALML, we usedthe Bag Of Words (BOW) [22] feature extraction method, whichgroups textual elements as tokens. For applying BERT, we retainedsentence pairs in their original form (without stop word removaland lemmatization).
Classifiers: For both NB and RF, the data was split into train andtest (80:20) and balanced between classes. Also, hyper-parametertuning was performed and the results for 10-fold cross-validationwere computed, followed by testing (on unseen data).
To fine-tune the BERT model, we used NextSentencePrediction1,a sentence pair classification pre-trained BERT model, and furtherfine-tuned it for the RDA specific dataset on Tesla K80 GPU onGoogle Colab2.
4.4 ROI Modeling4.4.1 EAS1. The classification algorithms such as RF and NB, havebeen explored in NLP based SE problems. These algorithms aredriven by the feature extraction aspect to a great extent. Thus, couldinfluence their effectiveness on classification outcomes. However,
1https://huggingface.co/transformers/model_doc/bert.html#bertfornextsentenceprediction2https://colab.research.google.com/
feature extraction is problem specific and incurs substantial costand access to domain expertise.
On the other hand, BERT eliminates the need for feature extrac-tion since it is a language model based on deep learning. BERT,pre-trained on a large text corpus, can be fine-tuned on specifictasks by providing only a small amount of domain-specific data.
In this empirical analysis, we conducted classification by utilizinga fraction of the whole dataset for training and testing for a smallfixed data set. This was repeated by slowly increasing the fractionof the training set and results were captured.
During every classification, 𝐶𝑜𝑠𝑡 and 𝐵𝑒𝑛𝑒 𝑓 𝑖𝑡 were computedusing various parameters explained in Table 1. 𝐶𝑜𝑠𝑡 is the sum ofthe data processing costs ((𝐶𝑑𝑔 +𝐶𝑝𝑝 +𝐶𝑒 +𝐶𝑙 )/60) (in hours) fora fraction (N%) of training set. This is further translated into dollarcost based on hourly charges (𝐶𝑟𝑒𝑠𝑜𝑢𝑟𝑐𝑒 ) of 𝐻 human resources.
𝐶𝑜𝑠𝑡 = 𝑁% ∗(𝐶𝑑𝑔 +𝐶𝑝𝑝 +𝐶𝑒 +𝐶𝑙 )
60∗ 𝐻 ∗𝐶𝑟𝑒𝑠𝑜𝑢𝑟𝑐𝑒 (2)
𝑅𝑒𝑡𝑢𝑟𝑛 computations for RDA, assumes reward (𝐵𝑟𝑒𝑤𝑎𝑟𝑑 ) for identi-fying the dependent requirements (TP) while penalizing (𝐵𝑝𝑒𝑛𝑎𝑙𝑡𝑦 )instances that were falsely identified as independent (FN).
𝐵𝑒𝑛𝑒 𝑓 𝑖𝑡 = 𝑇𝑃 ∗ 𝐵𝑟𝑒𝑤𝑎𝑟𝑑 − 𝐹𝑁 ∗ 𝐵𝑝𝑒𝑛𝑎𝑙𝑡𝑦 (3)
Table 2: Parameter settings for the two empirical analysis scenarios
Parameters Values𝐶𝑓 𝑖𝑥𝑒𝑑 = 𝐶𝑑𝑔 +𝐶𝑝𝑝 +𝐶𝑒 1 min/sample𝐶𝑙 0.5 min/sample𝐶𝑟𝑒𝑠𝑜𝑢𝑟𝑐𝑒 $400/hr𝐻 1𝑁 4,586𝐵𝑟𝑒𝑤𝑎𝑟𝑑 $500/TP𝐵𝑝𝑒𝑛𝑎𝑙𝑡𝑦 $500/FN𝐵𝐹1𝑖𝑡𝑒𝑟𝑎𝑡𝑖𝑜𝑛 =𝐹𝑐𝑢𝑟 − 𝐹𝑝𝑟𝑒𝑣
𝑃𝑉𝑎𝑙𝑢𝑒 $10,000 per percent F1improvement
4.4.2 EAS 2. In this empirical analysis, we compared AL with atraditional random sampling based classification- Baseline - usingthe RF ML algorithm.
Beginning with 60 training samples of each class (REQUIRES,INDEPENDENT and OTHER), we developed multi-class classifiersfor both AL and Baseline for this empirical study scenario. WhenAL used MinMargin sampling technique3 to identify 204 most un-certain instance (requirement pair) for oracle to label, baselinerandomly selected 20 instances and added to the training set alongwith their label, thus, kept the two approaches comparable in allthe 20 iterations. Since data is already labeled, for AL, we pretendthey are unlabeled until queried and labeled by a simulated oraclein this scenario.
3MinMargin sampling technique performed well compared to Least Confidence andEntropy thus, we utilized MinMargin for this study4The tests were performed with#samples = 10, 15 and 20. In this study, we will discussresults related to #samples=20
Beyond Accuracy: ROI-driven Data Analytics of Empirical Data ESEM ’20, October 8–9, 2020, Bari, Italy
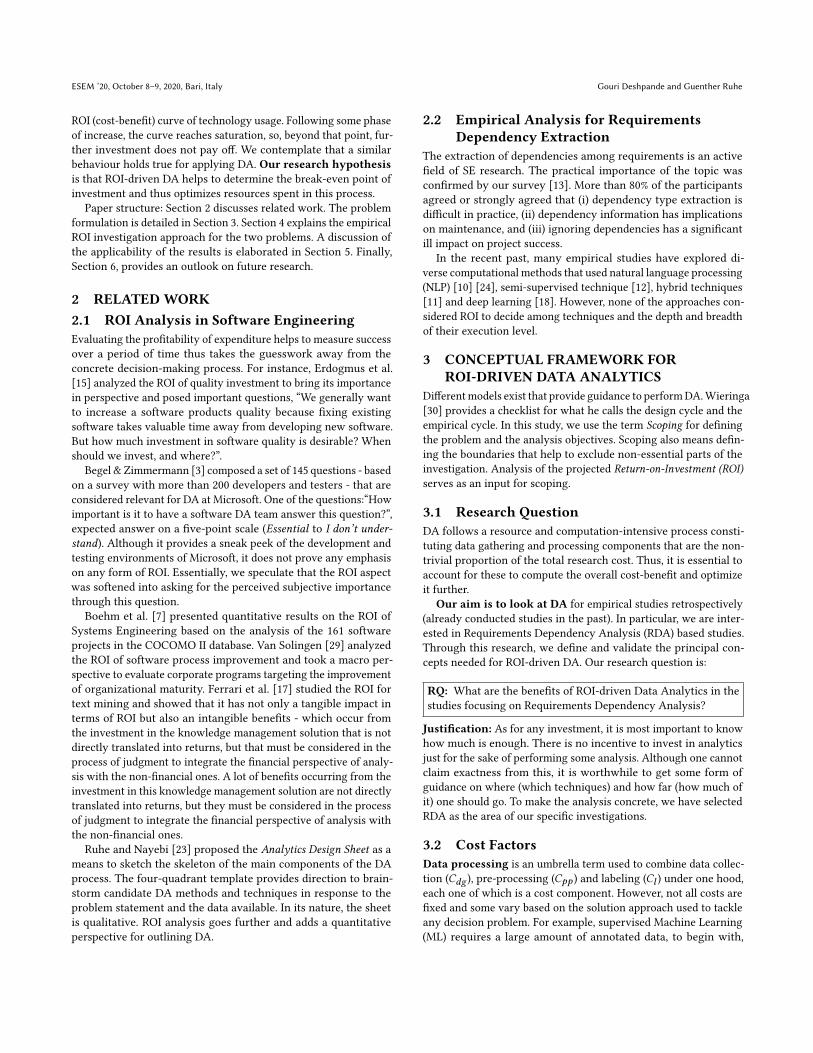
Figure 2: F1 score plot for NB, RF and BERT trained over increasingtraining set size, F1 improves, but plateaus beyond a certain point
The 𝐶𝑜𝑠𝑡 is determined by first computing the sum of total pro-cessing time in person hours (= 𝐶𝑜𝑠𝑡 ) taken for data processing(𝐶𝑓 𝑖𝑥𝑒𝑑 = 𝐶𝑑𝑔 +𝐶𝑝𝑝 +𝐶𝑒 )), labeling (𝐶𝑙 ) of train set (𝑁𝑡𝑟𝑎𝑖𝑛) anddata processing cost (𝐶𝑓 𝑖𝑥𝑒𝑑 ) for testing. This is further translatedinto dollar cost (=𝐶𝑡𝑜𝑡𝑎𝑙 ) based on hourly charges (𝐶𝑟𝑒𝑠𝑜𝑢𝑟𝑐𝑒 ) of 𝐻human resources.
𝐶𝑜𝑠𝑡 =𝑁𝑡𝑟𝑎𝑖𝑛 ∗ (𝐶𝑓 𝑖𝑥𝑒𝑑 +𝐶𝑙 ) + 𝑁𝑡𝑒𝑠𝑡 ∗𝐶𝑓 𝑖𝑥𝑒𝑑
60𝐶𝑡𝑜𝑡𝑎𝑙 = 𝐶𝑜𝑠𝑡 ∗ 𝐻 ∗𝐶𝑟𝑒𝑠𝑜𝑢𝑟𝑐𝑒 (4)
Likewise, 𝐵𝑒𝑛𝑒 𝑓 𝑖𝑡 is defined as the monetary value associatedwith a 1% improvement in F1 score (𝐵𝐹1𝑖𝑡𝑒𝑟𝑎𝑡𝑖𝑜𝑛) between subse-quent iterations.
𝐵𝑒𝑛𝑒 𝑓 𝑖𝑡 = 𝐵𝐹1𝑖𝑡𝑒𝑟𝑎𝑡𝑖𝑜𝑛 ∗ 𝑃𝑉𝑎𝑙𝑢𝑒 (5)
5 RESULTSIn the real-world, cost and benefit values are hard to get and areuncertain. All the results presented in this section are based on theparameter settings given in Table 2. The settings reflect practicalexperience but are not taken from a specific data collection proce-dure. We claim that the principal arguments made in our paper areindependent of these settings.
5.1 EAS 1
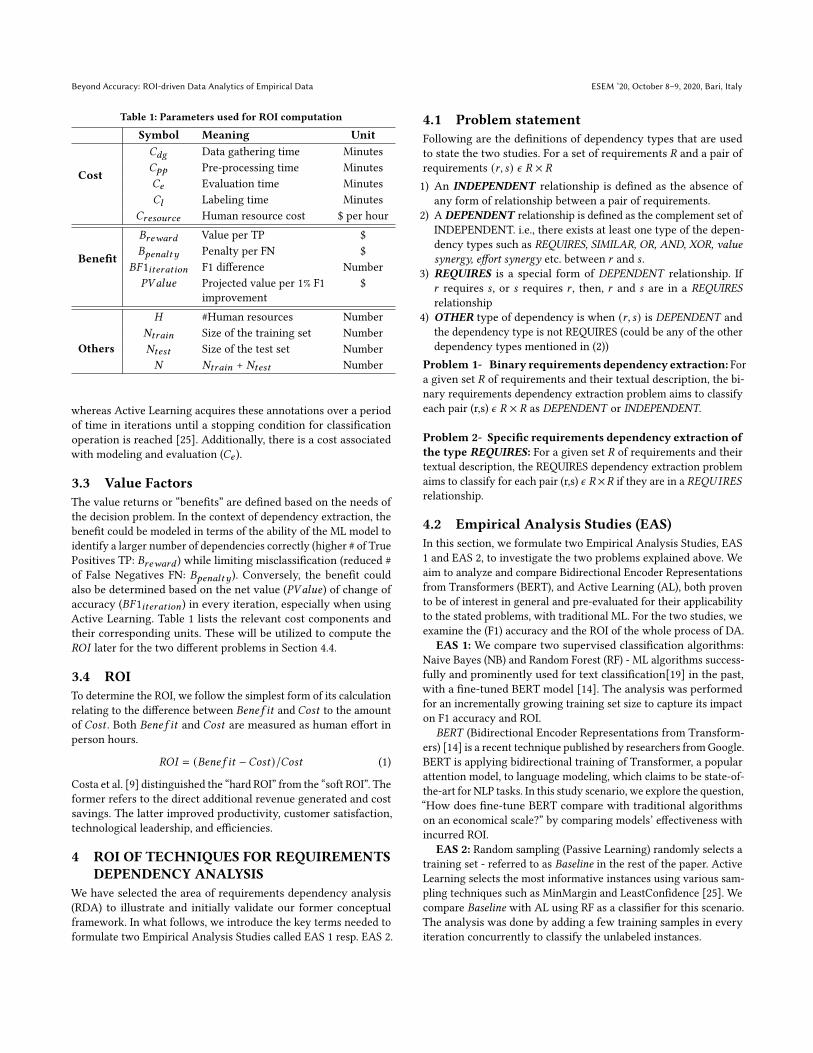
(a) F1 vs ROI for Random Forest (b) F1 vs ROI for Fine tuned BERT
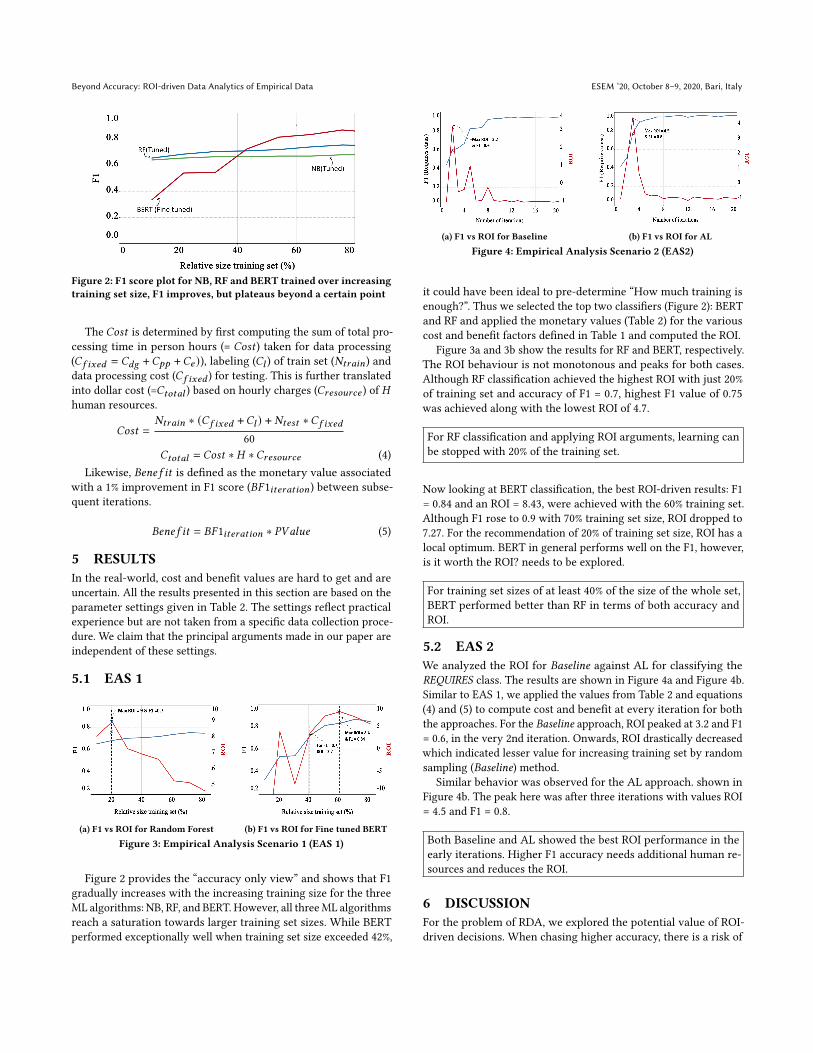
Figure 3: Empirical Analysis Scenario 1 (EAS 1)
Figure 2 provides the “accuracy only view” and shows that F1gradually increases with the increasing training size for the threeML algorithms: NB, RF, and BERT. However, all threeML algorithmsreach a saturation towards larger training set sizes. While BERTperformed exceptionally well when training set size exceeded 42%,
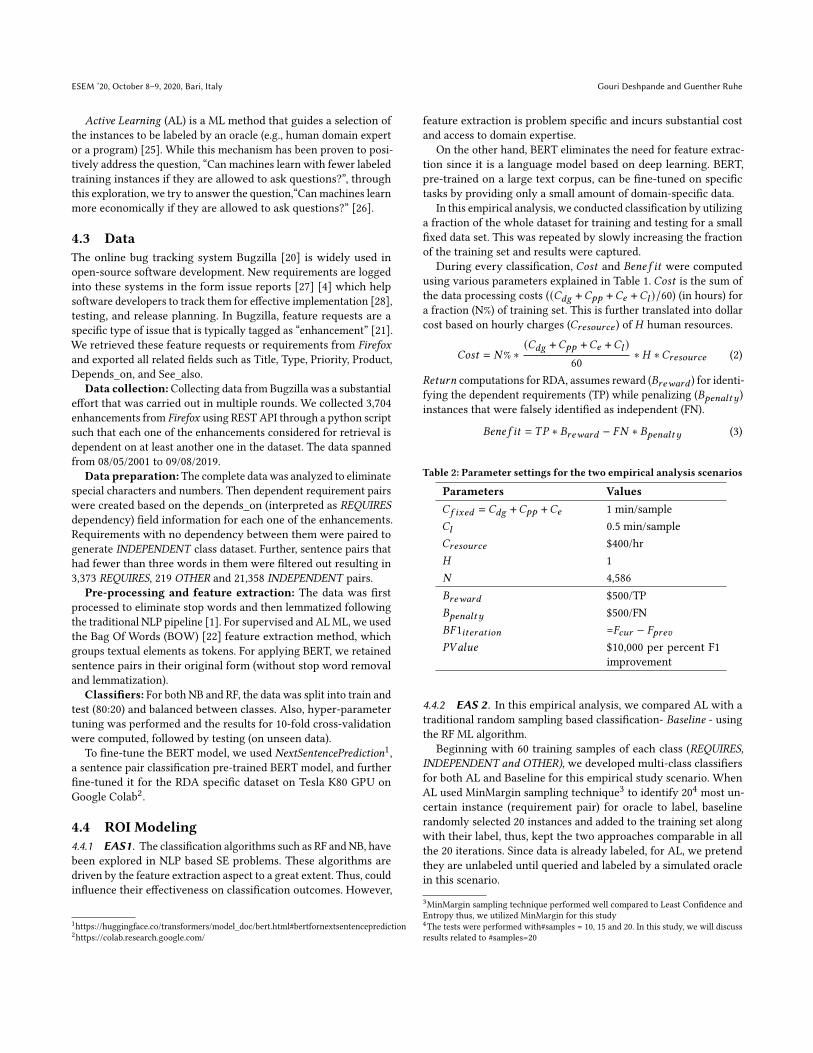
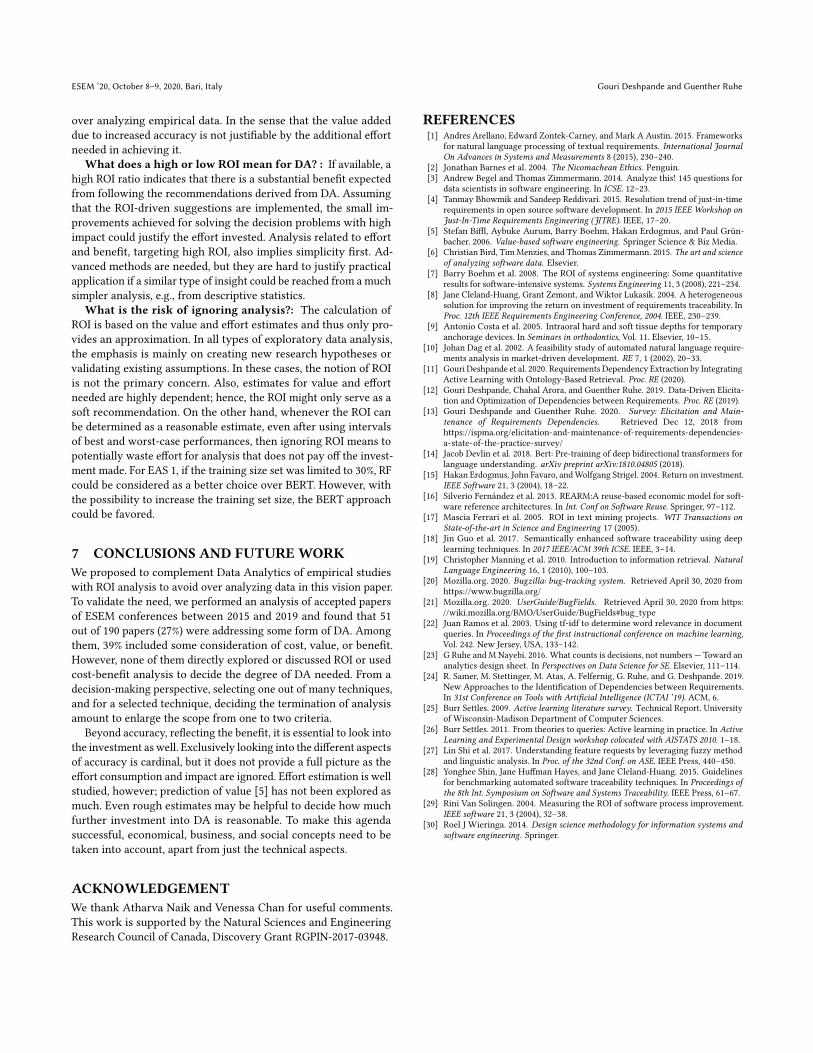
(a) F1 vs ROI for Baseline (b) F1 vs ROI for AL
Figure 4: Empirical Analysis Scenario 2 (EAS2)
it could have been ideal to pre-determine “How much training isenough?”. Thus we selected the top two classifiers (Figure 2): BERTand RF and applied the monetary values (Table 2) for the variouscost and benefit factors defined in Table 1 and computed the ROI.
Figure 3a and 3b show the results for RF and BERT, respectively.The ROI behaviour is not monotonous and peaks for both cases.Although RF classification achieved the highest ROI with just 20%of training set and accuracy of F1 = 0.7, highest F1 value of 0.75was achieved along with the lowest ROI of 4.7.
For RF classification and applying ROI arguments, learning canbe stopped with 20% of the training set.
Now looking at BERT classification, the best ROI-driven results: F1= 0.84 and an ROI = 8.43, were achieved with the 60% training set.Although F1 rose to 0.9 with 70% training set size, ROI dropped to7.27. For the recommendation of 20% of training set size, ROI has alocal optimum. BERT in general performs well on the F1, however,is it worth the ROI? needs to be explored.
For training set sizes of at least 40% of the size of the whole set,BERT performed better than RF in terms of both accuracy andROI.
5.2 EAS 2We analyzed the ROI for Baseline against AL for classifying theREQUIRES class. The results are shown in Figure 4a and Figure 4b.Similar to EAS 1, we applied the values from Table 2 and equations(4) and (5) to compute cost and benefit at every iteration for boththe approaches. For the Baseline approach, ROI peaked at 3.2 and F1= 0.6, in the very 2nd iteration. Onwards, ROI drastically decreasedwhich indicated lesser value for increasing training set by randomsampling (Baseline) method.
Similar behavior was observed for the AL approach. shown inFigure 4b. The peak here was after three iterations with values ROI= 4.5 and F1 = 0.8.
Both Baseline and AL showed the best ROI performance in theearly iterations. Higher F1 accuracy needs additional human re-sources and reduces the ROI.
6 DISCUSSIONFor the problem of RDA, we explored the potential value of ROI-driven decisions. When chasing higher accuracy, there is a risk of
ESEM ’20, October 8–9, 2020, Bari, Italy Gouri Deshpande and Guenther Ruhe
over analyzing empirical data. In the sense that the value addeddue to increased accuracy is not justifiable by the additional effortneeded in achieving it.
What does a high or low ROI mean for DA? : If available, ahigh ROI ratio indicates that there is a substantial benefit expectedfrom following the recommendations derived from DA. Assumingthat the ROI-driven suggestions are implemented, the small im-provements achieved for solving the decision problems with highimpact could justify the effort invested. Analysis related to effortand benefit, targeting high ROI, also implies simplicity first. Ad-vanced methods are needed, but they are hard to justify practicalapplication if a similar type of insight could be reached from a muchsimpler analysis, e.g., from descriptive statistics.
What is the risk of ignoring analysis?: The calculation ofROI is based on the value and effort estimates and thus only pro-vides an approximation. In all types of exploratory data analysis,the emphasis is mainly on creating new research hypotheses orvalidating existing assumptions. In these cases, the notion of ROIis not the primary concern. Also, estimates for value and effortneeded are highly dependent; hence, the ROI might only serve as asoft recommendation. On the other hand, whenever the ROI canbe determined as a reasonable estimate, even after using intervalsof best and worst-case performances, then ignoring ROI means topotentially waste effort for analysis that does not pay off the invest-ment made. For EAS 1, if the training size set was limited to 30%, RFcould be considered as a better choice over BERT. However, withthe possibility to increase the training set size, the BERT approachcould be favored.
7 CONCLUSIONS AND FUTUREWORKWe proposed to complement Data Analytics of empirical studieswith ROI analysis to avoid over analyzing data in this vision paper.To validate the need, we performed an analysis of accepted papersof ESEM conferences between 2015 and 2019 and found that 51out of 190 papers (27%) were addressing some form of DA. Amongthem, 39% included some consideration of cost, value, or benefit.However, none of them directly explored or discussed ROI or usedcost-benefit analysis to decide the degree of DA needed. From adecision-making perspective, selecting one out of many techniques,and for a selected technique, deciding the termination of analysisamount to enlarge the scope from one to two criteria.
Beyond accuracy, reflecting the benefit, it is essential to look intothe investment as well. Exclusively looking into the different aspectsof accuracy is cardinal, but it does not provide a full picture as theeffort consumption and impact are ignored. Effort estimation is wellstudied, however; prediction of value [5] has not been explored asmuch. Even rough estimates may be helpful to decide how muchfurther investment into DA is reasonable. To make this agendasuccessful, economical, business, and social concepts need to betaken into account, apart from just the technical aspects.
ACKNOWLEDGEMENTWe thank Atharva Naik and Venessa Chan for useful comments.This work is supported by the Natural Sciences and EngineeringResearch Council of Canada, Discovery Grant RGPIN-2017-03948.
REFERENCES[1] Andres Arellano, Edward Zontek-Carney, and Mark A Austin. 2015. Frameworks
for natural language processing of textual requirements. International JournalOn Advances in Systems and Measurements 8 (2015), 230–240.
[2] Jonathan Barnes et al. 2004. The Nicomachean Ethics. Penguin.[3] Andrew Begel and Thomas Zimmermann. 2014. Analyze this! 145 questions for
data scientists in software engineering. In ICSE. 12–23.[4] Tanmay Bhowmik and Sandeep Reddivari. 2015. Resolution trend of just-in-time
requirements in open source software development. In 2015 IEEE Workshop onJust-In-Time Requirements Engineering (JITRE). IEEE, 17–20.
[5] Stefan Biffl, Aybuke Aurum, Barry Boehm, Hakan Erdogmus, and Paul Grün-bacher. 2006. Value-based software engineering. Springer Science & Biz Media.
[6] Christian Bird, TimMenzies, and Thomas Zimmermann. 2015. The art and scienceof analyzing software data. Elsevier.
[7] Barry Boehm et al. 2008. The ROI of systems engineering: Some quantitativeresults for software-intensive systems. Systems Engineering 11, 3 (2008), 221–234.
[8] Jane Cleland-Huang, Grant Zemont, and Wiktor Lukasik. 2004. A heterogeneoussolution for improving the return on investment of requirements traceability. InProc. 12th IEEE Requirements Engineering Conference, 2004. IEEE, 230–239.
[9] Antonio Costa et al. 2005. Intraoral hard and soft tissue depths for temporaryanchorage devices. In Seminars in orthodontics, Vol. 11. Elsevier, 10–15.
[10] Johan Dag et al. 2002. A feasibility study of automated natural language require-ments analysis in market-driven development. RE 7, 1 (2002), 20–33.
[11] Gouri Deshpande et al. 2020. Requirements Dependency Extraction by IntegratingActive Learning with Ontology-Based Retrieval. Proc. RE (2020).
[12] Gouri Deshpande, Chahal Arora, and Guenther Ruhe. 2019. Data-Driven Elicita-tion and Optimization of Dependencies between Requirements. Proc. RE (2019).
[13] Gouri Deshpande and Guenther Ruhe. 2020. Survey: Elicitation and Main-tenance of Requirements Dependencies. Retrieved Dec 12, 2018 fromhttps://ispma.org/elicitation-and-maintenance-of-requirements-dependencies-a-state-of-the-practice-survey/
[14] Jacob Devlin et al. 2018. Bert: Pre-training of deep bidirectional transformers forlanguage understanding. arXiv preprint arXiv:1810.04805 (2018).
[15] Hakan Erdogmus, John Favaro, andWolfgang Strigel. 2004. Return on investment.IEEE Software 21, 3 (2004), 18–22.
[16] Silverio Fernández et al. 2013. REARM:A reuse-based economic model for soft-ware reference architectures. In Int. Conf on Software Reuse. Springer, 97–112.
[17] Mascia Ferrari et al. 2005. ROI in text mining projects. WIT Transactions onState-of-the-art in Science and Engineering 17 (2005).
[18] Jin Guo et al. 2017. Semantically enhanced software traceability using deeplearning techniques. In 2017 IEEE/ACM 39th ICSE. IEEE, 3–14.
[19] Christopher Manning et al. 2010. Introduction to information retrieval. NaturalLanguage Engineering 16, 1 (2010), 100–103.
[20] Mozilla.org. 2020. Bugzilla: bug-tracking system. Retrieved April 30, 2020 fromhttps://www.bugzilla.org/
[21] Mozilla.org. 2020. UserGuide/BugFields. Retrieved April 30, 2020 from https://wiki.mozilla.org/BMO/UserGuide/BugFields#bug_type
[22] Juan Ramos et al. 2003. Using tf-idf to determine word relevance in documentqueries. In Proceedings of the first instructional conference on machine learning,Vol. 242. New Jersey, USA, 133–142.
[23] G Ruhe and M Nayebi. 2016. What counts is decisions, not numbers — Toward ananalytics design sheet. In Perspectives on Data Science for SE. Elsevier, 111–114.
[24] R. Samer, M. Stettinger, M. Atas, A. Felfernig, G. Ruhe, and G. Deshpande. 2019.New Approaches to the Identification of Dependencies between Requirements.In 31st Conference on Tools with Artificial Intelligence (ICTAI ’19). ACM, 6.
[25] Burr Settles. 2009. Active learning literature survey. Technical Report. Universityof Wisconsin-Madison Department of Computer Sciences.
[26] Burr Settles. 2011. From theories to queries: Active learning in practice. In ActiveLearning and Experimental Design workshop colocated with AISTATS 2010. 1–18.
[27] Lin Shi et al. 2017. Understanding feature requests by leveraging fuzzy methodand linguistic analysis. In Proc. of the 32nd Conf. on ASE. IEEE Press, 440–450.
[28] Yonghee Shin, Jane Huffman Hayes, and Jane Cleland-Huang. 2015. Guidelinesfor benchmarking automated software traceability techniques. In Proceedings ofthe 8th Int. Symposium on Software and Systems Traceability. IEEE Press, 61–67.
[29] Rini Van Solingen. 2004. Measuring the ROI of software process improvement.IEEE software 21, 3 (2004), 32–38.
[30] Roel J Wieringa. 2014. Design science methodology for information systems andsoftware engineering. Springer.